
The Modified Normalized Urban Area Composite Index: A Satelliate-Derived High-Resolution Index for Extracting Urban Areas


Abstract
:1. Introduction
2. Study Sites and Data Sources
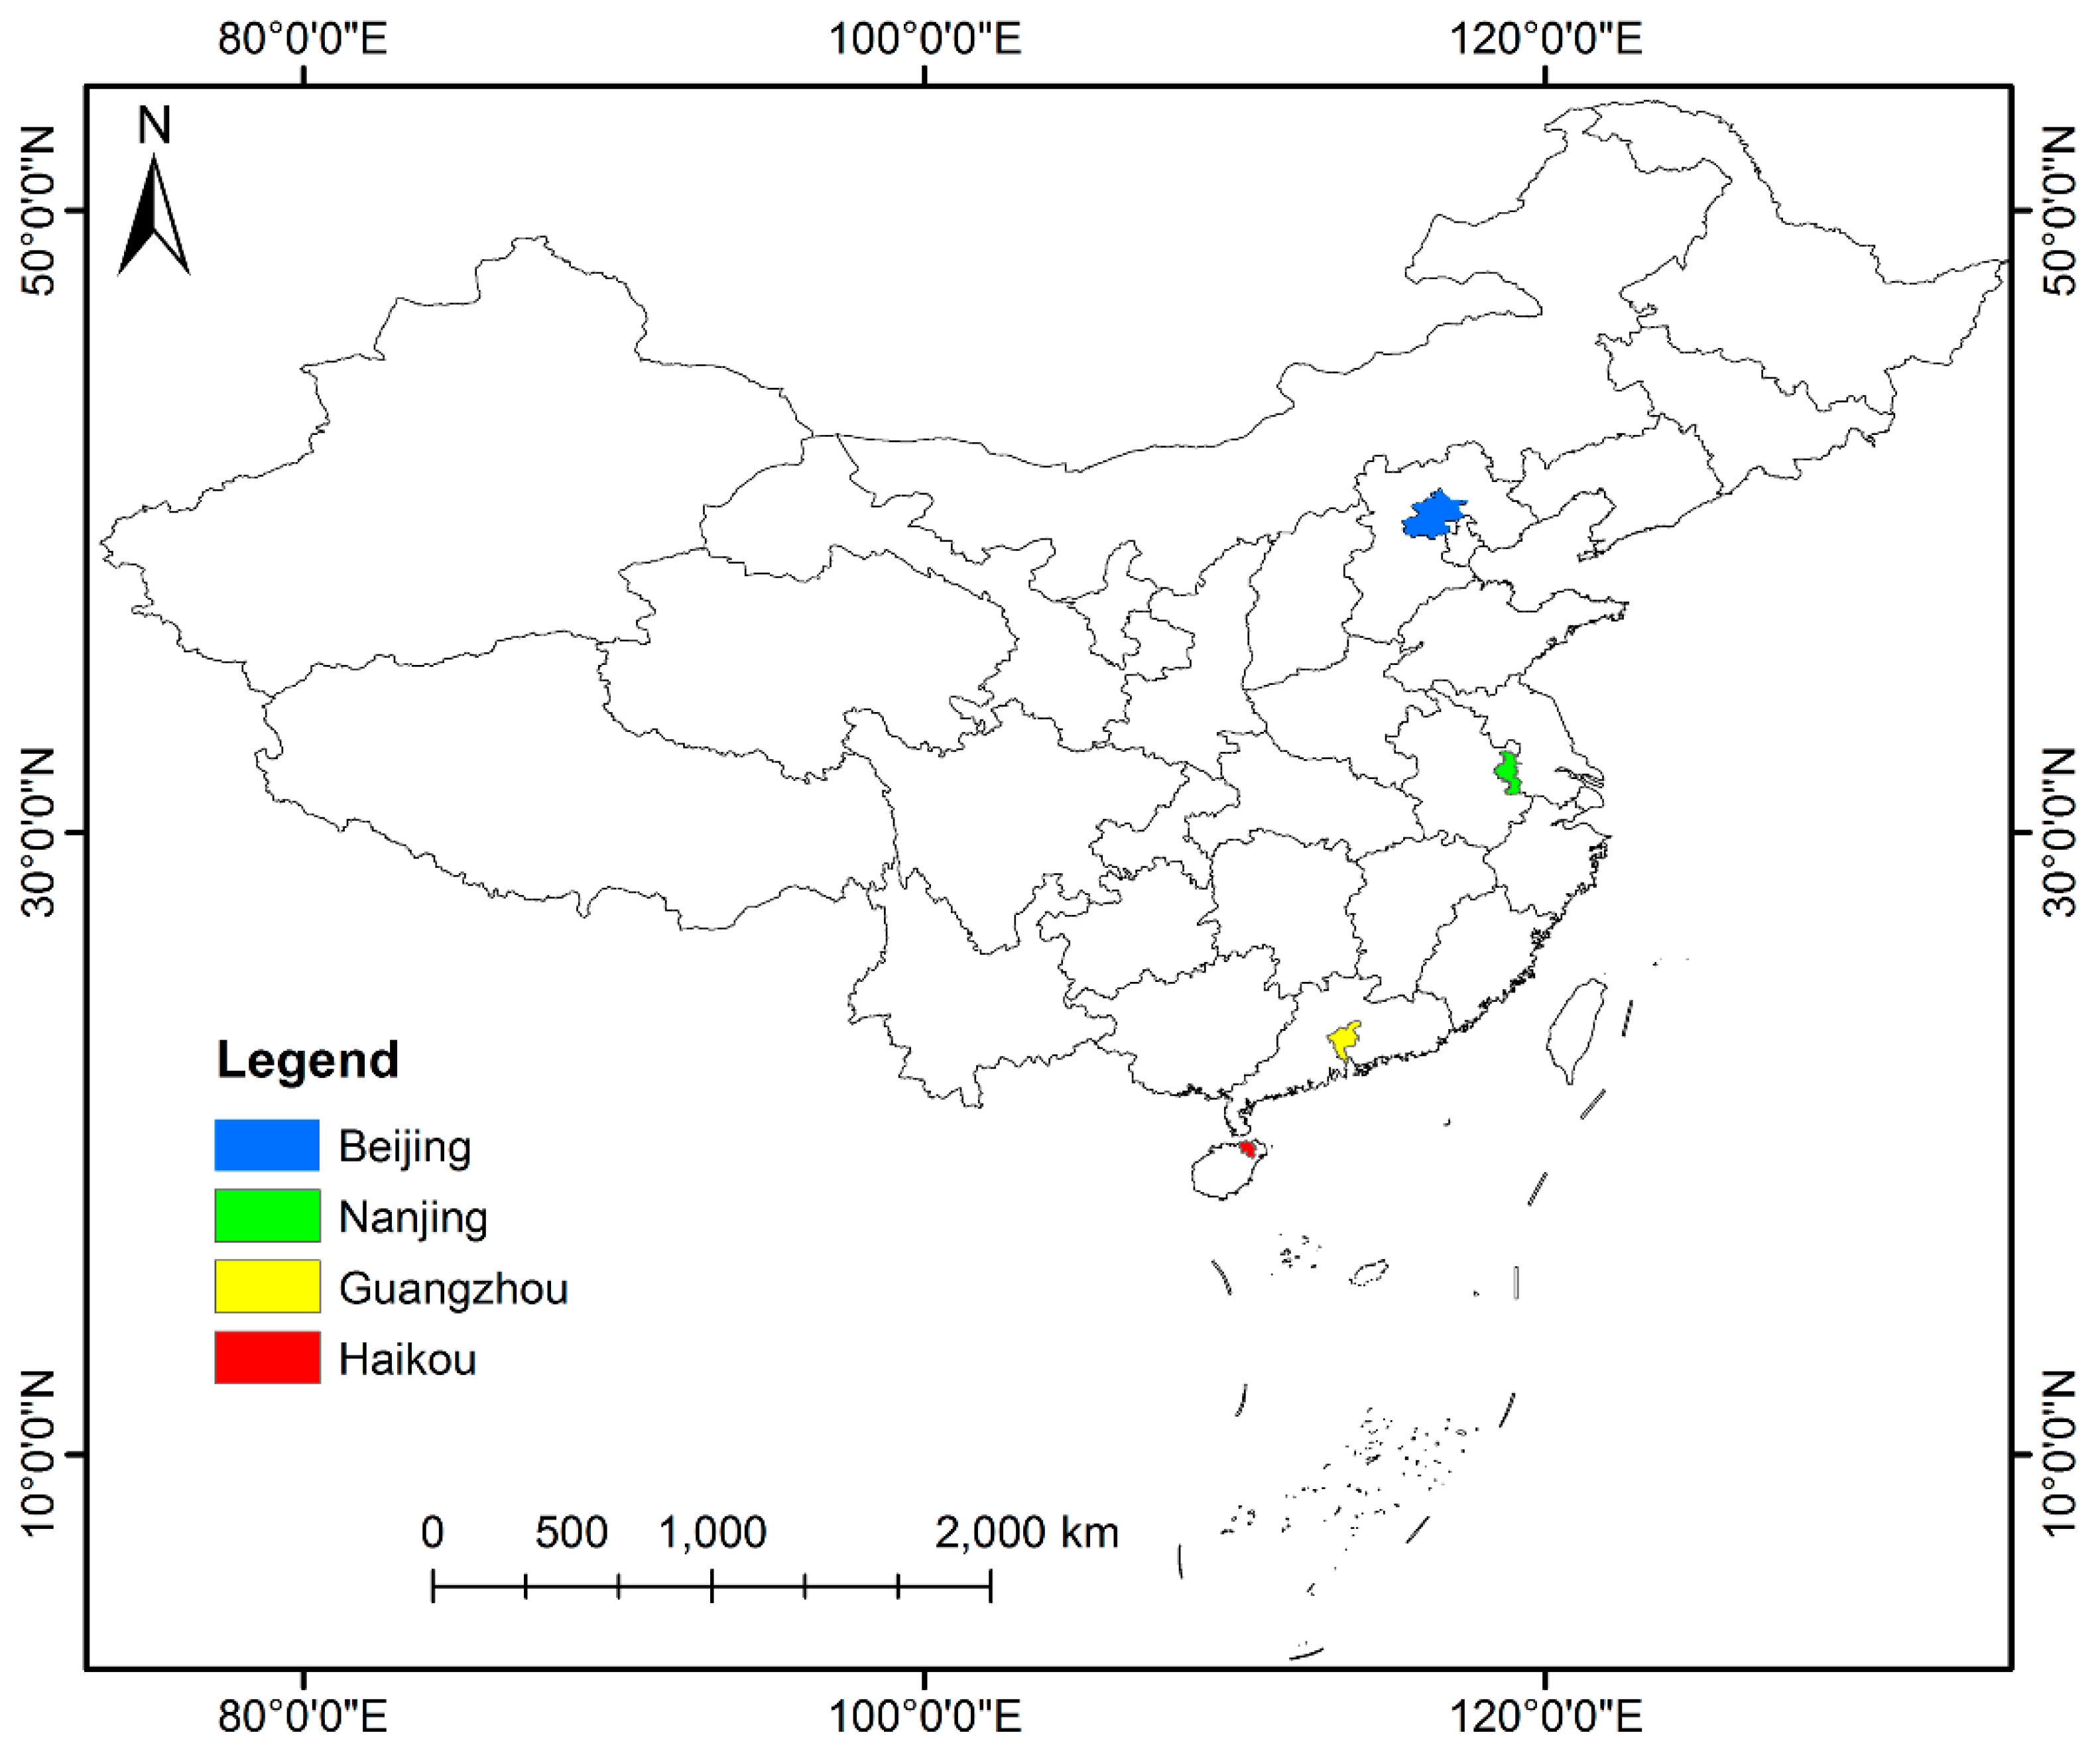
2.1. Study Sites
2.2. Data Sources
3. Methodology
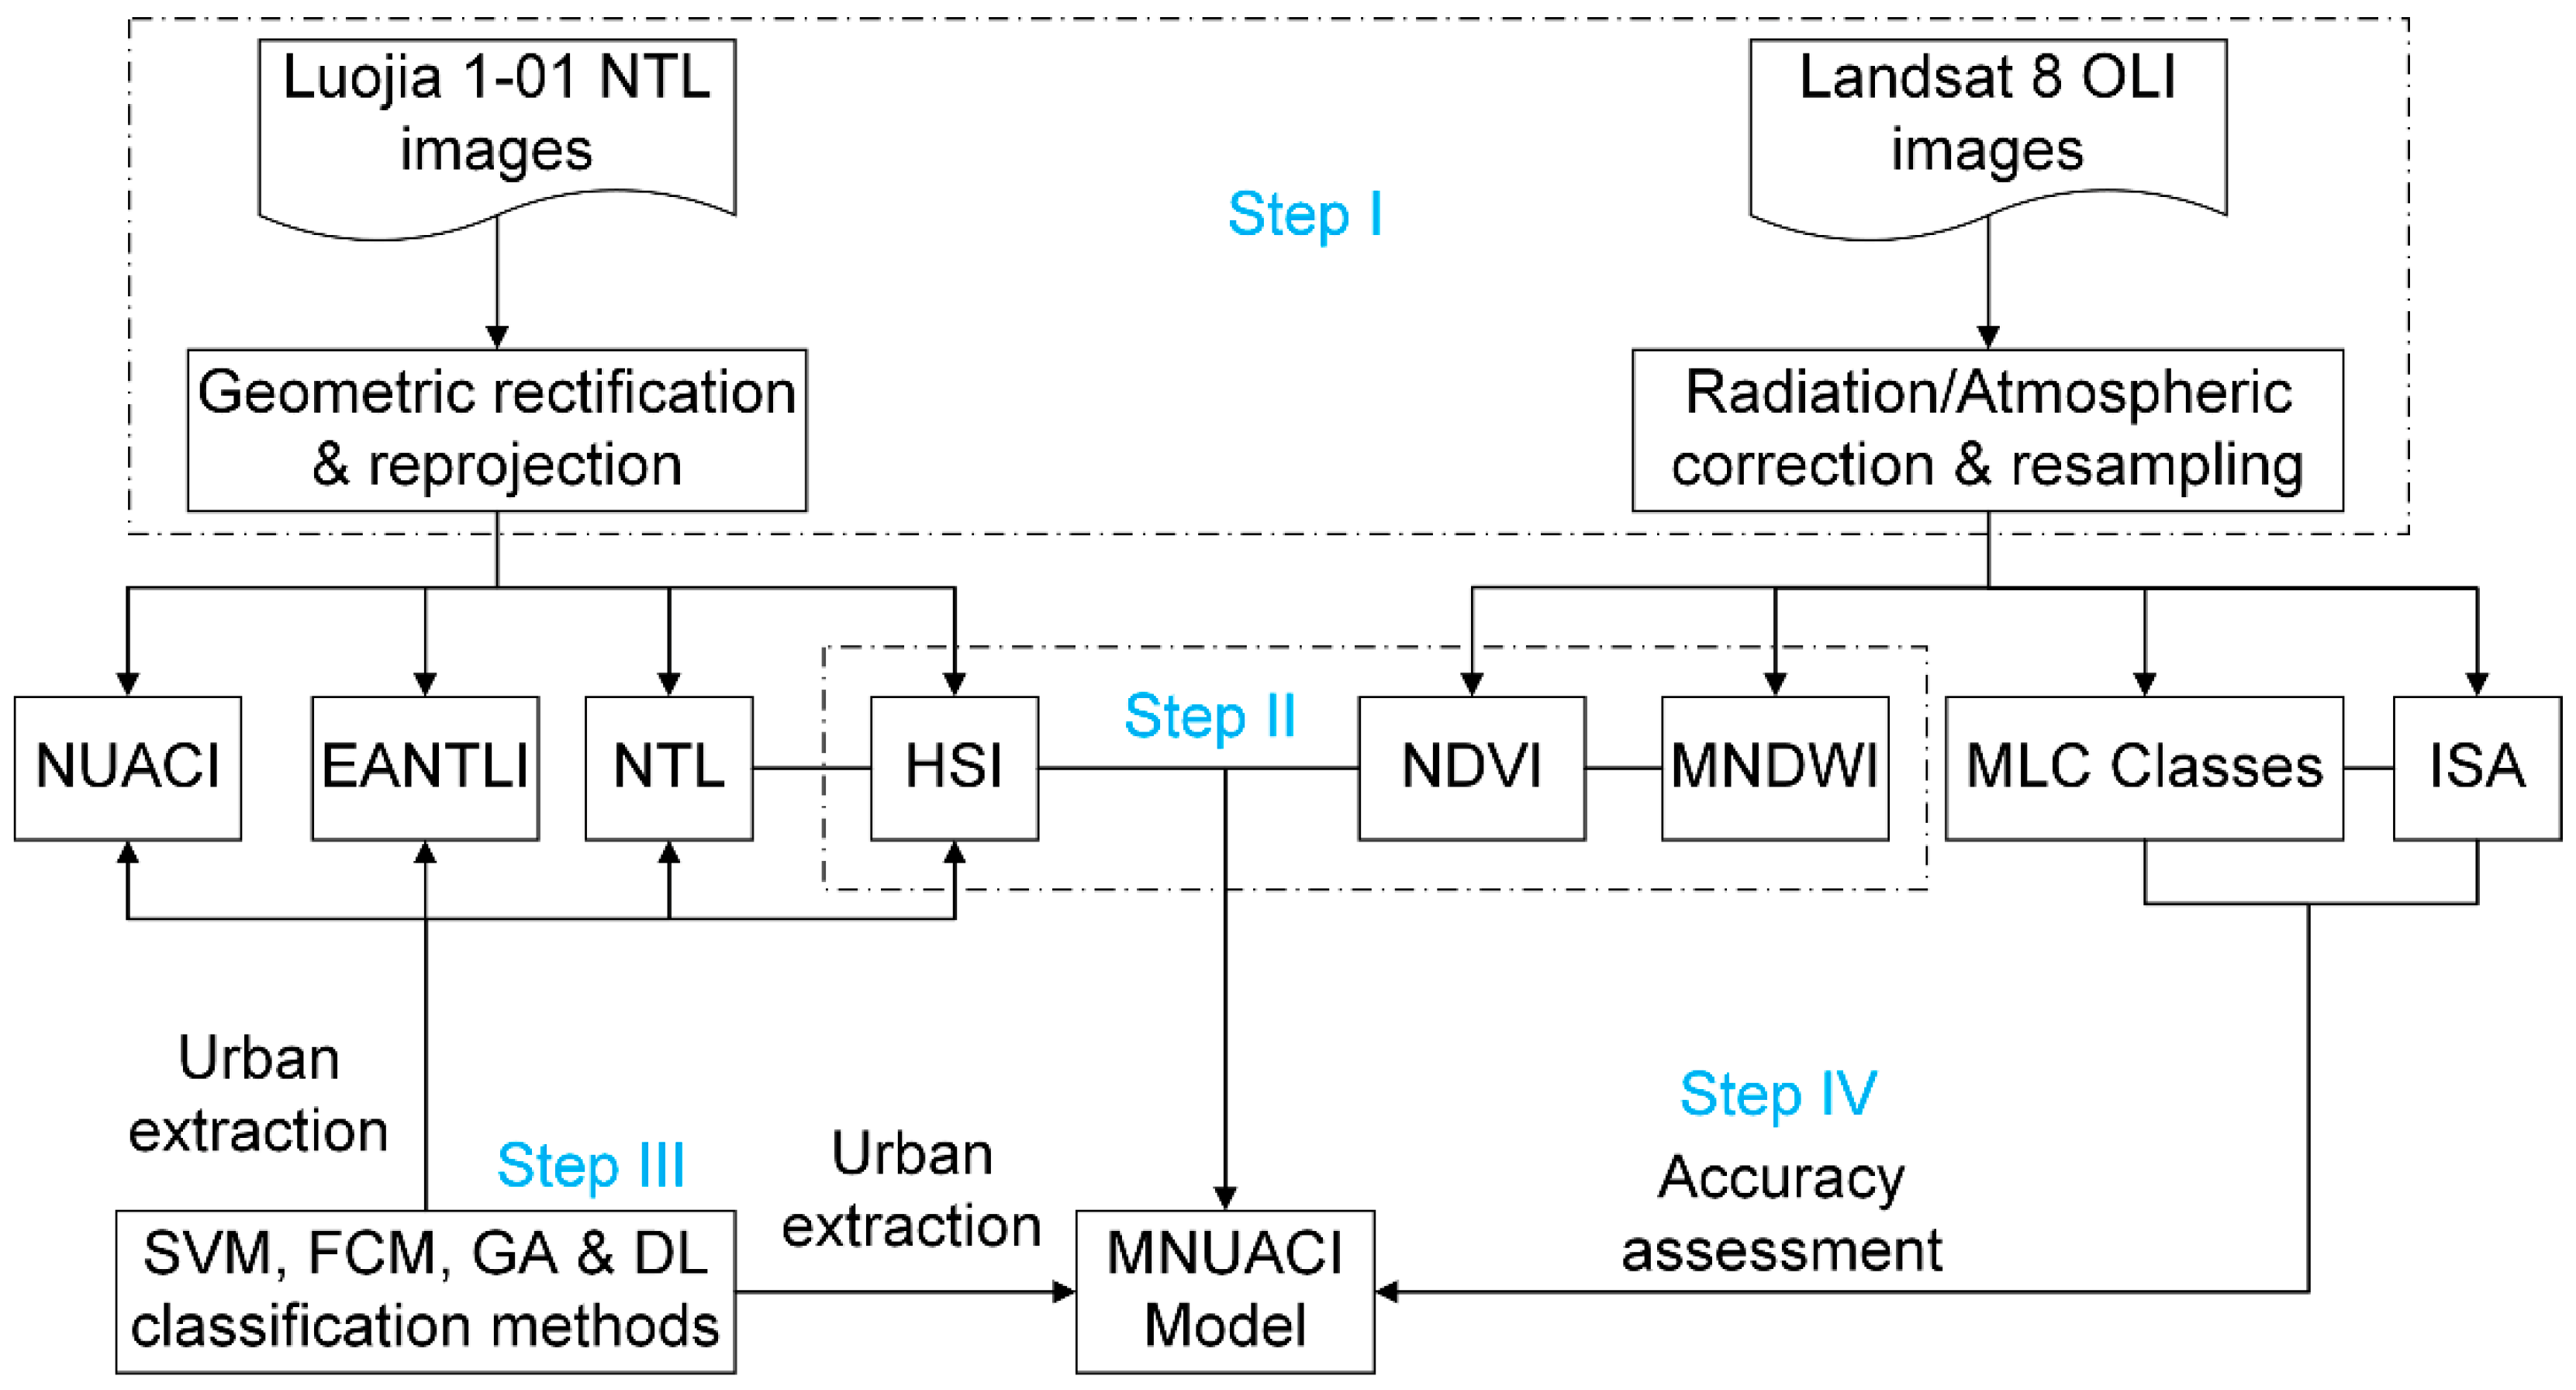
3.1. Data Preprocessing
3.2. Modified Normalized Urban Area Composite Index (MNUACI)
3.3. Accuracy Analysis Methods
3.4. Estimation of Urban Impermeable Surface
4. Results
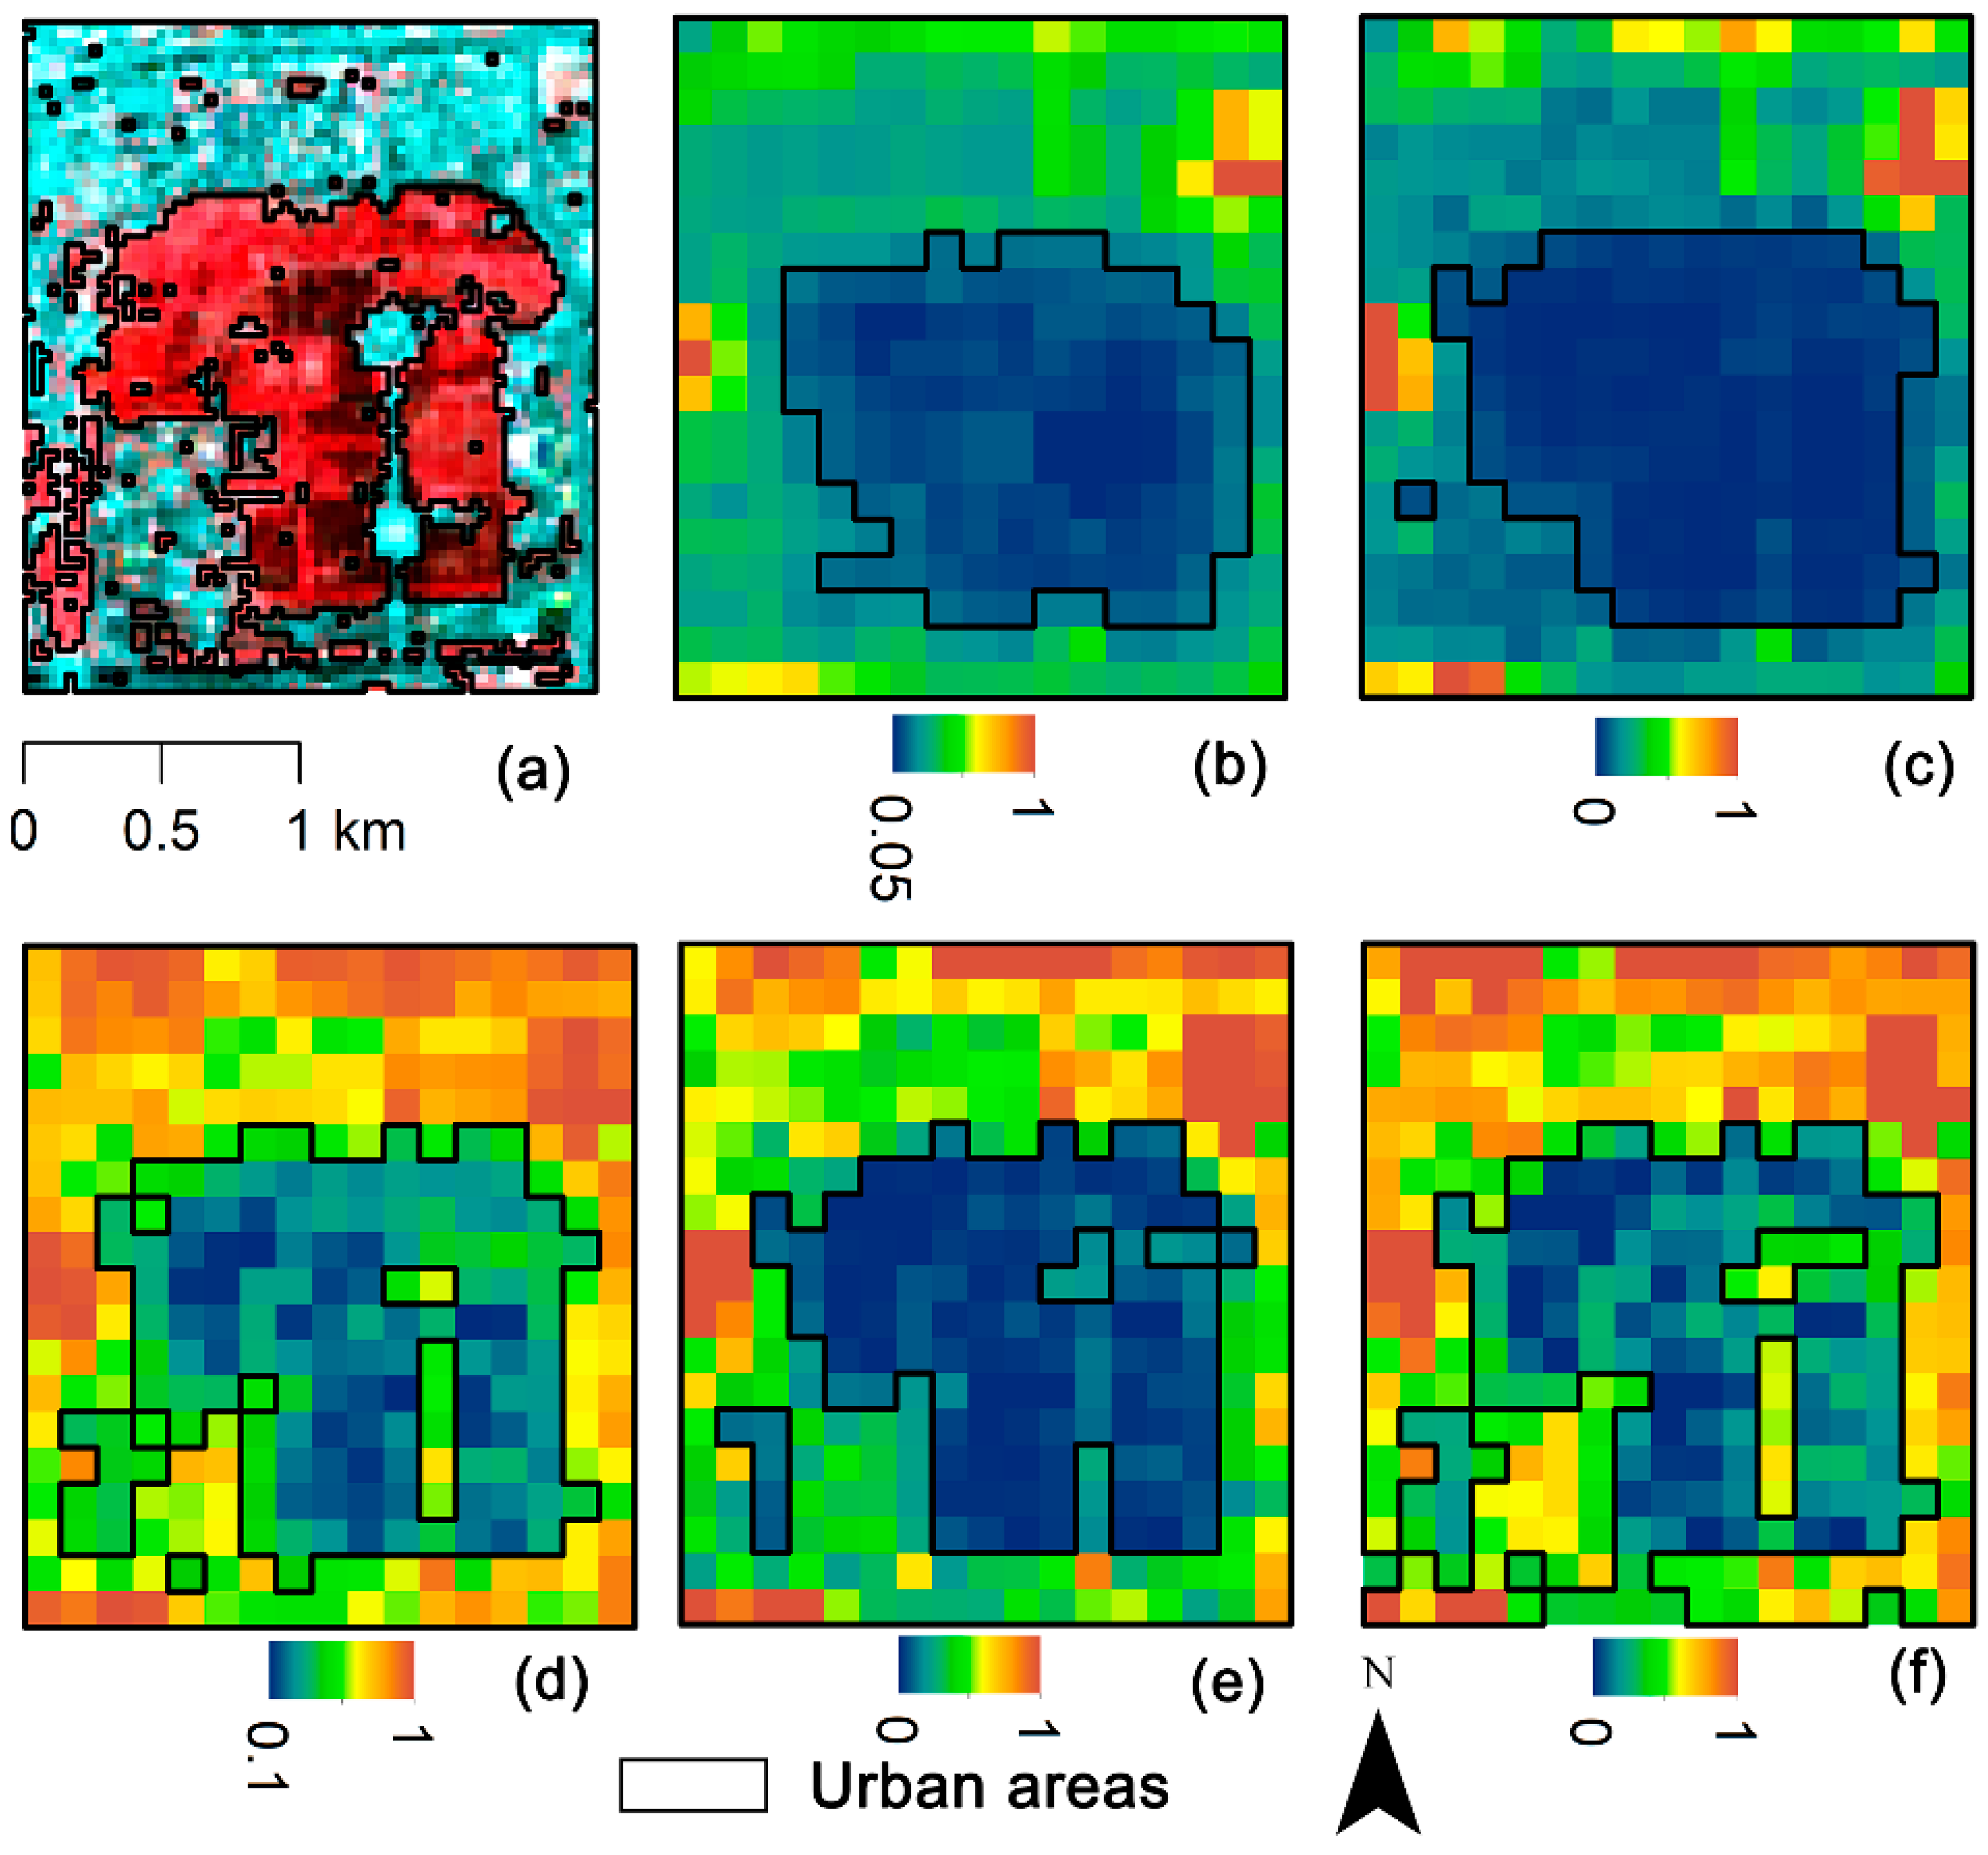
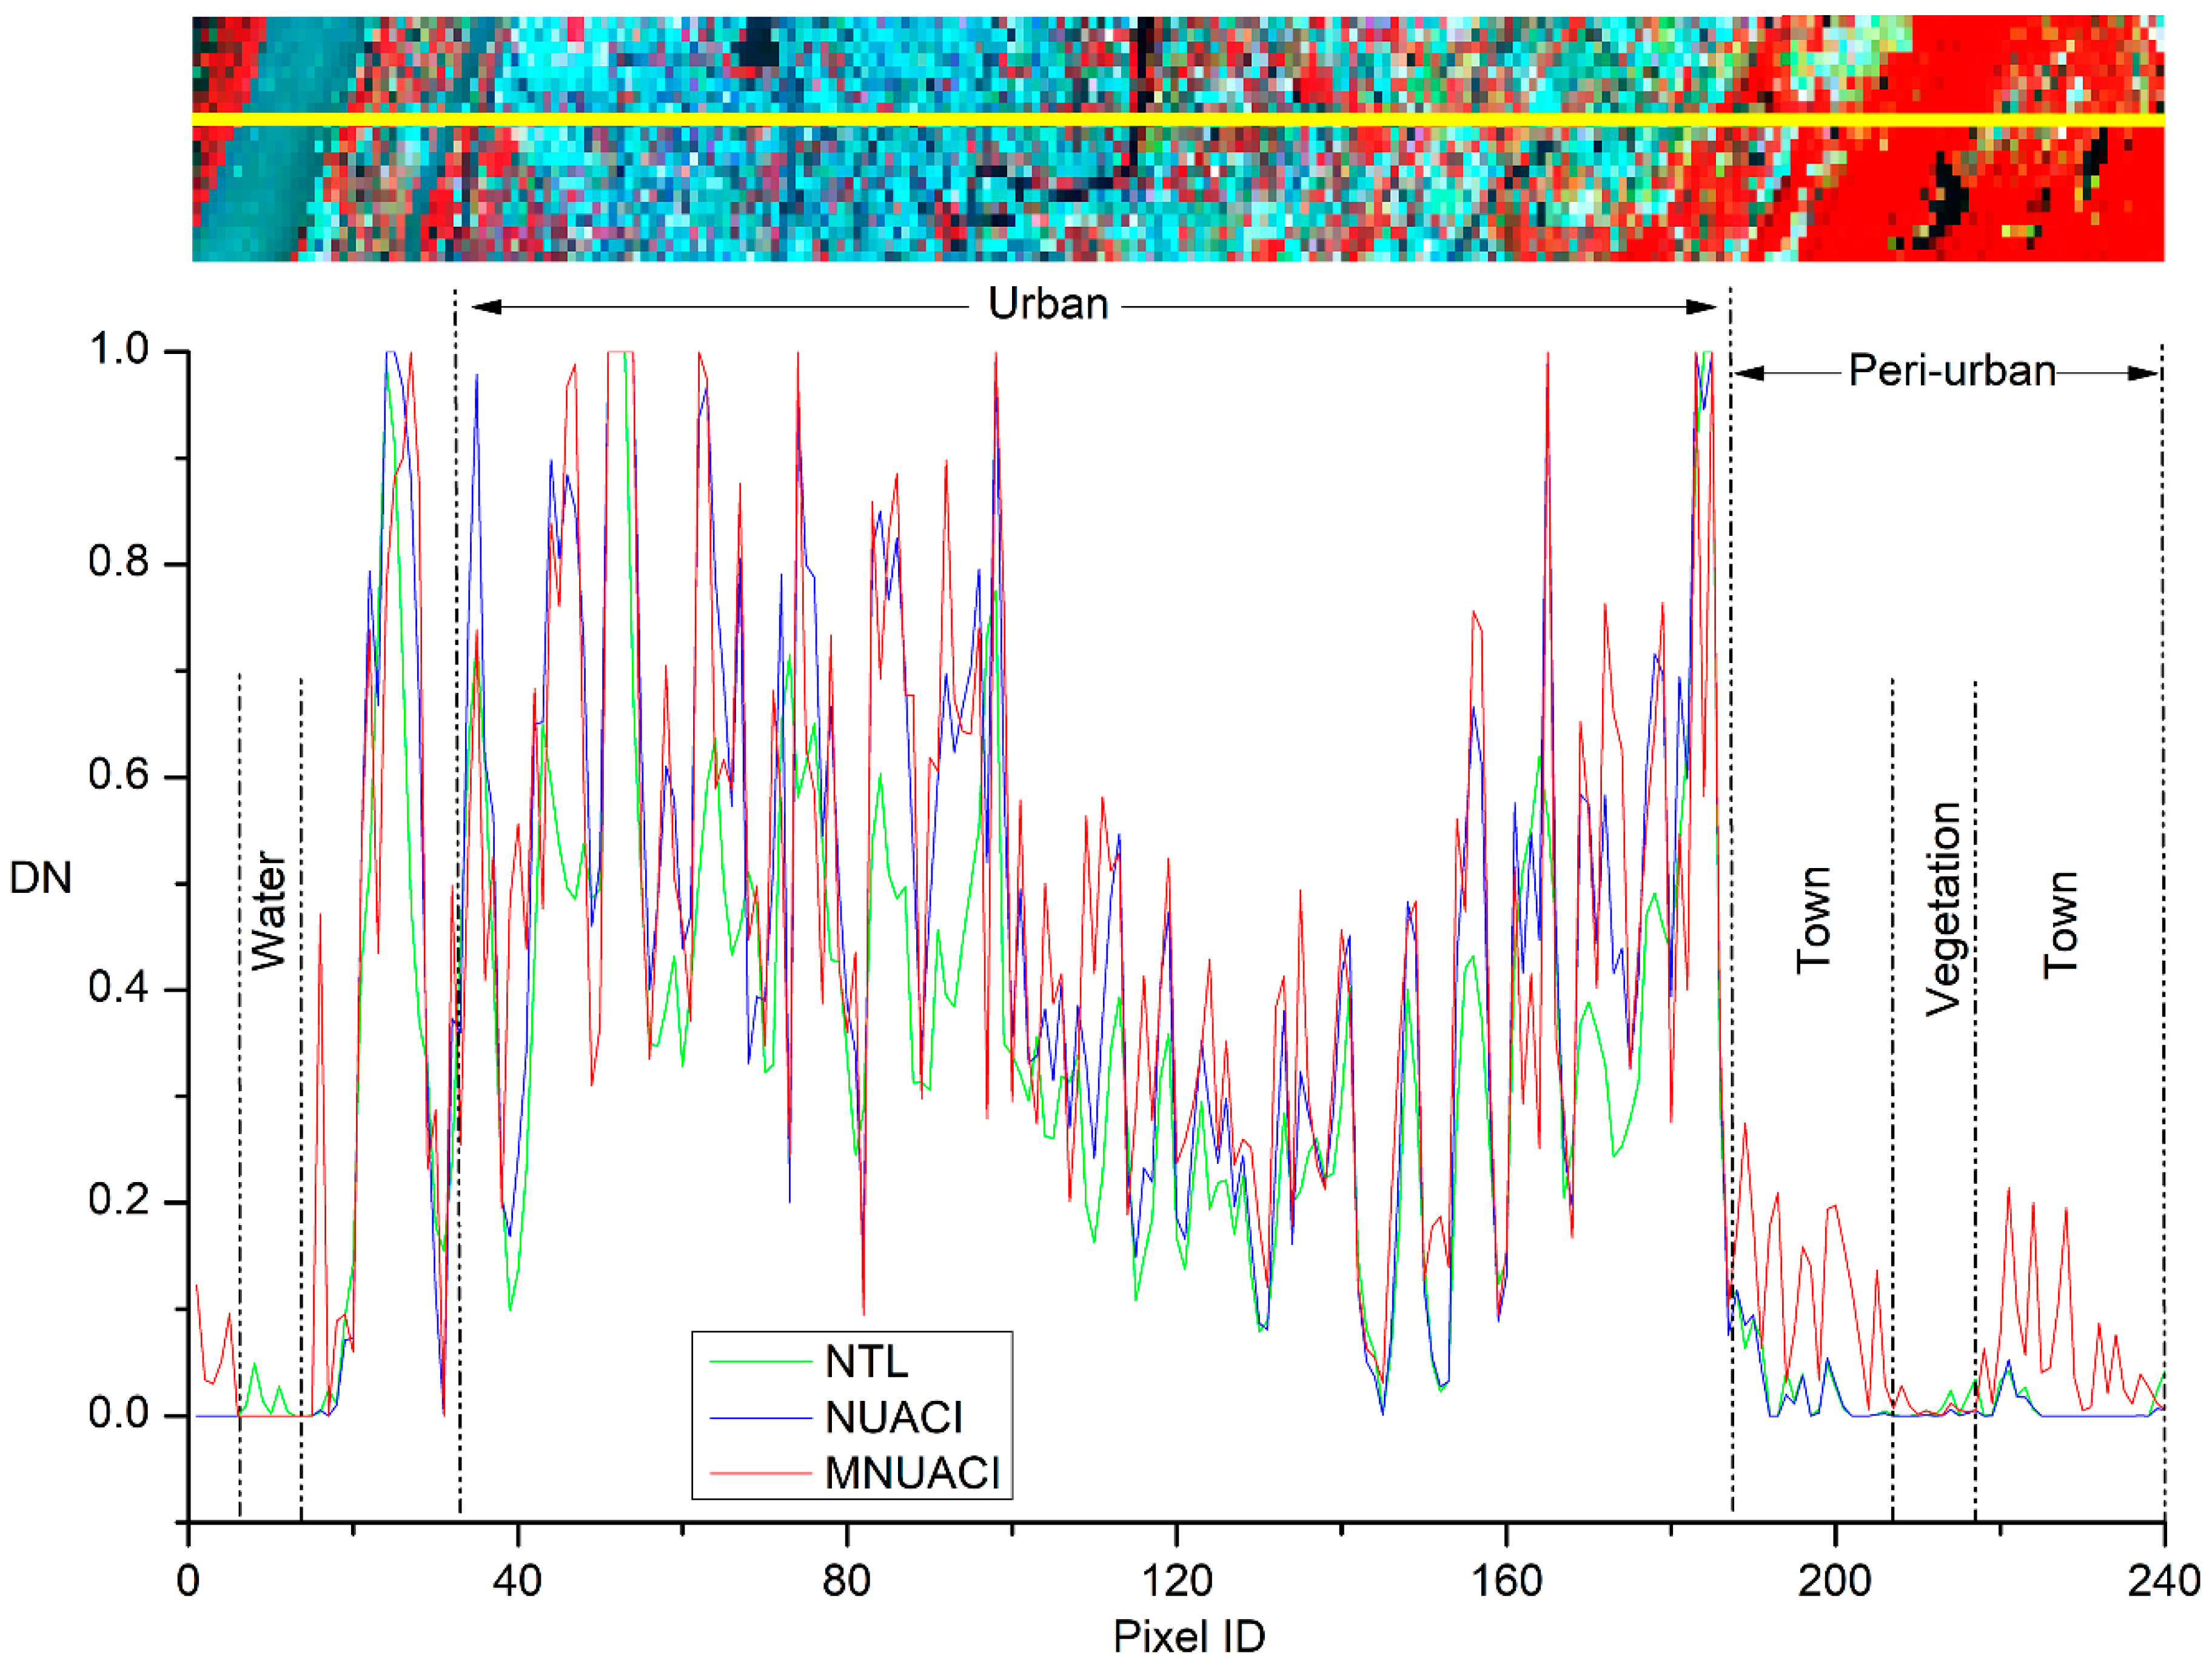
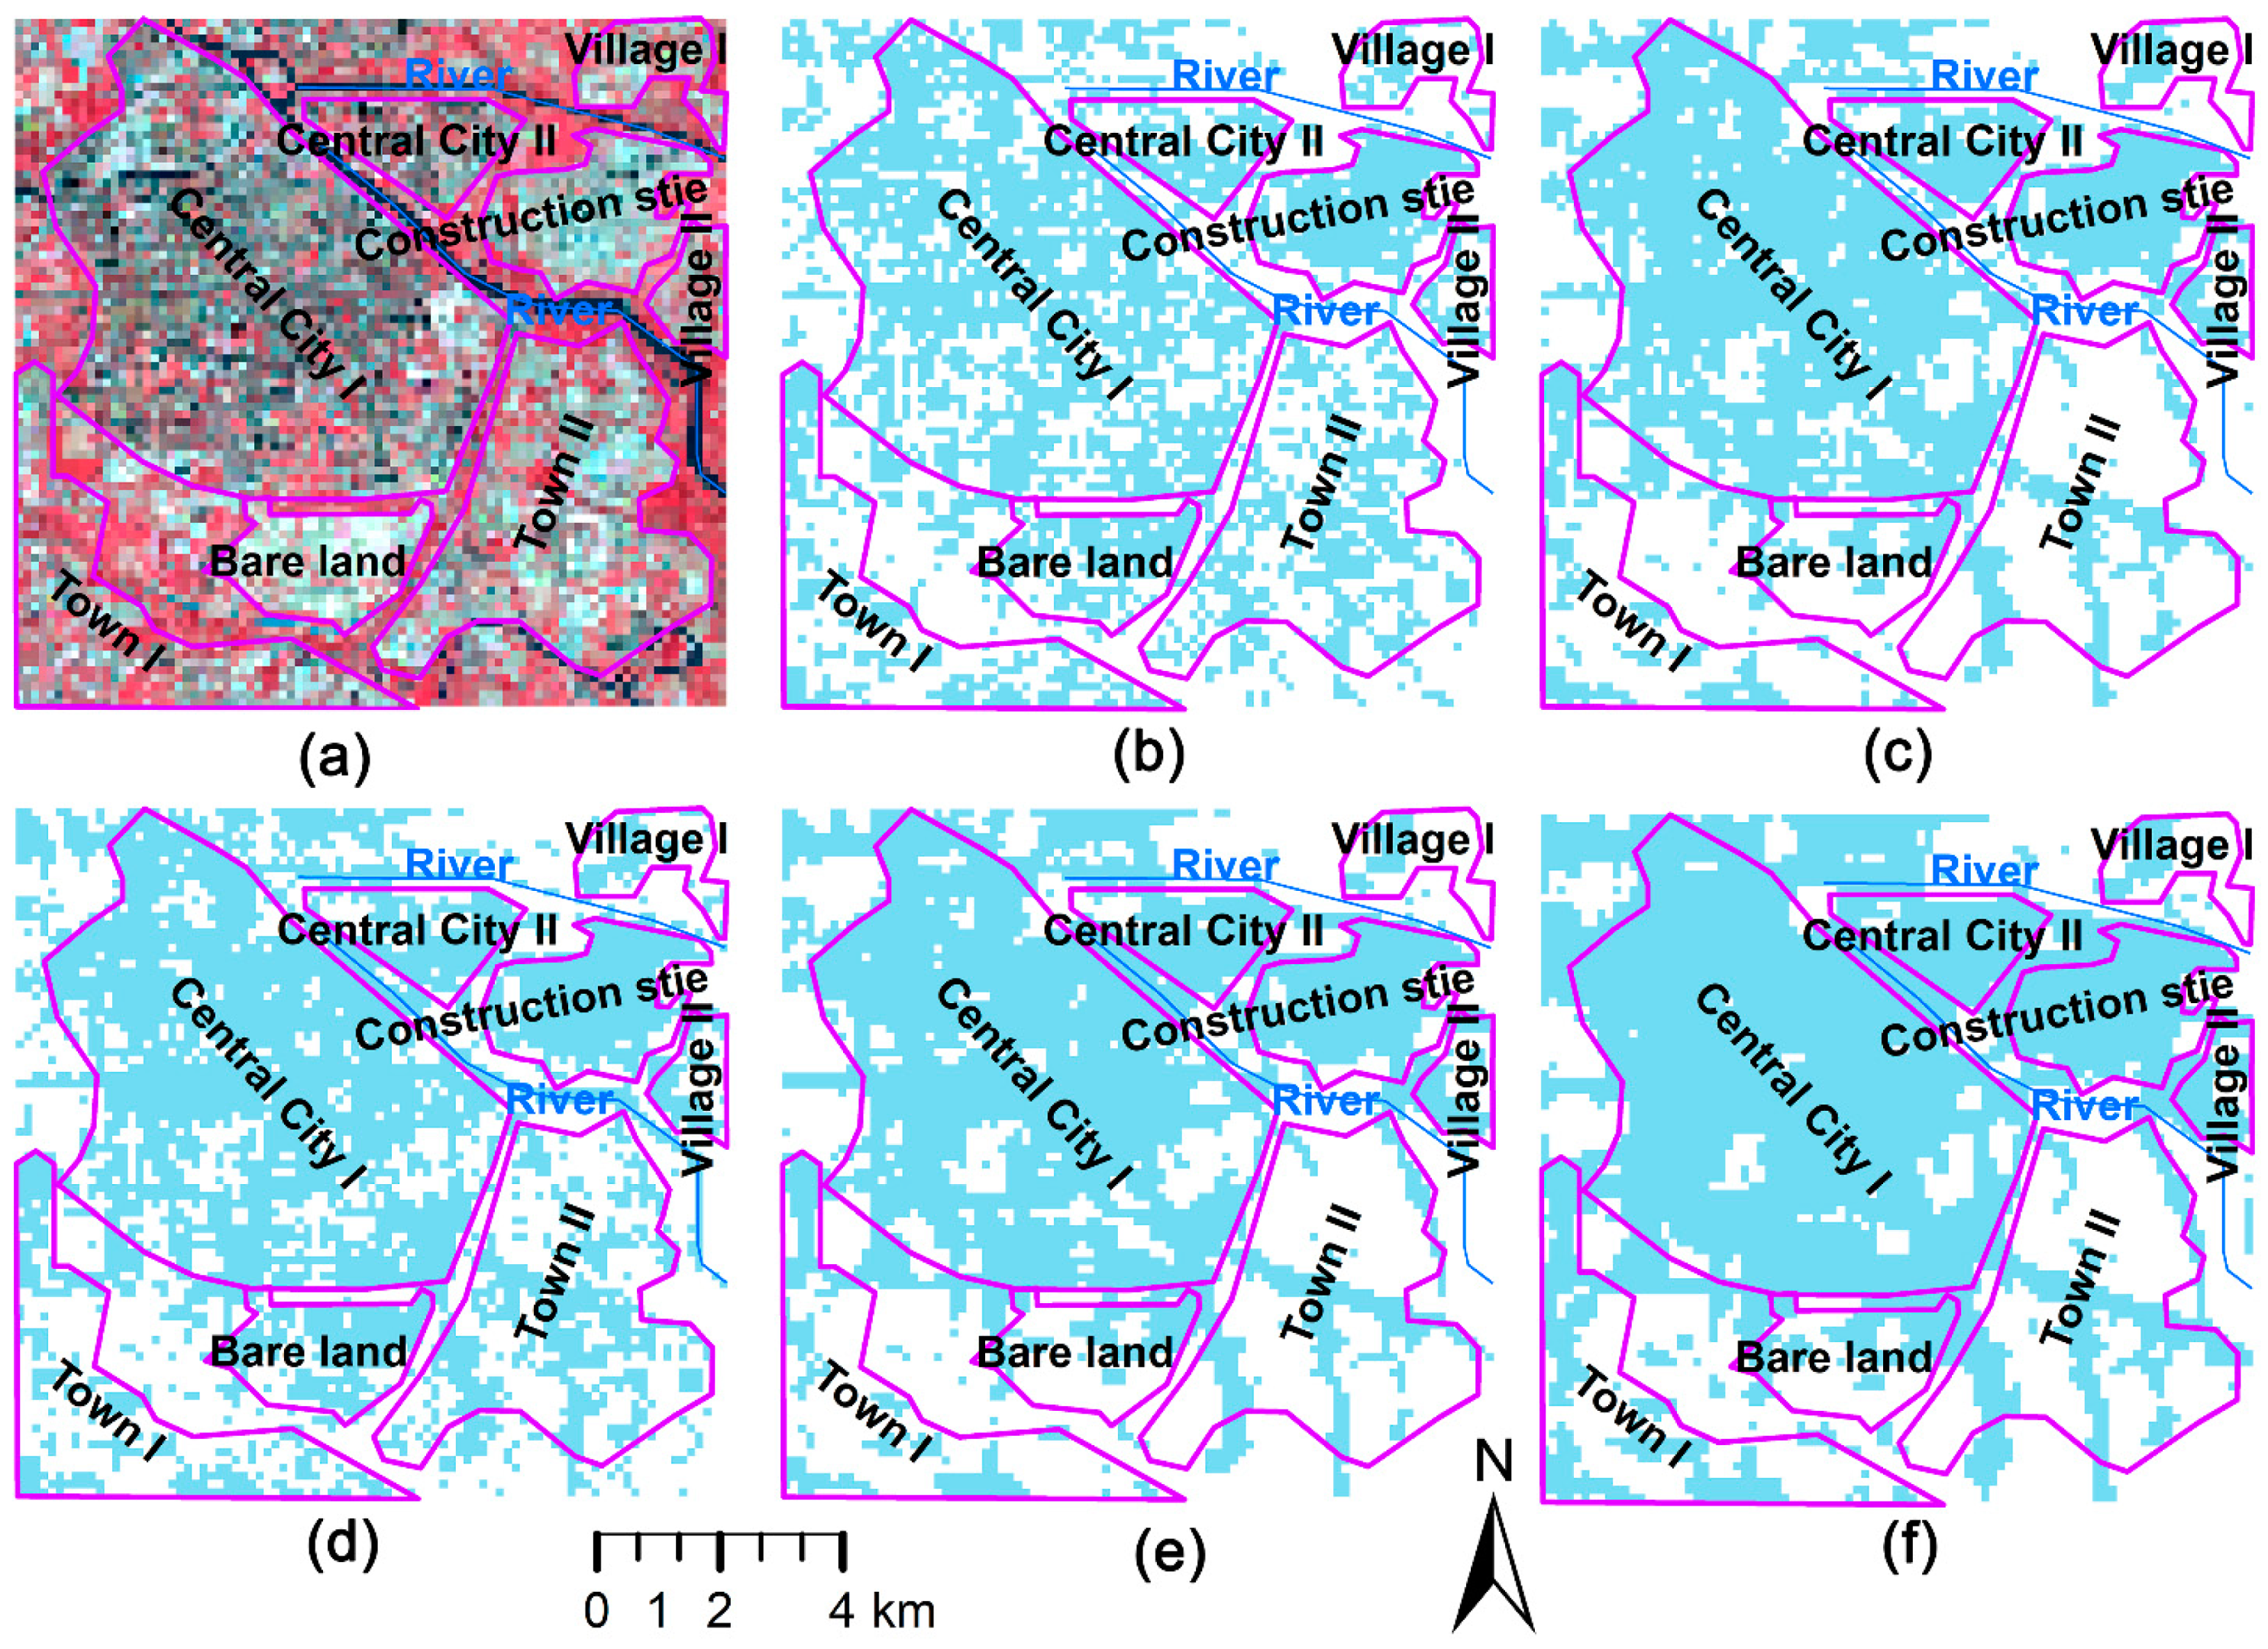
4.1. Urban Area Extraction by the MNUACI
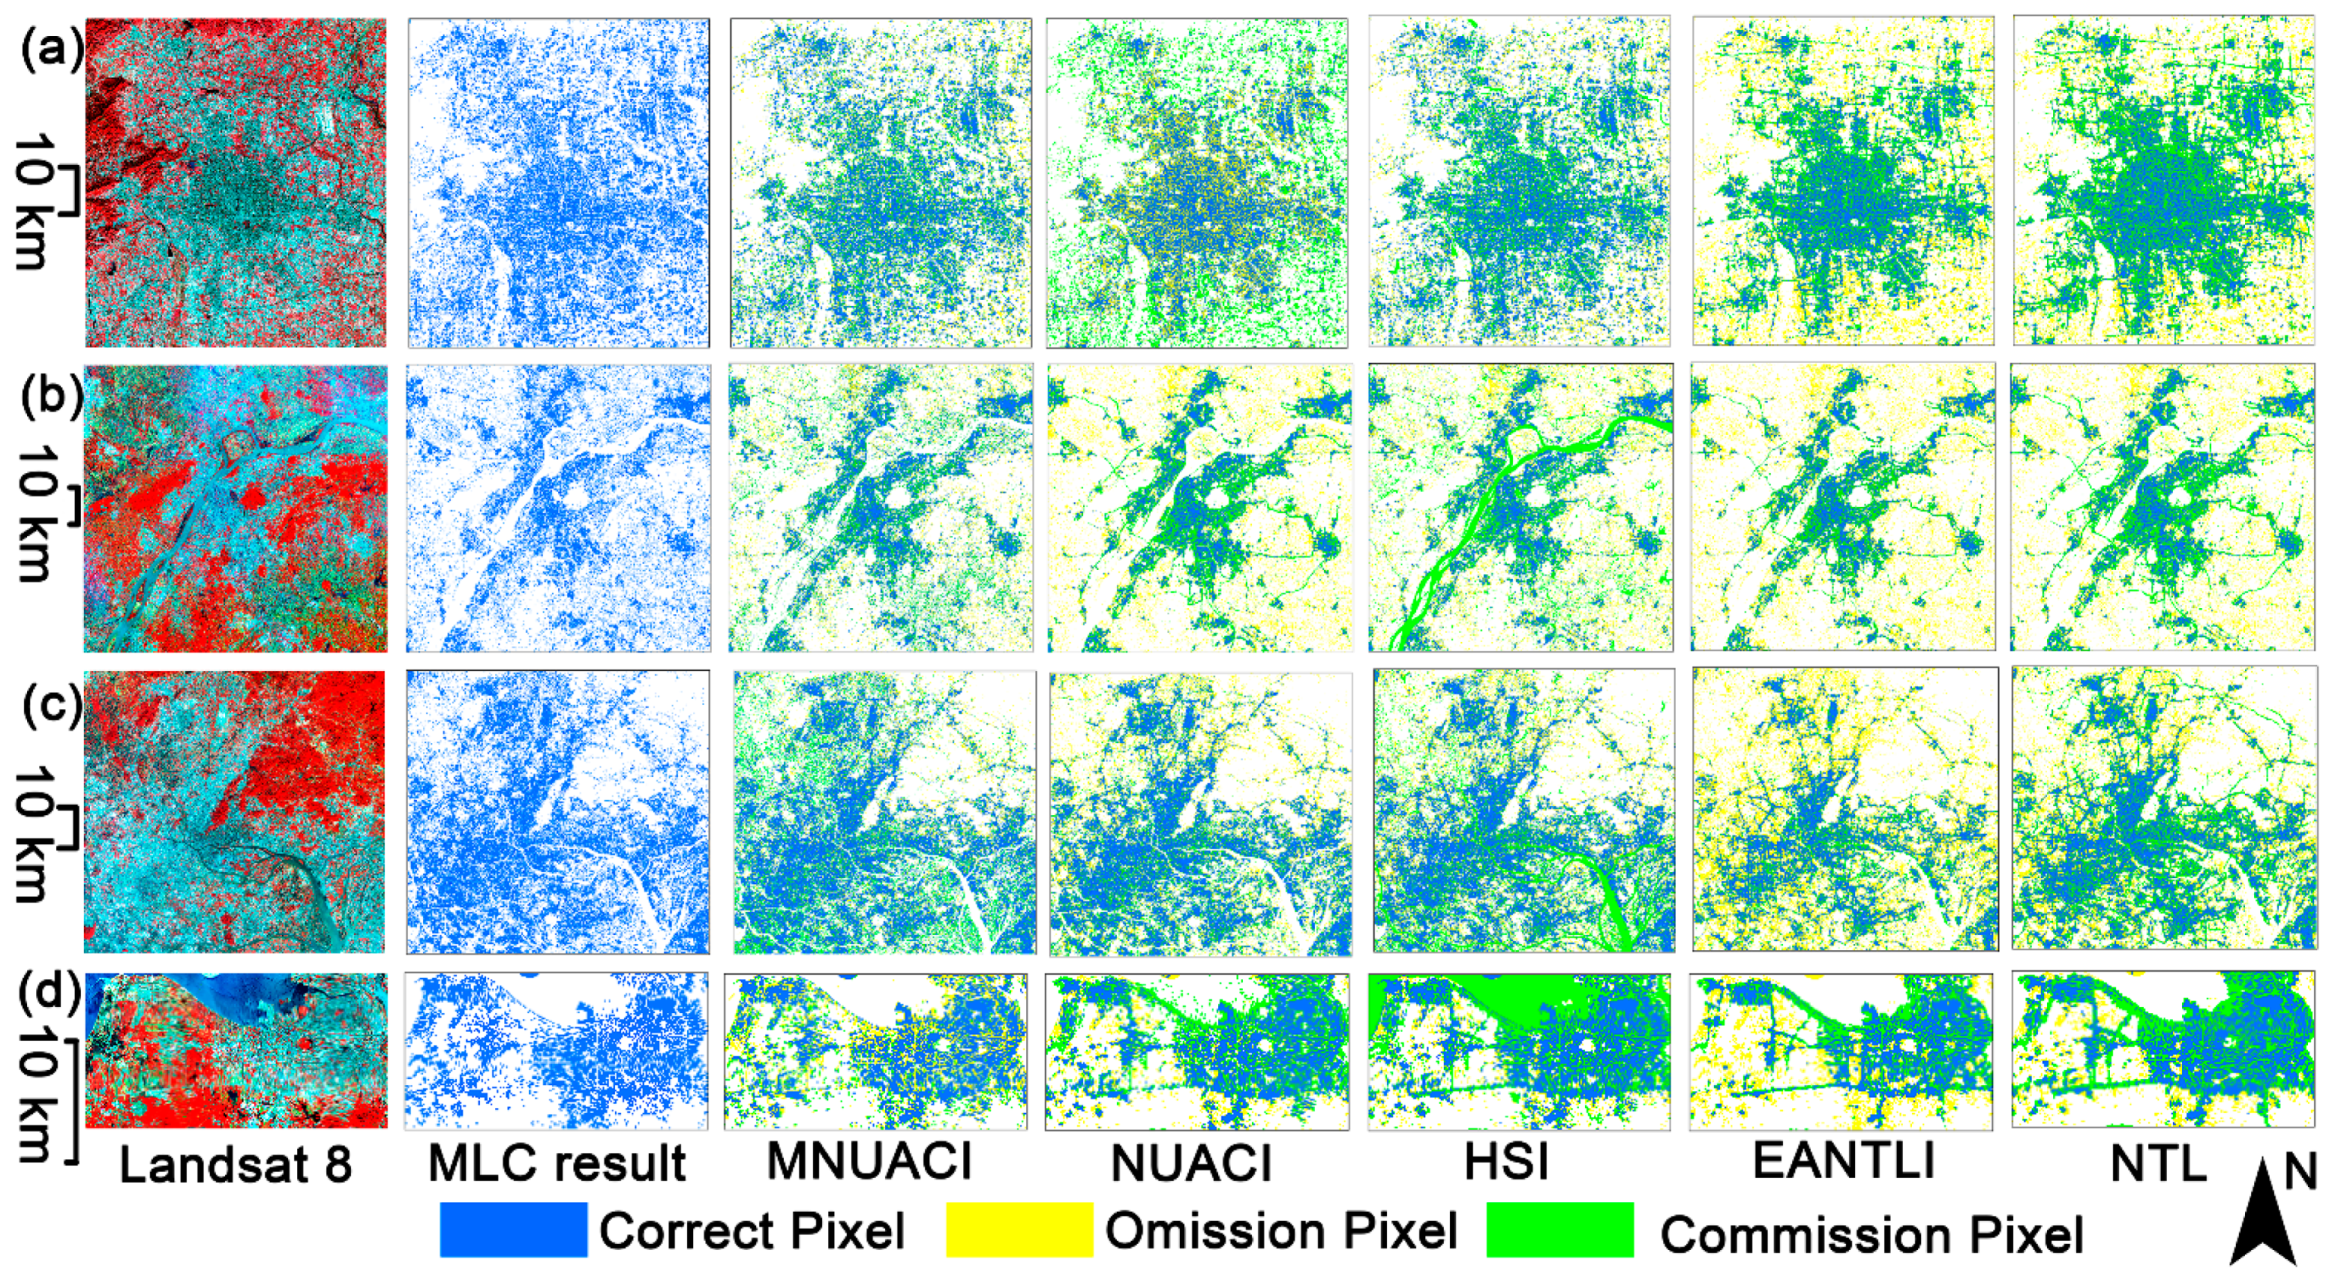
4.2. Performance Assessment of the MNUACI
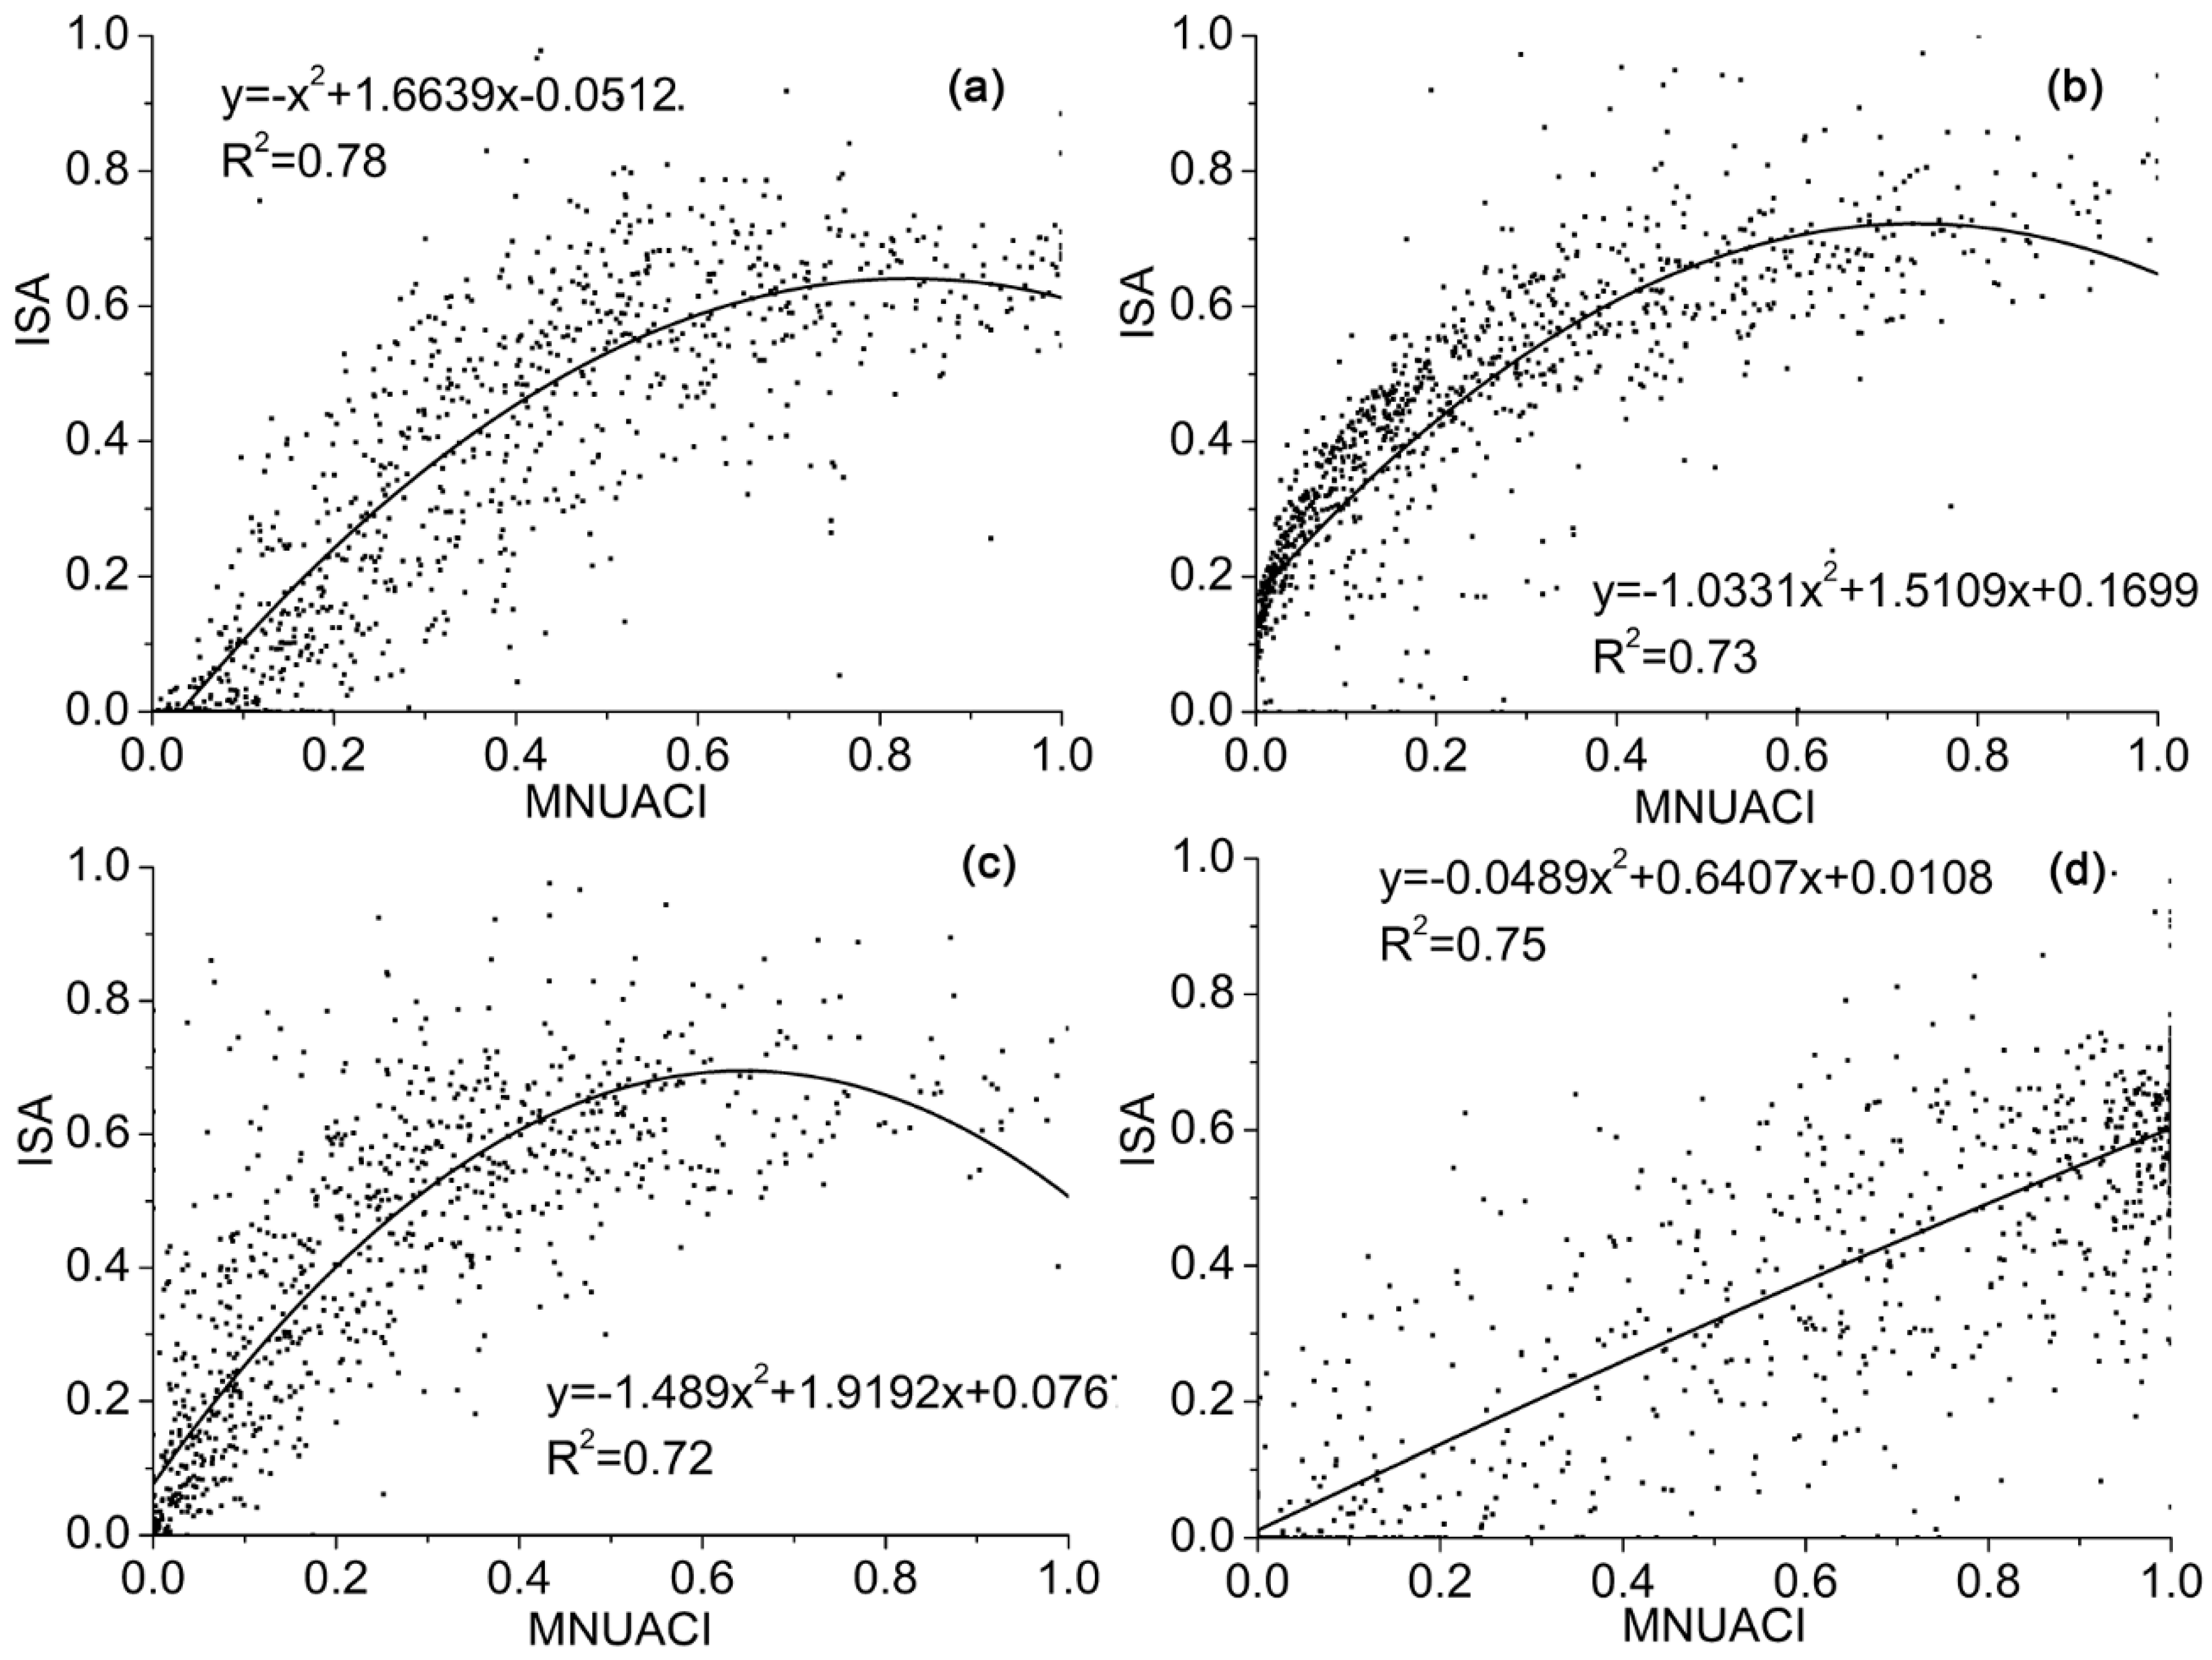
4.3. Correlation between MNUACI and Urban Impervious Surface
5. Discussion
5.1. Comparison with Previous Indexes
5.2. Limitations of the Method
6. Conclusions
Author Contributions
Funding
Data Availability Statement
Acknowledgments
Conflicts of Interest
References
- Cheng, F.; Liu, S.; Hou, X.; Zhang, Y.; Liu, G. Urban land extraction using DMSP/OLS nighttime light data and OpenStreetMap datasets for cities in China at different development levels. IEEE J. Sel. Top. Appl. Earth Obs. Remote Sens. 2018, 8, 2587–2599. [Google Scholar] [CrossRef]
- Xu, Z.; Lin, G.C.S. Participatory urban redevelopment in Chinese cities amid accelerated urbanization: Symbolic urban governance in globalizing Shanghai. J. Urban Aff. 2019, 41, 756–775. [Google Scholar] [CrossRef]
- Yu, Z.; Yao, Y.; Yang, G.; Wang, X.; Vejre, H. Strong contribution of rapid urbanization and urban agglomeration development to regional thermal environment dynamics and evolution. Forest Eco. Manag. 2019, 446, 214–225. [Google Scholar] [CrossRef]
- Zhao, N.; Jiao, Y.; Ma, T.; Zhao, M.; Fan, Z.; Yin, X.; Liu, Y.; Yue, T. Estimating the effect of urbanization on extreme climate events in the Beijing-Tianjin-Hebei region, China. Sci. Total Environ. 2019, 688, 1005–1015. [Google Scholar] [CrossRef]
- Wu, T.; Yang, S.; Liu, M.; Qiu, G.; Li, H.; Luo, M.; Jia, P. Urban sprawl and childhood obesity. Obes. Rev. 2020, 22, e13096. [Google Scholar]
- Jia, P.; Stein, A.; James, P.; Brownson, R.C.; Wu, T.; Xiao, Q.; Wang, L.; Sabel, C.E.; Wang, Y. Earth observation: Investigating noncommunicable diseases from space. Annu. Rev. Publ. Health 2019, 40, 85–104. [Google Scholar] [CrossRef] [Green Version]
- Rybnikova, N.A.; Portnov, B.A. Outdoor light and breast cancer incidence: A comparative analysis of DMSP and VIIRS-DNB satellite data. Int. J. Remote Sens. 2017, 38, 5952–5961. [Google Scholar] [CrossRef]
- National Data of National Bureau of Statistics. Available online: https://data.stats.gov.cn/easyquery.htm?cn=C01 (accessed on 7 June 2021).
- Tilottama, G.; Elvidge, C.D.; Sutton, P.C.; Baugh, K.E.; Tuttle, B.T. Creating a global grid of distributed fossil fuel CO2 emissions from nighttime satellite imagery. Energies 2010, 3, 1895–1913. [Google Scholar]
- Wu, S.; Zhou, S.; Chen, D.; Wei, Z.; Dai, L.; Li, X. Determining the contributions of urbanisation and climate change to NPP variations over the last decade in the Yangtze River Delta, China. Sci. Total Environ. 2014, 472, 397–406. [Google Scholar] [CrossRef]
- Levin, N.; Zhang, Q. A global analysis of factors controlling VIIRS nighttime light levels from densely populated areas. Remote Sens. Environ. 2017, 190, 366–382. [Google Scholar] [CrossRef] [Green Version]
- Ji, G.; Tian, L.; Zhao, J.; Yue, Y.; Zheng, W. Detecting spatiotemporal dynamics of PM2.5 emission data in China using DMSP-OLS nighttime stable light data. J. Clean. Prod. 2019, 209, 363–370. [Google Scholar] [CrossRef]
- Tan, M. An intensity gradient/vegetation fractional coverage approach to mapping urban areas from DMSP/OLS nighttime light data. IEEE J. Sel. Top. Appl. Earth Obs. Remote Sens. 2017, 10, 95–103. [Google Scholar] [CrossRef]
- Xue, X.; Zheng, Q.; Ke, W. Delineating urban boundaries using Landsat 8 multispectral data and VIIRS nighttime light data. Remote Sen. 2018, 10, 799. [Google Scholar] [CrossRef] [Green Version]
- Cao, X.; Chen, J.; Imura, H.; Higashi, O. A SVM-based method to extract urban areas from DMSP-OLS and SPOT VGT data. Remote Sens. Environ. 2009, 113, 2205–2209. [Google Scholar] [CrossRef]
- Jing, W.; Yang, Y.; Yue, X.; Zhao, X. Mapping urban areas with integration of DMSP/OLS nighttime light and MODIS data using machine learning techniques. Remote Sens. 2015, 7, 12419–12439. [Google Scholar] [CrossRef] [Green Version]
- Milesi, C.; Elvidge, C.D.; Nemani, R.R.; Running, S.W. Assessing the impact of urban land development on net primary productivity in the southeastern United States. Remote Sens. Environ. 2003, 86, 401–410. [Google Scholar] [CrossRef]
- Dou, Y.; Liu, Z.; He, C.; Yue, H. Urban land extraction using VIIRS nighttime light data: An evaluation of three popular methods. Remote Sens. 2017, 9, 175. [Google Scholar] [CrossRef] [Green Version]
- Lu, D.; Tian, H.; Zhou, G.; Ge, H. Regional mapping of human settlements in southeastern China with multisensor remotely sensed data. Remote Sens. Environ. 2008, 112, 3668–3679. [Google Scholar] [CrossRef]
- Zhang, Q.; Schaaf, C.; Seto, K.C. The vegetation adjusted NTL urban index: A new approach to reduce saturation and increase variation in nighttime luminosity. Remote Sens. Environ. 2013, 129, 32–41. [Google Scholar] [CrossRef]
- Zhuo, L.; Zhang, X.; Zheng, J.; Tao, H.; Guo, Y. An EVI-based method to reduce saturation of DMSP/OLS nighttime light data. Acta Geog. Sin. 2015, 70, 1339–1350. [Google Scholar]
- Liu, Y.; Yang, Y.; Jing, W.; Ling, Y.; Zhao, X. A new urban index for expressing inner-city patterns based on MODIS LST and EVI regulated DMSP/OLS NTL. Remote Sens. 2017, 9, 777. [Google Scholar] [CrossRef] [Green Version]
- Liu, X.; Hu, G.; Ai, B.; Li, X.; Shi, Q. A normalized urban area composite index (NUACI) based on combination of DMSP-OLS and MODIS for mapping impervious surface area. Remote Sens. 2015, 7, 17168–17189. [Google Scholar] [CrossRef] [Green Version]
- Kelly, J.T.; Gontz, A.M. Using GPS-surveyed intertidal zones to determine the validity of shorelines automatically mapped by Landsat water indice. Int. J. Appl. Earth Obs. 2018, 65, 92–104. [Google Scholar] [CrossRef]
- Yang, S.; Chen, X.; Wang, L.; Wu, T.; Fei, T.; Xiao, Q.; Zhang, G.; Ning, Y.; Jia, P. Walkability indices and childhood obesity: A review of epidemiologic evidence. Obes. Rev. 2021, 22, e13096. [Google Scholar] [CrossRef]
- Cao, W.; Dong, L.; Wu, L.; Liu, Y. Quantifying urban areas with multi-source data based on percolation theory. Remote Sens. Environ. 2020, 241, 111730. [Google Scholar] [CrossRef] [Green Version]
- Yang, D.; Luan, W.; Qiao, L.; Pratama, M. Modeling and spatio-temporal analysis of city-level carbon emissions based on nighttime light satellite imagery. Appl. Energ. 2020, 268, 114696. [Google Scholar] [CrossRef]
- Reply of the CPC Central Committee and the State Council on the “Beijing City Master Plan (2016–2035)”. Available online: http://www.gov.cn/zhengce/2017-09/27/content_5227992.htm (accessed on 7 June 2021).
- Beijing Statistical Yearbook 2019. Available online: http://nj.tjj.beijing.gov.cn/nj/main/2019-tjnj/zk/indexch.htm (accessed on 7 June 2021).
- Nanjing Statistical Yearbook 2019. Available online: http://tjj.nanjing.gov.cn/material/njnj_2019/hesuan/index.htm (accessed on 7 June 2021).
- Guangdong Statistical Yearbook 2019. Available online: http://stats.gd.gov.cn/gdtjnj/content/post_2639622.html (accessed on 7 June 2021).
- Zhang, F.; Wang, Y.; Ma, X.; Wang, Y.; Yang, G.; Zhu, L. Evaluation of resources and environmental carrying capacity of 36 large cities in China based on a support-pressure coupling mechanism. Sci. Total Environ. 2019, 668, 838–854. [Google Scholar] [CrossRef]
- Haikou Statistical Yearbook 2019. Available online: http://tjj.haikou.gov.cn/tjsj1/tjsjfb/tjnj/201911/t20191121_1466162.html (accessed on 7 June 2021).
- Li, X.; Li, X.; Li, D.; He, X.; Jendryke, M. A preliminary investigation of Luojia-1 night-time light imagery. Remote Sens. Lett. 2019, 10, 526–535. [Google Scholar] [CrossRef]
- Zhong, X.; Su, Z.; Zhang, G.; Chen, Z.; Meng, Y.; Li, D.; Liu, Y. Analysis and reduction of solar stray light in the nighttime imaging camera of Luojia-1 satellite. Sensors 2019, 19, 1130. [Google Scholar] [CrossRef] [Green Version]
- Guan, Z.; Jiang, Y.; Wang, J.; Zhang, G. Star-based calibration of the installation between the camera and star sensor of the Luojia 1-01 satellite. Remote Sens. 2019, 11, 2081. [Google Scholar] [CrossRef] [Green Version]
- Liu, X.; Hu, G.; Chen, Y.; Li, X.; Xu, X.; Li, S.; Pei, F.; Wang, S. High-resolution multi-temporal mapping of global urban land using Landsat images based on the Google Earth Engine Platform. Remote Sens. Environ. 2018, 209, 227–239. [Google Scholar] [CrossRef]
- Xu, H. Modification of normalised difference water index (NDWI) to enhance open water features in remotely sensed imagery. Int J. Remote Sens. 2006, 27, 3025–3033. [Google Scholar] [CrossRef]
- Yan, Y.; Deng, L.; Liu, X.L.; Zhu, L. Application of UAV-based multi-angle hyperspectral remote sensing in fine vegetation classification. Remote Sens. 2019, 11, 2753. [Google Scholar] [CrossRef] [Green Version]
- Hou, W.; Hou, X. Data Fusion and Accuracy Analysis of multi-source land use/land cover datasets along coastal areas of the Maritime Silk Road. ISPRS Int. J. Geo Info. 2019, 8, 557. [Google Scholar] [CrossRef] [Green Version]
- Cui, B.; Cui, J.; Lu, Y.; Guo, N.; Gong, M. A sparse representation-based sample pseudo-labeling method for hyperspectral image classification. Remote Sens. 2020, 12, 664. [Google Scholar] [CrossRef] [Green Version]
- Dalponte, M.; Frizzera, L.; Gianelle, D. Individual tree crown delineation and tree species classification with hyperspectral and LiDAR data. Peer J. 2019, 6, 6227. [Google Scholar] [CrossRef]
- Pok, S.; Matsushita, B.; Fukushima, T. An easily implemented method to estimate impervious surface area on a large scale from MODIS time-series and improved DMSP-OLS nighttime light data. ISPRS J. Photogramm. 2017, 133, 104–115. [Google Scholar] [CrossRef] [Green Version]
- Guo, W.; Li, G.; Ni, W.; Zhang, Y.; Lu, D. Exploring improvement of impervious surface estimation at national scale through integration of nighttime light and Proba-V data. GISci. Remote Sens. 2018, 55, 699–717. [Google Scholar] [CrossRef]
- Tian, Y.; Chen, H.; Song, Q.; Zheng, K. A novel index for impervious surface area mapping: Development and validation. Remote Sens. 2018, 10, 1521. [Google Scholar] [CrossRef] [Green Version]
- Zhang, X.; Li, P.; Cai, C. Regional urban extent extraction using multi-sensor data and one-class classification. Remote Sens. 2015, 7, 7671–7694. [Google Scholar] [CrossRef] [Green Version]
- Abdel-Khalek, S.; Ishak, A.B.; Omer, O.A.; Obada, A.S.F. A two-dimensional image segmentation method based on genetic algorithm and entropy. Optik 2016, 131, 414–422. [Google Scholar] [CrossRef]
- Li, F.; Yan, Q.; Bian, Z.; Liu, B.; Wu, Z. A POI and LST Adjusted NTL urbanindex for urban built-up area extraction. Sensors 2020, 20, 2918. [Google Scholar] [CrossRef]
- Li, P.; Zhang, X. A temperature and vegetation adjusted NTL urban index for urban area mapping and analysis. ISPRS J. Photogram. 2018, 135, 93–111. [Google Scholar]
- Dobson, J.E.; Bright, E.A.; Coleman, P.R.; Durfee, R.C.; Worley, B.A. Landscan: A global population database for estimating populations at risk. Photogramm. Eng. Remote Sens. 2000, 66, 849–857. [Google Scholar]


| Image Type | Acquisition Date | Day/Night | Spatial Resolution (m) | Path & Row | Location |
|---|---|---|---|---|---|
| Luojia 1-01 | 6 September 2018 | Night | 130 | 1423 & 28 | Beijing |
| Luojia 1-01 | 15 July 2018 | Night | 130 | 8979 & 18 | Nanjing |
| Luojia 1-01 | 4 September 2018 | Night | 130 | 6005 & 05 | Guangzhou |
| Luojia 1-01 | 5 September 2018 | Night | 130 | 7644 & 05 | Haikou |
| Landsat 8 | 23 October 2017 | Day | 30 | 123 & 32 | Beijing |
| Landsat 8 | 6 June 2018 | Day | 30 | 120 & 38 | Nanjing |
| Landsat 8 | 23 October 2017 | Day | 30 | 122 & 44 | Guangzhou |
| Landsat 8 | 17 May 2018 | Day | 30 | 124 & 46 | Haikou |
| Method | MNUACI | NUACI | HSI | ||||||
|---|---|---|---|---|---|---|---|---|---|
| OA | KC | JSC | OA | KC | JSC | OA | KC | JSC | |
| DL | 91.31% | 0.826 | 0.843 | 75.30% | 0.512 | 0.518 | 88.93% | 0.779 | 0.806 |
| GA | 92.33% | 0.847 | 0.861 | 79.56% | 0.595 | 0.604 | 91.31% | 0.827 | 0.847 |
| FCM | 92.50% | 0.850 | 0.864 | 88.59% | 0.773 | 0.781 | 90.12% | 0.803 | 0.825 |
| SVM | 93.36% | 0.867 | 0.883 | 89.44% | 0.790 | 0.797 | 92.67% | 0.853 | 0.870 |
| Method | EANTLI | NTL | |||||||
| OA | KC | JSC | OA | KC | JSC | ||||
| DL | 56.56% | 0.149 | 0.156 | 65.76% | 0.326 | 0.347 | |||
| GA | 64.74% | 0.306 | 0.319 | 73.59% | 0.477 | 0.509 | |||
| FCM | 80.07% | 0.604 | 0.632 | 79.90% | 0.599 | 0.649 | |||
| SVM | 84.50% | 0.691 | 0.722 | 81.43% | 0.628 | 0.696 | |||
| Method | MNUACI | NUACI | HSI | ||||||
|---|---|---|---|---|---|---|---|---|---|
| OA | KC | JSC | OA | KC | JSC | OA | KC | JSC | |
| DL | 94.71% | 0.893 | 0.888 | 84.13% | 0.675 | 0.662 | 83.89% | 0.679 | 0.718 |
| GA | 93.99% | 0.879 | 0.878 | 84.62% | 0.685 | 0.672 | 83.17% | 0.663 | 0.702 |
| FCM | 87.02% | 0.743 | 0.780 | 93.03% | 0.859 | 0.852 | 76.92% | 0.549 | 0.666 |
| SVM | 94.95% | 0.899 | 0.898 | 93.03% | 0.859 | 0.854 | 85.34% | 0.709 | 0.750 |
| Method | EANTLI | NTL | |||||||
| OA | KC | JSC | OA | KC | JSC | ||||
| DL | 72.60% | 0.430 | 0.415 | 76.44% | 0.513 | 0.497 | |||
| GA | 65.87% | 0.284 | 0.272 | 96.39% | 0.927 | 0.925 | |||
| FCM | 90.14% | 0.800 | 0.791 | 87.02% | 0.743 | 0.780 | |||
| SVM | 89.66% | 0.790 | 0.781 | 89.90% | 0.795 | 0.791 | |||
| Method | MNUACI | NUACI | HSI | ||||||
|---|---|---|---|---|---|---|---|---|---|
| OA | KC | JSC | OA | KC | JSC | OA | KC | JSC | |
| DL | 86.22% | 0.729 | 0.759 | 70.78% | 0.437 | 0.494 | 69.12% | 0.392 | 0.531 |
| GA | 94.06% | 0.879 | 0.901 | 72.92% | 0.485 | 0.527 | 83.14% | 0.653 | 0.748 |
| FCM | 93.11% | 0.860 | 0.885 | 91.21% | 0.825 | 0.847 | 85.27% | 0.692 | 0.787 |
| SVM | 94.06% | 0.879 | 0.901 | 93.59% | 0.870 | 0.890 | 85.51% | 0.698 | 0.787 |
| Method | EANTLI | NTL | |||||||
| OA | KC | JSC | OA | KC | JSC | ||||
| DL | 57.01% | 0.213 | 0.255 | 64.37% | 0.332 | 0.395 | |||
| GA | 83.61% | 0.670 | 0.740 | 71.26% | 0.447 | 0.524 | |||
| FCM | 72.21% | 0.465 | 0.538 | 80.05% | 0.596 | 0.697 | |||
| SVM | 76.72% | 0.545 | 0.616 | 79.57% | 0.588 | 0.687 | |||
| Method | MNUACI | NUACI | HSI | ||||||
|---|---|---|---|---|---|---|---|---|---|
| OA | KC | JSC | OA | KC | JSC | OA | KC | JSC | |
| DL | 76.74% | 0.537 | 0.585 | 77.52% | 0.551 | 0.622 | 67.70% | 0.358 | 0.439 |
| GA | 87.08% | 0.741 | 0.783 | 78.81% | 0.577 | 0.640 | 70.54% | 0.411 | 0.553 |
| FCM | 86.56% | 0.731 | 0.777 | 80.36% | 0.608 | 0.668 | 80.36% | 0.608 | 0.668 |
| SVM | 87.60% | 0.752 | 0.789 | 83.20% | 0.664 | 0.725 | 75.97% | 0.517 | 0.658 |
| Method | EANTLI | NTL | |||||||
| OA | KC | JSC | OA | KC | JSC | ||||
| DL | 71.06% | 0.424 | 0.513 | 67.96% | 0.363 | 0.451 | |||
| GA | 57.36% | 0.159 | 0.191 | 66.67% | 0.338 | 0.429 | |||
| FCM | 67.70% | 0.359 | 0.416 | 80.36% | 0.608 | 0.668 | |||
| SVM | 73.39% | 0.469 | 0.564 | 76.23% | 0.524 | 0.633 | |||
| Cities | MNUACI | NUACI | HSI | EANTLI | NTL | |||||
|---|---|---|---|---|---|---|---|---|---|---|
| R2 | RMSE | R2 | RMSE | R2 | RMSE | R2 | RMSE | R2 | RMSE | |
| Beijing | 0.78 | 0.12 | 0.39 | 0.20 | 0.58 | 0.17 | 0.19 | 0.24 | 0.15 | 0.24 |
| Nanjing | 0.73 | 0.11 | 0.51 | 0.15 | 0.39 | 0.17 | 0.32 | 0.18 | 0.33 | 0.18 |
| Guangzhou | 0.72 | 0.14 | 0.52 | 0.18 | 0.51 | 0.18 | 0.16 | 0.24 | 0.23 | 0.23 |
| Haikou | 0.75 | 0.13 | 0.52 | 0.18 | 0.27 | 0.22 | 0.15 | 0.24 | 0.24 | 0.23 |
Publisher’s Note: MDPI stays neutral with regard to jurisdictional claims in published maps and institutional affiliations. |
© 2021 by the authors. Licensee MDPI, Basel, Switzerland. This article is an open access article distributed under the terms and conditions of the Creative Commons Attribution (CC BY) license (https://creativecommons.org/licenses/by/4.0/).
Share and Cite
Li, F.; Liu, X.; Liao, S.; Jia, P. The Modified Normalized Urban Area Composite Index: A Satelliate-Derived High-Resolution Index for Extracting Urban Areas. Remote Sens. 2021, 13, 2350. https://doi.org/10.3390/rs13122350
Li F, Liu X, Liao S, Jia P. The Modified Normalized Urban Area Composite Index: A Satelliate-Derived High-Resolution Index for Extracting Urban Areas. Remote Sensing. 2021; 13(12):2350. https://doi.org/10.3390/rs13122350
Chicago/Turabian StyleLi, Feng, Xiaoyang Liu, Shunbao Liao, and Peng Jia. 2021. "The Modified Normalized Urban Area Composite Index: A Satelliate-Derived High-Resolution Index for Extracting Urban Areas" Remote Sensing 13, no. 12: 2350. https://doi.org/10.3390/rs13122350
APA StyleLi, F., Liu, X., Liao, S., & Jia, P. (2021). The Modified Normalized Urban Area Composite Index: A Satelliate-Derived High-Resolution Index for Extracting Urban Areas. Remote Sensing, 13(12), 2350. https://doi.org/10.3390/rs13122350