Article

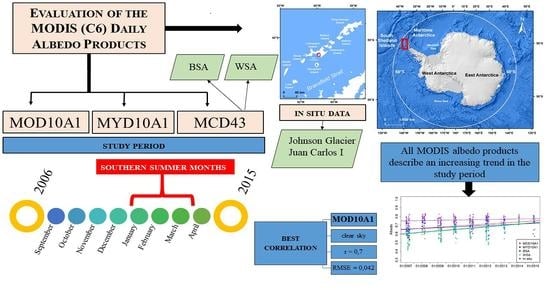
Evaluation of the MODIS (C6) Daily Albedo Products for Livingston Island, Antarctic

by
Alejandro Corbea-Pérez
1,*,
Javier F. Calleja
2,
Carmen Recondo
1 and
Susana Fernández
3
1
Remote Sensing Applications (RSApps) Research Group, Department of Mining Exploitation and Prospecting, University of Oviedo, 33600 Mieres, Spain
2
Remote Sensing Applications (RSApps) Research Group, Department of Physics, University of Oviedo, 33007 Oviedo, Spain
3
Mathematical Modelling (MOMA) Research Group, Department of Geology, University of Oviedo, 33005 Oviedo, Spain
*
Author to whom correspondence should be addressed.
Remote Sens. 2021, 13(12), 2357; https://doi.org/10.3390/rs13122357
Submission received: 11 May 2021 / Revised: 9 June 2021 / Accepted: 13 June 2021 / Published: 16 June 2021
(This article belongs to the Special Issue Estimating Meteorological Variables by Remote Sensing Data)

Abstract

:
Although extensive research of Moderate Resolution Imaging Spectroradiometer (MODIS) albedo data is available on the Greenland Ice Sheet, there is a lack of studies evaluating MODIS albedo products over Antarctica. In this paper, MOD10A1, MYD10A1, and MCD43 (C6) daily albedo products were compared with the in situ albedo data on Livingston Island, South Shetland Islands (SSI), Antarctica, from 2006 to 2015, for both all-sky and clear-sky conditions, and for the entire study period and only the southern summer months. This is the first evaluation in which MYD10A1 and MCD43 are also included, which can be used to improve the accuracy of the snow BRDF/albedo modeling. The best correlation was obtained with MOD10A1 in clear-sky conditions (r = 0.7 and RMSE = 0.042). With MCD43, only data from the backup algorithm could be used, so the correlations obtained were lower (r = 0.6). However, it was found that there was no significant difference between the values obtained for all-sky and for clear-sky data. In addition, the MODIS products were found to describe the in situ data trend, with increasing albedo values in the range between 0.04 decade−1 and 0.16 decade−1. We conclude that MODIS daily albedo products can be applied to study the albedo in the study area.

Graphical Abstract

1. Introduction

Albedo or bi-hemispherical reflectance is the ratio of the radiant flux reflected from a unit surface area into the whole hemisphere to the incident radiant flux of hemispherical angular extent [1]. The albedo analysis is of interest both to climatology in general [2] and to the climatology of polar areas in particular. Snow cover has a significant impact on the hydrological cycle during winter and spring on the Earth’s surface [3], mainly in the polar areas, where melting of the permafrost would lead to an increase in temperature due to the release of greenhouse gases [4]. However, the greater or lesser degree of surface melting is not only due to changes in temperature; an albedo increase would cause the snow to absorb a smaller amount of short-wave radiation, which would lead to a reduction in the energy available for melting [5]. It is known that variations in albedo are strongly related to the surface energy balance and the available melting energy [6,7,8,9]. Thus, albedo analysis in the polar areas is essential for the study of climate change.
Satellite observations are currently essential for observing the evolution of the albedo in polar areas, mainly in Antarctica, where, due to adverse weather conditions, the weather station network is not able to cover the entire territory. Thus, for example, Laine [10] used satellite data to analyze the albedo behavior in five sectors around Antarctica (the Weddell Sea, the Indian Ocean, the Pacific Ocean, the Ross Sea, and the Bellingshausen-Amundsen Sea) between 1981 and 2000, finding an increasing albedo trend during spring and summer seasons. Similarly, Seo et al. [11] studied the long-term variability of the albedo and its correlation with climate variables over this polar zone during the period from 1983 to 2009, and found different trends depending on the region: positive in the eastern zone, but negative in most of the west. Both studies were conducted with Advanced Very High Resolution Radiometer (AVHRR) data of 5 km spatial resolution. In addition, Calleja et al. [12] studied the albedo evolution on Livingston Island, South Shetland Islands (SSI) archipelago, using data from Moderate Resolution Imaging Spectroradiometer (MODIS) snow albedo daily product (MOD10A1) (C5; 500 m of spatial resolution) and in situ data. These authors described an increasing albedo trend during the study period (2006–2015) of 2% and 6%, in the in situ and MOD10A1 data, respectively.
The main advantage of the MODIS instrument, on board Terra and Aqua satellites, compared to other sensors with a higher spatial resolution, lies in its daily temporal resolution. In Antarctica, due to frequent cloudiness, it is very difficult to obtain cloud-free images with sensors or satellites of lower temporal resolution. In addition, MODIS data are provided from the years 2000/2002 (Terra/Aqua), allowing studies of the albedo variability in the last two decades. Terra’s orbit around the Earth passes from north to south across the equator in the morning (10:30 a.m. local time), and Aqua passes south to north over the equator in the afternoon (1:30 p.m. local time). Thus, three MODIS daily albedo products are currently provided: the BRDF/NBAR/Albedo product MCD43, whose albedo is obtained from surface reflectance data from Terra-MODIS and Aqua-MODIS, atmospherically corrected [13]; and two snow albedo products, i.e., MOD10A1 (Terra) and MYD10A1 (Aqua), whose algorithm has been described by Klein et al. [14,15], which are also atmospherically corrected [16,17,18]. All three products have a spatial resolution of 500 m.
The MODIS Terra snow albedo product has been used in numerous studies [19,20,21,22,23,24,25,26]. This product contains the black-sky albedo [18] or the directional hemispherical reflectance (DHR), defined by Schaepman-Strub et al. [1] as the ratio of the radiant flux for light reflected by a unit surface area into the view hemisphere to the illumination radiant flux, when the surface is illuminated with a parallel beam of light from a single direction:
DHR = 0 2 π 0 π / 2 f r θ i , i ; θ r , r cos θ r sin θ r d θ r d r ,
where DHR is the directional hemispherical reflectance, f r θ i , i ; θ r , r is the BRDF (Bidirectional Reflectance Distribution Function), θ i and i are the angles defining the incident radiation direction, and θ r and r give the direction of the reflected radiation. The MCD43 product provides, in addition to the black-sky albedo, the white-sky albedo [27]. The white-sky albedo is the bi-hemispherical reflectance (BHR) for pure diffuse isotropic radiation and is defined by Schaepman-Strub et al. [1] as:
BHR = 1 π 0 2 π 0 π / 2 ρ θ i i ; 2 π cos θ i sin θ i d θ i d i ,
where BHR is the bi-hemispherical reflectance for pure diffuse isotropic radiation and ρ is the reflectance. Therefore, when comparing in situ albedo with MODIS daily albedo products, it should be noted that the albedo provided by the pyranometers at the ground stations is the BHR. If the incident radiation is divided into direct and diffuse parts, and the diffuse part is assumed to be isotropic:
BHR = ρ d i r d + ρ d i f f 1 d ,
where ρ d i r is the DHR (black-sky albedo), d is the fractional amount of direct irradiance, and ρ d i f f is the BHR for pure diffuse isotropic radiation (white-sky albedo). For this reason, in this article, the albedo was analyzed for both all-sky conditions and clear-sky conditions.
In situ albedo is blue-sky albedo and, as such, it should be compared with MODIS blue-sky albedo. The calculation of the MODIS blue-sky albedo requires the calculation of d in Equation (3). According to Equation (3), in the special case that the direct albedo is equal to the diffuse albedo, we have BHR = ρ d i r = ρ d i f f . The relationship between ρ d i r and ρ d i f f has been studied for several surface types [28,29]. In general, the discrepancy between   ρ d i r and ρ d i f f increases with increasing solar zenith angle (SZA), due to the significant dependence of ρ d i r on the SZA, whereas ρ d i f f does not change with SZA. However, in the case of snow, the direct albedo is taken to be equal to the diffuse albedo for SZA < 60° [30], whereas for SZA > 60° the direct albedo is taken as Briegleb [29], and Wang and Zeng [30]:
ρ d i r = ρ d i f f + 0.5 1 ρ d i f f 3 1 + 4   cos SZA 1 .
In the case of the study area, SZA < 60° at local noon from September 30 until March 12 each year, which represents 74% of the total number of days considered in the study. This means that, for data between September 30 and March 12, we can take BHR = ρ d i r = ρ d i f f , i.e., WSA and BSA MODIS data can be compared to in situ data directly. From this range of dates, we can evaluate the difference between   ρ d i r and ρ d i f f as:
e = ρ d i r ρ d i f f ρ d i r
The value of e increases almost linearly with increasing SZA. The maximum value of e (emax) occurs for September 1 (SZA = 70.74° at local noon) and for April 10 (SZA = 70.84° at local noon). Taking typical values of snow for the diffuse albedo, we can calculate the corresponding ρ d i r using Equations (4) and the relative difference from Equation (5); we obtain emax = 0.06 (6%) for ρ d i f f = 0.7 and emax = 0.035 (3.5%) for ρ d i f f = 0.8. We consider that a direct comparison of in situ data with WSA and BSA separately is appropriate. This assumption is reinforced by the fact that BSA and WSA attain very similar values in the dates considered in the study. The calculation of MODIS blue-sky albedo, in the case of snow, would be relevant for SZA values above those considered in this work, or in cases in which MODIS albedo data is used in models requiring high-precision albedo values.
Several investigations have been carried out on the comparison between the results of the last two versions (collections) of the cited MODIS products: the previous collection 5 (C5) and the currently available collection 6 (C6), e.g., [31,32,33,34]. C6 of MOD10A1/MYD10A1 shows important changes compared to C5, including the replacement of the Fractional Snow Cover (no longer calculated) by the Normalized Difference Snow Index (NDSI) Snow Cover. In addition, snow detection errors have been reduced, and a new quality control bit flag has been implemented [35]. In the case of MCD43A3, its C5 provides images each 8 days over a composite period of 16 days [31]. In contrast, its C6 provides daily data, although it also uses the 16 day data, which are temporally weighted to the ninth day of the 16 day [13]. The improvements described above for the MODIS albedo products and, in general, the fact that C6 corrects the drift shown by the C5 data [32,34], makes it necessary to update the studies that were carried out C5, as suggested by Casey et al. [32], especially in the polar areas. Therefore, the aim of this work is to evaluate the albedo behavior on Livingston Island, Antarctica, based on data from MODIS C6 albedo products and to compare it with in situ albedo behavior, both for all-sky and clear-sky conditions. In addition, the results obtained from the MOD10A1 C6 albedo in this work were compared to those of the MOD10A1 C5 albedo, summarized in a previous study conducted by Calleja [12].
Following Section 1 (Introduction), in Section 2 (Materials and Methods) we describe the study area, the data used, and the methodology used to compare the MODIS albedo products with the in situ data. The results and discussion are provided in Section 3, and Section 4 presents the conclusions.

2. Materials and Methods

2.1. Study Area

The study area comprises Livingston Island, the second largest island in SSI, in the maritime Antarctica (Figure 1). Although in this island is the Byers Peninsula, the largest ice-free area in the archipelago [36], 90% of the island is covered by glaciers [37]. It is known that the decrease in albedo in the polar zones would have important consequences for the global energy balance on the Earth’s surface. For this reason, the use of satellite data with high temporal resolution is essential to obtain a systematic monitoring of the albedo in these areas, where it is difficult to obtain in situ data. However, there are still insufficient evaluations for Antarctica of MODIS products, which have been extensively evaluated in the Greenland ice sheet. In addition, the distribution of permafrost is complex in the South Shetland Islands [38]. It is therefore an area of special interest for the monitoring of climatological variables in the maritime Antarctic. Our study focuses on the Hurd Peninsula, where two ground stations of the Spanish Meteorological Agency (AEMET) are located (Table 1): the Juan Carlos I (JCI) station, near the Spanish Antarctic Base JCI, operative since 1987–1988, and the Johnson Glacier (JG) station, operative since December 2006 to February 2015 (Table 1). As can be seen in Figure 1 and Table 1, the study area is near 60° S, considered the cloudiest place in the southern hemisphere, with around 85–90% cloud cover throughout the year [39]. In the SSI archipelago, the persistence of cloudiness is related to the dynamic circulation of air masses and atmospheric fronts [40].

2.2. Data

2.2.1. In Situ Data

The in situ albedo data used in this work were obtained from the JG station, which provides albedo data every 10 minutes. Albedo was measured at JG using two Kipp–Zonen CNR-1 pyranometers, one for incident radiation (global and direct) and another for reflected radiation. The pyranometers are placed 3 m above the snow and they are replaced each two years with calibrated ones [12]. Direct and diffuse radiation were obtained from the JCI station, which provides values of diffuse radiation (measured with KIPP-ZONEN CM11 pyranometers) and direct radiation (measured with KIPP-ZONEN CH1 pyranometers) each ten minutes
To determine the cloudiness in the area and thus confirm whether MODIS errors in cloud detection affect albedo estimation, direct and diffuse radiation measurements are necessary. Knowing both radiations, the clearness index (clr) was calculated using JCI data as representative of the study area, as advised by specialists from the Antarctic AEMET stations [41].

2.2.2. MODIS Data

As stated in the introduction, the daily MODIS albedo products are MOD10A1, MYD10A1, and MCD43, all of which have a spatial resolution of 500 m. The data for these products were downloaded from the Google Earth Engine platform (http://earthengine.google.org) [42].
The snow albedo products, MOD10A1 (Terra) and MYD10A1 (Aqua), provide albedo values from the best daily observation [35]. C6 of both products consists of seven layers: NDSI_Snow_Cover, NDSI_Snow_Cover_Basic_QA, NDSI_Snow_Cover_Algorithm_Flags_QA, NDSI, Snow_Albedo_Daily_Tile, orbit_pnt, and granule_pnt. It is also important to note that, in C6, the Aqua band 6 data, defective in C5, has been restored and, therefore, constitutes scientifically valid data for the snow algorithm. Thus, the same algorithm is used for Terra and Aqua [35].
The MCD43A3 product provides black sky albedo (BSA), i.e., DHR, and white sky albedo (WSA), i.e., BHR, data for the MODIS bands 1 to 7, the visible (VIS), near infrared (NIR), and shortwave infrared (SWIR) bands [13]. MCD43A1 provides three model weighting parameters for MODIS spectral bands 1 through 7 [43]. MCD43A2 contains BRDF/Albedo band quality and days of valid observation within the 16 day period for MODIS bands 1 through 7 [44].
MOD09GA/MYD09GA (Terra/Aqua) C6 were used to check, by visual inspection, whether the day was classified as cloudy or clear, when in situ and MODIS albedo data were available but no direct/diffuse radiation data were available in JCI, which meant that the clr index could not be calculated. Visual inspection was used to detect cloud mask failures in MODIS products [41]. These products, also at a spatial resolution of 500 m, provide the atmospherically corrected surface spectral reflectance in bands 1–7 [45,46]. The RGB: 1–6–7 composition was used for the visualization, for which the central wavelength of these bands was 645, 1640, and 2130 nm, respectively. This composition is useful because it distinguishes the cloud pixels (in white) from the snow pixels (in red) [12,47].

2.3. Methods

2.3.1. Albedo Filtering

In the case of the in situ data, the daily albedo was obtained as the mean of the measurements satisfying the condition that the solar zenith angle (SZA) < 75°, using similar criteria to those of Stroeve et al. [48] and Wang and Zender [49]. In addition, it is known that at higher angles there are biases in the results [25,50]. Therefore, we excluded the data from May, June, July, and August from the study, because in these months SZA > 75°.
Pirazzini [51] also showed that SZA has a different impact on albedo, depending on the size of the grain and the type of snow (fresh or aged); and Yamanouchi [52] found that it has a strong dependence on eroded snow. In addition, Konzelmann [53] described that the maximum fresh snow albedo for clear-sky conditions is 0.84. Thus, albedo values greater than 0.84 were eliminated.
For the satellite data, in regards to MOD10A1 and MYD10A1, only the highest quality data (QA = 0) were used. Once this filter was applied, no data were obtained with SZA > 75°. MCD43, as explained in the previous section, did not have good quality data in the study area, so the SZA filter was applied, removing the data with SZA > 75°. Considering the albedo upper threshold, there is evidence of a positive bias in MODIS data above 0.84 [20]. The improved albedo products in MODIS C6 decreased the data variability and eliminated very low, clearly erroneous, values obtained in C5. However, very high values were found; thus, to follow the same criteria applied to the in situ data, albedo values higher than 0.84 in the C6 products were discarded in this work.
Furthermore, because snow metamorphism proceeds slowly in cold places such as Antarctica, we consider that there should be no sharp increases or decreases in the albedo, with the exception of snowfall episodes or windstorms [54]. Therefore, a moving average with a 3 day window was calculated, taking into account three consecutive dates of data (not necessarily three consecutive calendar dates), for all data after applying the SZA filter and eliminating values greater than 0.84. A small window was selected because it allows changes to be captured that could occur due to sudden snowfalls. Dates with unusually high absolute values of residues were analyzed ( 0.15 ) and the Square Mahalanobis Distance (SMD) was calculated as:
D 2 = x μ S 1 x μ ,
where x is the vector of albedo data, μ is mean vector, S is the covariance matrix, and x μ is the transpose of the vector. SMD accounts for the covariance of data, and indicates the distance from a point to a distribution in multidimensional space; its associated p-value was used to rule out outliers [55,56]. SMD, which allows anomaly detection, has been successfully used to process remote sensing time series, e.g., specifically MODIS [57] and image processing [58]. The SMD threshold was selected with three aspects in mind: first, to retain as much of the dataset as possible; second, to ensure that outliers did not introduce bias into the data analysis; and, finally, to set the same threshold for all MODIS products. Therefore, the mean of SMD standard deviation (s) of all MODIS albedo products was calculated and values exceeding 1.5 s (SMD > 4) and whose associated p-value ≤ 0.05 were considered outliers and rejected. The statistical test s was applied to establish thresholds for data selection in remote sensing [20,32,59,60].

2.3.2. Clearness Index (clr)

The clearness (or cloud) index was calculated from Equation (7), following to Wang and Zender [49], who obtained it from a simplified test of normalized fuzzy ratio variability of clear sky [61]:
clr = D I R D I R + D I F   ,
where clr is the clearness index, which varies in a range from 0 (cloudy sky) to 1 (clear sky), although normally its values are below 0.95 due to the influence of atmospheric aerosols. Days with clr < 0.3 are defined as overcast. DIR is direct radiation and DIF is diffuse radiation. The daily mean clr was calculated using only those data with SZA < 75° for the reasons mentioned in Section 2.3.1, to ensure that the clr value was not affected by measurements that did not satisfy the criteria selected for this work. The value of this index for cloudy days and clear days was then used to analyze the MOD10A1, MYD10A1, and MCD43 product data. When there was no radiation data but MODIS data were available, a visual inspection was performed to determine if the day was clear. This information improved data availability, which is often a problem in the area of study. Thus, it is important to incorporate as many data as possible to assess the correlation of MODIS albedo products with in situ data in our area.

2.3.3. MCD43 Data Processing

In the study area, only backup algorithm retrievals were obtained, due to the abundant cloudiness. This algorithm is based on a land cover classification and high quality data from MODIS full inversion BRDF retrievals from a previous year to estimate the surface BRDF. Although the values obtained by the backup algorithm are classified as low quality, they are sometimes as good as those obtained at the dates when the full inversion occurs [25,50,62,63]. Where full recovery cannot be obtained due to insufficient or poor sampling or inadequate adjustment, a backup method using available observations is applied [64]. Following these criteria, the backup algorithm was not excluded.
To be able to obtain albedo data comparable with that of other MODIS products and with in situ data, it was necessary to carry out the narrow to broadband conversion. First, all data were processed. Although Liang [65] presented an algorithm for the conversion of narrow to broadband albedo and showed that it could be applied to a large part of the land cover, in this work, Equation (8) proposed by Stroeve et al. [50] was used because it was designed specifically for snow cover:
α = 0.0093 + 0.1574 b 1 + 0.2789 b 2 + 0.3829 b 3 + 0.1131 b 5 + 0.0694 b 7 ,
where α is the shortwave broadband albedo and b is the MODIS narrowband albedo for the specified MODIS spectral bands.

2.3.4. Albedo Trend

To calculate the albedo trend, locally weighted scatterplot smoothing (LOWESS) [66,67] was applied to the already filtered data of the months of January, February, and March of each year for all-sky conditions. It is calculated for the summer months in the southern hemisphere to avoid seasonal influences. This robust statistical method, which is usually applied to high-dispersion datasets, in addition to showing the trend in the long-term data, allows the effects of outliers to be minimized. LOWESS has multiple applications, including noise reduction in satellite-derived measurements [68]. The method is based on the adjustment of points from a polynomial regression in which the closest points have the greatest weight in the estimation of the regression. In this case, a value of 2/3 was assigned to the smoother span to prevent widely separated data from influencing each other. Using the LOWESS albedo values, albedo increases per day were obtained by linear regression, and then converted to values per decade.

3. Results and Discussion

3.1. Albedo Trend

This section shows the results of the albedo trend, analyzed with the austral summer data (J–F–M) during the whole study period. Only these months were selected to avoid biases caused by seasonal variations and also because data availability is highly variable in the remaining months. Although MODIS describes the temporal evolution of the in situ data, a greater dispersion in the satellite data was observed, as already referred to by, among other authors, Stroeve et al. [25] for Greenland and Calleja et al. [12] for our study area. It has been shown that the best results with MODIS are obtained after the application of filters that correct for the increase in temporal variability with respect to in situ data, described among others by Calleja et al. [12], Stroeve et al. [25], and Box et al. [20].
Figure 2 shows in situ albedo values, MOD10A1, MYD10A1, and MCD43 (BSA and WSA) for J–F–M. As can be seen, the distribution of the in situ data values is much more homogeneous than in the MODIS products, where extremely low values are observed. An increasing trend in albedo has been documented for the study area in the study period (2006–2015) based on data from MOD10A1 C5 and in situ data [12]. With C6 data, in all cases, there is an increasing trend. Table 2 shows the intercept of the albedo linear fit and the daily increment values (slope) for the in situ data (0.0000090), MOD10A1 (0.000035), MYD10A1 (0.000022), MCD43 BSA (0.0000428), and MCD43 WSA (0.0000420). The largest increases in MODIS are observed in the MCD43 products, both BSA and WSA, which represent an increase of 0.16 decade−1 and 0.15 decade−1, respectively, whereas the MOD10A1 and MYD10A1 values are smaller (0.12 decade−1 and 0.09 decade−1, respectively), although they continue to be above that of in situ data (0.04 decade−1). We also observed that the data source with the greatest dispersion with respect to in situ data is MCD43. This albedo increase could be related to several factors. In the Bellingshausen and Marsh stations of the SSI archipelago, a decreasing annual temperature trend has been described for the period 2006–2015 (−0.065 and −0.022 °C per year, respectively) [69]. This local cooling effect in the region was also documented by Plenzler et al. [70], who found in the vicinity of Arctowski Station a decrease in air temperature during summer 2013–2017. By comparison, a positive trend in the accumulation of snow and ice and an increase in the thickness of the snow cover at locations on Livingston Island have been described between 2008 and 2016 [71].
However, these arguments justify the increase in all data sources, but not the greater increase of MODIS with respect to the in situ data nor the greater dispersion observed in the first years of the study period. A dominant component of this error has been found to be the failure of MODIS to completely eliminate the effects of clouds, e.g., thin clouds and cloud edges [20]. These artefacts create abrupt variations in the surface albedo time series [59], and introduce both overestimation errors, partially eliminated here with the elimination of albedo values greater than 0.84, and underestimation errors. It should be taken into account that the study area pixel is covered by snow all year round, which would not justify very low albedo values. Furthermore, it has been documented that at latitudes poleward of 60° S, the predominant cloud type is stratus [72], which is associated with the large number of depressions at this latitude [40]. Specifically, Angiel et al. [40] measured cloudiness using 0–8 octa cloud cover at the Arctowski station, in SSI for 2006, and they found that low-level stratocumulus and stratus clouds dominated the cloud cover structure. This could justify the low albedo values found, because stratus clouds have been associated with albedo values close to 0.5 [73], which is consistent with the albedo values reflected by MODIS on cloudy days, and specifically on the date (12/01/2007) shown in Figure 3a (in situ = 0.73, MOD10A1 = 0.63, MYD10A1 = 0.63, MCD43 WSA = 0.59, and MCD43 BSA = 0.58). By comparison, Figure 3b shows the albedo values for a clear day (07/03/2013), in which the MODIS values are very close to the in situ albedo values (in situ = 0.70, MOD10A1 = 0.67, MCD43 WSA = 0.67, and MCD43 BSA = 0.67). Therefore, we think that the presence of cloud cover could be one of the factors that increases the gap between in situ albedo and several MODIS albedo products. For example, if we analyze the total number of cloudy days in the months of January, February, and March used to calculate the trend (Figure 4), we find that 19.8% of the total number of cloudy days correspond to the year 2007, whereas in 2014 and 2015, this proportion does not exceed 5%. Despite these differences, it is important to highlight that the MODIS products track the long-term trend of the in situ data in the study area, as found for the MOD10A1 (C5) product by Calleja et al. [12]

3.2. Correlation between MOD10A1, MYD10A1 and MCD43 (BSA and WSA) with In-Situ Data

In this section, the MODIS albedo values are compared with the in situ albedo values, both for all-sky and clear-sky conditions, with all available data and also for the J–F–M data, after all filters were applied. Although many authors have described the correlation between MODIS albedo data and in situ data in the Greenland ice sheet, the relationship between both types of data in our study area in terms of correlation has not been described to date. However, the MOD10A1 product has been shown to track the trend of in situ data. Figure 5 and Figure 6 show the correlations between the different MODIS products and the in situ data for all-sky and clear-sky conditions. Table 3 and Table 4 show the statistics of the differences between MOD10A1, MYD10A1, and MCD43 (BSA and WSA) versus the in situ data in both periods, for all sky (Table 3) and for clear sky (Table 4).
The results of this work show that the MODIS product that best reflects the behavior of the in situ data for the study area is MOD10A1. High values of the correlation coefficient (r) have also been found between MOD10A1 and the Greenland in situ data obtained by Box et al. [20], for the summer months in the range of 0.92 to 0.97; these values were higher than those obtained in our work for all sky (0.5) and for clear sky (0.7). The remainder of the MODIS products analyzed in our work show greater discrepancies with the automatic weather station (AWS) data. As mentioned in Section 2.1, the study area is characterized by abundant cloud cover. It is known that the physical properties of clouds, e.g., water content, are factors that can also influence cloud albedo [68]. In these cases, when the MODIS cloud mask fails, the products could be assuming that cloud albedo values are snow albedo. As an example, Figure 7 shows an abundance of clouds over Livingston Island and its surroundings. These images correspond to dates when the MODIS cloud mask failed and MODIS albedo values were given. This would explain in many cases the low values mentioned above. In addition, on clear days, MODIS sometimes underestimates the albedo, which could be due to the fact that the satellite-measured clear-sky snow albedo is generally lower than the in situ measured clear-sky snow albedo [46]. For example, the dates 09/03/2008 and 07/03/2013 correspond to clear sky. However, MOD10A1 reports albedo values of 0.53 and 0.55, lower than in situ values of 0.68 and 0.70, respectively. MYD10A1 shows values of 0.49 and 0.6, compared to the in situ albedo of 0.74 and 0.75, respectively, on 21/12/2014 and 17/01/2009; both of these days had a clear sky. In addition, the product MCD43 shows on clear-sky days some values lower than the field measurements: 0.45 (BSA) and 0.46 (WSA) versus 0.66 (in situ), and 0.50 (BSA and WSA) versus 0.78 (in situ), on 16/02/2007 and 20/10/2008, respectively.
Our data show an RMSE value for MOD10A1 clear sky in the summer months that is slightly higher (0.046) than the average obtained by Box et al. [20] for June, July, and August (0.041) although for all clear-sky data we obtained a similar value of 0.042. In spite of this, the bias of MOD10A1—in situ data is low, between 0.001 (for all sky, all dates) and −0.001 and −0.005 for clear sky, for all dates and for J–F–M, respectively. For all-sky conditions, MYD10A1 shows a value of r = 0.4, which shows a poor agreement between this product and the in situ data. It should be noted that MODIS Aqua had problems on band 6, which were corrected for in C6 [35]. However, the results are worse than those obtained with MOD10A1.
For clear-sky conditions, most MODIS products improve the correlation with the in situ data, specifically MOD10A1, which reaches a value of r = 0.7, slightly lower than that indicated by Stroeve et al. [25] with the data from five stations of the Greenland station network (0.79 for MOD10A1). However, there are no major differences with the results obtained in our study for all sky. In addition, low biases are observed in the values of all MODIS products, both for clear days and for all-sky conditions. This reinforces the idea that, at least for our study area, it is possible to use the MODIS albedo for all-sky conditions, as already tested in Calleja et al. [12], which would allow a larger number of data to be available without large differences with the clear-sky data. In addition, although r values may sometimes be worse than expected, as indicated in the previous section, MODIS products follow the in situ data trend. As discussed in the previous section, the cloudiness in the study area is a major problem for the availability of satellite data on clear days, so using all data is a significant advantage.
Regarding MCD43, close values of r were obtained in the summer months for all-sky conditions and for clear sky (0.5–0.6, respectively). The RMSE varied between 0.07 and 0.05, for all sky and clear sky, respectively. These values are higher than those obtained by Wang et al. [74], who described that MCD43 estimates the snow albedo with an average RMSE of 0.04 in Greenland. Our RMSE values for clear sky are similar to those obtained by Tedesco et al. [22] with GLASS surface albedo product data, derived from a combination of data collected by the AVHRR and MODIS, (0.048, June; 0.0455, July; 0.05, August). As can be seen in Table 4, the RMSE values improved on clear-sky days, between 0.053–0.052 (BSA, for all clear-sky data and for J–F–M, respectively) and 0.051 (WSA, for all dates and for J–F–M). However, for all-sky and clear-sky conditions, our RMSE is lower than that obtained by Stroeve et al. [50] for most of their stations, at one of which it reached an RMSE value of 0.129. It must be taken into account that all the data we obtained for the study area correspond to the backup algorithm. This lack of maximum quality data is probably due to the low percentage of total inversion data in MCD43 C6 at latitudes between 50 and 70° S, as described Wang et al. [31], which provide a percentage of total inversion of 5.5. In addition, several authors [74,75] have recognized that there are still uncertainties in snow albedo recovery, and that it remains an objective to model snow BRDF with very high accuracy from satellite data due to the difficulties of MODIS to detect clouds and factors such as atmospheric correction. Furthermore, although the Ross Thick–Li Sparse Reciprocal (RTLSR) model is able to describe the reflectance anisotropy of a large variety of global land covers [74], the underestimation of albedo compared to in situ albedo measurements may be caused by the operational MODIS BRDF/Albedo algorithm in the MCD43 product, which may not be appropriate for modeling snow BRDFs, as some authors have indicated [76,77,78]. This underestimation of snow albedo has also been described for ephemeral snow with the BRDF/standard albedo product from MODIS (C5) [75].
Regarding the comparison of in situ data with MODIS WSA and BSA, it is worth noting that the correction introduced by calculating the blue-sky albedo with Equation (3) would be a minor. We note that the difference between MODIS BSA and MODIS WSA products is small and increases with increasing SZA. Effectively, MODIS BSA and WSA attain the same value on 24.3% of the total number of days. The relative error between BSA and WSA ( e calculated with Equation (5)) does not exceed 0.01 (1%) on 41% of the total number of days, and on 96.5% of the days it is less than or equal to 3%. We calculated e for days with SZA < 60° and days with SZA > 60° separately. The reason for this partitioning was explained above. Although the mean value of e for all the days is e ¯ = 0.016 (1.6%), the mean value for days with SZA < 60° is e ( S Z A < 60 ° ) ¯   = 0.014 (1.4%), and for the days with SZA > 60° is e ( S Z A > 60 ° )   ¯ = 0.022 (2.2%). The maximum value is e m a x = 0.055 (5.5%), attained on April 9 2013, a value close to the theoretical predictions using Equation (4). In addition, a simple calculation demonstrates that the relative difference between MODIS blue-sky albedo (BHR), and MODIS BSA ( ρ d i r ) and MODIS WSA ( ρ d i f f ), is always smaller than   e . Effectively, it is easy to demonstrate from Equation (3) that, for a given value of d , we have:
e BHR , ρ d i f f = BHR ρ d i f f ρ d i f f = d ρ d i r ρ d i f f ρ d i f f d ρ d i r ρ d i f f ρ d i r = d e
e BHR , ρ d i r = BHR ρ d i r ρ d i r = 1 d ρ d i f f ρ d i r ρ d i r = 1 d e
It is obvious from Equations (9) and (10) that e (BHR, ρdiff) < e, and e (BHR, ρdir) < e for any value of d . According to the values given above, the mean relative error when taking either MODIS BSA or MODIS WSA for MODIS blue-sky albedo is below 1.6% for all the days, below 1.4% for SZA < 60°, and below 2.2% for SZA > 60°. We conclude that the values of BSA and WSA are very close to each other. When BSA and WSA are nearly identical they approach the blue-sky albedo, and can be compared with the albedo measured in situ [50].
In general, for all MODIS albedo products, the correlation improves in the years in which the mass balance in Hurd Glacier was negative, from 2002 to 2007 according to Sancho et al. [71] (for our study period the years 2006 and 2007 were considered). Values between r = 0.6 (MOD10A1, MYD10A1, and BSA) and r = 0.7 (WSA) for all 2006–2007 data, under all-sky conditions, and, except for MYD10A1 (r = 0.5), up to 0.9 for all other MODIS products in clear sky, were obtained. Recent studies have found, when analyzing the relationship between the minimum albedo averaged over glacier (AMAAG) using MODIS data and glacier-wide annual mass balance (Ba), that the agreement is better for negative mass balance years [21]. This is consistent with the best correlations between the MODIS albedo and the in situ data obtained in 2006 and 2007.

4. Conclusions

This paper shows that albedo products of the MODIS sensor from the C6 data can be used to estimate the albedo for all-sky and clear-sky conditions on Livingston Island, Antarctica. Given the high cloud cover conditions affecting latitudes poleward of 60° S, it is necessary to evaluate data from satellites/sensors with high temporal resolution, and, consequently, this evaluation can be of interest to improve the accuracy of the snow BRDF/albedo modeling.
It was found that all MODIS albedo products describe an increasing trend in albedo in the study period (2006–2015), consistent with the results of previous investigations. This also corroborates the results obtained with the in situ data, although when there is a higher percentage of cloudy days (19.8% in 2007, and 14% in 2009 and 2012), MODIS albedo values are, generally, lower than in situ albedo values.
The best correlation of the MODIS albedo with the in situ albedo was obtained with the MOD10A1 product for clear days. However, few differences were found between the results obtained for all-sky conditions and those obtained for clear days. Although the MYD10A1 albedo and that provided by the MCD43 product (BSA and WSA) show a worse agreement with the in situ data, they follow the albedo trend measured in the AWS. Furthermore, it should be noted that the MCD43 product only has backup algorithm values in the study area. In summary, we found that cloud cover causes a greater dispersion in MODIS data compared to in situ data, in addition to an underestimation of albedo. Future improvements in snow albedo estimation from satellites should pay particular attention to the distinction between snow and thin clouds, and to the detection of snow edges. Improvements can be made to the cloud mask algorithms and data filtering. In future research, we intend to describe the albedo behavior at other sites in the archipelago and to obtain an algorithm that will allow us to relate MODIS data to in situ data incorporating other variables, such as temperature.

Author Contributions

Conceptualization, A.C.-P. and J.F.C.; methodology, A.C.-P.; software, A.C.-P.; validation, A.C.-P., J.F.C. and S.F.; formal analysis, A.C.-P., J.F.C. and C.R.; investigation, A.C.-P. and J.F.C.; data curation, A.C.-P.; writing—original draft preparation, A.C.-P.; writing—review and editing, A.C.-P., J.F.C. and C.R.; supervision, J.F.C. and C.R.; project administration, J.F.C. and C.R.; funding acquisition, C.R. All authors have read and agreed to the published version of the manuscript.

Funding

This work was funded by the Spanish Ministry of Economy, project PERMASNOW (CTM2014-52021-R). The Remote Sensing Applications (RSApps) Research Group (GR-2016-0005) was funded by the University of Oviedo, Spain. A. Corbea-Pérez acknowledges funding from the Ph.D. Grants: “Severo Ochoa” from the Government of the Principality of Asturias [BP17-151] and “Predoctoral Grant” from the University of Oviedo.

Data Availability Statement

MODIS data are available in the Google Earth Engine platform (http://earthengine.google.org).

Acknowledgments

The authors would like to thank the Spanish Meteorological Agency (AEMET) for providing the in-situ radiation and albedo data from the Automatic Weather Stations.

Conflicts of Interest

The authors declare no conflict of interest. The funders had no role in the design of the study; in the collection, analyses, or interpretation of data; in the writing of the manuscript, or in the decision to publish the results.

References

  1. Schaepman-Strub, G.; Schaepman, M.E.; Painter, T.H.; Dangel, S.; Martonchik, J.V. Reflectance quantities in optical remote sensing—Definitions and case studies. Remote Sens. Environ. 2006, 103, 27–42. [Google Scholar] [CrossRef]
  2. Robock, A. The seasonal cycle of snow cover, sea ice and surface albedo. Mon. Weather. Rev. 1980, 108, 267–285. [Google Scholar] [CrossRef]
  3. Dozier, J.; Painter, T.H.; Rittger, K.; Frew, J.E. Time-space continuity of daily maps of fractional snow cover and albedo from MODIS. Adv. Water Resour. 2008, 31, 1515–1526. [Google Scholar] [CrossRef]
  4. Moritz, R.E.; Bitz, C.M.; Steig, E.J. Dynamics of Recent Climate Change in the Arctic. Science 2002, 297, 1497–1502. [Google Scholar] [CrossRef] [Green Version]
  5. Picard, G.; Fily, M.; Gallee, H. Surface melting derived from microwave radiometers: A climatic indicator in Antarctica. Ann. Glaciol. 2007, 46, 29–34. [Google Scholar] [CrossRef] [Green Version]
  6. Marshall, S.J.; Miller, K. Seasonal and interannual variability of melt-season albedo at Haig Glacier, Canadian Rocky Mountains. Cryosphere 2020, 14, 3249–3267. [Google Scholar] [CrossRef]
  7. Reijmer, C.H.; Knap, W.H.; Oerlemans, J. The Surface Albedo of The Vatnajökull Ice Cap, Iceland: A Comparison Between Satellite-Derived and Ground-Based Measurements. Bound. Layer Meteorol. 1999, 92, 123–143. [Google Scholar] [CrossRef]
  8. Ming, J.; Wang, Y.; Du, Z.; Zhang, T.; Guo, W.; Xiao, C.; Xu, X.; Ding, M.; Zhang, D.; Yang, W. Widespread Albedo Decreasing and Induced Melting of Himalayan Snow and Ice in the Early 21st Century. PLoS ONE 2015, 10, 1–13. [Google Scholar] [CrossRef] [Green Version]
  9. Ebrahimi, S.; Marshall, S.J. Surface energy balance sensitivity to meteorological variability on Haig Glacier, Canadian Rocky Mountains. Cryosphere 2016, 10, 2799–2819. [Google Scholar] [CrossRef] [Green Version]
  10. Laine, V. Antarctic ice sheet and sea ice regional albedo and temperature change, 1981–2000, from AVHRR Polar Pathfinder data. Remote Sens. Environ. 2008, 112, 646–667. [Google Scholar] [CrossRef]
  11. Seo, M.; Kim, H.-C.; Huh, M.; Yeom, J.-M.; Lee, C.S.; Lee, K.-S.; Choi, S.; Han, K.-S. Long-Term Variability of Surface Albedo and Its Correlation with Climatic Variables over Antarctica. Remote Sens. 2016, 8, 981. [Google Scholar] [CrossRef] [Green Version]
  12. Calleja, J.F.; Corbea-Pérez, A.; Fernández, S.; Recondo, C.; Peón, J.; de Pablo, M.Á. Snow Albedo Seasonality and Trend from MODIS Sensor and Ground Data at Johnsons Glacier, Livingston Island, Maritime Antarctica. Sensors 2019, 19, 3569. [Google Scholar] [CrossRef] [PubMed] [Green Version]
  13. Schaaf, C.; Wang, Z. MCD43A3 MODIS/Terra+Aqua BRDF/Albedo Daily L3 Global - 500m V006 [Data Set]. 2015. Available online: https://doi.org/10.5067/MODIS/MCD43A3.006 (accessed on 24 April 2021).
  14. Klein, A.G.; Hall, D.K.; Nolin, A.W. Development of a prototype snow albedo algorithm for the NASA MODIS instrument. In Proceedings of the Eastern Snow Conference, 57th Annual Meeting, Syracuse, NY, USA, 17–19 May 2000; pp. 143–157. [Google Scholar]
  15. Klein, A.G.; Hall, D.K. Snow albedo determination using the NASA MODIS instrument. In Proceedings of the Eastern Snow Conference, 55th Annual Meeting, Fredericton, NB, Canada, 2–4 June 1999; pp. 77–85. [Google Scholar]
  16. Hall, D.K.; Riggs, G.A. MODIS/Terra Snow Cover Daily L3 Global 500m SIN Grid, Version 6. [MOD10A1]; NASA National Snow and Ice Data Center Distributed Active Archive Center: Boulder, Colorado USA, 2016. Available online: https://doi.org/10.5067/MODIS/MOD10A1.006 (accessed on 24 April 2021).
  17. Hall, D.K.; Riggs, G.A. MODIS/Aqua Snow Cover Daily L3 Global 500m SIN Grid, Version 6. [MYD10A1]; NASA National Snow and Ice Data Center Distributed Active Archive Center: Boulder, Colorado USA, 2016. Available online: https://doi.org/10.5067/MODIS/MYD10A1.006 (accessed on 24 April 2021).
  18. Klein, A.G.; Stroeve, J. Development and validation of a snow albedo algorithm for the MODIS instrument. Ann. Glaciol. 2002, 34, 45–52. [Google Scholar] [CrossRef] [Green Version]
  19. Hall, D.K.; Cullather, R.I.; Di Girolamo, N.E.; Comiso, J.C.; Medley, B.C.; Nowicki, S.M. A Multilayer Surface Temperature, Surface Albedo, and Water Vapor Product of Greenland from MODIS. Remote Sens. 2018, 10, 555. [Google Scholar] [CrossRef] [Green Version]
  20. Box, J.E.; Fettweis, X.; Stroeve, J.C.; Tedesco, M.; Hall, D.K.; Steffen, K. Greenland ice sheet albedo feedback: Thermodynamics and atmospheric drivers. Cryosphere 2012, 6, 821–839. [Google Scholar] [CrossRef] [Green Version]
  21. Brun, F.; Dumont, M.; Wagnon, P.; Berthier, E.; Azam, M.F.; Shea, J.M.; Sirguey, P.; Rabatel, A.; Ramanathan, A. Seasonal changes in surface albedo of Himalayan glaciers from MODIS data and links with the annual mass balance. Cryosphere 2015, 9, 341–355. [Google Scholar] [CrossRef] [Green Version]
  22. Tedesco, M.; Doherty, S.; Fettweis, X.; Alexander, P.; Jeyaratnam, J.; Stroeve, J. The darkening of the Greenland ice sheet: Trends, drivers, and projections (1981–2100). Cryosphere 2016, 10, 477–496. [Google Scholar] [CrossRef] [Green Version]
  23. Moustafa, S.E.; Rennermalm, A.K.; Román, M.O.; Wang, Z.; Schaaf, C.B.; Smith, L.C.; Koenig, L.S.; Erb, A. Evaluation of satellite remote sensing albedo retrievals over the ablation area of the southwestern Greenland ice sheet. Remote Sens. Environ. 2017, 198, 115–125. [Google Scholar] [CrossRef]
  24. Burakowski, E.A.; Ollinger, S.V.; Lepine, L.; Schaaf, C.B.; Wang, Z.; Dibb, J.E.; Hollinger, D.Y.; Kim, J.H.; Erb, A.; Martin, M. Spatial scaling of reflectance and surface albedo over a mixed-use, temperate forest landscape during snow-covered periods. Remote Sens. Environ. 2015, 158, 465–477. [Google Scholar] [CrossRef]
  25. Stroeve, J.C.; Box, J.E.; Haran, T. Evaluation of the MODIS (MOD10A1) daily snow albedo product over the Greenland ice sheet. Remote Sens. Environ. 2006, 105, 155–171. [Google Scholar] [CrossRef]
  26. Calleja, J.F.; Muniz, R.; Fernandez, S.; Corbea-Perez, A.; Peon, J.; Otero, J.; Navarro, F. Snow Albedo Seasonal Decay and Its Relation with Shortwave Radiation, Surface Temperature and Topography Over an Antarctic ICE Cap. IEEE J. Sel. Top. Appl. Earth Obs. Remote Sens. 2021, 14, 2162–2172. [Google Scholar] [CrossRef]
  27. Schaaf, C.B.; Gao, F.; Strahler, A.H.; Lucht, W.; Li, X.; Tsang, T.; Strugnell, N.C.; Zhang, X.; Jin, Y.; Muller, J.-P.; et al. First operational BRDF, albedo nadir reflectance products from MODIS. Remote Sens. Environ. 2002, 83, 135–148. [Google Scholar] [CrossRef] [Green Version]
  28. Yang, F.; Mitchell, K.; Hou, Y.-T.; Dai, Y.; Zeng, X.; Wang, Z.; Liang, X.-Z. Dependence of Land Surface Albedo on Solar Zenith Angle: Observations and Model Parameterization. J. Appl. Meteorol. Clim. 2008, 47, 2963–2982. [Google Scholar] [CrossRef] [Green Version]
  29. Briegleb, B.P. Delta-Eddington approximation for solar radiation in the NCAR community climate model. J. Geophys. Res. Space Phys. 1992, 97, 7603–7612. [Google Scholar] [CrossRef]
  30. Wang, Z.; Zeng, X. Evaluation of Snow Albedo in Land Models for Weather and Climate Studies. J. Appl. Meteorol. Clim. 2010, 49, 363–380. [Google Scholar] [CrossRef]
  31. Wang, Z.; Schaaf, C.B.; Sun, Q.; Shuai, Y.; Román, M.O. Capturing rapid land surface dynamics with Collection V006 MODIS BRDF/NBAR/Albedo (MCD43) products. Remote Sens. Environ. 2018, 207, 50–64. [Google Scholar] [CrossRef]
  32. Casey, K.A.; Polashenski, C.M.; Chen, J.; Tedesco, M. Impact of MODIS sensor calibration updates on Greenland Ice Sheet surface reflectance and albedo trends. Cryosphere 2017, 11, 1781–1795. [Google Scholar] [CrossRef] [Green Version]
  33. Lyapustin, A.; Wang, Y.; Xiong, X.; Meister, G.; Platnick, S.; Levy, R.; Franz, B.; Korkin, S.; Hilker, T.; Tucker, J.; et al. Scientific impact of MODIS C5 calibration degradation and C6+ improvements. Atmos. Meas. Tech. 2014, 7, 4353–4365. [Google Scholar] [CrossRef] [Green Version]
  34. Polashenski, C.M.; Dibb, J.E.; Flanner, M.G.; Chen, J.Y.; Courville, Z.R.; Lai, A.M.; Schauer, J.J.; Shafer, M.M.; Bergin, M.H. Neither dust nor black carbon causing apparent albedo decline in Greenland’s dry snow zone: Implications for MODIS C5 surface reflectance. Geophys. Res. Lett. 2015, 42, 9319–9327. [Google Scholar] [CrossRef] [Green Version]
  35. Riggs, G.; Hall, D. MODIS Snow Products Collection 6 User Guide. Natl. Snow Ice Data Cent. Distrib. Act. Arch. Cent. 2016, 6, 1–80. [Google Scholar]
  36. Björck, S.; Håkansson, H.; Zale, R.; Karlén, W.; Jönsson, B.L. A late Holocene lake sediment sequence from Livingston Island, South Shetland Islands, with palaeoclimatic implications. Antarct. Sci. 1991, 3, 61–72. [Google Scholar] [CrossRef] [Green Version]
  37. Vieira, G.; Lopez-Martinez, J.; Serrano, E.; Ramos, M.; Gruber, S.; Hauck, C.; Blanco, J.J. Geomorphological observations of permafrost and ground-ice degradation on Deception and Livingston islands, maritime Antarctica. In Proceedings of the 9th International Conference on Permafrost 2008, Fairbanks, AK, USA, 28 June–3 July 2008; American Society of Neuroradiology: Fairbanks, Alaska, 2008. [Google Scholar]
  38. Vieira, G.; Bockheim, J.; Guglielmin, M.; Balks, M.; Abramov, A.A.; Boelhouwers, J.; Cannone, N.; Ganzert, L.; Gilichinsky, D.A.; Goryachkin, S.; et al. Thermal state of permafrost and active-layer monitoring in the antarctic: Advances during the international polar year 2007–2009. Permafr. Periglac. Process. 2010, 21, 182–197. [Google Scholar] [CrossRef] [Green Version]
  39. King, J.C.; Turner, J. Antarctic Meteorology and Climatology; Cambridge University Press: Cambridge, UK, 1997. [Google Scholar]
  40. Angiel, P.J.; Potocki, M.; Biszczuk-Jakubowska, J. Weather Condition Characteristics at the H. Arctowski Station (South Shetlands, Antarctica) for 2006, in Comparison with Multi-Year Research Results. Misc. Geogr. 2010, 14, 79–89. [Google Scholar] [CrossRef] [Green Version]
  41. Bañón, M. Personal Communication; AEMET: Madrid, Spain, 2017. [Google Scholar]
  42. Gorelick, N.; Hancher, M.; Dixon, M.; Ilyushchenko, S.; Thau, D.; Moore, R. Google Earth Engine: Planetary-scale geospatial analysis for everyone. Remote Sens. Environ. 2017, 202, 18–27. [Google Scholar] [CrossRef]
  43. Schaaf, C.; Wang, Z. MCD43A1 MODIS/Terra + Aqua BRDF/Albedo Model Parameters Daily L3 Global—500 m V006 [Data Set]. NASA EOSDIS Land Processes DAAC. Available online: https://doi.org/10.5067/MODIS/MCD43A1.006 (accessed on 25 April 2021).
  44. Schaaf, C.; Wang, Z. MCD43A2 MODIS/Terra + Aqua BRDF/Albedo Quality Daily L3 Global—500 m V006 [Data Set]. NASA EOSDIS Land Processes DAAC. Available online: https://doi.org/10.5067/MODIS/MCD43A2.006 (accessed on 25 April 2021).
  45. Vermote, E.; Wolfe, R. MOD09GA MODIS/Terra Surface Reflectance Daily L2G Global 1 km and 500 m SIN Grid V006 [Data Set]. Available online: https://doi.org/10.5067/MODIS/MOD09GA.006 (accessed on 26 January 2021).
  46. Vermote, E.; Wolfe, R. MYD09GA MODIS/Aqua Surface Reflectance Daily L2G Global 1 km and 500 m SIN Grid V006 [Data set]. NASA EOSDIS Land Processes DAAC. Available online: https://doi.org/10.5067/MODIS/MYD09GA.006 (accessed on 26 January 2021).
  47. Malik, M.J.; van der Velde, R.; Vekerdy, Z.; Su, Z. Assimilation of Satellite-Observed Snow Albedo in a Land Surface Model. J. Hydrometeorol. 2012, 13, 1119–1130. [Google Scholar] [CrossRef]
  48. Stroeve, J.; Box, J.E.; Wang, Z.; Schaaf, C.; Barrett, A. Re-evaluation of MODIS MCD43 Greenland albedo accuracy and trends. Remote Sens. Environ. 2013, 138, 199–214. [Google Scholar] [CrossRef]
  49. Wang, X.; Zender, C.S.S. Arctic and Antarctic diurnal and seasonal variations of snow albedo from multiyear Baseline Surface Radiation Network measurements. J. Geophys. Res. Space Phys. 2011, 116. [Google Scholar] [CrossRef] [Green Version]
  50. Stroeve, J.; Box, J.E.E.; Gao, F.; Liang, S.; Nolin, A.; Schaaf, C. Accuracy assessment of the MODIS 16-day albedo product for snow: Comparisons with Greenland in situ measurements. Remote Sens. Environ. 2005, 94, 46–60. [Google Scholar] [CrossRef]
  51. Pirazzini, R. Surface albedo measurements over Antarctic sites in summer. J. Geophys. Res. Earth Surf. Space Phys. 2004, 109. [Google Scholar] [CrossRef]
  52. Yamanouchi, T. Variations of Incident Solar Flux and Snow Albedo on the Solar Zenith Angle and Cloud Cover, at Mizuho Station, Antarctica. J. Meteorol. Soc. Jpn. 1983, 61, 879–893. [Google Scholar] [CrossRef] [Green Version]
  53. Konzelmann, T.; Ohmura, A. Radiative fluxes and their impact on the energy balance of the Greenland ice sheet. J. Glaciol. 1995, 41, 490–502. [Google Scholar] [CrossRef] [Green Version]
  54. Warren, S.G. Optical properties of snow. Rev. Geophys. 1982, 20, 67–89. [Google Scholar] [CrossRef]
  55. Mahalanobis, P.C. On the general distance in statistics. Natl. Inst. Sci. India 1936, 12, 49–55. [Google Scholar]
  56. De Maesschalck, R.; Jouan-Rimbaud, D.; Massart, D.L. The Mahalanobis distance. Chemom. Intell. Lab. Syst. 2000, 50, 1–18. [Google Scholar] [CrossRef]
  57. Kleynhans, W.; Salmon, B.P.; Wessels, K.J. A novel spatio-temporal change detection approach using hyper-temporal satellite data. In Proceedings of the 2014 IEEE Geoscience and Remote Sensing Symposium, Quebec City, QC, Canada, 13–18 July 2014; Institute of Electrical and Electronics Engineers (IEEE): Piscataway, NJ, USA, 2014; pp. 4208–4211. [Google Scholar]
  58. Zhang, Y.; Du, B.; Zhang, L.; Wang, S. A Low-Rank and Sparse Matrix Decomposition-Based Mahalanobis Distance Method for Hyperspectral Anomaly Detection. IEEE Trans. Geosci. Remote Sens. 2015, 54, 1376–1389. [Google Scholar] [CrossRef]
  59. Gunnarsson, A.; Gardarsson, S.M.; Pálsson, F.; Jóhannesson, T.; Sveinsson, Ó.G.B. Annual and inter-annual variability and trends of albedo of Icelandic glaciers. Cryosphere 2021, 15, 547–570. [Google Scholar] [CrossRef]
  60. Box, J.E.; van As, D.; Steffen, K.; Fausto, R.S.; AhlstrØm, A.P.; Citterio, M.; Andersen, S.B. Greenland, Canadian and Icelandic land-ice albedo grids (2000–2016). Geol. Surv. Den. Greenl. Bull. 2017, 38, 53–56. [Google Scholar] [CrossRef] [Green Version]
  61. Long, C.N.; Ackerman, T.P. Identification of clear skies from broadband pyranometer measurements and calculation of downwelling shortwave cloud effects. J. Geophys. Res. Space Phys. 2000, 105, 15609–15626. [Google Scholar] [CrossRef]
  62. Jin, Y.; Schaaf, C.B.; Woodcock, C.E.; Gao, F.; Li, X.; Strahler, A.H.; Lucht, W.; Liang, S. Consistency of MODIS surface bidirectional reflectance distribution function and albedo retrievals: 1. Validation. J. Geophys. Res. D Atmos. 2003, 108, 4158. [Google Scholar] [CrossRef]
  63. Jin, Y.; Schaaf, C.B.; Woodcock, C.E.; Gao, F.; Li, X.; Strahler, A.H.; Lucht, W.; Liang, S. Consistency of MODIS surface bidirectional reflectance distribution function and albedo retrievals: 2. Validation. J. Geophys. Res. Atmos. 2003, 108, 4159. [Google Scholar] [CrossRef] [Green Version]
  64. Strugnell, N.C.; Lucht, W.; Schaaf, C. A global albedo data set derived from AVHRR data for use in climate simulations. Geophys. Res. Lett. 2001, 28, 191–194. [Google Scholar] [CrossRef]
  65. Liang, S. Narrowband to broadband conversions of land surface albedo I: Algorithms. Remote Sens. Environ. 2000, 76, 213–238. [Google Scholar] [CrossRef]
  66. Cleveland, W.S. Robust Locally Weighted Regression and Smoothing Scatterplots. J. Am. Stat. Assoc. 1979, 74, 829–836. [Google Scholar] [CrossRef]
  67. Cleveland, W.S. LOWESS: A Program for Smoothing Scatterplots by Robust Locally Weighted Regression. Am. Stat. 1981, 35, 54. [Google Scholar] [CrossRef]
  68. Derkacheva, A.; Mouginot, J.; Millan, R.; Maier, N.; Gillet-Chaulet, F. Data Reduction Using Statistical and Regression Approaches for Ice Velocity Derived by Landsat-8, Sentinel-1 and Sentinel-2. Remote Sens. 2020, 12, 1935. [Google Scholar] [CrossRef]
  69. Oliva, M.; Navarro, F.J.; Hrbáček, F.; Hernández, A.; Nývlt, D.; Pereira, P.; Ruiz-Fernández, J.; Trigo, R. Recent regional climate cooling on the Antarctic Peninsula and associated impacts on the cryosphere. Sci. Total Environ. 2017, 580, 210–223. [Google Scholar] [CrossRef] [PubMed]
  70. Plenzler, J.; Budzik, T.; Puczko, D.; Bialik, R.J. Climatic conditions at Arctowski Station (King George Island, West Antarctica) in 2013–2017 against the background of regional changes. Pol. Polar Res. 2019, 40, 1–27. [Google Scholar] [CrossRef]
  71. Sancho, L.G.; Pintado, A.; Navarro, F.; Ramos, M.; de Pablo, M.A.; Blanquer, J.M.; Raggio, J.; Valladares, F.; Green, T.G.A. Recent Warming and Cooling in the Antarctic Peninsula Region has Rapid and Large Effects on Lichen Vegetation. Sci. Rep. 2017, 7, 5689. [Google Scholar] [CrossRef] [PubMed] [Green Version]
  72. Warren, S.G.; Hahn, C.J.; London, J.; Chervin, R.M.; Jenne, R.L. Global Distribution of Total Cloud Cover and Cloud Type Amounts Over Land. 1986. Available online: https://opensky.ucar.edu/islandora/object/technotes:444 (accessed on 11 May 2021).
  73. Griggs, M.; Griggs, M. Aircraft Measurements of Albedo and Absorption of Stratus Clouds, and Surface Albedos. J. Appl. Meteorol. 1968, 7, 1012–1017. [Google Scholar] [CrossRef] [Green Version]
  74. Wang, Z.S.; Schaaf, C.B.; Chopping, M.J.; Strahler, A.H.; Wang, J.; Román, M.O.; Rocha, A.V.; Woodcock, C.E.; Shuai, Y.M. Evaluation of Moderate-resolution Imaging Spectroradiometer (MODIS) snow albedo product (MCD43A) over tundra. Remote Sens. Environ. 2012, 117, 264–280. [Google Scholar] [CrossRef]
  75. Wang, D.; Liang, S.; He, T.; Yu, Y.; Schaaf, C.; Wang, Z. Estimating daily mean land surface albedo from MODIS data. J. Geophys. Res. Atmos. 2015, 120, 4825–4841. [Google Scholar] [CrossRef]
  76. Ding, A.; Jiao, Z.; Dong, Y.; Zhang, X.; Peltoniemi, J.I.; Mei, L.; Guo, J.; Yin, S.; Cui, L.; Chang, Y.; et al. Evaluation of the Snow Albedo Retrieved from the Snow Kernel Improved the Ross-Roujean BRDF Model. Remote Sens. 2019, 11, 1611. [Google Scholar] [CrossRef] [Green Version]
  77. Jiao, Z.; Ding, A.; Kokhanovsky, A.; Schaaf, C.; Bréon, F.-M.; Dong, Y.; Wang, Z.; Liu, Y.; Zhang, X.; Yin, S.; et al. Development of a snow kernel to better model the anisotropic reflectance of pure snow in a kernel-driven BRDF model framework. Remote Sens. Environ. 2019, 221, 198–209. [Google Scholar] [CrossRef]
  78. Qu, Y.; Liu, Q.; Liang, S.; Wang, L.; Liu, N.; Liu, S. Direct-Estimation Algorithm for Mapping Daily Land-Surface Broadband Albedo from MODIS Data. IEEE Trans. Geosci. Remote Sens. 2014, 52, 907–919. [Google Scholar] [CrossRef]
Figure 1. Study area. Left: South Shetland Islands (SSI) Archipelago and Livingston Island. Top right image: AEMET stations Juan Carlos I (JCI) and Johnson Glacier (JG).
Remotesensing 13 02357 g001
Figure 2. Albedo trend of the J–F–M period. The points represent the smoothed albedo data with the three-day moving average and the lines reflect the trend with the LOWESS values.
Remotesensing 13 02357 g002
Figure 3. Albedo values obtained in Johnson Glacier for a cloudy day (12/01/2007) ((a), left) and a clear day (07/03/2013) ((b), right) *. The in situ measurement value (purple circle), MOD10A1 (red circle), MYD10A1 (blue triangle), MCD43 BSA (green circle), and MCD43 WSA (turquoise triangle) are displayed. * No MYD10A1 data were available for the date shown in (b).
Remotesensing 13 02357 g003
Figure 4. Percentage of cloudy days in J–F–M with respect to the total number of cloudy days from 2007 to 2015.
Remotesensing 13 02357 g004
Figure 5. Albedo from the MODIS albedo products (from left to right, MOD10A1, MYD10A1, MCD43BSA, and MCD43WSA) for all-sky scatterplots, and both for all available data (upper) and for J–F–M (bottom), with 2006–2015 data. The regression data and other statistics are shown in Table 3.
Remotesensing 13 02357 g005
Figure 6. Albedo from the MODIS albedo products (from left to right, MOD10A1, MYD10A1, MCD43BSA, and MCD43WSA) for clear-sky scatterplots, and both for all available data (upper) and for J–F–M (bottom), with 2006–2015 data. The regression data and other statistics are shown in Table.
Remotesensing 13 02357 g006
Figure 7. MOD09GA RGB = 167 composites of Livingston Island. Images are projected in WGS84 UTM20S. These images correspond to days with albedo values despite the presence of clouds.
Remotesensing 13 02357 g007
Table 1. Location of the AEMET stations.
AEMET StationLatitudeLongitude
Juan Carlos I (JCI)62°39′48″S60°23′19″W
Johnson Glacier (JG)62°40′16″S60°21′51″W
Table 2. Slope and intercept values of the linear fit or the albedo trend versus time.
In-SituMOD10A1MYD10A1MCD43 (BSA)MCD43 (WSA)
Intercept0.7477 ± 0.00030.647 ± 0.003 0.654 ± 0.0030.6007 ± 0.00070.6064 ± 0.0006
Slope0.0000090 ± 0.0000002 0.000035 ± 0.0000020.000022 ± 0.0000020.0000428 ± 0.00000050.0000420 ± 0.0000004
p-value<0.001<0.001<0.001<0.001<0.001
Table 3. Statistics for all-sky conditions for all available data and for J–F–M, with 2006–2015 data.
MOD10A1
All Data
MOD10A1
J–F–M
Myd10a1
All Data
MYD10A1
J–F–M
MCD43 BSA
All Data
MCD43 BSA
J–F–M
MCD43 WSA
All Data
MCD43 WSA
J–F–M
r0.50.50.40.40.50.60.50.6
p value<0.001<0.001<0.001<0.005<0.001<0.001<0.001<0.001
n116999066403329403329
RMSE0.0600.0630.0480.0520.067−0.0660.0710.068
bias0.00010.00003−0.002−0.003−0.001−0.001−0.001−0.0003
Table 4. Statistics for clear-sky conditions for all available data and for J–F–M, with 2006–2015 data, * p-value non-significant.
MOD10A1
Clear Sky
MOD10A1
J–F–M
MYD10A1
Clear Sky
MYD10A1
J–F–M
MCD43 BSA
Clear Sky
MCD43 BSA
J–F–M
MCD43 WSA
Clear Sky
MCD43 WSA
J–F–M
r0.70.70.50.40.40.50.50.6
p value<0.001<0.005<0.050.15 *<0.005<0.001<0.001<0.001
n181315849404940
RMSE0.0420.0460.0380.0410.0530.0520.0510.051
bias−0.001−0.005−0.0004−0.005−0.001−0.001−0.001−0.0006
Publisher’s Note: MDPI stays neutral with regard to jurisdictional claims in published maps and institutional affiliations.

