Article

The Preliminary Study of Dust Devil Tracks in Southern Utopia Planitia, Landing Area of Tianwen-1 Mission

1
Shandong Provincial Key Laboratory of Optical Astronomy and Solar-Terrestrial Environment, Institute of Space Sciences, Shandong University, Weihai 264200, China
2
College of Geoexploration Science and Technology, Jilin University, Changchun 130000, China
3
Beijing Institute of Spacecraft System Engineering, Beijing 100094, China
*
Author to whom correspondence should be addressed.
Remote Sens. 2021, 13(13), 2601; https://doi.org/10.3390/rs13132601
Submission received: 15 May 2021 / Revised: 23 June 2021 / Accepted: 29 June 2021 / Published: 2 July 2021
(This article belongs to the Special Issue Planetary Remote Sensing: Chang’E-4/5 and Mars Applications)

Abstract

:
China’s first Mars exploration mission (Tianwen-1) landed on the southern part of Mars’ Utopia Planitia on 15 May 2021. The Zhurong rover will focus on high-resolution and in situ observations of key areas on the surface of Mars. Dust devils (DDs) are heat-driven vortices that lift material from the surface and inject it into the atmosphere. The dark or bright surface lineaments left by DDs are called dust devil tracks (DDTs). Dust devils can clear dust from solar panels deposited by gusts and dust storms. Therefore, it is of importance to study the encounter rates of dust devils at the Tianwen-1 landing site for achieving the rover’s long-term scientific goals. Based on High Resolution Imaging Science Experiment (HiRISE) and Context Camera (CTX) images, 248 newly formed DDTs in 12 image pairs were firstly identified, and their lengths, widths, and direction in the study area were measured. The distribution of their width frequency follows a −2 differential power law. Secondly, DDT formation rates were computed and analyzed with the range of 0.00006 to 0.1275 ddt km−2 sol−1, mainly affected by factors such as seasons and dust storm occurrence. Thirdly, the solar panel clearing recurrence interval derived from the orbital data in our study area was calculated from ~980 to 166,700 sols. The dust storm occurrence probability at the Tianwen-1 landing area is less than 3%, and there is a special anti-dust coating on board the Zhurong rover. Thus, the Zhurong rover can be considered competent for scientific exploration.

1. Introduction

Dust devils (DDs), common on Earth and Mars, are special rotating convective motions due to uneven local heating [1]. Now, the mainstream view is that near-surface air can be heated by the Sun, causing the warm air to rise and rotate, and the wind speed enhances under the conservation of angular momentum to form dust devils. Dust devils were imaged from space for the first time by the Viking Orbiter cameras [2], but the first image of them on the surface of Mars was taken by the Pathfinder lander more than ten years later [3]. Dust devil tracks (DDTs) are the dark or bright surface lineaments left by the passage of dust devils [4]. Greeley et al. (2005) proposed that the albedo difference between the track and its surroundings may be due to the larger particle sizes exposed within the track region, as brightness is photometrically inversely proportional to particle size [5]. Additionally, Reiss et al. (2010) thought that the formation of DDTs would have the same mechanism, that is, the removal of a thin layer of dust by suspension as well as downward infiltration makes the exposure of coarse particles greater, resulting in a lower-albedo surface [6]. According to the brightness and morphology, DDTs can be roughly divided into three types: continuous dark DDTs, cycloidal dark DDTs, and bright DDTs [7]. Systematic analysis of DDTs is helpful to better understand the atmosphere and aeolian activity around the Mars lander.
There are 11 probes landed on Mars up to present. NASA’s Mars Pathfinder probe successfully landed in Chryse Planitia at the mouth of Ares Valles in July 1997, and the carried Sojourner rover was the first solar-powered robot for scientific expedition on Mars [8]. As measured by the instruments carried by the Pathfinder lander, the dust on the solar panels of the rover accumulated steadily at a rate of 0.28% per day. This value is consistent with the performance of the lander’s solar array, whose power declined at an estimated rate of 0.29% per day over the same period [9]. The power drop caused by the dust accumulation shortens the working life of the solar-powered Mars rover. Spirit and Opportunity were a pair of “twin” Mars rovers of NASA’s Mars Exploration Rovers, aiming to achieve a normal mission life of three months [10]. In fact, Spirit continued working in the Gusev crater for 2208 sols, and Opportunity ended its mission after 15 working years. These rovers worked longer than expected because of the “cleaning events” brought about by dust devils. Three major “cleaning events” that may be related to dust devils were observed by Spirit [11]. Banfield et al. (2020) elaborated that during the 220 sols of InSight’s work, a spacecraft carrying a pressure sensor had detected pressure drops by about a thousand times corresponding to convective vortices, with the depth exceeding 0.5 Pa [12]. A pressure drop of 9 Pa occurred, and a sudden increase of 1% in solar energy was recorded, which may be related to the “cleaning event”. Lorenz and Reiss (2015) implied that the cleaning event is consistent with the formation of DDTs, and the time interval of its occurrence is consistent with the pressure drop measured by the lander [13]. Therefore, it is of great significance to study the prediction of the solar panel cleaning cycle caused by dust devils for extending the life of the Mars rover exploration mission.
In addition to the significance of the cleaning event, knowing the meteorological characteristics of dust devils is conducive to understanding the climate of Mars. One source of HCl is aerosol chemistry occurring with the dust particles lofted into the atmosphere; therefore, transient HCI in the Martian atmosphere may be associated with a fugitive dust event [14,15]. The dust content in the atmosphere is an important parameter in an atmospheric circulation model. Building a reliable atmospheric model is essential for the successful landing of the probe on Mars [16]. As suggested by Whelley et al. (2008), the distribution of DD activities will enhance our understanding of the conditions that help their formation and identify the location of the dust [16].
Several studies analyzed dust devil tracks on Mars to determine the seasonal changes of DDs and to reflect the geological background of the landing areas. For example, through more than 3000 Mars Orbiter Camera (MOC) narrow-angle (NA) images with a resolution of 7 m pixel−1, Balme et al. (2003) investigated a large number of DDTs in two large research areas, namely, Argyre Planitia and the Hellas Basin [17]. They used the measurement of DDTs’ density to infer the influence of seasons and surface physical properties on the formation of DDTs. In both regions, DDTs’ density varied with the seasons, and active dust devils occurred mainly in spring and summer. Verba et al. (2010) observed DDTs in Russell crater and Gusev crater by High Resolution Imaging Science Experiment (HiRISE), MOC-NA, and Context Camera (CTX) [18]. Morphological differences were checked, and the seasonal changes in DDTs were monitored at two geographically distinct locations. The scale of dust devils in Gusev crater was larger, and the occurrence of dust devils in Russell crater was more frequent. Reiss and Lorenz (2016) examined DDTs in four landing ellipses of the InSight mission by HiRISE images [19]. The results showed that the small DDs may be related to the height of the low convective boundary layer. Perrin et al. (2020) used HiRISE images to find a large number of tracks appearing shortly after InSight’s landing, followed by a significant decrease in activities in late winter and then a gradual increase in early spring [20].
According to previous studies, measured DDTs generally range from 10 to 200 m in width, with the length of a few kilometers [18,19,21]. Reiss and Lorenz (2016) showed the population of small DDs is dominant [19]. Therefore, it is necessary to examine DDTs with decimeter-level or meter-level high-resolution remote sensing images. HiRISE works in the visible spectrum, and its resolution (0.25 to 1.3 m pixel−1) exceeds that of any previous Mars probe. It can monitor changes in small-scale brightness and albedo in the same position. Additionally, HiRISE is able to detect submeter streaks which cannot be observed by other imaging systems [22]. With the spatial resolution of about 6 m pixel−1, CTX has a 5.7° field of view. It can assist in the observation of geology, geomorphology, and climate processes on the surface of Mars. Additionally, the observation of meteorological processes mainly refers to the acquisition of contemporary and early aeolian activities’ images, such as those of dust storms, dust devils, and wind streaks [23]. Taking factors such as image resolution, image coverage, and availability into consideration, CTX and HiRISE images using equirectangular projection were chosen for our study.
Two tentative landing areas of the Tianwen-1 mission were selected, with the latitude ranging from 5° to 30° [24]. Then, the landing site was determined to be Utopia Planitia (Figure 1) for the scientific exploration requirements [25]. On 15 May 2021, the Tianwen-1 probe landed in southern Utopia Planitia (109.9°E, 25.1°N). In this research, based on CTX and HiRISE images, we focused on the following work in the study area: (1) identifying dust devil tracks and measuring their lengths, widths, and orientations; (2) calculating DDT formation rates; (3) analyzing solar panel dust clearing recurrence intervals caused by dust devils; (4) evaluating the Tianwen-1 landing site based on the solar panel clearing recurrence interval and dust storm occurrence probability.

2. Methods

2.1. Image Pairs Selection

In this paper, the DDT formation rates in the landing area should be calculated to evaluate the solar panel cleaning interval of the Mars rover. However, the persistent period of DDTs is about tens or hundreds of sols due to the fact that DDTs can be erased by dust deposition in dust storm events [26]. As a result, we only selected two HiRISE and CTX images covering the same surface area with an interval of less than 100 sols to minimize the impact of the DDT fading effect.
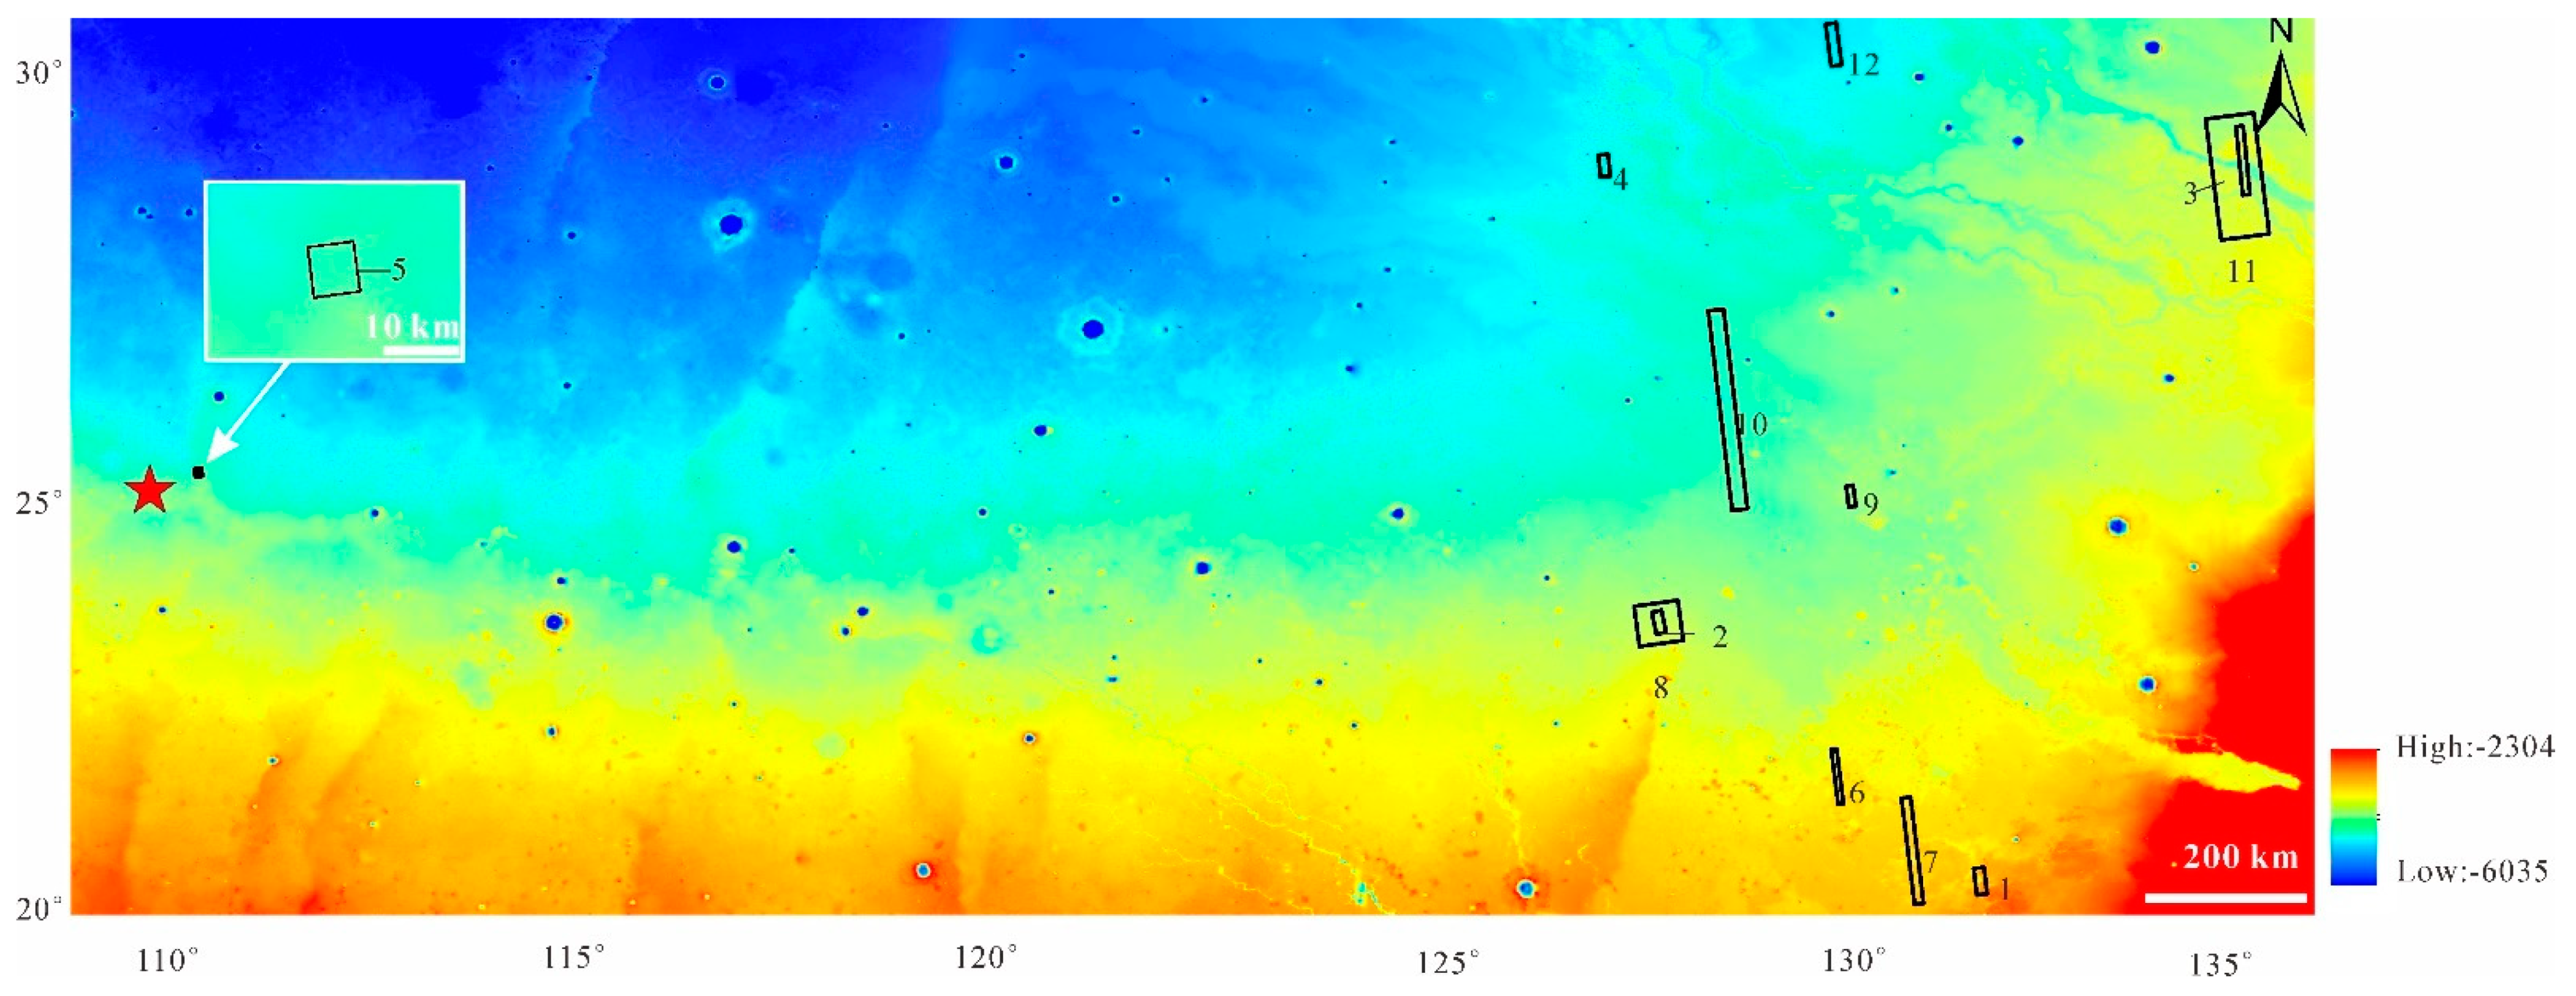
Actually, only a few HiRISE and CTX image pairs meet the above rules because (1) the tentative landing area is so large that it cannot be completely covered by HiRISE and CTX images, and (2) some images are in poor quality, being affected by dust storms. In consequence, the eastern part of the landing area, where eligible image pairs are concentrated, was chosen as the study area, which is located between 20–30.3°N and 109–135.4°E (Figure 2). A total of 12 image pairs were selected, of which image pairs 1–5 were from HiRISE, and the remaining were from CTX (Figure 2). Although the interval of the observation time of image pair 1 is 123 sols (exceeding 100 sols), it was still retained because there are also some newly formed DDTs that have not been erased.

2.2. Methods

In addition to DDTs, the black tracks on the surface of Mars may also come from wind steaks. We can distinguish DDTs from wind steaks based on two aspects. One is that DDTs basically occur as single strips, whereas wind steaks usually occur as a cluster of sheets. Additionally, the other is that wind streaks are rarely curved, whereas the tracks of dust devils are the opposite. In order to calculate the DDT formation rate, we focused on the newly formed DDTs during the observation time of CTX and HiRISE image pairs. Additionally, we identified and vectorized newly formed DDTs and excluded wind steaks in all 12 image pairs due to their differences. Figure 3 shows an example of newly formed dust devil tracks in image pair 5. The lengths, widths, and azimuths of all newly formed DDTs were measured in GIS software. This paper measured L1, the length along the total path, the distance between the start and end point of DDTs (L2), and the width (W). The sinuosity of the newly formed DDT is the ratio of L1/L2.

3. Results and Discussion

This section provides a description of the experimental results and some experimental conclusions. In the following subsections we summarize our measurements about the sinuosity, direction, size and frequency of the dust devil tracks. Table 1 summarizes the measurements of the average sinuosity, width and length measurements.

3.1. Dust Devil Track Sinuosity

The average sinuosity of the newly formed DDTs among the 12 image pairs is 1.007 (standard deviation = 0.002), which means the DDTs are quite straight in our study area. The average sinuosity of dust devil tracks measured by Verba et al. (2010) in Russell crater and Gusev crater is, respectively, 1.3 and 1.08 [18]. Reiss and Lorenz (2016) investigated the dust devil tracks in the InSight landing sites region, which showed that their average sinuosity is also relatively low (1.03) [19]. Ives (1947) provided an overview of dust devils in several regions of North America on the Earth [27]. The research recorded that when the environmental wind speed was lower than 5 km/h on the Earth, the dust devil track was affected by local changes in topography. However, when it was higher than 5 km/h, the moving direction of the dust devil was mainly controlled by the environmental wind. When the wind speed is less than 3 m/s, the variation in dust devils’ motion direction is much larger than that of a day with faster wind speeds [28]. Reiss et al. (2014) showed that the motion of dust devils is in good agreement with the wind orientation predicted by the Mars Climate Database (MCD) [29]. Therefore, through Mars Climate Database version 5 at http://www-mars.lmd.jussieu.fr/mcd_python/ (accessed on 1 December 2020) [30,31], we extracted the wind speeds at the center of our research area (26°N, 131°E), the InSight landing area (4°N, 137°E), and Russell crater and Gusev crater (53°S, 13°E and 15°S, 175°E), with the height of 20 m above the ground. As dust devils are most active in summer, the periods of Ls = 90°–180° and Ls = 270°−360° in Martian year 30 are selected at the Ls = 1° interval. Wind speeds averaged 6.8 m/s at the center of the InSight landing area and the center of Gusev crater, while the average wind speeds at the center of our study area and the center of Russell crater were 8.6 m/s and 4.4 m/s, respectively (Table 2). The wind speed is the highest and DDTs’ average sinuosity is the lowest in our study area, while the situation in Russell crater is on the contrary. These data suggest that the sinuosity of newly formed DDTs is mainly affected by the wind speed.

3.2. DDT Direction

DDs move under the action of the dominant wind in the study area [28] and then can leave a straight, curved, or curlicue track behind [7]. The orientation of DDTs can be used to indicate the dominant wind direction that may be encountered at the landing and inspection stages of Mars missions. Therefore, we can infer the local environmental wind direction by studying the azimuth of DDTs at that time. The real wind direction cannot be judged only through the azimuth of DDTs because there may be a 180-degree ambiguity between them. However, the true wind direction can be further corrected by MCD prediction results.
Our study used 91 DDTs in image pairs 3 and 10 to calculate the wind direction because they both had the same position and observation time. It can be seen that the dominant wind direction in image pairs 3 and 10 is E–W (278.3°) or W–E (98.3°) in Figure 4. We observed that the first image of image pair 10 recorded four active DDs, and its second image had many newly formed DDTs; therefore, by using MCD v5.3, we extracted the predicted wind directions of the first image when it was taken. The MCD wind predictions indicate that the wind at that time was predominantly in the NE–SW direction. DDT alignments are in good agreement with the wind predictions, indicating that dust devils move predominantly in E–W directions in this region.

3.3. Sizes of Dust Devil Tracks

3.3.1. Dust Devil Track Widths

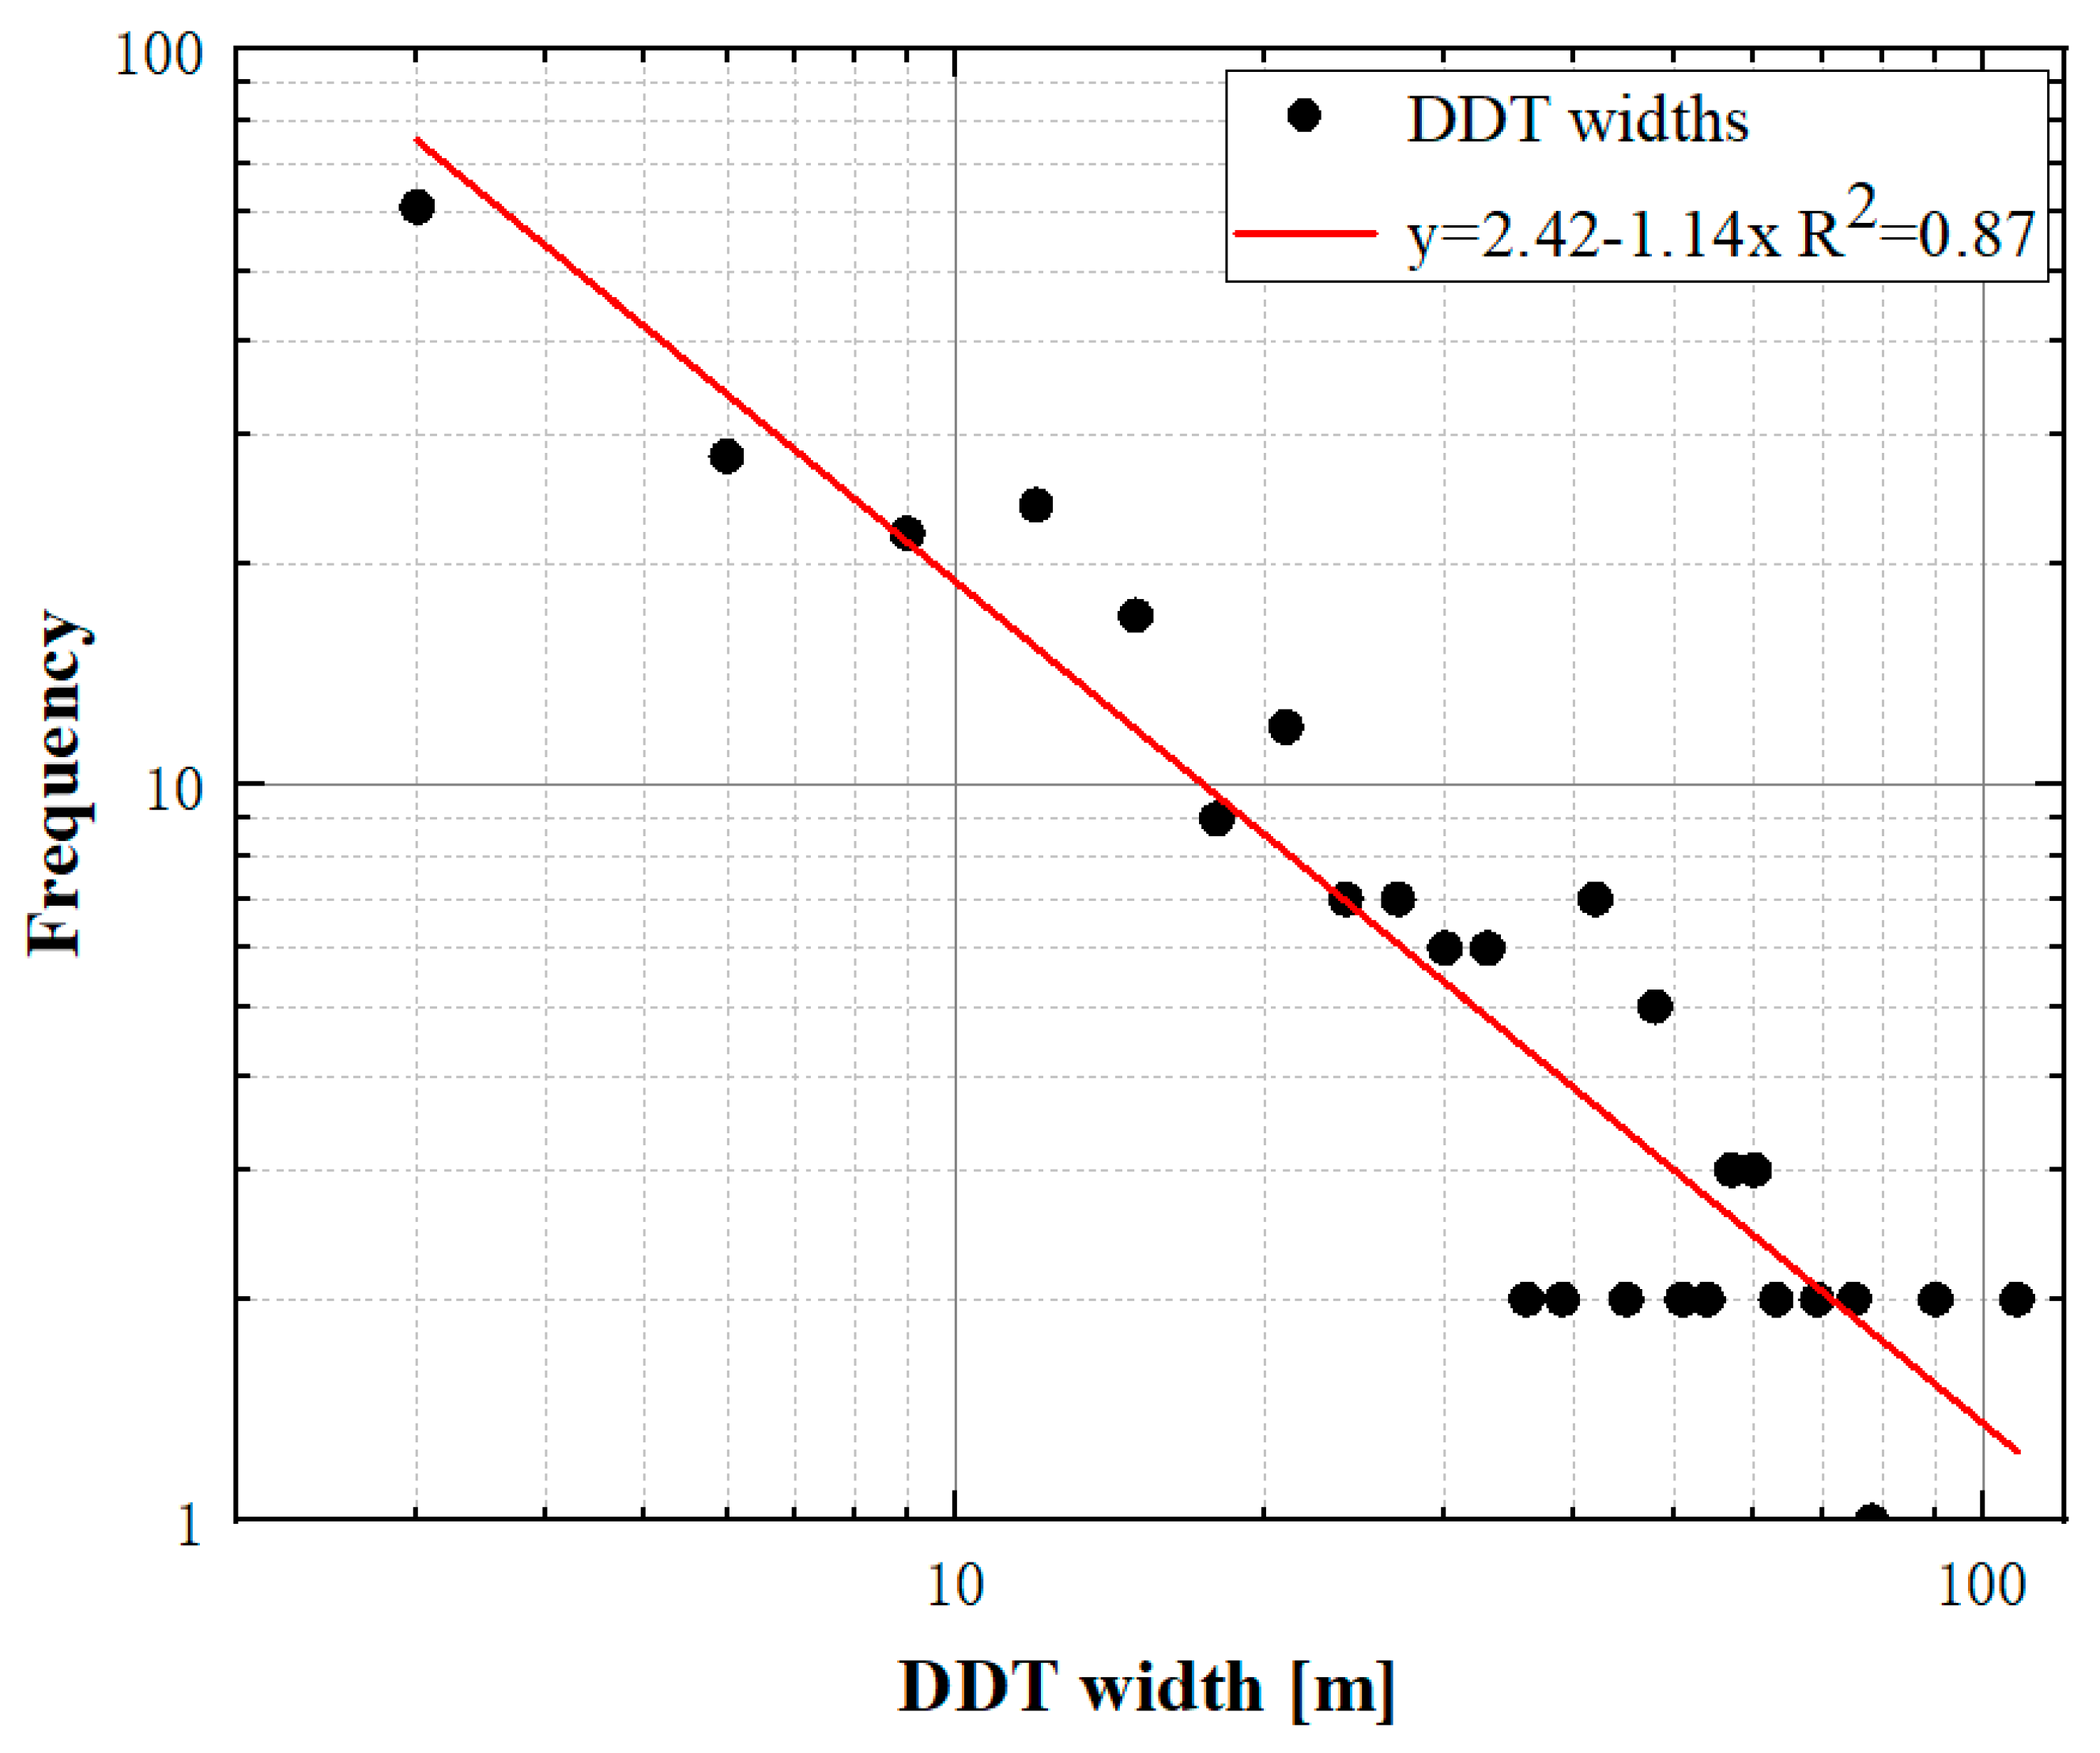
Lorenz (2009) suggested that the size distribution of dust devils could be described by a power law with a differential exponent of −2. In our study, we identified and digitized 248 newly formed DDTs whose widths were well determined in 3 m size bins [32]. These data are shown on logarithmic axes in Figure 5, and the linear trend is consistent with a power law with an exponent of −1. The statistical results of this study are consistent with those of other studies on dust devil tracks on Mars, that is, narrower DDTs appear more frequently than wider DDTs.
In HiRISE image pairs, the width of the newly formed DDTs ranges from 0.7 to 15 m, and their average width is 5.05 m. Meanwhile, in CTX image pairs, the width of the newly formed DDTs ranges from 9 to 109 m, and their average width is 32.0 m (Table 3). Measured DDT widths vary from 1 to 30 m, with a mean width of 3.99 m (HiRISE data) at the InSight landing site [19]. The average widths of DDTs at Russell and Gusev craters are 38 m (HiRISE) and 56 m (HiRISE), respectively [18]. For DDT widths measured from HiRISE images, the average and range of DDT widths in our study area are approximate to that at the InSight landing site. However, the obvious difference to the DDTs study in Gusev and Russell craters is the much lower maximum as well as mean DDT width measured from HiRISE images in our study area. The southern band (45–75°N) is an order of magnitude more populated with tracks than in the north (45–75°S), likely a result of Mars’ orbital eccentricity [16]. This could explain the wider dust devil tracks in the two southern craters. The temperature contrast between the surface and the lower atmosphere ought to be greater at higher elevations, which should enhance atmospheric instability [18,33]. Therefore, situated at a relatively high altitude, there may be wider DDTs in Russell crater. The width of DDTs is roughly equivalent to the diameter of the dust devil that produces it. Dust devils with a diameter less than 20 m accounted for the majority of all dust devils in our study, about 69%.

3.3.2. The Lengths of Dust Devil Tracks

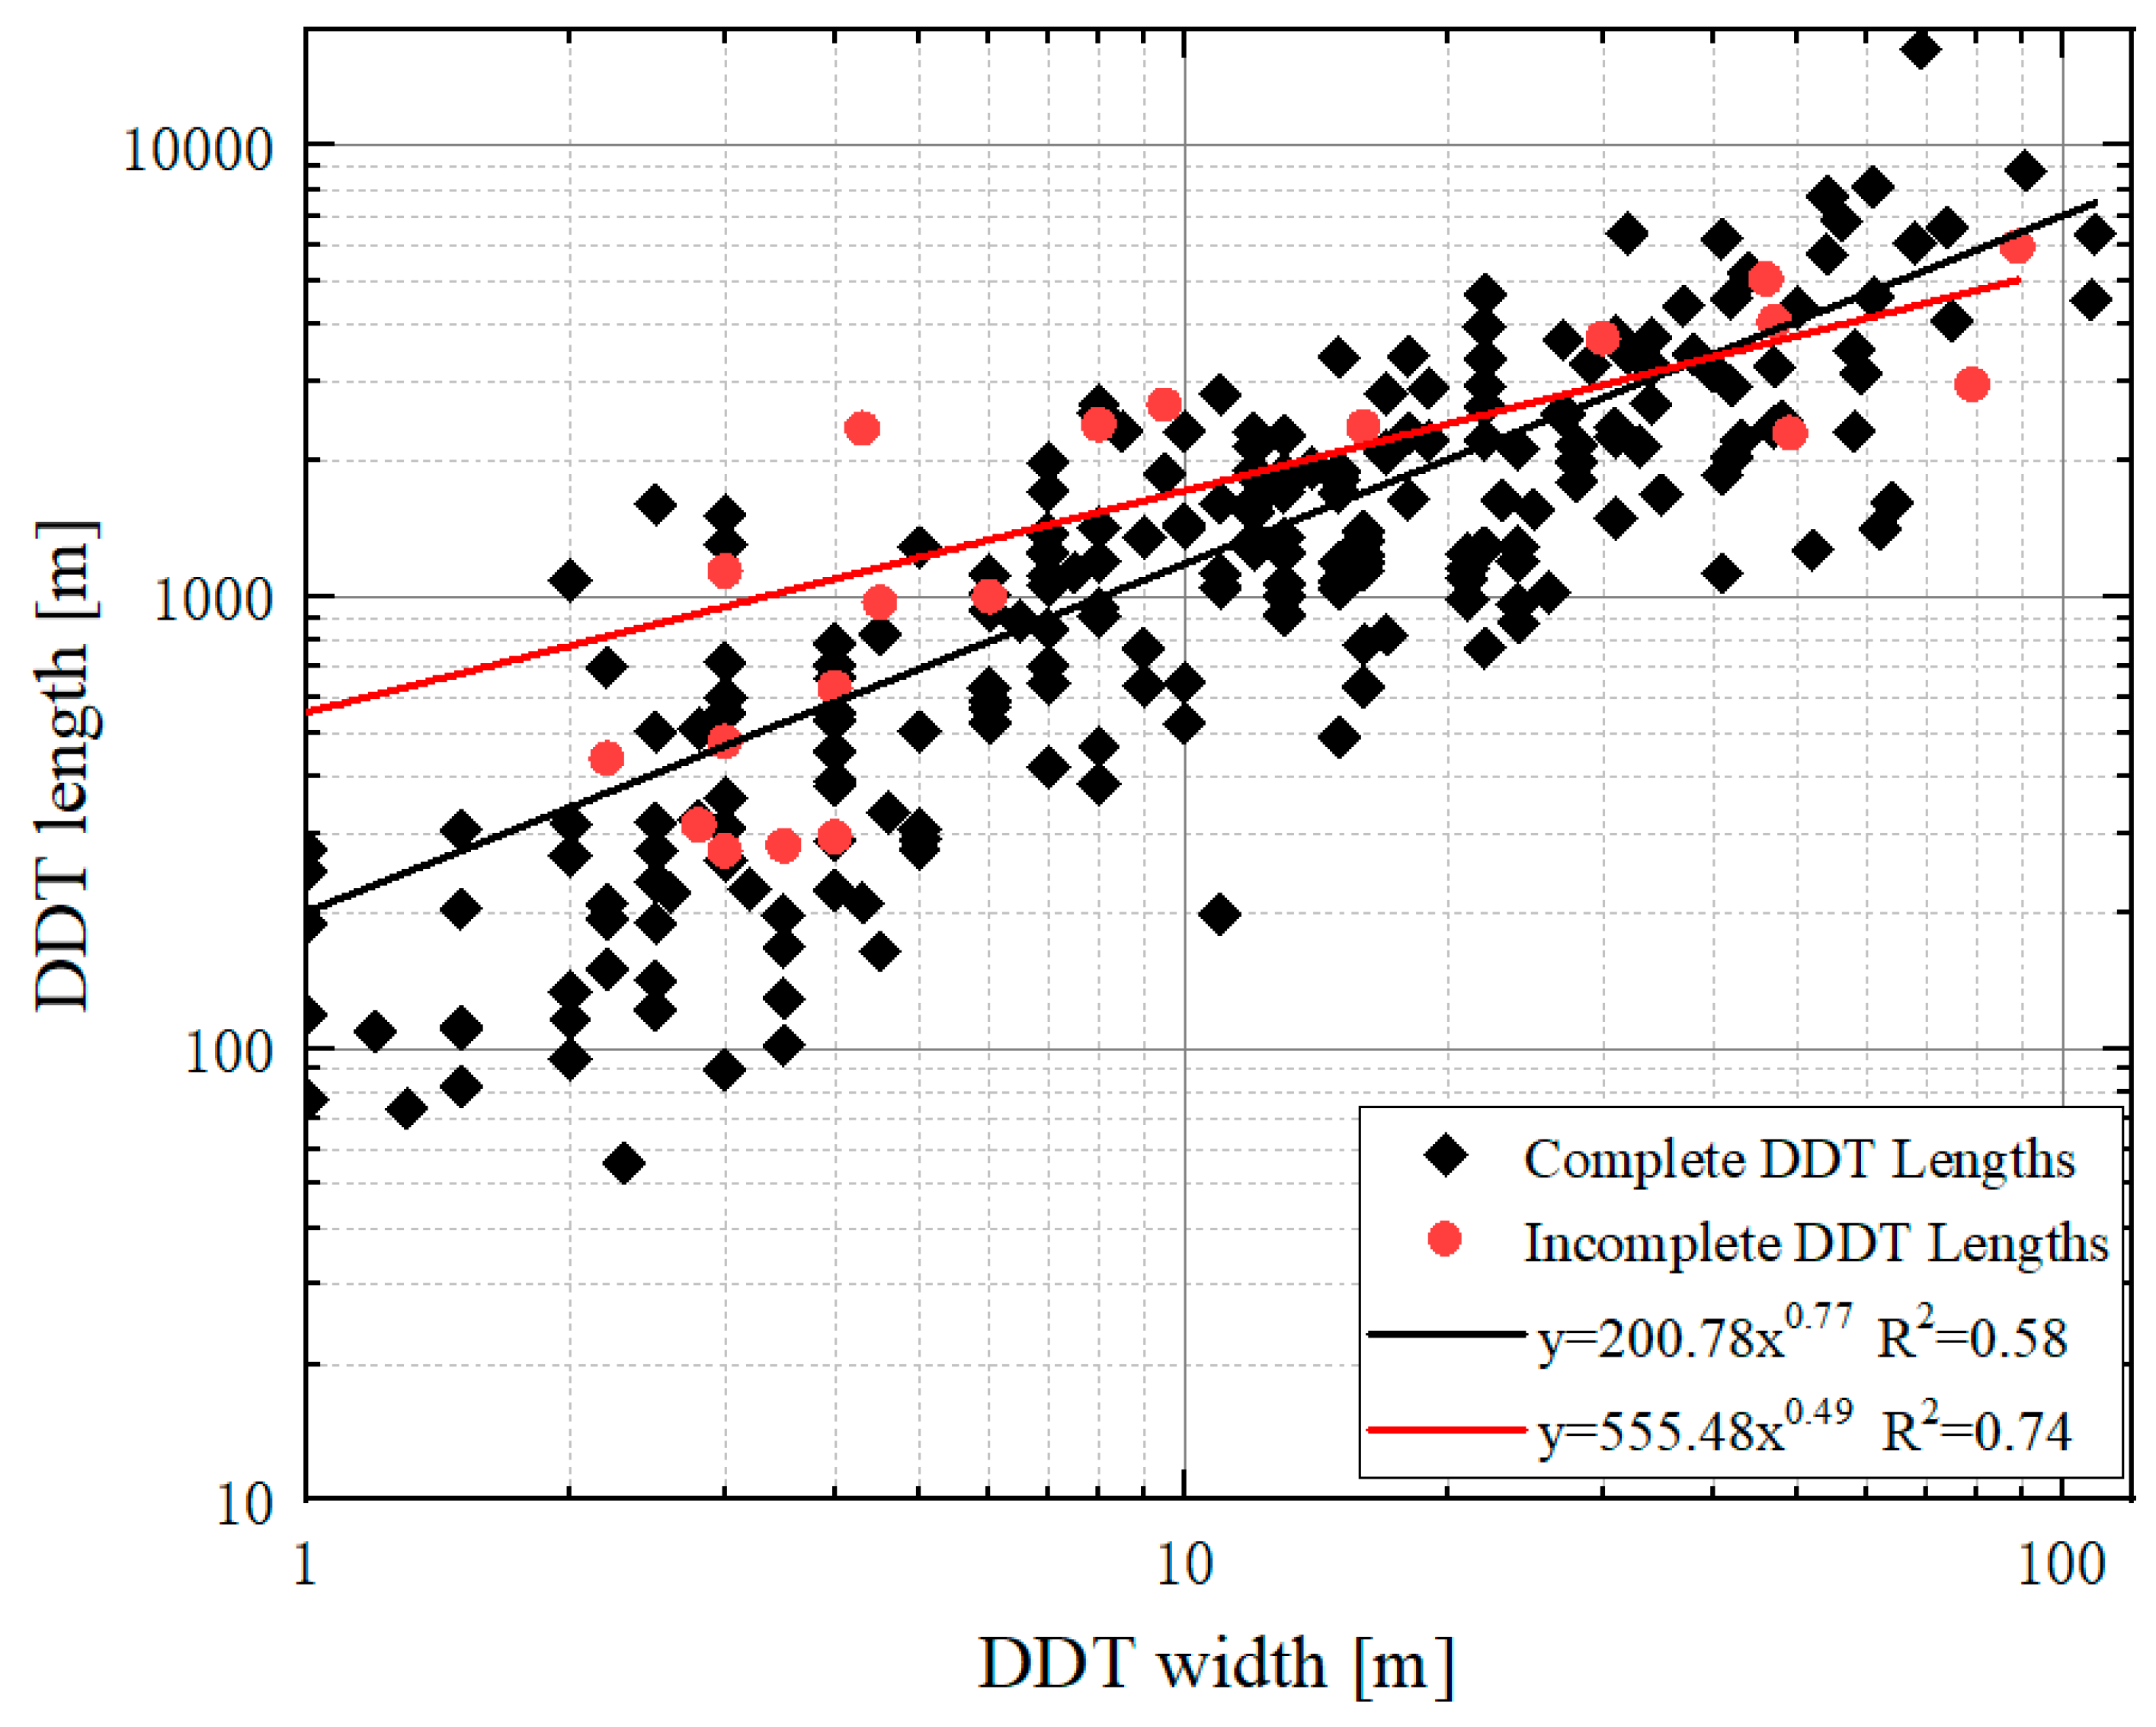
In our study area, newly formed DDT lengths vary from 21 m to 16.3 km, and the mean value is 1.7 km. In this paper, 23 DDTs are near or across the image boundary, resulting in incomplete lengths. Therefore, the DDTs were divided into complete and incomplete groups (Figure 6). The complete and incomplete DDTs were described by a power law with differential exponents of 0.77 and 0.49, respectively. It can be clearly seen that the lengths are positively correlated with the widths of DDTs.
In our study, lengths of the complete DDTs are described by the least squares fit:
L = 200.78W0.77
Lorenz (2013) provided a sublinear expression for the mean duration and diameter [34]. A fit by eye of
T = 40D0.66
is adopted as a succinct description. T and D stand for the mean duration in seconds and diameter in meters of complete DDTs. A power law with an index between 0.5 and 0.75 would fit the data. Assuming that the above expression is applicable to our study, the ratio of Equations (1) and (2) is the advection speed of DDs, which is ~5.0D0.11 m/s. Using Equation (1)/(2), we find an advection speed of 7.0 m/s for dust devils of 20 m width. The average advection speed of DDs measured by Reiss and Lorenz (2016) in the InSight landing region is 4.5 m/s through the same method [19]. Both DDs’ advection speeds are similar, possibly because the two study areas are on the flanks of Elysium Mons and mostly controlled by the large-scale wind circulation around Elysium Mons [35] (p. 109).

3.4. DDT Formation Rates

According to the measured number of newly formed DDTs (N), the area of the study region in the image pair (S), and the observation interval time (T), DDT formation rates (in ddt km−2 sol−1) in image pairs 1–12 were calculated as
N/S/T
This formula gives us a chance to evaluate the frequency of DDs that form tracks during the image pair observation interval. Table 4 summarizes the DDT formation rates of the 12 image pairs in the study area. The DDT formation rates in the 12 image pairs changed from 0.00006 to 0.1275 ddt/km2/sol, with an average value of 0.0157 ddt/km2/sol.
Although the 12 image pairs are not far apart in space and have similar properties (dust cover index, thermal inertia, and albedo), the DDT formation rate of different image pairs varies greatly. This may be caused by the seasonality of DDs and dust storm occurrence in the study area. We take image pair 3 with the largest DDT formation rate and image pair 10 with the smallest DDT formation rate as examples to analyze how the three aspects influence the DDT formation rates.
(1) Dust storm occurrence. Dust devils are essentially driven in response to intense solar heating of the surface [1]. Dust storms and their enhanced atmospheric dust loading can reduce the radiative heating of the atmosphere. Moreover, fall dust on the surface eliminates the tracks, especially in and after times of increasing dust opacity in the atmosphere. Hence, in general, the occurrence of a dust storm inhibits the formation of dust devils or erases the dust devil tracks, resulting in a decline in DDT formation rates. Yao et al. (2020) pointed out that dust storms in Utopia Planitia cannot be overlooked because Utopia Planitia is not only a significant origination area of dust storms but also on the main route of the Arctic dust storm sequences [36]. Consequently, we checked the images of the Mars Color Imager (MARCI) in order to find out dust storm activities in image pairs 3 and 10 during their observation time intervals. No dust storms were detected because there was only one MARCI image in one sol. Additionally, the spatial resolution of a MARCI image is 6 km pixel−1, meaning a small and thin dust storm cannot be observed. Thus, it is not clear whether the difference in the calculated DDT formation rates between the two image pairs is affected by the dust storm occurrence.
(2) The seasonality of DDs. DDT formation rates of 12 image pairs and their corresponding temporal periods in the study area are shown in Figure 7. The observation time of 12 image pairs spread over almost an entire Martian year, from Ls = 36.1° to Ls = 324.7°. The maximum value of the DDT formation rate appears between Ls = 159.8° and 162.5° (Figure 7), which corresponds to summer in the Northern Hemisphere. Meanwhile, the minimum value of the DDT formation rate occurs between Ls = 36.1° and 74.9°, which corresponds to early spring in the Northern Hemisphere.
According to previous studies, DDT formation rates show seasonal dependency. Hence, the DDT formation rates in the four Martian seasons are different. When insolation reaches its annual maximum, dust devils are most frequent [21]. Therefore, DDT formation rates could exhibit a peak during spring and summer. Balme et al. (2003) observed that DDTs dramatically increased in late spring and reached their maximum during summer, whereas only a small number of DDTs formed in fall and winter as the insolation was close to the seasonal minimum [17]. Moreover, image pair 2 was taken in the winter of the Northern Hemisphere and had a high DDT formation rate (0.0196 ddt/km2/sol). Perrin et al. (2020) indicated that the DDT formation rate was high in the first ~50 InSight Sols (Ls = 295–326°) measured by HiRISE, which is closely related to the transition of seasons on Mars from northern autumn to winter and then to spring [20]. This might explain why the DDT formation rate of image pair 2 is high even in winter.

3.5. The Prediction of Solar Panel Clearing Recurrence Interval

The Zhurong rover was released after the Tianwen-1 probe landed on the surface of Mars. It is expected that the Zhurong rover will work on the Martian surface for at least 92 sols, and the rover will focus on high-resolution and in situ detection of key regions on Mars [37]. Mars is far from the Sun and has less solar radiation, which limits the power generation capacity of solar panels on board the rover. The electrical power output of solar panels on board the rover declines continuously due to atmospheric fall dust on the solar panels. For example, the Spirit rover cannot carry out normal exploration missions mainly because of energy consumption. The process for the formation of DDTs is related to that of clearing dust on solar panels [5].
In order to calculate the solar panel clearing recurrence interval caused by DDs in the landing area of the Tianwen-1 mission, firstly, we multiplied the track widths by the track lengths to obtain the DDT area in each image pair. Then, for obtaining DDT area formation rates, we divided the DDT area by the survey area and time interval of image pairs. The reciprocal of DDT area formation rates can be regarded as an estimated value of the solar panel clearing recurrence interval (Table 5). For example, the clearing recurrence interval result of image pair 1 is ~33,000 sols, which means that a given spot on the surface may be cleared of dust once in ~33,000 sols. The minimum value of the solar panel clearing recurrence interval is ~980 sols (image pair 3), and the maximum value is ~167,000 sols (image pair 5). Banfield et al. (2020) proposed that not a single dust devil has been imaged from the ground in the first 200 sols of the InSight mission, meaning that the dust devil tracks formed with at least enough dust being lifted by vortices to change the surface albedo [12]. Verba et al. (2010) compared the ground-based MER Spirit observations with HiRISE observations of active dust devils in Gusev crater [18]. They suggested that only a small fraction (from 1/500 to 1/110) of dust devils produced tracks that were visible from orbital data. Therefore, we used a coefficient of 500 to correct our solar panel clearing recurrence interval results. If multiplied by a coefficient of 500, the clearing interval of image pair 3 in the study area is changed to 2 sols (Table 5). It shows that dust devils in image pair 3 are very frequent in summer of the Northern Hemisphere (Ls = 159.8–162.5°). If the Zhurong rover works on this site, the dust on the solar panels of it can be cleared every two sols.
However, our study has some limitations: (1) Only 12 qualified image pairs were selected because HiRISE and CTX images cannot entirely cover the study area, which is insufficient to study DDTs in time and space. (2) The DDT area may be smaller than it actually is because some DDT lengths were incomplete. Additionally, there is a poor detection efficiency at small sizes in CTX images. (3) Many small DDs in the study area may not leave DDTs. Therefore, the solar panel clearing recurrence interval can only be regarded as an upper limit.

3.6. Tianwen-1 Landing Area Evaluation Based on Dust Devils

Differences in dust devil size populations are known to exist on Mars. The maximum width of DDTs observed by Reiss and Lorenz (2016) through HiRISE images in the InSight landing site does not exceed 30 m [19]. However, actual in situ measurements indicate that the largest DDTs range from 40 to 140 m in diameter [20], which is close to the maximum width of 109 m in our study area. The widths of some DDTs in Russell and Gusev craters were more than 200 m according to Verba et al. (2010) [18]. It may be inferred that the Tianwen-1 landing area has different environmental and geological conditions compared with Russell and Gusev craters. Renno et al. (2004) confirmed that the heterogeneous surface produces a larger temperature gradient than the homogeneous surface, forming stronger and more convective vortices on heterogeneous surfaces [38]. Using the High-Resolution Imaging Camera (HiRIC) on board the Tianwen-1 satellite, future detailed studies might be able to constrain the reason for the differences in dust devil size populations between the Tianwen-1 landing site and the other landing sites.
In Figure 2, image pair 5 is closest to the Tianwen-1 landing site (25.1°N, 109.9°E), and its analysis results can indicate the DDT situation of the landing site. Yao et al. (2020) analyzed the temporal and spatial probability of dust storms in Utopia Planitia based on MARCI images and then selected five preferred landing areas with the spatial probability of dust storms of <3% [36]. Image pair 5 is located in the five preferred landing areas. A landing site with a relatively short clearing recurrence interval is suitable for the Zhurong rover. Generally speaking, the shorter the clearing recurrence interval, the higher the cleaning efficiency, and the more favorable it is for the Mars rover to maintain its power and carry out its mission smoothly. However, high-frequency and high-intensity dust devils will affect the normal operation of the Mars Rover Penetrating Radar (RoPeR) and Mars Rover Magnetometer (RoMAG) on board the Zhurong rover. Therefore, we do not recommend conducting detection missions in areas where DDs are frequent. According to a previous study, image pair 5′s clearing recurrence interval is 167,000 sols, slightly longer than the maximum clearing recurrence interval estimate by dust devils on InSight’s solar panels [19]. That means the Tianwen-1 landing site is inefficient at cleaning the solar panels with dust devils. However, for the Zhurong rover, a drop in the power of its solar panels due to dust is not a problem. To reduce the influence of dust on solar cell power generation efficiency, a super thin solar film was used in conjunction with a special anti-dust coating, resulting in a dust removal efficiency of over 86% [39]. Moreover, the Zhurong rover’s solar panels can be vertically folded to remove dust. Therefore, the Zhurong rover is competent for scientific exploration.

4. Summaries

Based on HiRISE and CTX images, we identified DDTs in southern Utopia Planitia. Then, we calculated and analyzed the sizes and directions of DDTs, DDT formation rates, and solar panel clearing recurrence intervals. Finally, it is believed that the Zhurong rover can carry out efficient scientific exploration at the landing site because of the spatial probability of dust storms of <3% and its dust removal design. Our results are shown below:
(1) The 12 image pairs in the study area were distributed from December 2006 to February 2016 (Martian years 28–33). A total of 248 newly formed DDTs were observed in 12 CTX and HiRISE image pairs. The average sinuosity of the newly formed DDTs among the 12 image pairs was 1.007 (standard deviation = 0.002), which means the DDTs are quite straight in our study area.
(2) In HiRISE image pairs, the width of the newly formed DDTs ranged from 0.7 to 15 m, and the average width was 5.3 m. Meanwhile, in CTX image pairs, the width of the newly formed DDTs ranged from 9 to 109 m, and the average width was 32.0 m. DDT widths were well determined in 3 m size bins, and the linear trend is consistent with a power law with an exponent of −1. The dust devils with a diameter of less than 20 m accounted for the majority of all dust devils in our study, about 69%. In our study area, newly formed DDT lengths varied from 21 m to 16.3 km, and the mean value was 1.7 km. The advection speed of DDs was ~5.0D0.11 m/s based on least square fits of the DDT length measurements and longevity reports of dust devils.
(3) The DDT formation rates in the 12 image pairs changed from 0.00006 to 0.1275 ddt/km2/sol, with an average value of 0.0157 ddt/km2/sol, which was mainly affected by factors such as seasons and dust storm occurrence. Due to the limitations of the MARCI image shooting interval and spatial resolution, it is not clear whether the difference in the calculated DDT formation rates between the two image pairs is affected by dust storm occurrence. The high DDT formation rate (0.0196 ddt/km2/sol) of image pair 2 taken in the winter may be closely related to the transition of seasons on Mars, or only an anomaly. In the future, we will use more abundant data to discuss it.
(4) The minimum value of the solar panel clearing recurrence interval was ~980 sols, and the maximum value was ~167,000 sols. Due to the finite number of image pairs and the poor detection efficiency at small sizes in images, the solar panel clearing recurrence interval was underestimated and can only be regarded as an upper limit. According to a previous study, image pair 5′s clearing recurrence interval is ~167,000 sols. That means the Tianwen-1 landing site is inefficient at cleaning the solar panels with dust devils. However, for the Zhurong rover, a drop in the power of its solar panels due to dust is not a problem. The Zhurong rover’s special anti-dust coating and vertically folded solar panels allow it to conduct efficient scientific exploration.
Due to some limitations, we only studied a part of the Tianwen-1 landing area. In the future, the landing area will be further studied based on new CTX and HiRISE images and the medium- and high-resolution camera images from the Tianwen-1 satellite.

Author Contributions

Conceptualization, B.L.; methodology, B.L.; software, J.Z.; validation, B.L., J.Z., and Z.L.; formal analysis, B.L. and S.C.; investigation, Z.L.; resources, B.L., Z.L., and L.Q.; data curation, Y.W., J.Z., and S.Q.; writing—original draft preparation, Y.W. and B.L.; writing—review and editing, Y.W. and B.L.; visualization, L.Q. and S.Q.; supervision, B.L.; project administration, B.L.; funding acquisition, S.C. and Z.L. All authors have read and agreed to the published version of the manuscript.

Funding

This work is supported by the Strategic Leading Science and Technology Special Project of Chinese Academy of Sciences (XDB41000000, XDB18000000), the Shandong Provincial Natural Science Foundation (ZR2019MD015), the National Natural Science Foundation (U1931211, 41772346), and the Pre-research project on Civil Aerospace Technologies No. D020102 funded by the China National Space Administration (CNSA).

Institutional Review Board Statement

Not applicable.

Informed Consent Statement

CTX images were downloaded from https://www.msss.com/all_projects/mro-ctx.php (accessed on 10 June 2020). The MCD is a database of meteorological fields derived from the general circulation model (GCM) numerical simulations of the Martian atmosphere and validated using available observational data. The Mars Climate Database WEB interface: http://www-mars.lmd.jussieu.fr/mcd_python/ (accessed on 1 December 2020).

Data Availability Statement

HiRISE images were downloaded from https://hirise.lpl.arizona.edu/ (accessed on 10 June 2020).

Acknowledgments

The authors would like to thank editor Brigitta Katler for the suggestions to improve our manuscript. We would like to thank the three anonymous reviewers who provided very helpful and useful suggestions for the manuscript. The efforts of the science and engineering teams behind all the datasets used in this study, particularly the MRO mission, HiRISE, and CTX instruments, are gratefully acknowledged.

Conflicts of Interest

The authors declare no conflict of interest.

References

  1. Balme, M.; Greeley, R. Dust devils on earth and mars. Rev. Geophys. 2006, 44. [Google Scholar] [CrossRef]
  2. Thomas, P.; Gierasch, P.J. Dust devils on Mars. Science 1985, 230, 175–177. [Google Scholar] [CrossRef] [PubMed]
  3. Smith, P.H.; Lemmon, M. Opacity of the Martian atmosphere measured by the Imager for Mars Pathfinder. J. Geophys. Res. Planets 1999, 104, 8975–8985. [Google Scholar] [CrossRef] [Green Version]
  4. Malin, M.C.; Edgett, K.S. Mars Global Surveyor Mars Orbiter Camera: Interplanetary cruise through prima-ry mission. J. Geophys. Res. Planets 2001, 106, 23429–23570. [Google Scholar] [CrossRef]
  5. Greeley, R.; Arvidson, R.; Bell, J.F.; Christensen, P.; Sullivan, R. Martian variable features: New insight from the mars express orbiter and the mars exploration rover spirit. J. Geophys. Res. Atmos. 2005, 110. [Google Scholar] [CrossRef] [Green Version]
  6. Reiss, D.; Raack, J.; Rossi, A.P.; Achille, G.D.; Hiesinger, H. First in-situ analysis of dust devil tracks on earth and their comparison with tracks on mars. Geophys. Res. Lett. 2010, 37, L14230. [Google Scholar] [CrossRef]
  7. Reiss, D.; Fenton, L.; Neakrase, L.; Zimmerman, M.; Statella, T.; Whelley, P.; Rossi, A.P.; Balme, M. Dust Devil Tracks. Space Sci. Rev. 2016, 203, 143–181. [Google Scholar] [CrossRef] [Green Version]
  8. Battersby, S. Pathfinder probes the weather on Mars. Nature 1997, 388, 612. [Google Scholar] [CrossRef]
  9. Landis, G.A.; Jenkins, P.P. Measurement of the settling rate of atmospheric dust on Mars by the MAE instrument on Mars Pathfinder. J. Geophys. Res. Planets 2000, 105, 1855–1857. [Google Scholar] [CrossRef]
  10. Squyres, S.W.; Arvidson, R.; Bell, J.F., III; Carr, M.; Christensen, P.; DesMarais, D.; Economou, T.; Gorevan, S.; Klingelhoefer, G.; Haskin, L. The Athena Mars Rover Science Payload. In Proceedings of the Lunar and Planetary Science Conference, Houston, TX, USA, 17–21 March 1997. [Google Scholar]
  11. Vaughan, A.F.; Johnson, J.R.; Herkenhoff, K.E.; Sullivan, R.; Madsen, M.B. Pancam and Microscopic Imager Observations of Dust on the Spirit Rover: Cleaning Events, Spectral Properties, and Aggregates; Center for Integrated Data Analytics Wisconsin Science Center: Madison, WI, USA, 2010. [Google Scholar]
  12. Banfield, D.; Spiga, A.; Newman, C.; Forget, F.; Lemmon, M.; Lorenz, R.; Murdoch, N.; Viudez-Moreiras, D.; Pla-Garcia, J.; Garcia, R.F.; et al. The atmosphere of Mars as observed by InSight. Nat. Geosci. 2020, 13, 190–198. [Google Scholar] [CrossRef]
  13. Lorenz, R.D.; Reiss, D. Solar panel clearing events, dust devil tracks, and in-situ vortex detections on Mars. Icarus 2015, 248, 162–164. [Google Scholar] [CrossRef]
  14. Korablev, O.; Olsen, K.S.; Trokhimovskiy, A.; Lefèvre, F.; Vandaele, A.C. Transient hcl in the atmosphere of mars. Sci. Adv. 2021, 7, eabe4386. [Google Scholar] [CrossRef]
  15. Liuzzi, G.; Villanueva, G.L.; Viscardy, S.; Mège, D.; Vandaele, A.C. Probing the atmospheric cl isotopic ratio on mars: Implications for planetary evolution and atmospheric chemistry. Geophys. Res. Lett. 2021, 48, e2021GL092650. [Google Scholar] [CrossRef]
  16. Whelley, P.L.; Greeley, R. The distribution of dust devil activity on Mars. J. Geophys. Res. 2008, 113, E07002. [Google Scholar] [CrossRef]
  17. Balme, M.R.; Whelley, P.L.; Greeley, R. Mars: Dust devil track survey in Argyre Planitia and Hellas Basin. J. Geophys. Res. Planets 2003, 108. [Google Scholar] [CrossRef]
  18. Verba, C.A.; Geissler, P.E.; Titus, T.N.; Waller, D. Observations from the High Resolution Imaging Science Experiment (HiRISE): Martian dust devils in Gusev and Russell craters. J. Geophys. Res. Planets 2010, 115. [Google Scholar] [CrossRef] [Green Version]
  19. Reiss, D.; Lorenz, R.D. Dust devil track survey at Elysium Planitia, Mars: Implications for the InSight land-ing sites. Icarus 2016, 266, 315–330. [Google Scholar] [CrossRef]
  20. Perrin, C.; Rodriguez, S.; Jacob, A.; Lucas, A.; Spiga, A.; Murdoch, N.; Lorenz, R.; Daubar, I.J.; Pan, L.; Kawamura, T.; et al. Monitoring of Dust Devil Tracks Around the InSight Landing Site, Mars, and Comparison with in situ Atmospheric Data. Geophys. Res. Lett. 2020, 47, e2020GL087234. [Google Scholar] [CrossRef]
  21. Fisher, J.A.; Richardson, M.I.; Newman, C.E.; Szwast, M.A.; Graf, C.; Basu, S.; Ewald, S.P.; Toigo, A.D.; Wilson, R.J. A survey of Martian dust devil activity using Mars Global Surveyor Mars Orbiter Camera im-ages. J. Geophys. Res. Planets 2005, 110. [Google Scholar] [CrossRef] [Green Version]
  22. McEwen, A.S.; Eliason, E.M.; Bergstrom, J.W.; Bridges, N.T.; Hansen, C.J.; Delamere, W.A.; Grant, J.A.; Gulick, V.C.; Herkenhoff, K.E.; Keszthelyi, L.; et al. Mars Reconnaissance Orbiter’s High Resolution Imaging Science Experiment (HiRISE). J. Geophys. Res. Atmos. 2007, 112, 5. [Google Scholar] [CrossRef] [Green Version]
  23. Malin, M.C.; Bell, J.F., III; Cantor, B.A.; Caplinger, M.A.; Calvin, W.M.; Clancy, R.T.; Edgett, K.S.; Edwards, L.; Haberle, R.M.; James, P.B.; et al. Context Camera Investigation on board the Mars Reconnaissance Orbiter. J. Geophys. Res. Planets 2007, 112, E05S04. [Google Scholar] [CrossRef] [Green Version]
  24. Ye, P.J.; Sun, Z.Z.; Rao, W.; Meng, L.Z. Mission overview and key technologies of the first Mars probe of China. Sci. China Technol. Sci. 2017, 60, 649–657. [Google Scholar] [CrossRef]
  25. Wan, W.X.; Wang, C.; Li, C.L.; Wei, Y. China’s first mission to Mars. Nat. Astron. 2020, 4, 721. [Google Scholar] [CrossRef]
  26. Cantor, B.A.; Kanak, K.M.; Edgettet, K.S. Mars Orbiter Camera observations of Martian dust devils and their tracks (September 1997 to January 2006) and evaluation of theoretical vortex models. J. Geophys. Res. Planets 2006, 111. [Google Scholar] [CrossRef]
  27. Ives, R.L. Behavior of dust devils. Bull. Am. Meteorol. Soc. 1947, 28, 168–174. [Google Scholar] [CrossRef] [Green Version]
  28. Balme, M.R.; Pathare, A.; Metzger, S.M.; Towner, M.C.; Lewis, S.R.; Spiga, A.; Fenton, L.K.; Renno, N.O.; Elliott, H.M.; Saca, F.A.; et al. Field measurements of horizontal forward motion velocities of terrestrial dust devils: To-wards a proxy for ambient winds on Mars and Earth. Icarus 2012, 221, 632–645. [Google Scholar] [CrossRef] [Green Version]
  29. Reiss, D.; Spiga, A.; Erkeling, G. The horizontal motion of dust devils on Mars derived from CRISM and CTX/HiRISE observa-tions. Icarus 2014, 227, 8–20. [Google Scholar] [CrossRef]
  30. Forget, F.; Hourdin, F.; Fournier, R.; Hourdin, C.; Talagrand, O.; Collins, M.; Lewis, S.R.; Read, P.L.; Huot, J.-P. Improved general circulation models of the martian atmosphere from the surface to above 80 km. J. Geophys. Res. Planets 1999, 104, 24155–24175. [Google Scholar] [CrossRef]
  31. Millour, E.; Forget, F.; Spiga, A.; Vals, M.; Zakharov, V.; Montabone, L.; Lefèvre, F.; Montmessin, F.; Chaufray, J.Y.; López-Valverde, M.A.; et al. The Mars Climate Database (version 5.3). Presented at From Mars Express to ExoMars Scientific Workshop, ESA-ESAC, Madrid, Spain, 27–28 February 2018. [Google Scholar]
  32. Lorenz, R.D. Power law of dust devil diameters on Mars and Earth. Icarus 2009, 203, 683–684. [Google Scholar] [CrossRef]
  33. Luo, Y.; Yan, J.; Li, F.; Li, B. Spatial Autocorrelation of Martian Surface Temperature and Its Spatio-Temporal Relationships with Near-Surface Environmental Factors across China’s Tianwen-1 Landing Zone. Remote Sens. 2021, 13, 2206. [Google Scholar] [CrossRef]
  34. Lorenz, R.D. The longevity and aspect ratio of dust devils: Effects on detection efficiencies and comparison of landed and orbital imaging at mars. Icarus 2013, 226, 964–970. [Google Scholar] [CrossRef]
  35. Spiga, A.; Banfield, D.; Teanby, N.A.; Forget, F.; Lucas, A.; Kenda, B.; Manfredi, J.A.R.; Widmer-Schnidrig, R.; Murdoch, N.; Lemmon, M.T.; et al. Atmospheric Science with InSight. Space Sci. Rev. 2018, 214, 1–64. [Google Scholar] [CrossRef] [Green Version]
  36. Yao, P.; Li, C.; Wang, B.; Li, B.; Zhang, J.; Ling, Z.; Chen, S. Evaluating the Dust Storm Probability in Isidis-lysium Planitia, a Tentative Landing Area of Chi-na’s First Mars Mission (Tianwen-1). Earth Space Sci. 2020, 7, e2020EA001242. [Google Scholar] [CrossRef]
  37. Zou, Y.; Zhu, Y.; Bai, Y.; Wang, L.; Peng, Y.; Jia, Y.Z.; Shen, W.H.; Fan, Y.; Liu, Y.; Wang, C.; et al. Scientific objectives and payloads of tianwen-1, china’s first mars exploration mission. Adv. Space Res. 2020, 67, 812–823. [Google Scholar] [CrossRef]
  38. Renno, N.O.; Abreu, V.J.; Koch, J.; Smith, P.H.; Hartogensis, O.K.; De Bruin, H.A.R.; Burose, D.; Delory, G.T.; Farrell, W.M.; Watts, C.J.; et al. MATADOR 2002: A pilot field experiment on convective plumes and dust devils. J. Geophys. Res. Planets 2004, 107. [Google Scholar] [CrossRef] [Green Version]
  39. Tian, H.; Zhang, T.; Jia, Y.; Peng, S.; Yan, C. Zhurong: Features and mission of China’s first Mars rover. Innovation 2021, 100121. [Google Scholar] [CrossRef]
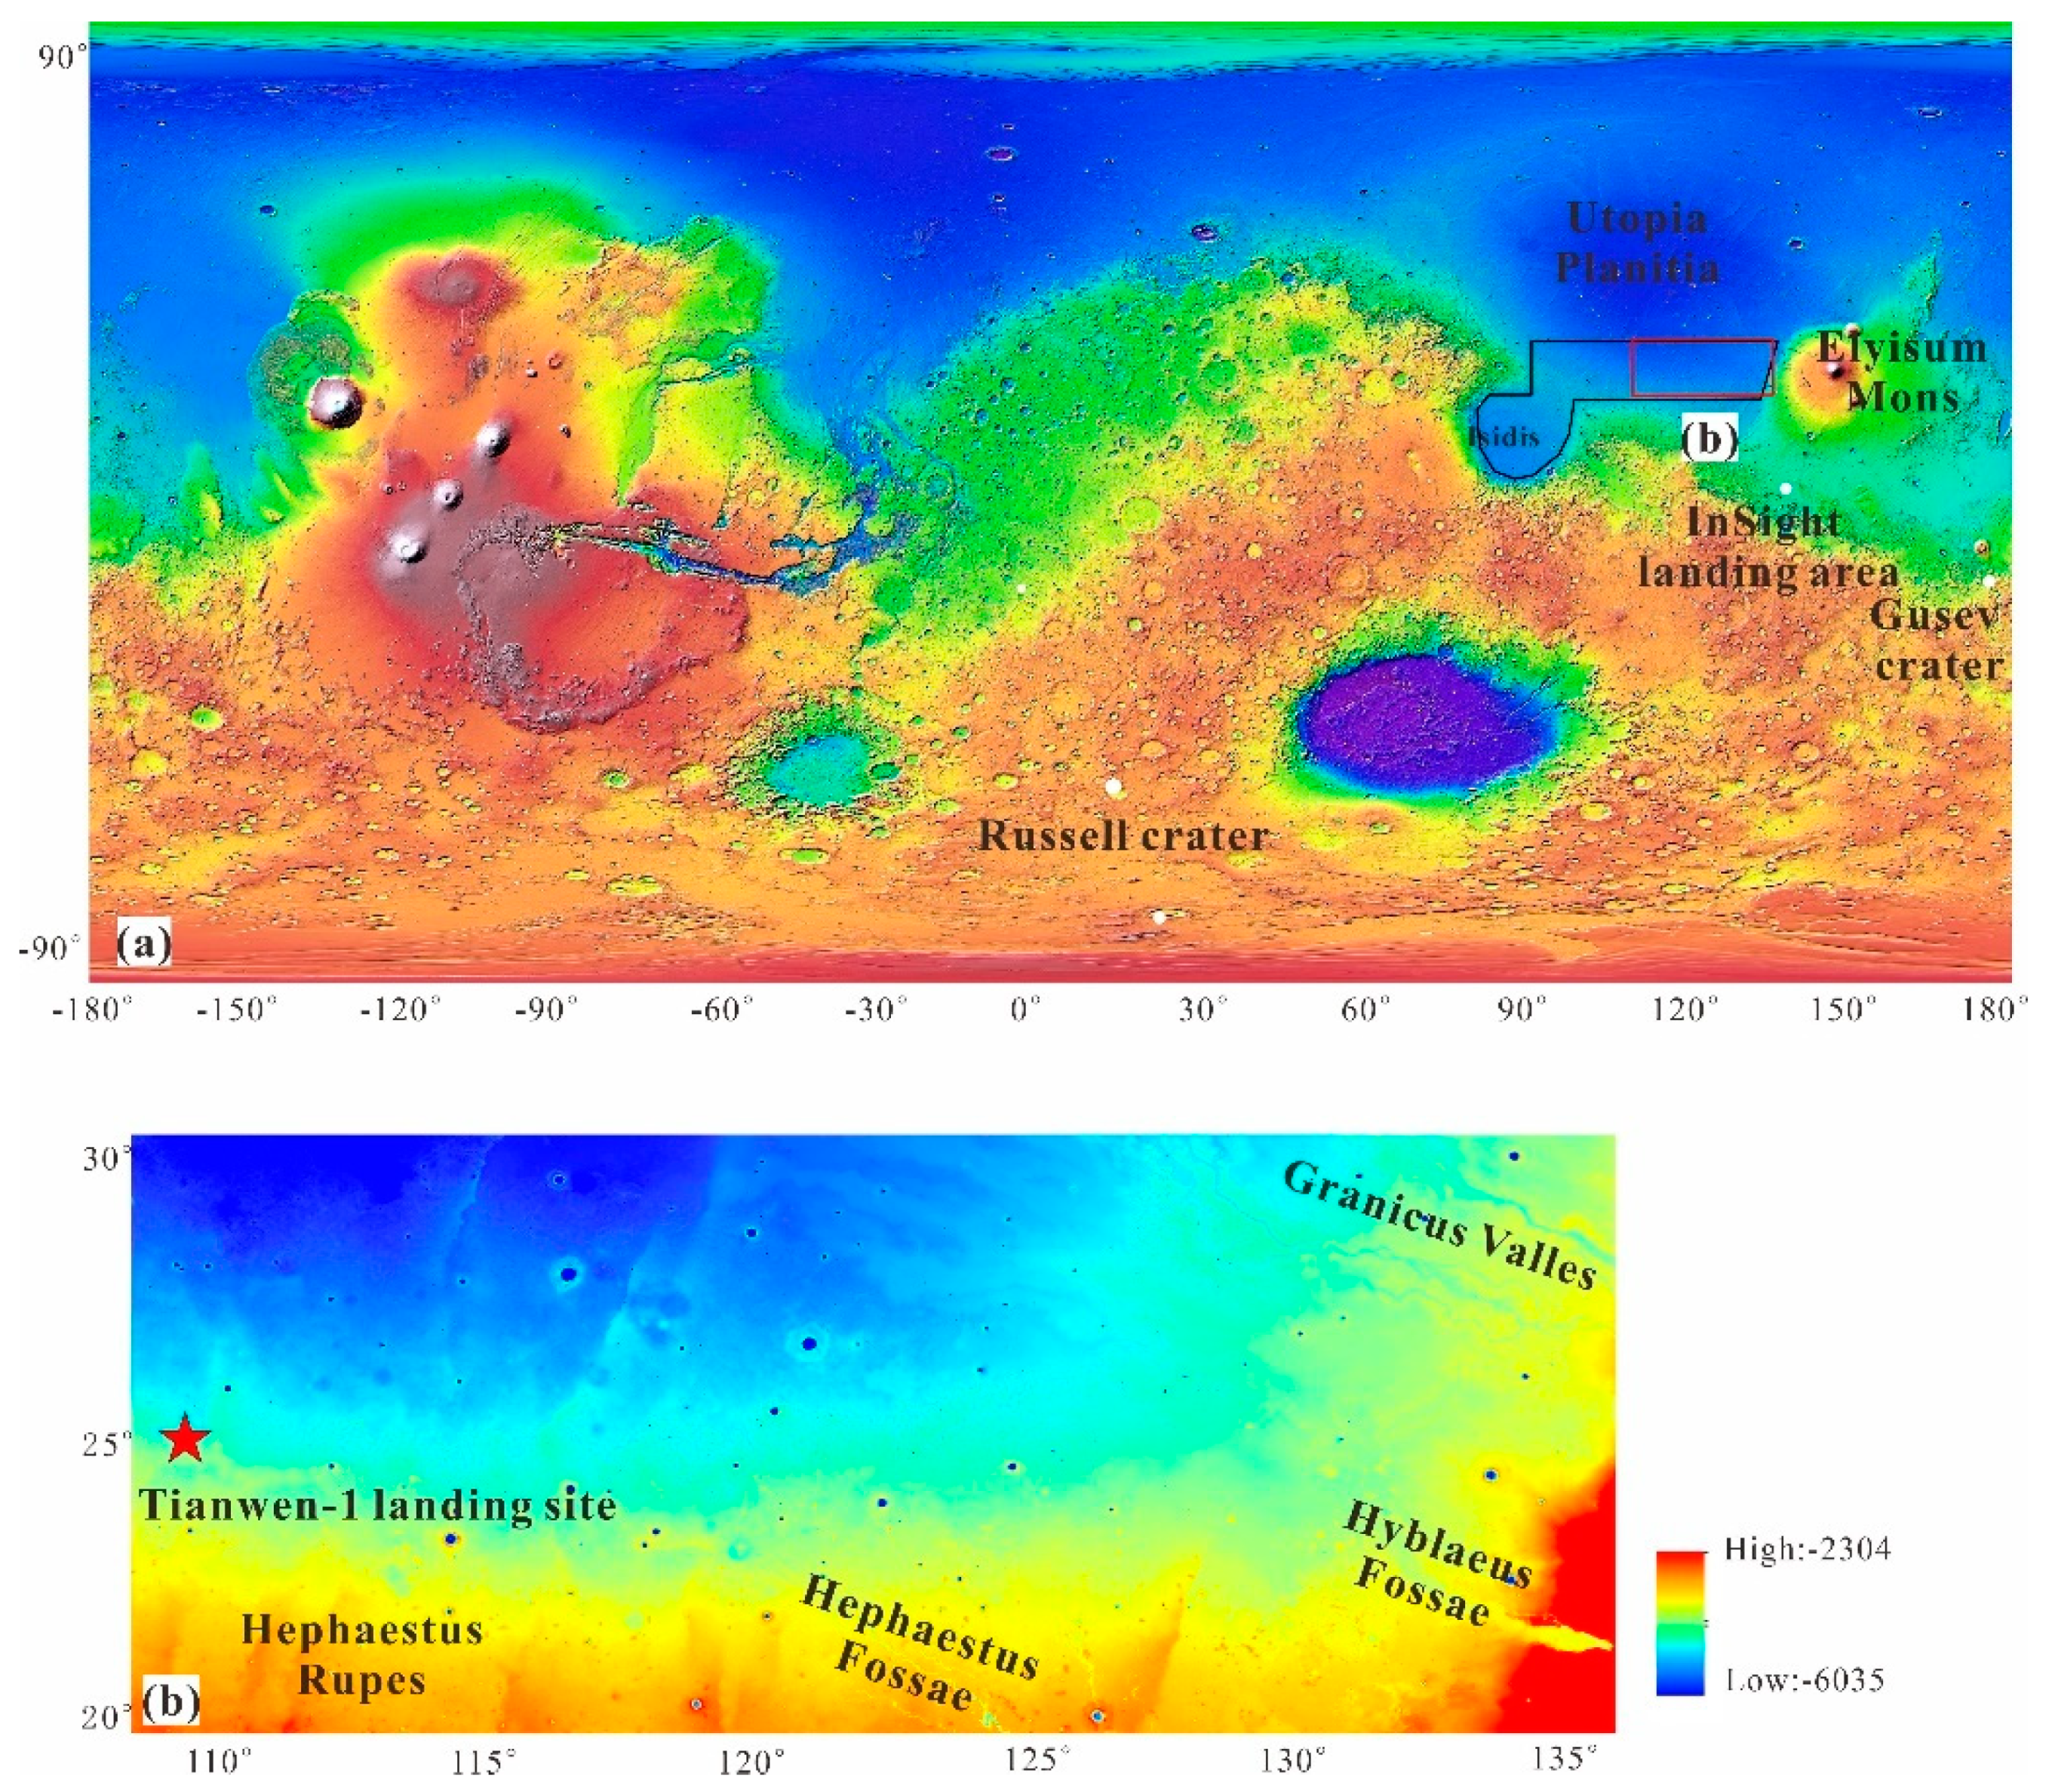
Figure 1. (a) The tentative landing area (black polygon) of Tianwen-1 in a rendered elevation map from Mars Global Surveyor (MGS) Mars orbit laser altimeter (MOLA) DEM data with a simple cylindrical projection. (b) The elevation map of the study area (red rectangle in Figure 1a). The red five-pointed star represents the landing site of Tianwen-1.
Remotesensing 13 02601 g001
Figure 2. The study area is in southern Utopia Planitia. HiRISE image pairs 15 and CTX image pairs 612 are indicated by black boxes. Image pairs 2 and 8 and 3 and 11 are overlapped. Background: The rendered elevation map. The red five-pointed star represents the landing site of Tianwen-1.
Remotesensing 13 02601 g002
Figure 3. An example of newly formed dust devil tracks in image pair 5. (a) Part of HiRISE image ESP_043896_2055 at Ls = 78° in MY 33. (b) Part of CTX image ESP_044885_2055 at Ls = 112.3° in MY 33. The central point coordinates of (a) and (b) are 110.445°E, 25.076°N. L1 is the length along the total path, L2 is the distance between the start and end point of DDTs (the yellow line), and W is the width.
Remotesensing 13 02601 g003
Figure 4. DDT azimuths in image pairs 3 and 10 (Ls = 159.8°–162.5°, n = 91). The red line is the direction of the weighted average, and the red number is the weighted average.
Remotesensing 13 02601 g004
Figure 5. DDT frequency versus DDT widths of all identified DDTs (black circles) in 3 m bin sizes. The red line is a power law with an exponent of −1.14. The R2 value of the fitting formula is equal to 0.87.
Remotesensing 13 02601 g005
Figure 6. DDT widths versus DDT lengths. The complete DDT lengths are represented by black squares (n = 227). The incomplete DDT lengths are represented by red circles (n = 21).
Remotesensing 13 02601 g006
Figure 7. DDT formation rates of 12 image pairs in the study area. Green rectangle represents DDT formation rates of HiRISE images in MY30, red rectangle represents DDT formation rates of HiRISE images in MY28, black rectangle represents DDT formation rates of CTX images in MY30, blue rectangle represents DDT formation rates of CTX images in MY28–29, and yellow rectangle represents DDT formation rates of CTX images in MY33.
Remotesensing 13 02601 g007
Table 1. Summary of DDT measurements in 12 image pairs. The image pair index is consistent with that in Figure 2.
IndexHiRISE/CTX IDSpatial Resolution (m pixel−1)Number of New DDTsAverage Width (m)Average Length (m)Average SinuosityTime Interval (Sols)
1ESP_018353_20050.25158.7833.41.0056123
ESP_016718_20050.25
2ESP_022309_20350.25187.3863.31.002312
ESP_022454_20350.25
3PSP_002042_20900.5515.51142.91.00345
PSP_002108_20900.5
4PSP_001950_20900.25332.2221.71.004521
PSP_002240_20900.5
5ESP_043896_20550.25112.6200.61.055375
ESP_044885_20550.25
6G06_020753_200651021.31588.51.001770
G09_021676_20095
7B19_016929_202954518.71882.31.006843
B20_017496_20205
8G10_022309_20365824.31840.51.000612
G11_022454_20365
9B12_014173_20675226.03340.81.002916
B12_014384_20545
10B20_017351_206551350.53684.31.006885
B17_016217_20715
11P03_002042_209154042.13715.31.00425
P03_002108_20885
12G02_018986_20945299.06175.31.000827
G03_019342_20985
Table 2. The relationship between average sinuosity of DDTs and local wind speed.
Location (Center)LongitudeLatitudeAverage SinuosityWind Speed (m/s)
Our study area131°E26°N1.0078.6
InSight landing area137°E4°N1.036.8
Gusev crater175°E15°S1.086.8
Russell crater13°E53°S1.34.4
Table 3. Width range and average of DDTs.
Location (Center)LongitudeLatitudeAverage Width of DDTs (m)The Width Range of DDTs (m)Average Altitude (km)
HiRISE DataCTX DataHiRISE DataCTX Data
Our study area131°E26°N5.0532.00.7–159–109−4.1
InSight landing area137°E4°N3.99 1–30 −2.7
Gusev crater175°E15°S38 −1.9
Russell crater13°E53°S56 0.1
Table 4. Summary of DDT formation rates in 12 image pairs. The image pair index is consistent with that in Figure 2.
Image Pair IndexHiRISE/CTX IDObservation TimeMartian YearLs (°)Number of New TracksArea (km2)Time Interval (Sols)DDT Formation Rate (ddt/km2/Sol)
1ESP_016718_200519 February 20103053.51537.91230.0032
ESP_018353_200526 June 2010109.5
2ESP_022309_203530 April 201130283.41876.5120.0196
ESP_022454_203512 May 2011290.7
3PSP_002042_20902 January 200728159.8518050.1275
PSP_002108_20907 January 2007162.5
4PSP_001950_209026 December 200628156.13387.8210.0179
PSP_002240_209017 January 2007167.9
5ESP_043896_20557 December 201533781115.5750.0095
ESP_044885_2055 22 February 2016112.3
6G06_020753_200630 December 201030207.610146.9700.0010
G09_021676_200912 March 2011252.6
7B19_016929_20297 March 20103060.545489.1430.0021
B20_017496_202020 April 201079.7
8G10_022309_203630 April 201130283.48857.0120.0008
G11_022454_203612 May 2011290.7
9B12_014173_20674 August 200929315.1241.0160.0030
B12_014384_205421 August 2009324.7
10B17_016217_207111 January 20103036.1131499.4850.0001
B20_017351_20659 April 201074.9
11P03_002042_20912 January 200728159.8402186.250.0037
P03_002108_20887 January 2007162.5
12G02_018986_209414 August 201030132.52218.7270.0003
G03_019342_209811 September 2010146.4
Table 5. Summary of DDT area formation rates and solar panel clearing recurrence intervals in 12 image pairs. The image pair index is consistent with that in Figure 2.
Image Pair IndexHiRISE/CTX IDObservation TimeLs (°)Number of New TracksDDT Area(km2)Survey Area (km2)Time Interval (Sols)DDT Area Formation Rate (Sol−1)Solar Panel Dust Clearing Recurrence Interval (Sols)Corrected Solar Panel Dust Clearing Recurrence Interval (Sols)
1ESP_016718_200519 February 201053.5150.1172544537.91230.0000333,333.366.7
ESP_018353_200526 June 2010109.5
2ESP_022309_203530 April 2011283.4180.1226950276.5120.000137692.315.4
ESP_022454_203512 May 2011290.7
3PSP_002042_20902 January 2007159.8510.406485468050.00102980.42
PSP_002108_20907 January 2007162.5
4PSP_001950_209026 December 2006156.1330.0164618787.8210.00001100,000200
PSP_002240_209017 January 2007167.9
5ESP_043896_20557 December 201578110.0066746015.5750.000006166,666.7333.3
ESP_044885_205522 February 2016112.3
6G06_020753_200630 December 2010207.6100.41482511146.9700.0000425,00050
G09_021676_200912 March 2011252.6
7B19_016929_20297 March 201060.5451.64541974489.1430.0000812,50025
B20_017496_202020 April 201079.7
8G10_022309_203630 April 2011283.480.51814441857.0120.0000520,00040
G11_022454_203612 May 2011290.7
9B12_014173_20674 August 2009315.120.1769613941.0160.000273703.77.4
B12_014384_205421 August 2009324.7
10B17_016217_207111 January 201036.1132.677092061499.4850.0000250,000100
B20_017351_20659 April 201074.9
11P03_002042_20912 January 2007159.8407.316129342186.250.000671492.53
P03_002108_20887 January 2007162.5
12G02_018986_209414 August 2010132.521.22688549218.7270.000214761.99.5
G03_019342_209811 September 2010146.4
Publisher’s Note: MDPI stays neutral with regard to jurisdictional claims in published maps and institutional affiliations.