Abstract
Very High Throughput Satellites (VHTS) have a pivotal role in complementing terrestrial networks to increase traffic demand. VHTS systems currently assume a uniform distribution of traffic in the service area, but in a real system, traffic demands are not uniform and are dynamic. A possible solution is to use flexible payloads, but the cost of the design increases considerably. On the other hand, a fixed payload that uses irregular beam coverage depending on traffic demand allows maintaining the cost of a fixed payload while minimizing the error between offered and required capacity. This paper presents a proposal for optimizing irregular beams coverage and beam pattern, minimizing the costs per Gbps in orbit, the Normalized Coverage Error, and Offered Capacity Error per beam. We present the analysis and performance for the case study and compare it with a previous algorithm for a uniform coverage area.
1. Introduction
One of the overall objectives of 5G is to create a new environment that achieves full convergence of broadcasting and mobile and faster downloads in the smallest cells. For this, it is necessary to have a complete system in which there are mobile and entertainment services and health services, self-driving [1]. The implementation of 5G environments needs to incorporate higher rates (enhance mobile broadband—eMBB) with small, dense cells, as well as lower rates (massive machine-type communications—mMTC) and reliable services anywhere and at any time (ultra-reliable communications—uRLLC) [1].
SatComs systems are expected to be auxiliary systems to avoid the saturation of 5G terrestrial networks and to help meet the demand for new services scheduled in the near future, such as M2M (machine-to-machine) communications, smart cities, internet in rural and remote areas, smart transport communications, emergency services, and defense [2].
On the other hand, the ITU-R has identified three groups of use cases that address different use case features [3]:
- Enhanced mobile broadband: addresses use cases centered on the human being to access multimedia content, services, and data.
- Ultra-reliable and low-latency communications: this service enabler has strict requirements for capabilities such as performance, latency, and availability. Examples include wireless control of industrial manufacturing or production processes, remote medical surgery, automation of distribution in an intelligent network, transport safety, etc.
- Massive machine-type communications: a large number of connected devices that normally transmit a relatively low volume of data not sensitive to delay. The devices are required to be low cost and have a long battery life.
Significant satellite advantages can support critical usage scenarios for 5G. One such benefit is that satellites can support multi-Gbps data rates for enhanced mobile broadband (eMBB) communications. Satellites already support 2G/3G mobile backhaul in many parts of the world. In addition, satellites can support massive machine-type communications (mMTC), i.e., satellites already support SCADA and other global asset tracking applications today and can scale to support future M2M and IoT communications [1].
On the other hand, Very High Throughput Satellites (VHTS) are optimized satellite systems that meet the increasing traffic demand and have a key role in complementing future 5G terrestrial networks [4,5,6]. The VHTS overcomes the capacity of traditional systems that provide Fixed and Mobile Satellite Services (FSS and MSS, respectively), using contoured regional footprints. The VHTS objective is to achieve 1 Terabit/s per satellite in the near future. It is based on multibeam coverage (with polarization schemes and frequency reuse) and using higher bandwidths in the feeder link, such as Q/V frequency bands [7,8]. These systems provide higher satellite links capacity with a reduced cost per Gbps in orbit [8,9]. However, the traffic demand is not always the same in the service area, so new flexible payload concepts are required [10].
Shortly, the goal is to prepare Europe for deploying the next generation of broadband infrastructure, including fixed and mobile Internet access (5G) [7]. In that sense, an intermediate stage will be the KONNECT VHTS satellite of EUTELSAT, estimated to be launched in 2021 to bring 500 Gbps of Ka-band capacity over Europe [11].
Existing VHTS satellites commonly use four reflector antennas to provide cellular coverage formed by multibeams in a four-color scheme [12]. In addition, multi-spot systems usually use Single Feed per Beam (SFB) when no adaptive beamwidth or beam steering capability is required. Using SFB, the VHTS systems have had an important evolution in their capacity [13], which has been increased from 10 Gbps in the Anik F2 system to 90 Gbps in the Ka-SAT satellites, up to the 500 Gbps of the proposed KONNECT [11].
Alternatively, Multiple Feed per Beam (MFB) became part of the solution to scenarios with significant changes in the traffic demand pattern in the service area. The recent effort in developing more flexible onboard antenna systems is interesting to highlight the work presented in [14,15] on a new concept of active antennas in MFB with shared power amplifiers for VHTS systems. Furthermore, Schneider et al. [16] explain that multibeam antennas are a key element for the frequency reuse scheme, and the authors discuss the comparison between the application of SFM and MFB.
On the other hand, most VHTS satellite systems currently assume that the traffic requested per beam is uniform [8,9], but the real traffic demands are non-uniform in the service area [17]. The uniform distribution of the offered capacity of VHTS systems causes some beams to waste resources while others may not have enough resources. Thus a possible solution to this problem is to use flexible payloads. [18]. However, most of the existing SatCom payloads do not offer any flexibility in terms of bandwidth or coverage. At the same time, power flexibility can be achieved instead by modifying the working point of the onboard amplifier according to the transponder loading [18].
In this sense, full flexibility in SatComs payload requires flexibility in terms of beamwidth to increase or decrease the beam gain [17,19]. This requires payload architectures with the necessary technology to perform this task. One intermediate step is the Beamforming Network (BFN) design, which should modify the beamwidth as needed, generating coverage with irregularly sized beams. Thus, the authors in [17] propose to use the BFN for adaptive beamwidth allocation. BFN should replace the OMUX (output multiplexer) of the traditional payload. One BFN configuration should be available for each predesigned coverage scenario and optimized based on the projected traffic demand. Switching BFN configurations is halfway between synthesizing any beam and the possibility of choosing from a set of possible configurations for the same coverage. The design of the BFN for a new generation SatComs payload requires the establishment of essential optimization criteria for SatComs operators such as cost per Gbps in orbit [8,20], capacity requirements per beams [21], and coverage [22,23].
Accordingly, Kyrgiazos et al. [22] propose a joint optimization of non-uniform bandwidth allocation and non-uniform beam sizes to match traffic demands better, increase total proper capacity, and use limited space resources more efficiently. The proposed method is applied for a hypothetical traffic scenario in Europe, where a maximum number of 200 user beams is assumed. Nevertheless, the coverage offered by irregular beams does not consider antenna design constraints, the cost of Gbps in orbit, or that the coverage is designed in an optimized way.
On the other hand, Guidotti et al. [23] present some considerations on beam size for Non-Terrestrial Network systems when considering random access and time adjustment procedures. They propose a simple but effective methodology to obtain the maximum beam footprint size, in terms of semi-main axes, when considering the real allowable design for the random access and time advance adjustments.
Regarding the cost per bpst, Guan et al. [9] provide an overview of VHTS satellites, including technical and commercial considerations, and discuss important key parameters and trade-offs, as well as a decision tree and cost–benefit analysis. However, they leave out important aspects such as the ground segment, and the authors consider only regular coverage.
In addition, Ortiz-Gomez et al. [8] propose an optimization methodology to design VHTS systems based on geostationary platforms to obtain the minimum cost per Gbps in orbit, where optimization depends not only on the number of beams, but also on the G/T of the user and the availability of the link, according to a set of technical and commercial requirements. This methodology minimizes the cost per Gbps in orbit and maximizes the channel capacity per beam, based on an analytical expression of the average CINR (Carrier to Interference plus Noise Ratio). However, this methodology only considers a regular multibeam coverage, assigning the same channel capacity in all beams, without considering that the traffic demand is not uniform over the service area.
Technologies currently exist that allow the payload to allocate resources, e.g., power, bandwidth flexibly, or beam-hopping illumination time, but these technologies significantly increase the cost of the payload, consequently losing the VHTS advantages to reduce the cost of Gbps in orbit, plus it adds latency due to processing time [5]. In this sense, the paper aims to present an optimization methodology for the design of a VHTS payload that provides multibeam coverage with irregularly sized beams depending on the traffic demand distribution of the service area, in addition to optimizing the coverage provided by the satellite and minimizing the cost per Gbps in orbit. The main contributions of this work can be listed as:
- A new cost function is proposed to design VHTS satellite systems using irregular coverage that allows to simultaneously minimize the cost per Gbps in orbit, the Offered Capacity Error, and the Normalized Coverage Error, including traffic demand distribution. The multibeam coverage error study for regular and irregular beams size coverage is introduced for the first time as an optimization variable.
- A trade-off is presented that compares the offered satellite capacity, the effective coverage, area, and satellite cost per Gbps in orbit.
- In contrast to the state of the art, antenna design parameters are taken into account for system optimization.
The rest of the paper is organized as follows: Section 2 describes the VHTS system model explaining the technical and commercial features that allow evaluating the system link budget, Section 3 explains the design parameters in regular and irregular multibeam coverage and presents the cost function of this methodology, Section 4 explains the proposed methodology to optimize irregular coverage in the service area while minimizing the cost function, Section 5 presents a case study and the evaluation of the proposed methodology; finally, in Section 6, the conclusions are presented.
2. System Model
In a multibeam system, the coverage footprint of each beam can be described as the curve formed by the intersection of the conical model of the antenna beam with a spherical model of the Earth. The variation in the number of beams depends on the beamwidth of the antenna beams. If the beamwidth is reduced, the area covered by each beam will be smaller, so the number of beams will be increased to match the total coverage area [8,20]. This affects other parameters such as directivity, the diameter of the satellite antenna, as well as the definition of the feed cluster.
The system is composed of beams. In the following, we consider the satellite to be a bent pipe transponder architecture. The satellite–gateway feeder link is not considered in the forward link because different technologies are considered to ensure the overall link budget, such as ULPC (Uplink Power Control) and gateway diversity [24,25]. The propagation model used is explained in detail in our previous work published in [8], which is based on the recommendations of the ITU [26] and DVB-S2x [27] standard.
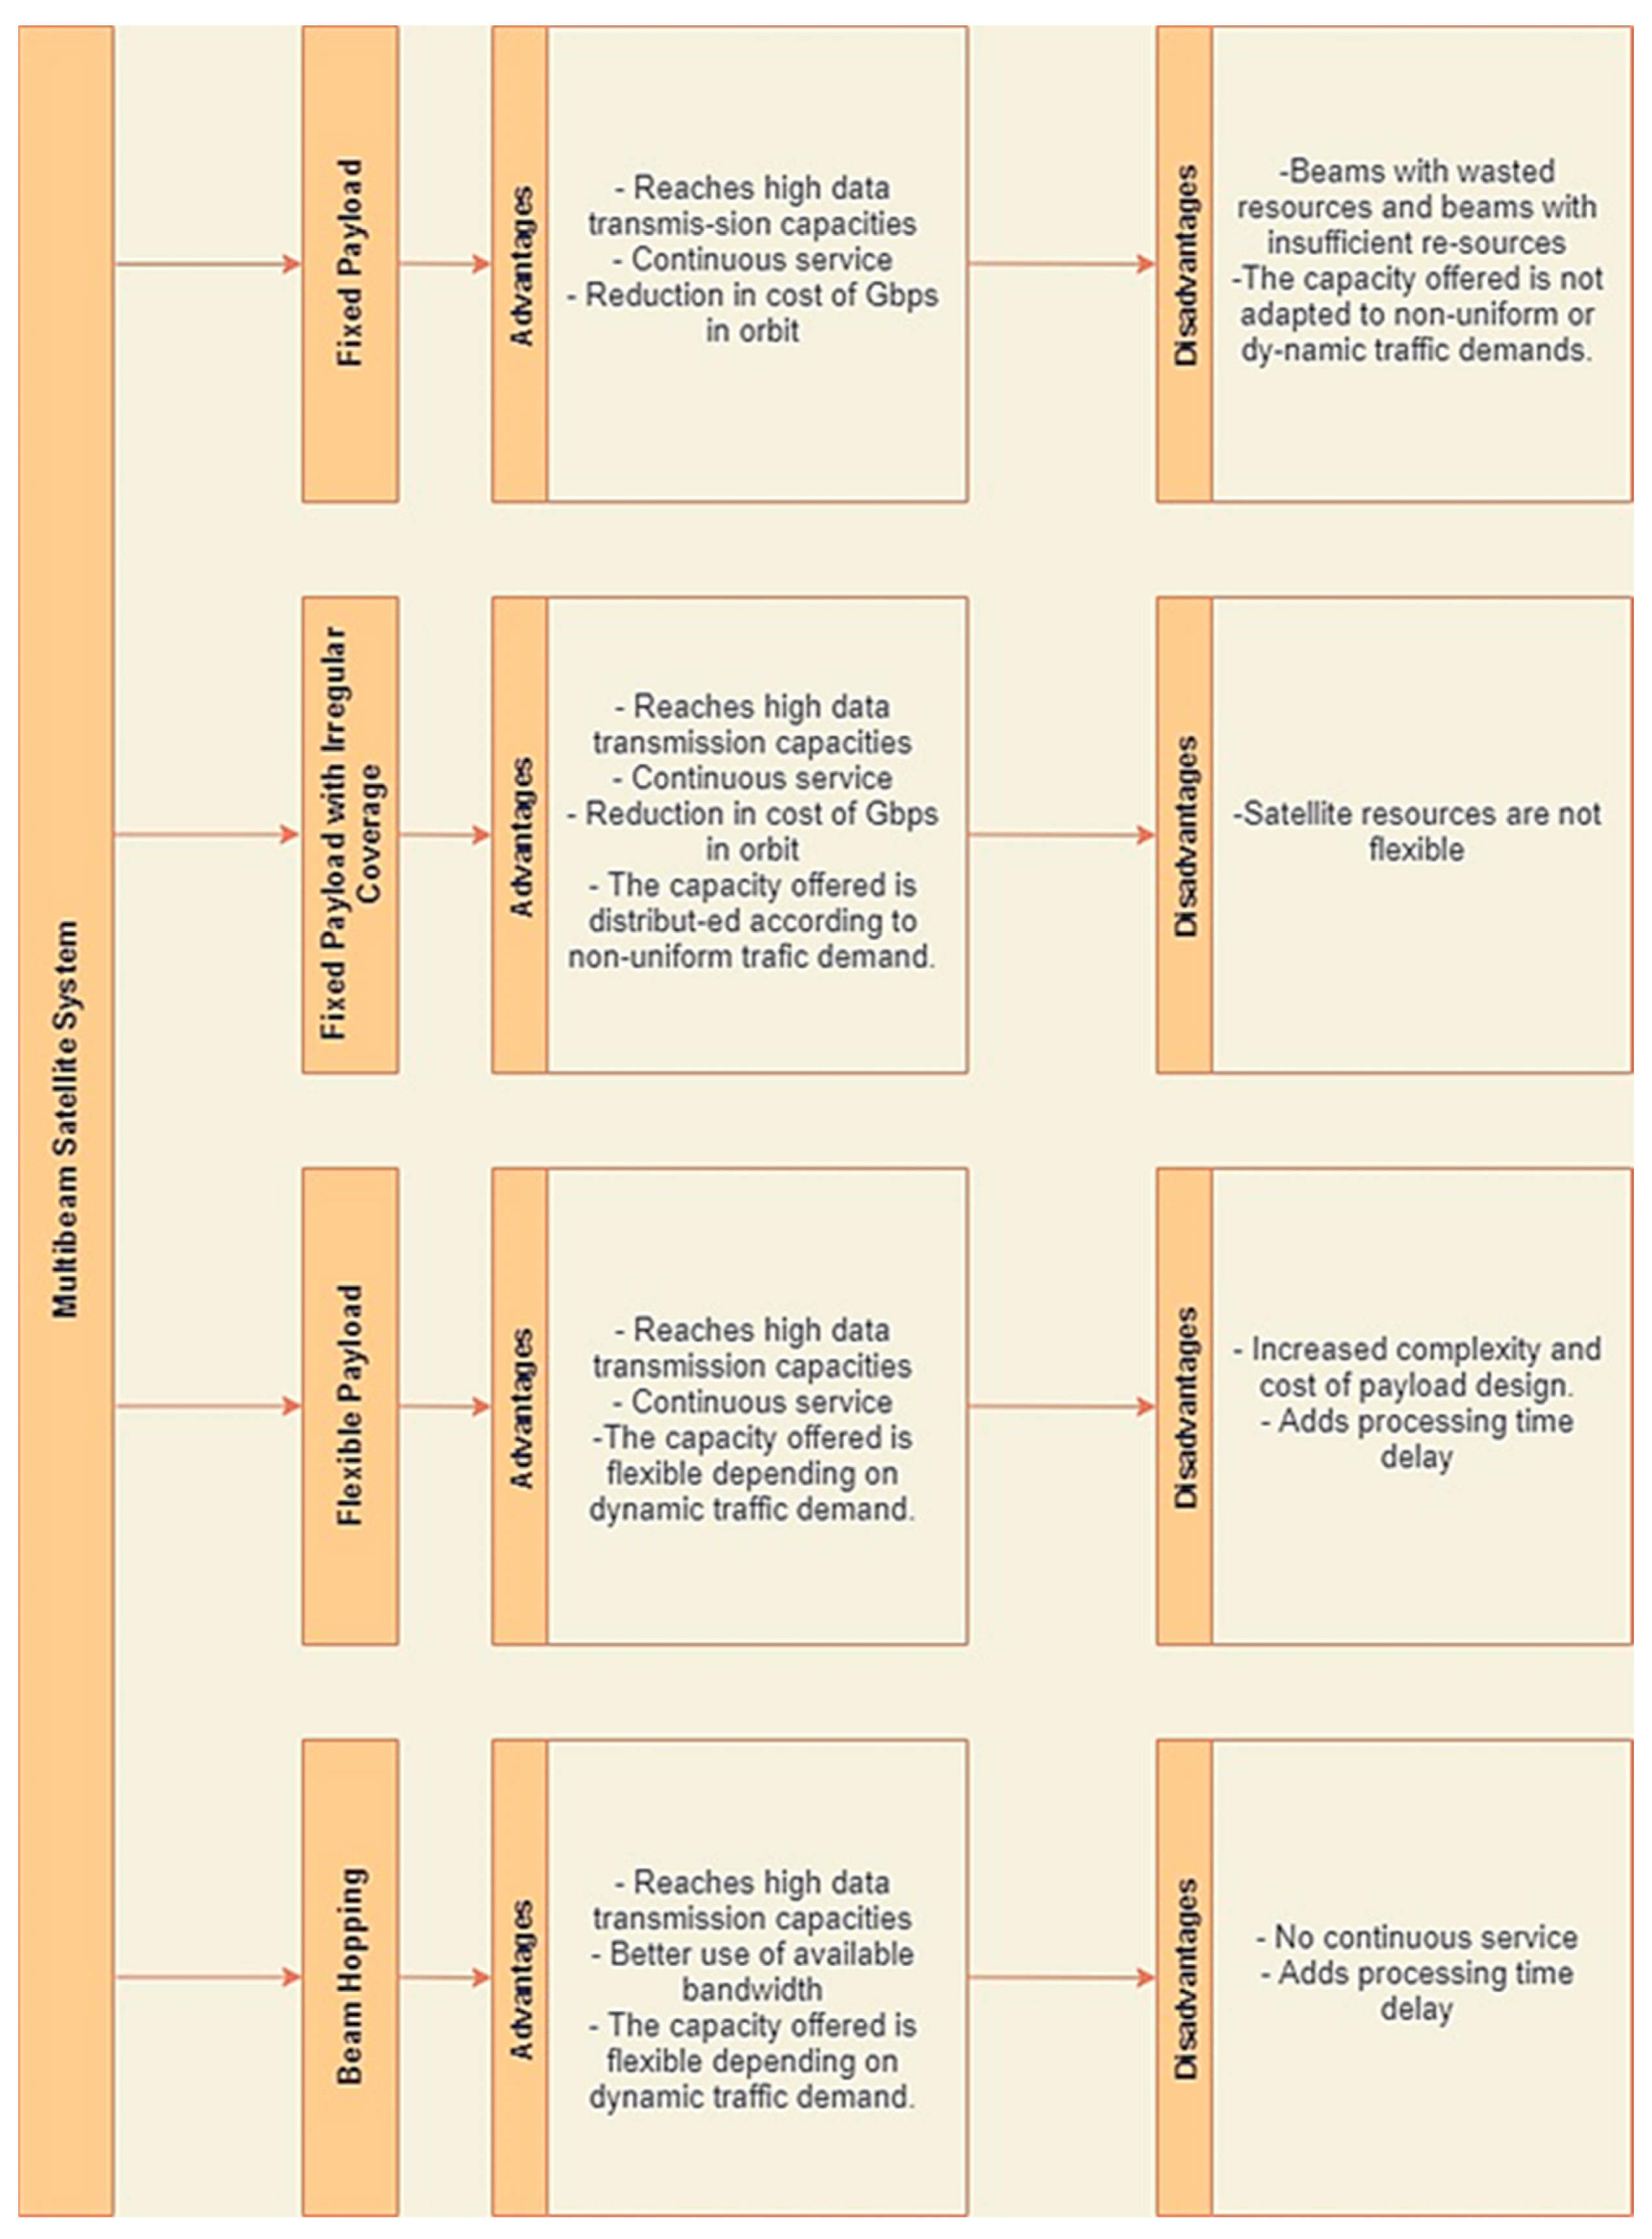
Figure 1 shows that four types of multibeam VHTS systems can be defined in Geostationary orbit: Fixed Payload, Fixed Payload with irregular coverage, Flexible Payload, and Beam Hopping. Figure 1 shows the main advantages and disadvantages of each system.
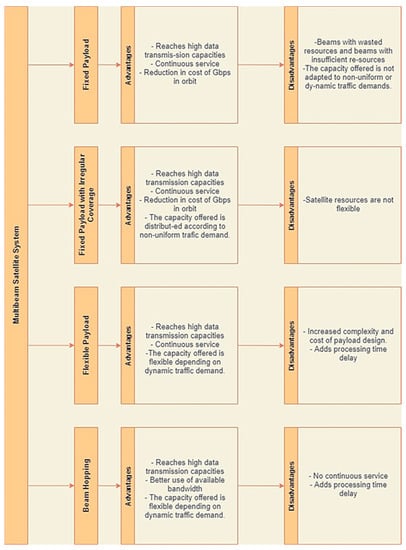
Figure 1.
Very High Throughput Satellites (VHTS) multibeam system features.
One of the most outstanding advantages of fixed payload systems is the reduction of the cost of Gbps in orbit; however, once the satellite is in orbit, its offered capacity is not flexible, which results in some beams having insufficient resources while other resources are being wasted [8,17]. On the other hand, in a Flexible Payload system, this problem is solved since the resources are adapted according to the dynamic traffic demand, but this increases the complexity and cost of the payload design, thus losing the advantage of the cost reduction of Gbps in orbit of the Fixed Payload systems [5].
Furthermore, the bandwidth in the systems that use Beam Hopping is distributed in a more optimal way since it has an adequate illumination plan and a Single Frequency Network can be implemented to use all the available bandwidth. In that sense, the illumination plan of the system will depend on the traffic demand [28], but this has a significant drawback that despite being a satellite in Geo orbit, it will not provide continuous service; this is because the loading and unloading of data will depend on whether the beam is illuminated or not. This makes this type of system unsuitable for ultra-reliable and low latency communications services in a 5G environment.
In this work, we study the optimization of the design of a Fixed Load system using Irregular Coverage since this type of system architecture maintains the advantages of a Fixed Load, such as cost reduction in Gbps and continuous service. In addition, the capacity offered is distributed according to the study of the traffic demand in the service area. The last reduces the difference between the offered capacity and the required capacity.
2.1. Offered Capacity and Distribution of Traffic Demand
The offered capacity by the b-th beam depends on the beam bandwidth as , where BWb is the bandwidth and the is the spectral efficiency, both in the b-th beam. is the spectral efficiency of the ModCod (Modulation and Coding) scheme of a commercial modem of the DVBS2-x standard [27]. Hence, the spectral efficiency in each beam depends on the Carrier to in the same beam.
As explained in [8] the depends on the Carrier to Interference plus Noise Ratio, , and in turn, the will depend on the beamwidth assigned to the b-th beam, , using the traditional link budget calculation.
On the other hand, the capacity required for the b-th beam in a real system changes depending on the time of day. However, some technologies propose to allocate power and bandwidth according to these changes during the day [29,30,31,32,33]. However, we assume that the main difference between the average traffic requirement during a full day from one beam to another depends mainly on population density and the penetration rate in the service area [34].
The traffic demand analysis will be divided into two parameters for the definition of the model: traffic model and required capacity.
- Traffic model (required throughput density): this parameter represents the information on the customs and habits of users when they access the service. It is essential to know the connection habits of the users since it is possible to estimate the areas where more connections are produced, and therefore, more capacity is required; this variable is represented in bps/Km2.
- Required Capacity: this parameter provides information on the data rate required per beam and will depend on the traffic model used (bps/Km2) and the area of the beam (Km2).
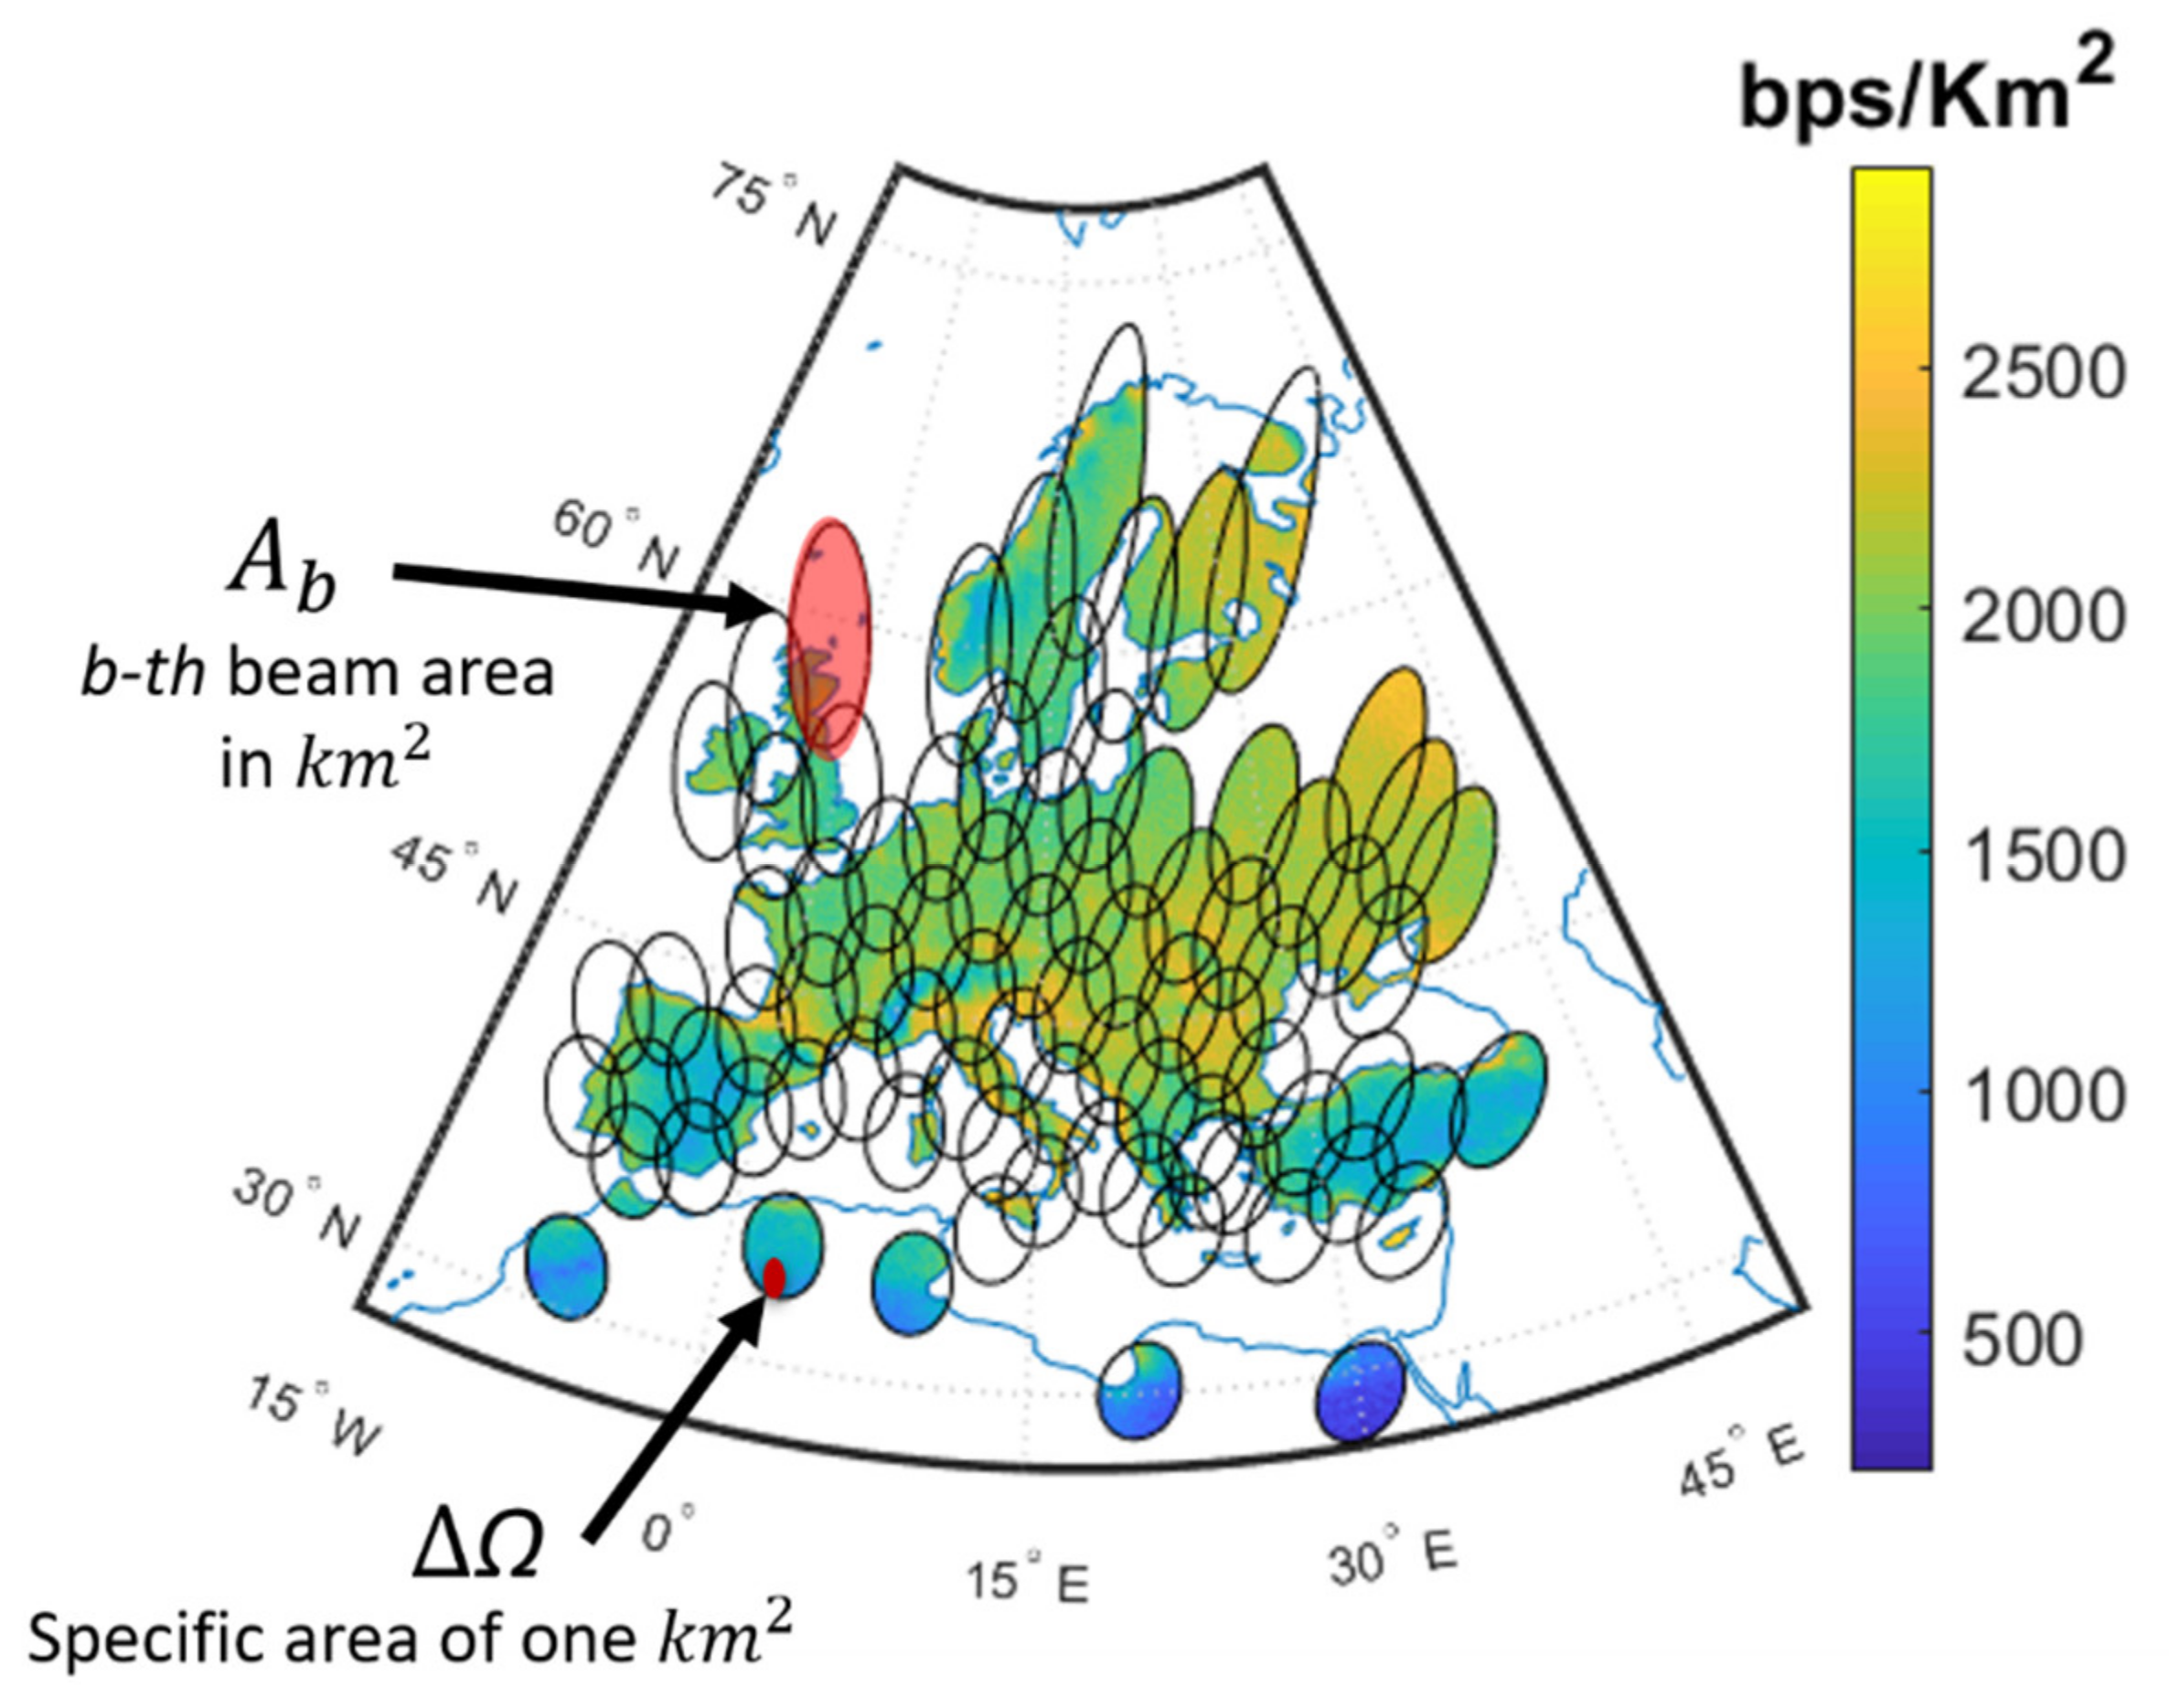
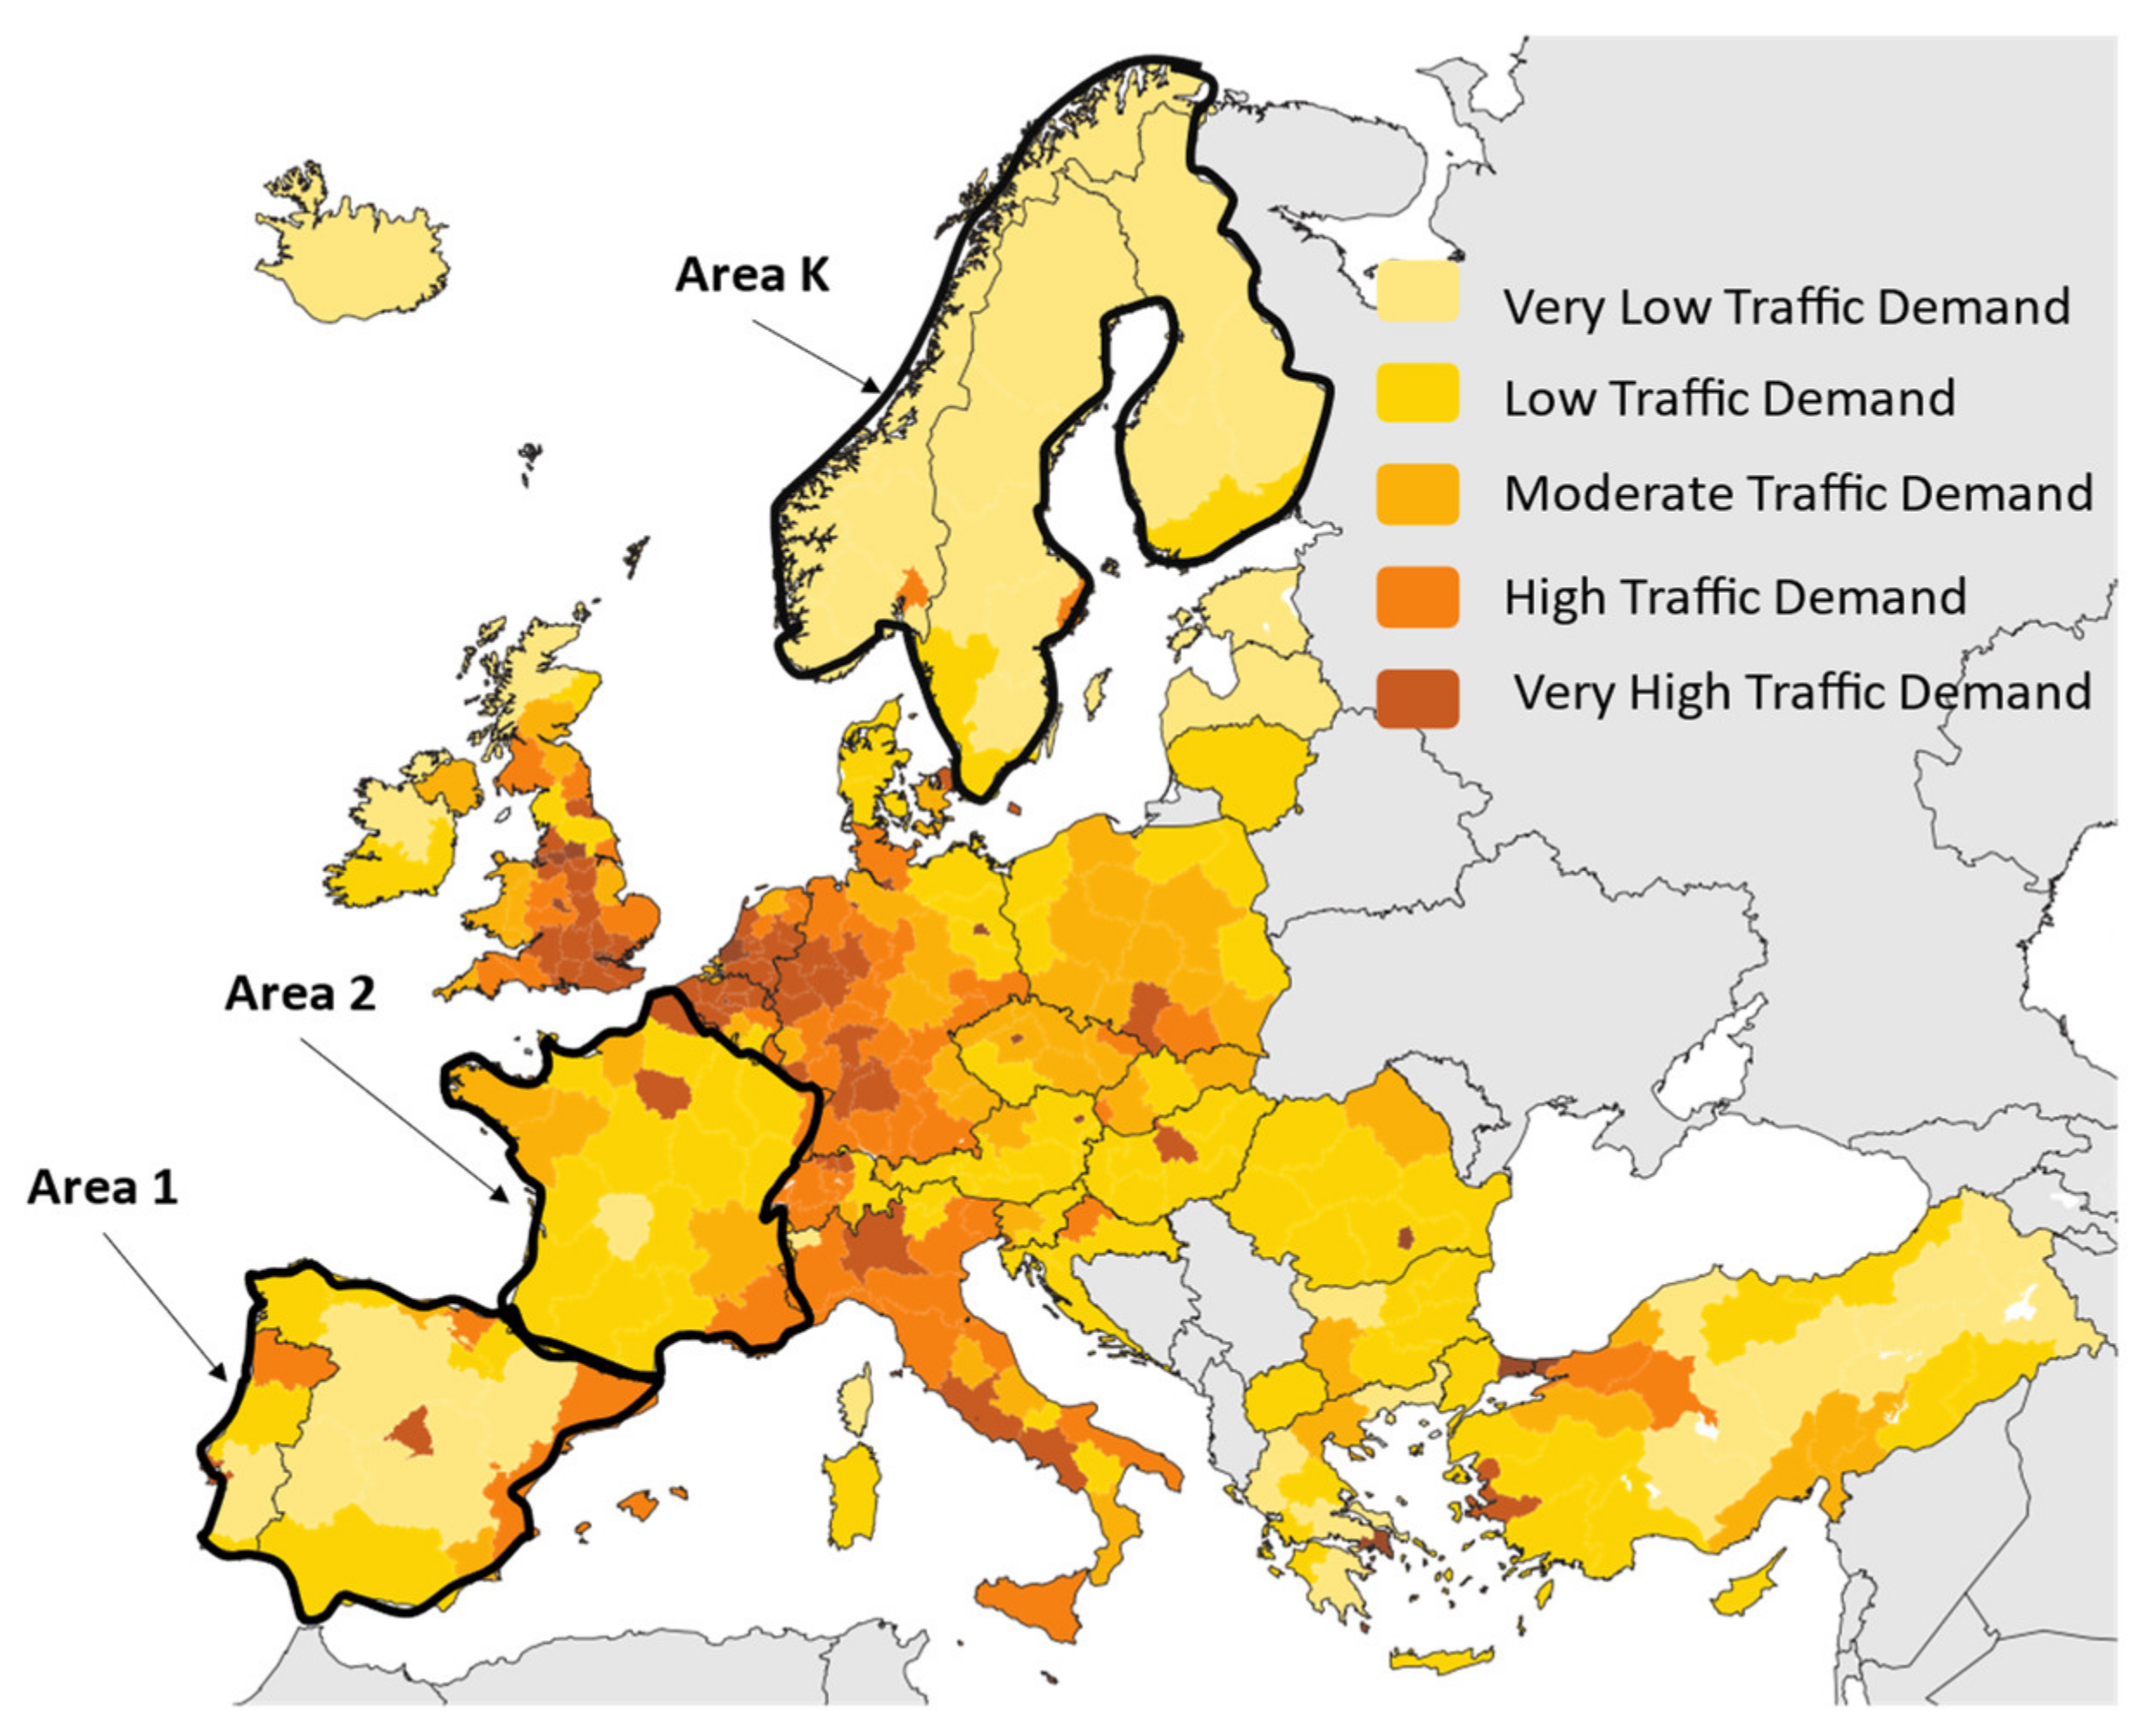
In this sense, Figure 2 represents a hypothetical non-uniform traffic distribution over Europe. We can see that in a multibeam coverage, each beam will have a different traffic requirement, and this traffic demand will depend on the beam area and the average required capacity per km2. Thus, if we define as a specific geographic area of one km2, as the value of required throughput density per km2 (in bps/km2) inside , as expected value over all the area inside b-th beam (in bps/km2) and as b-th beam area (in km2), then, the requested traffic for the b-th beam (in bps) is calculated as (1):
where is a function of the beamwidth (), and the is the ratio between the satellite’s orbital position and the geographical coordinate of the center of the b-th beam.
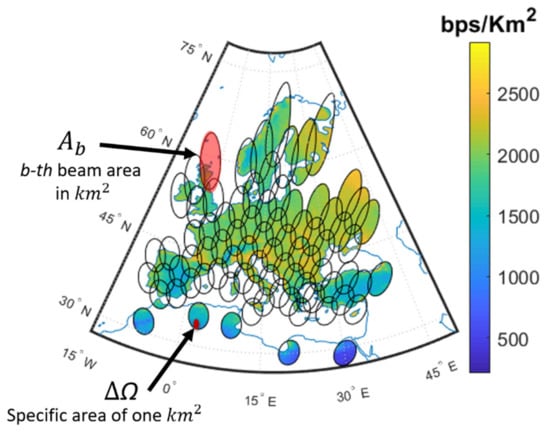
Figure 2.
Required traffic distribution in the service area. The traffic demand will depend on the beam area and the average required capacity per km2.
The throughput density per km2 ( depends on the throughput per user (, in bps/user), the population density (, in inhabitant/km2), the penetration rate (, in user/inhabitant), and the concurrence rate (hence:
2.2. Technical and Commercial Requirements
Requirements of ground segment for feeder link affect the calculation of the minimum number of gateways, also depending on the use of Q/V or Ka-band in the feeder link. The recommended solution is to use a mixed Q/V band on the feed link and Ka-band on the user link to maximize system capacity [35]. This approach is recommended since the bandwidth available in the Q/V band is greater, and an additional system capacity can be obtained; therefore, a reduction in the cost of Gbps is achieved.
Ortiz-Gomez et al. [8] develop a proposal on calculating the number of gateways needed based on the number of beams. In this sense, the model in (5) is proposed to evaluate the cost of one gateway, which aggregates the cost associate with the number of user beams fed by the gateway () and the cost of the antenna () [8].
where is the gateway cost (in M€), is the number of user beams per gateway, and DGW is the antenna diameter of the gateway. and are empirical constants to adjust the cost to monetary units [8]. The total cost of the ground segment is the sum of the cost of the gateways.
The satellite cost model () includes a constant cost of 180 M EUR [20], including an average launch cost of 100 M EUR and a fixed cost of 80 M EUR as the minimum price of a broadband payload. A corrective term has been added according to the number of beams (B) [20]:
The cost per Gbps in orbit () can be calculated using (7) and (8) [8]:
where is the total system cost in M EUR, is the satellite cost in M EUR, is the total ground segment cost associated with gateways in M EUR, and is the total satellite capacity.
3. Problem Statement
3.1. Coverage Model
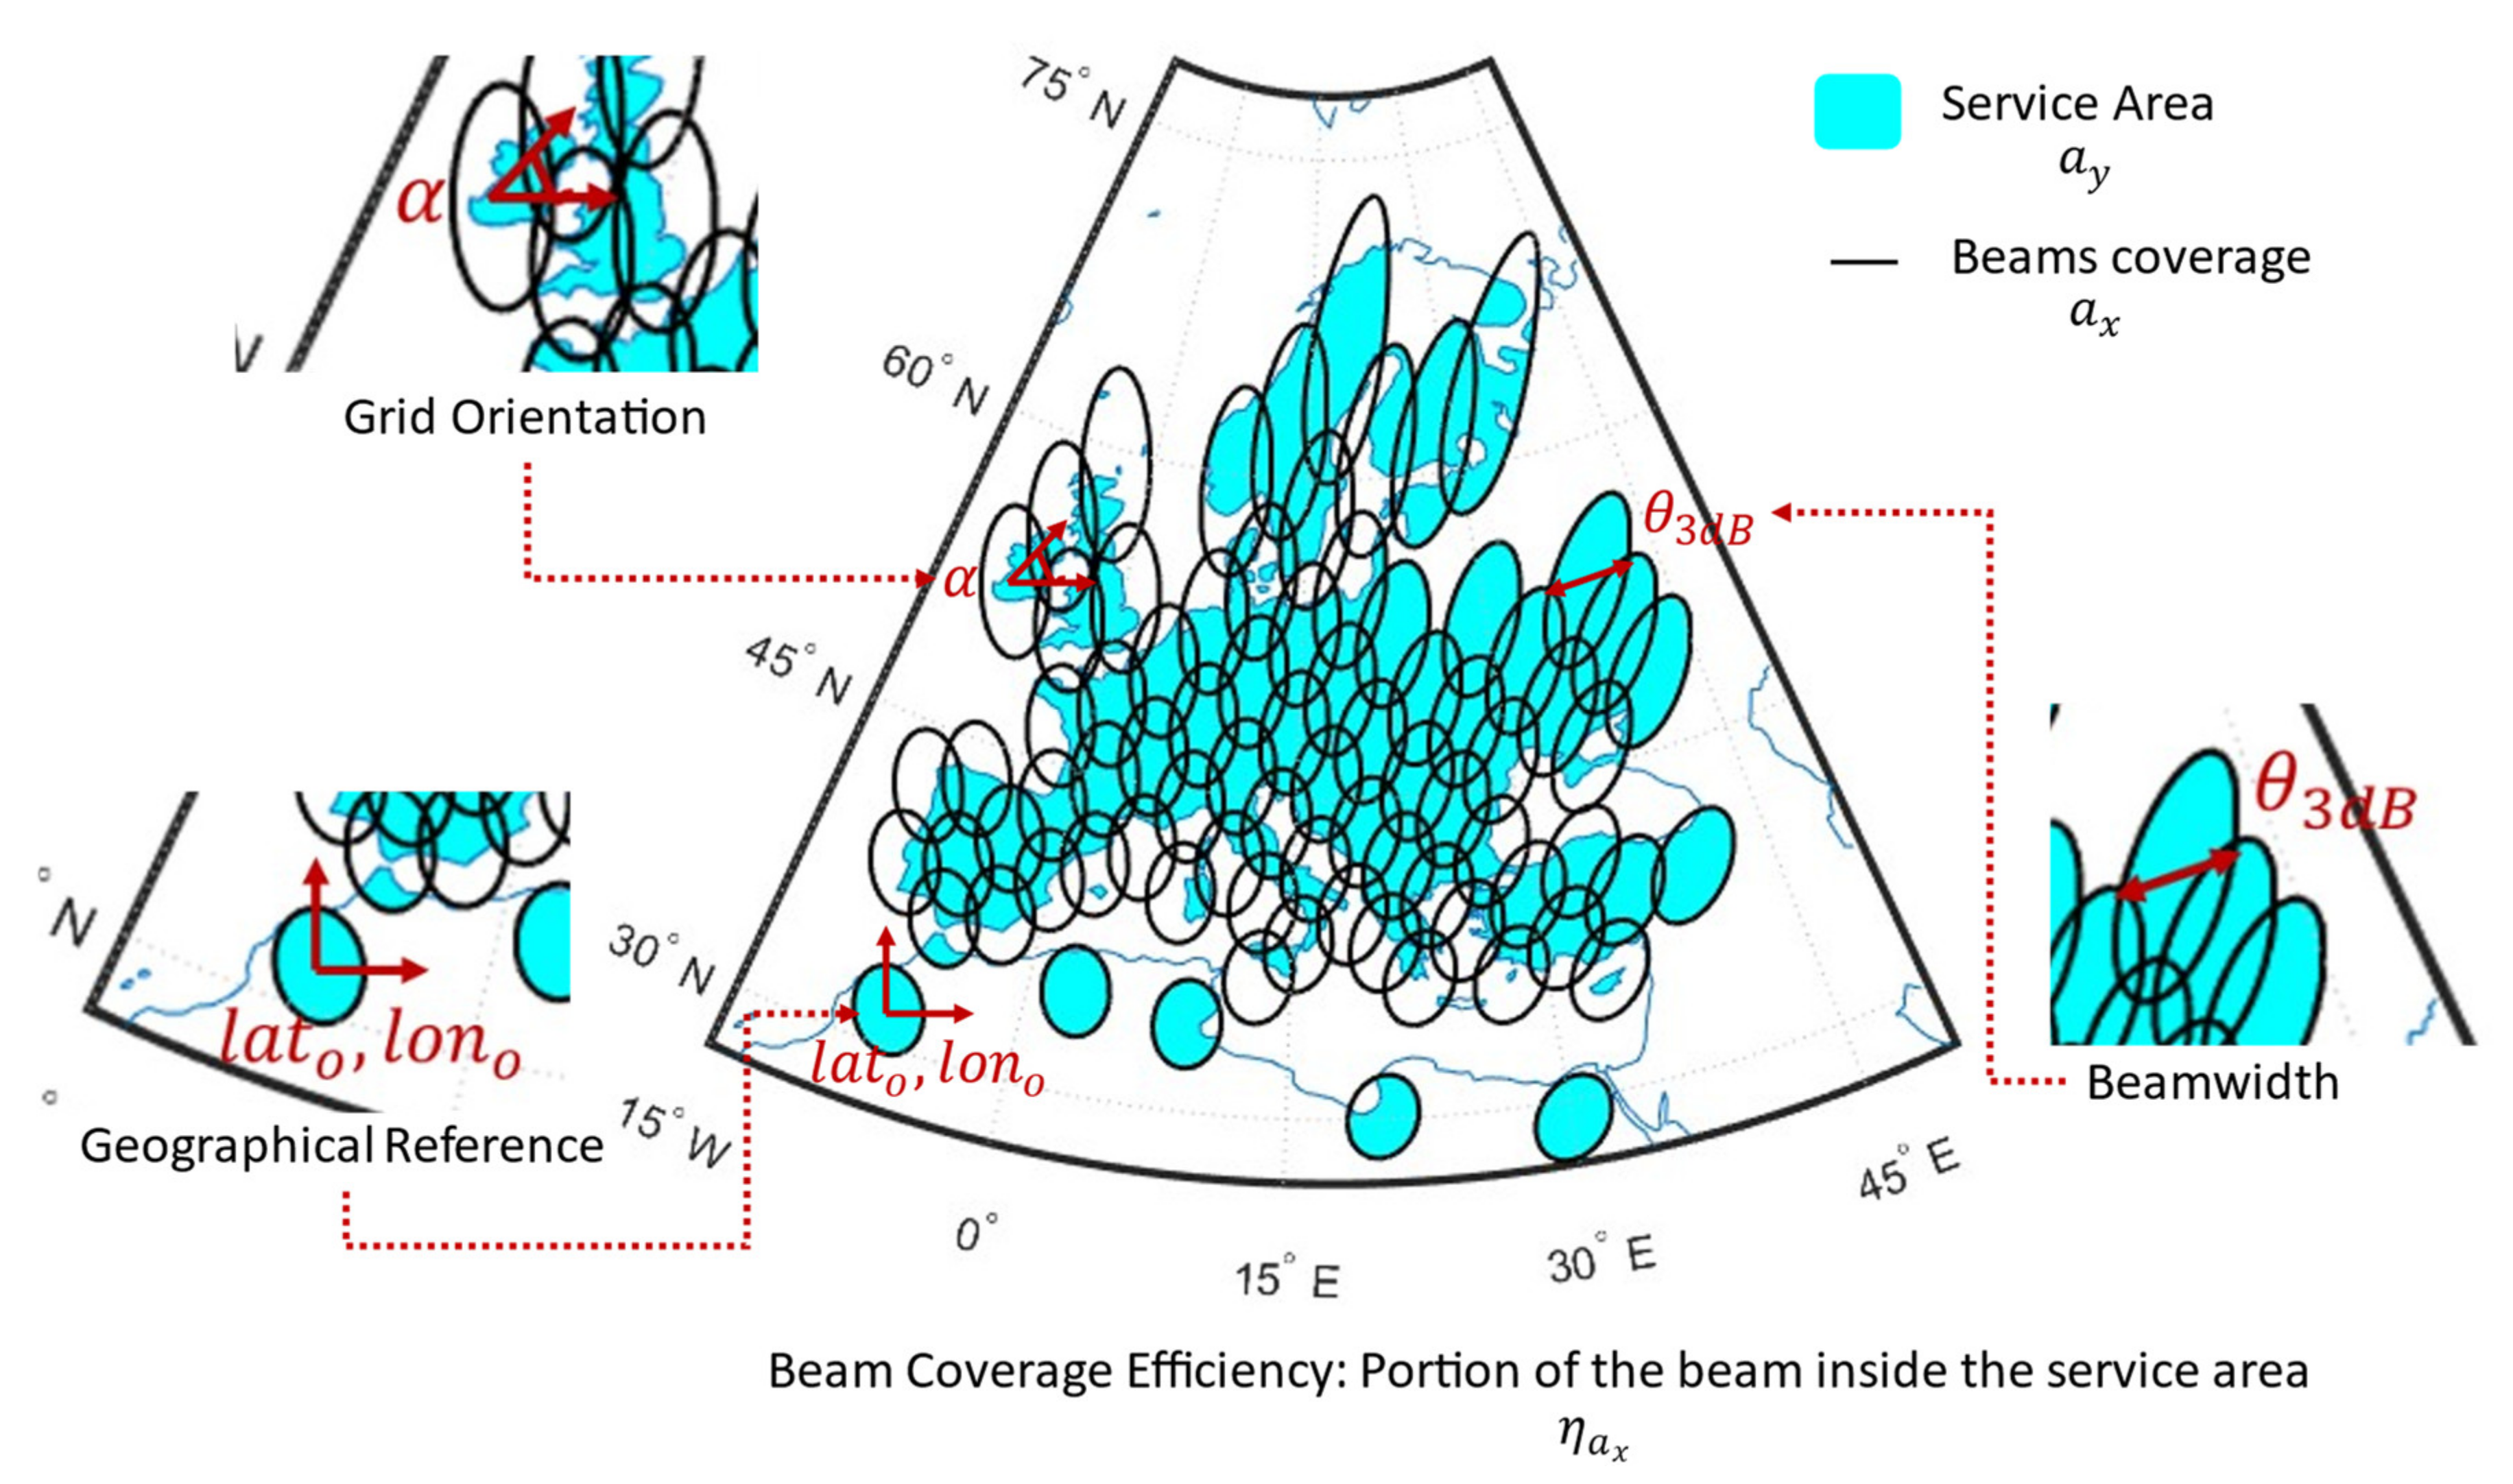
The coverage model generated by a Multibeam Satellite providing coverage with regular size beams can be defined based on system parameter design. Figure 3 shows the parameters that influence the design of the regular multibeam coverage. In the figure, represents the required service area (in square kilometers), and the blue area represents it. The lato and lono are the geographical position references, where the satellite antenna points its first beam. The parameter is the half-power beamwidth and depends on the satellite antenna design. The inclination angle α represents the beam’s grid orientation concerning the equator, being positive from east to north. Finally, the coverage beam efficiency is the proportion of each beam inside the service area, and it must be greater or equal to the minimum required for each beam. In that sense, is the resulting service area, also known as satellite coverage (in square kilometers), and it is represented as the area occupied by the beams, considering overlapping. When any design parameters are changed, the satellite coverage is wholly modified, changing the number of beams required to cover the same service area.
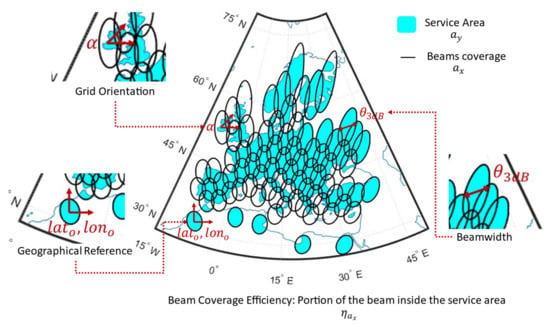
Figure 3.
System parameters that influence the design of the multibeam coverage. is the required service area (in square kilometers). The pair of lato and lono are the geographical position references. The parameter is the half-power beamwidth. The inclination angle α represents the beam’s grid orientation.
With the above, we can define the Normalized Coverage Error (E) between the service area and the coverage area, which is represented in Equation (9), where depends on the system parameter design .
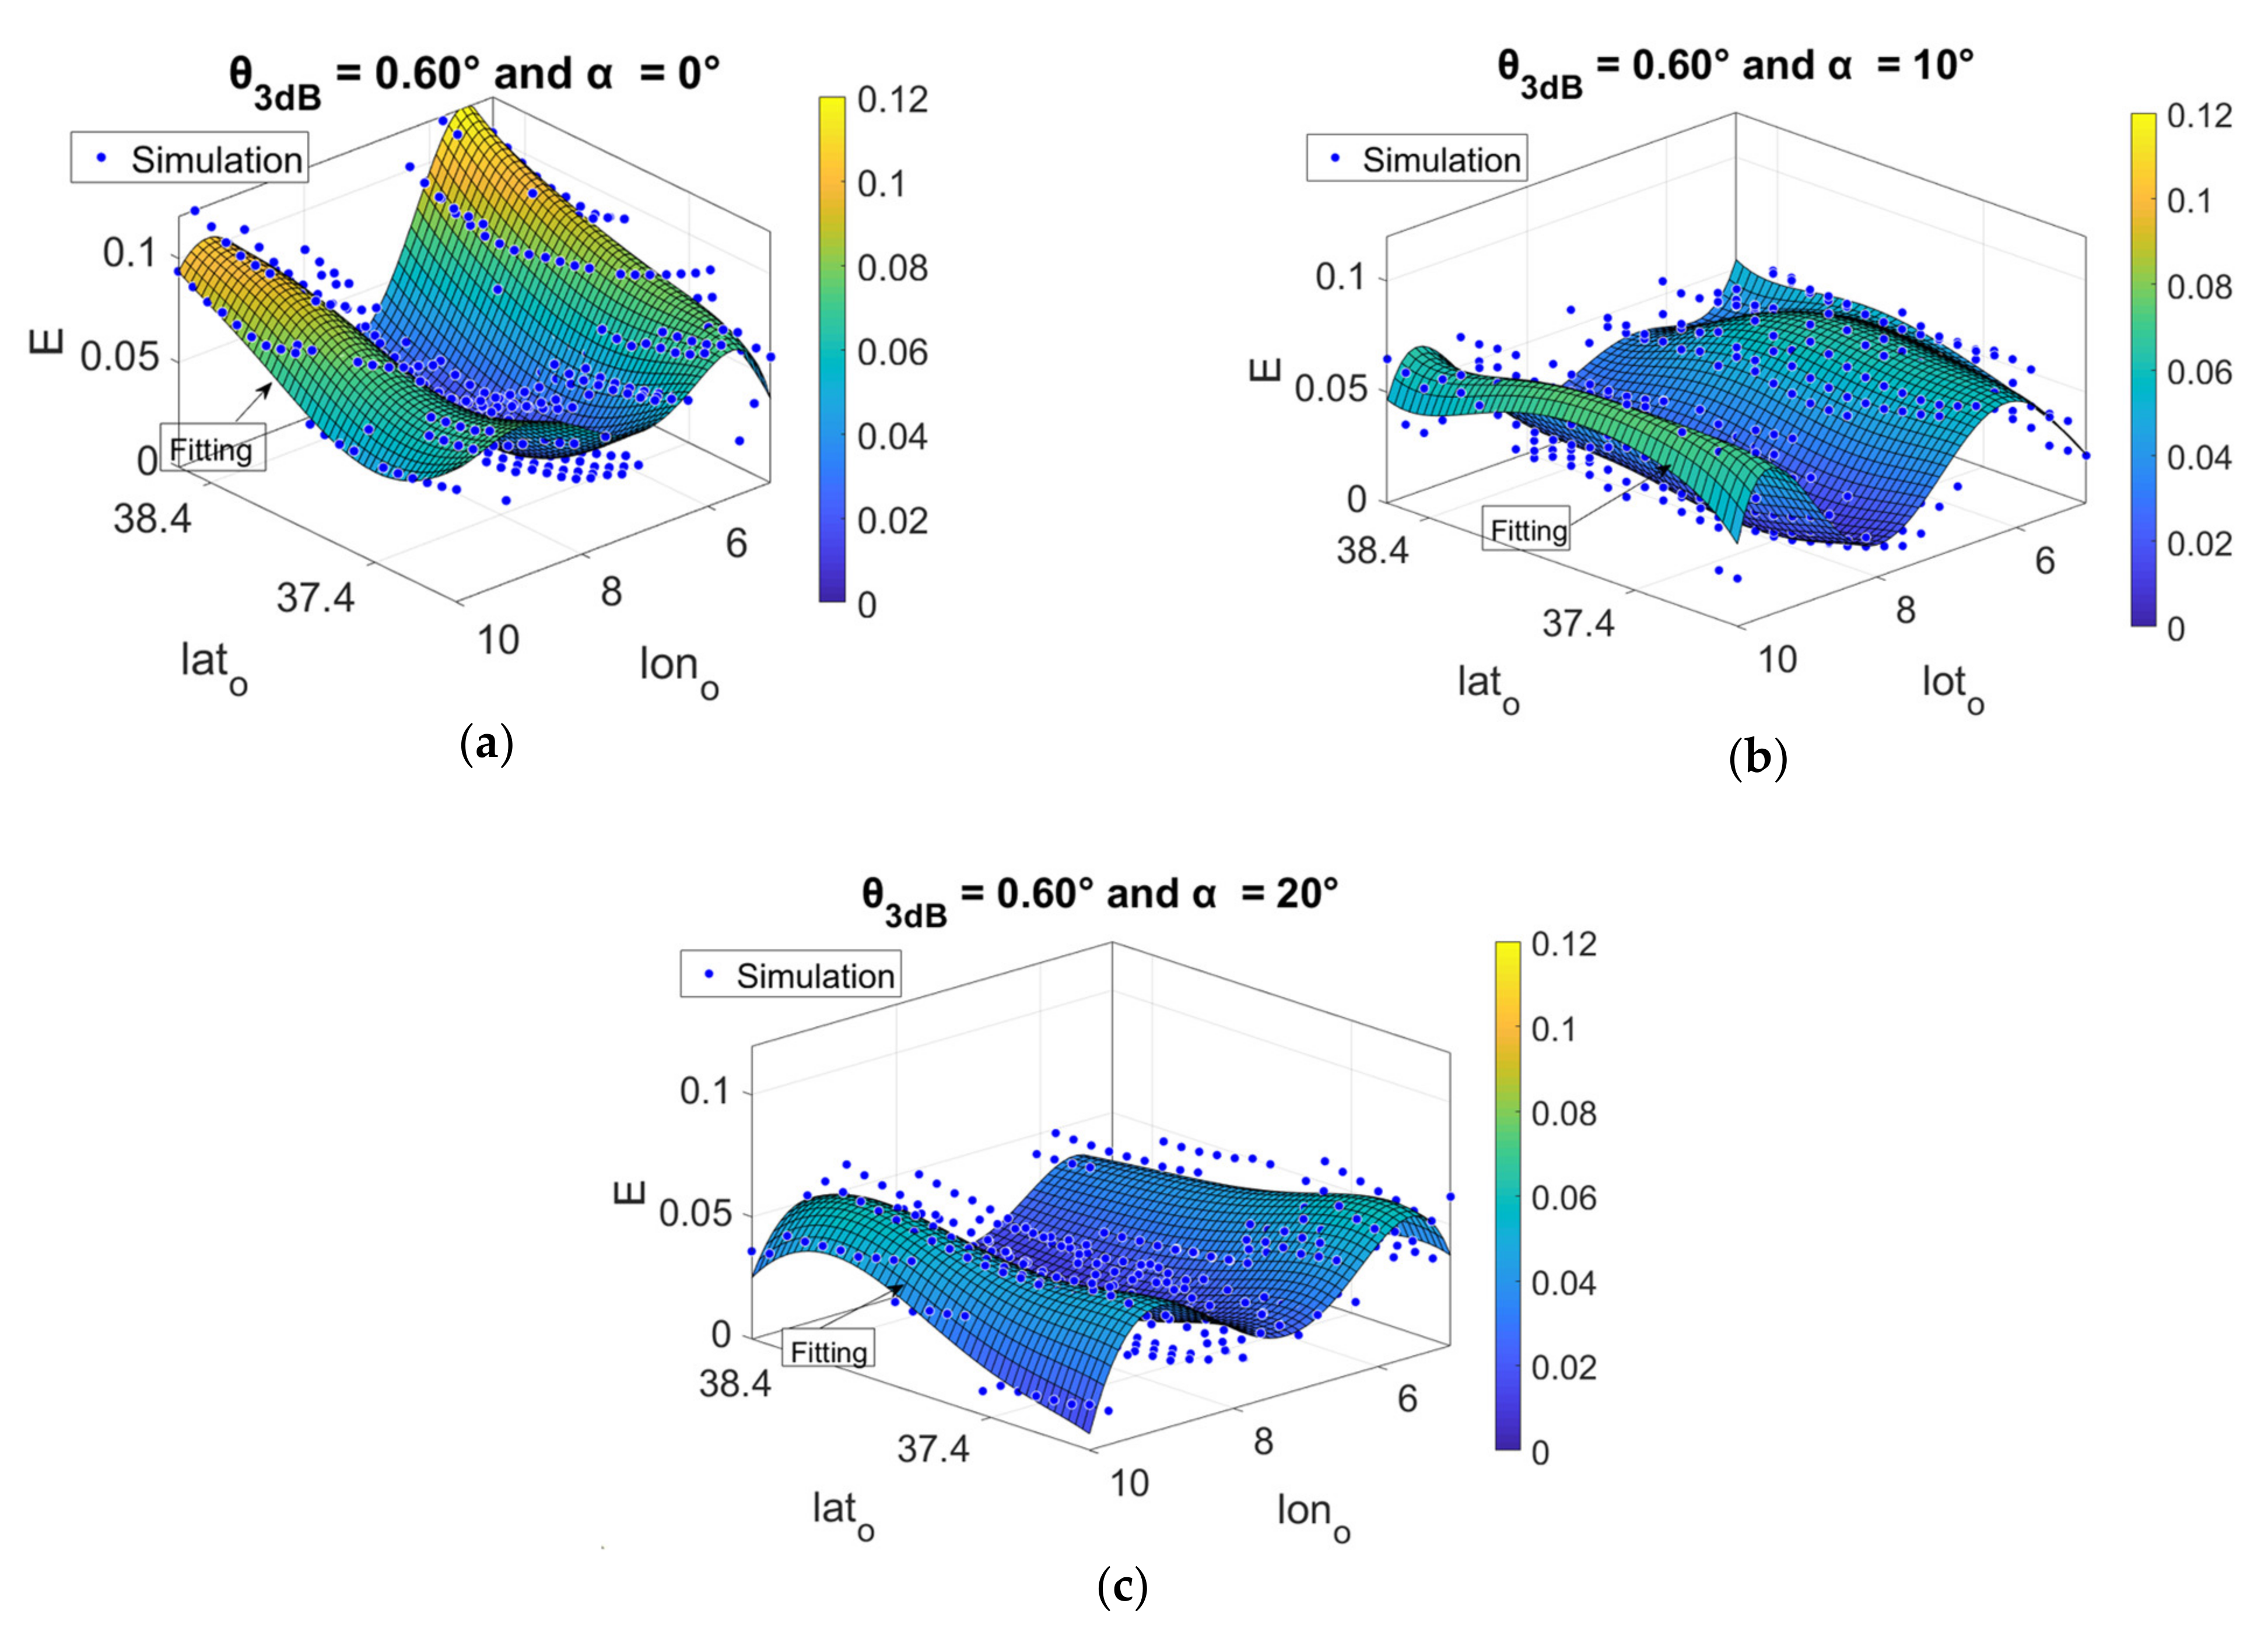
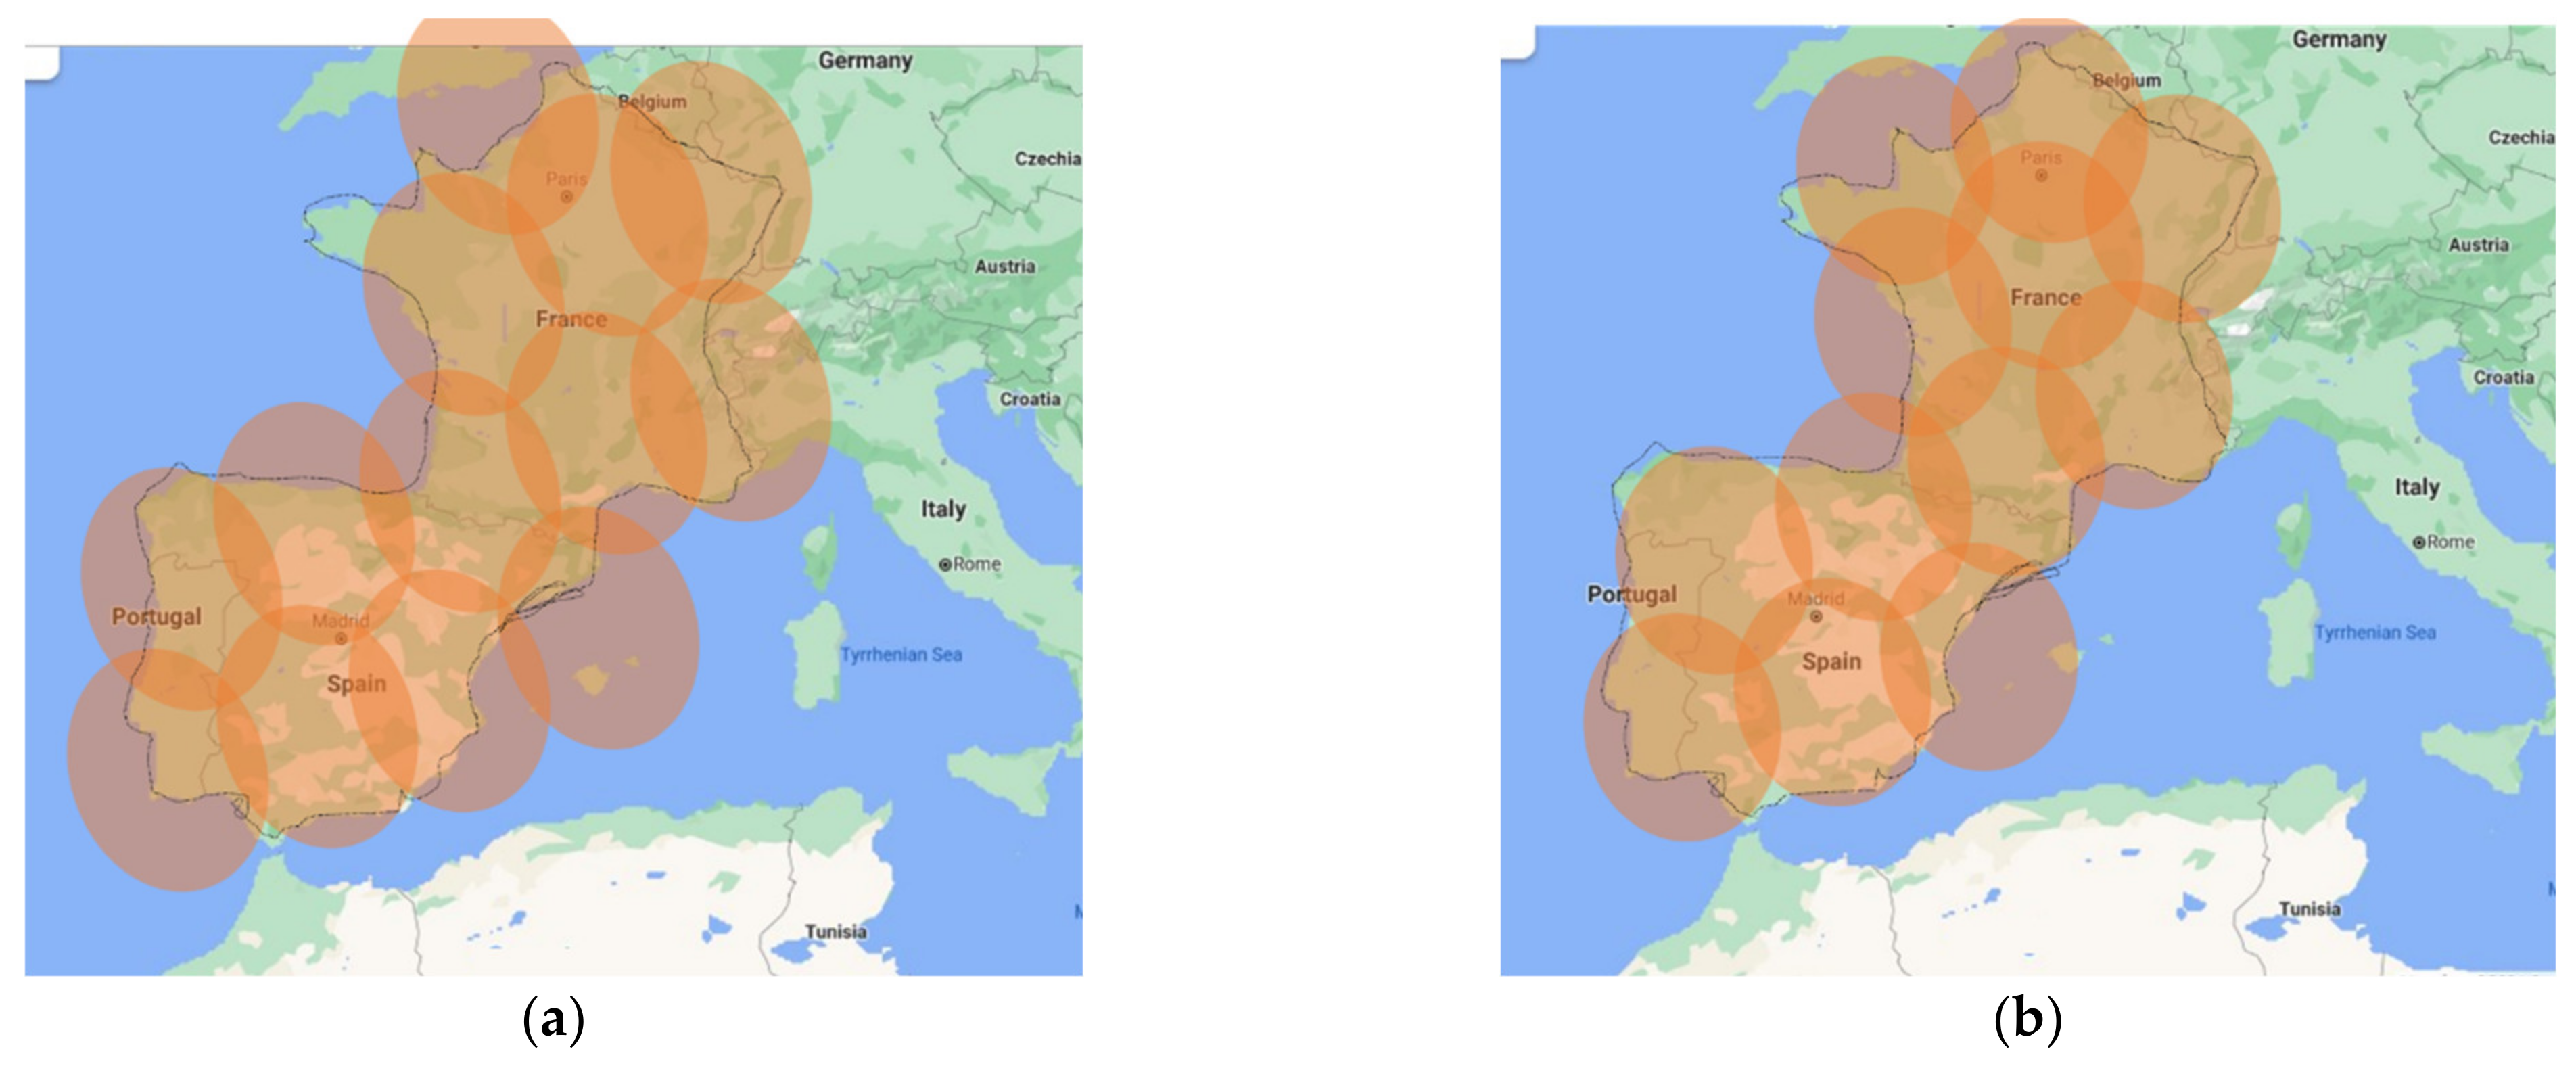
In this sense, Figure 4 shows the Normalized Coverage Error using different and to provide coverage over Portugal, Spain, and France. It is shown how the varies as a function of the reference coordinate () for and three different values of (α = 0°, α = 10° and α = 20°). It is observed that for each combination of and α, there is a different behavior, so the optimum point also changes from one case to another. That is to say, every possible combination of parameters and represents a value of the Normalized Coverage Error, but not only that, in addition, each combination may require a different number of beams, as shown in Figure 5. This figure shows the coverage offered using two possible scenarios of the design parameters (= 0.66° and = 20°, = 0.61°, and = 18.6°); the service area is marked with black color, and for these two scenarios, coverage is offered but with a different number of beams (12 and 10, respectively). This will have a great impact on the system as the cost per Gbps in orbit (see Section 2).
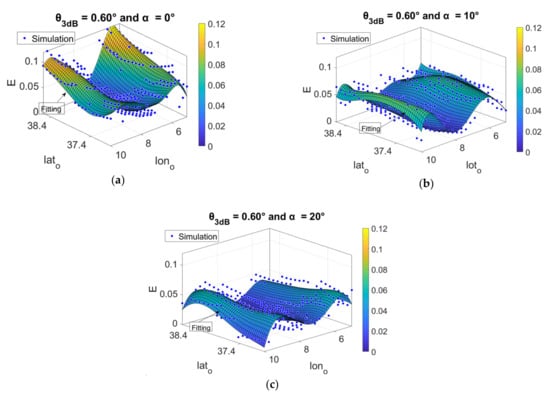
Figure 4.
Normalized coverage error of regular multibeam coverage for Portugal, Spain, and France with an orbital position of 9° E. (a) θ3dB = 0.60° and α = 0°. (b) θ3dB = 0.60° and α = 10°. (c) θ3dB = 0.60° and α = 20°.
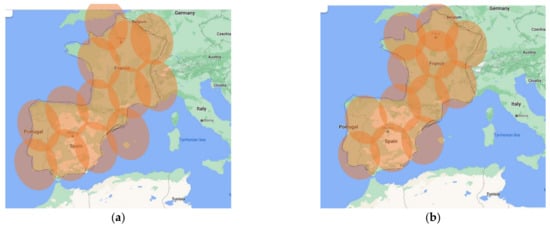
Figure 5.
Different number of beams needed for the same service area depending on the configuration of the parameters. (a) = 0.66° and = 20°: 13 beams. (b) = 0.61° and = 18.6°: 12 beams.
3.2. Coverage with Irregular Beams for Non-Uniform Traffic Distribution
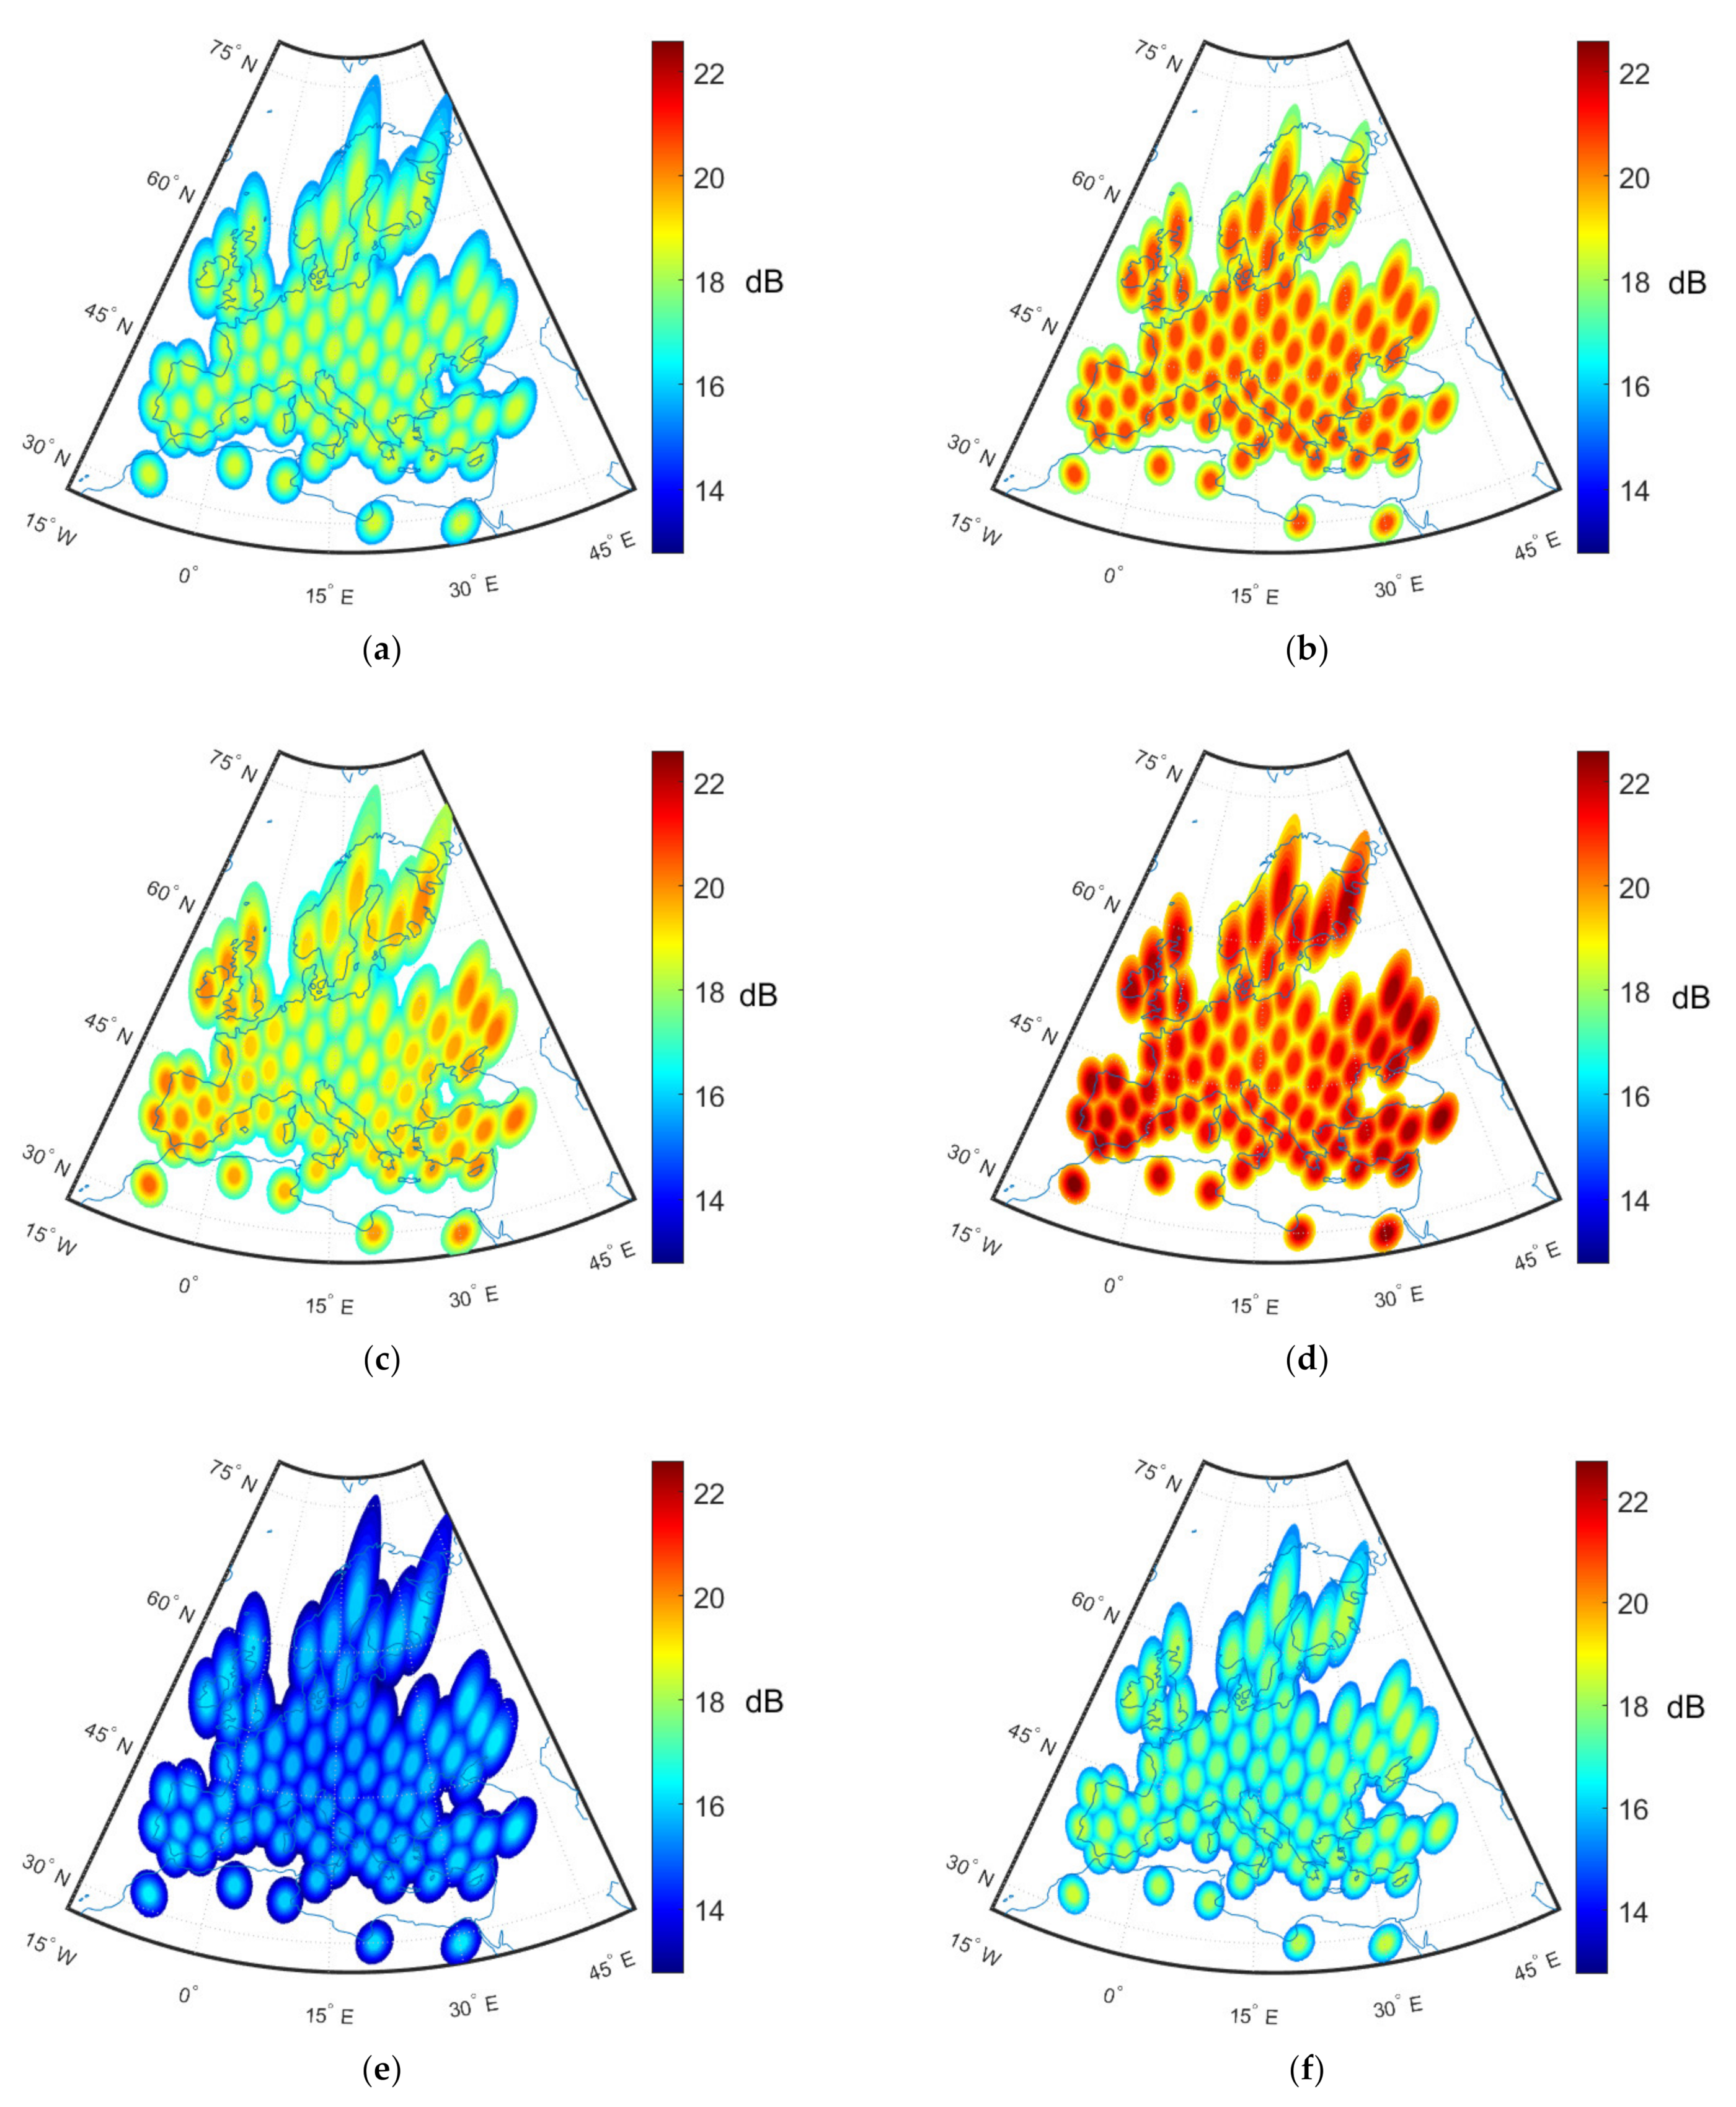
As explained above, the beamwidth has a significant impact on different parameters such as CNR (Carrier to Noise Ratio), CIR (Carrier to Interference Ratio), and CINR (Carrier to Interference plus Noise Ratio): this is clearly seen in Figure 6.
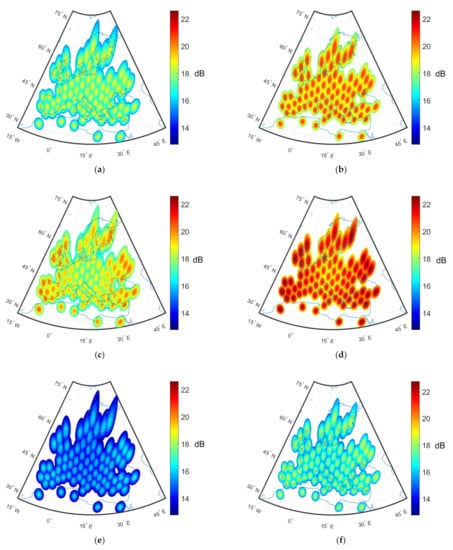
Figure 6.
CNR (Carrier to Noise Ratio), CIR (Carrier to Interference Ratio), and CINR (Carrier to Interference plus Noise Ratio) geographical maps in dB for the KaSat coverage and same number of beams but different beamwidths. (a) CNR in dB using = 0.65°. (b) CNR in dB using = 0.55°. (c) CIR in dB using = 0.65°. (d) CIR in dB using = 0.55°. (e) CINR in dB using = 0.65°. (f) CINR in dB using = 0.55°.
Figure 6 obtain a coverage similar to that of the KaSat satellite, which has an orbital position of 9° E [36], the same number of beams is maintained, but the impact of using two different beamwidths (0.65° and 0.55°) is evaluated. It is observed that when the beamwidth is reduced, the CNR increases in coverage since it has a greater directivity.
It is also observed the effect in the CIR using a four-color frequency reuse plan, and the CIR increases when the beamwidth is narrower; this is due to the radiation pattern used, but also because, on the one hand, it maintains the same number of beams and on the other hand the beam is more directive, decreasing the co-channel interference. Therefore, it can be assumed that the smaller the beamwidth, the higher the CINR value, which increases the offered capacity of each beam.
Based on the idea that the traffic demand is not uniform over the service area, we can assume that in regions of the service area with higher traffic demand, a small beamwidth should be assigned, and in the case of regions with low traffic demand, a larger size can be assigned.
With a previous distribution analysis of the average traffic demand in the service area, it can be divided into K regions that allow assigning different size beams according to the traffic requirement (Figure 7). The traffic demand study in the service area presented in Figure 7 to be divided into smaller areas is obtained according to the traffic demand based on population density [34]. Thus, we can define that the is:
where K is the number of regions, is the area of k-th region, which depends on traffic distribution. The total area of all regions established must equal the service area ().
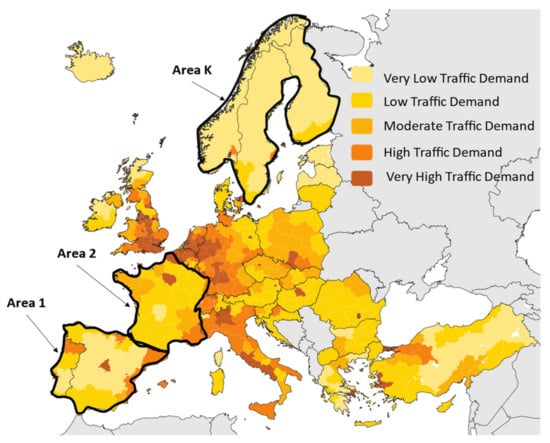
Figure 7.
Study of the traffic demand in the service area to be divided into smaller areas according to the traffic demand based on population density [34].
The Normalized Coverage Error (E) between the service area and the coverage area for irregular size beams is defined by:
Subject to
3.3. Cost Function for System Design Optimization
The system cost function is defined to design the most optimal coverage in the service area using irregularly sized beams. The cost function should be able to minimize the error between the (Cb) average offered capacity in each beam and the (Rb) average required capacity in each beam while also minimizing the (E) Normalized Coverage Error and the (CostGbps) cost per Gbps in orbit as explained in Section 2, Section 3.1 and Section 3.2.
where
Subject to
The system cost function (17 and 18) is aimed at minimizing three parameters: the first parameter is the error between the offered capacity in Gbps and the average required capacity in Gbps (Offered Capacity Error), where (in s/Gbit) is the weight of the Offered Capacity Error in the cost function. The second parameter is the Normalized Coverage Error (dimensionless), where (dimensionless) is the weight of the Normalized Coverage Error in the cost function. The three parameters are the cost per Gbps in orbit, in M€/Gbps, where (Gbps/M€) is the weight of the cost per Gbps in orbit.
As explained in Section 2, the capacity offered and required in the b-th beam depends on the () beamwidth assigned to that beam, and by using irregular coverage, the b-th beamwidth is determined as a function of the () assigned beamwidth in the K regions (19). In the same way, the coverage-normalized error depends on all the irregular coverage design parameters (). The cost per Gbps in orbit depends on the number of beams (B)and the assigned () beamwidth for each beam.
The () assigned beamwidth in the k-th region must belong to a set of possible values that depend on existing antenna design technologies (20). Moreover, the () grid inclination must also belong to a set established by the possibilities of technological developments for multibeam antenna (21), where T is the set size.
In (22), represents the m-th system constraint, such as the payload mass, the maximum total system cost, and diameter of antenna satellite, and represents the m-th set of possible values in the m-th system constraint.
4. Method: Optimization Methodology in VHTS Satellite System Design with Irregular Beam Coverage
With all the above mentioned, we can propose an algorithm for optimizing the multibeam satellite design that provides irregular coverage in the service area depending on traffic demand distribution.
On the one hand, the Normalized Coverage Error is a non-linear problem with non-linear constraints that could be solved using optimization algorithms such as non-linear programming with non-linear constraints [17]. On the other hand, the proposed cost function (18) seeks to minimize the Normalized Coverage Error and the Offered Capacity Error, and the cost of Gbps in orbit adds great complexity to the problem. Therefore, a first but effective methodology is proposed to obtain the optimal design parameters for VHTS satellites with irregular beam coverage.
As shown in Figure 8, this methodology mainly requires four inputs and generates three outputs. The inputs are the technical and commercial requirements, the available set of and , and the study of the traffic demand in the service area. Moreover, the outputs obtained are an optimal coverage design, which minimizes the cost function (18) and meets all the technical and commercial requirements, the KPIs, which are the cost of Gbps, the Normalized Coverage Error and the Error between the capacity offered and the required one, and the design parameters of the antenna feed cluster; these parameters are the pointing and the beamwidth of each beam.

Figure 8.
Inputs and outputs obtained with the proposed methodology.
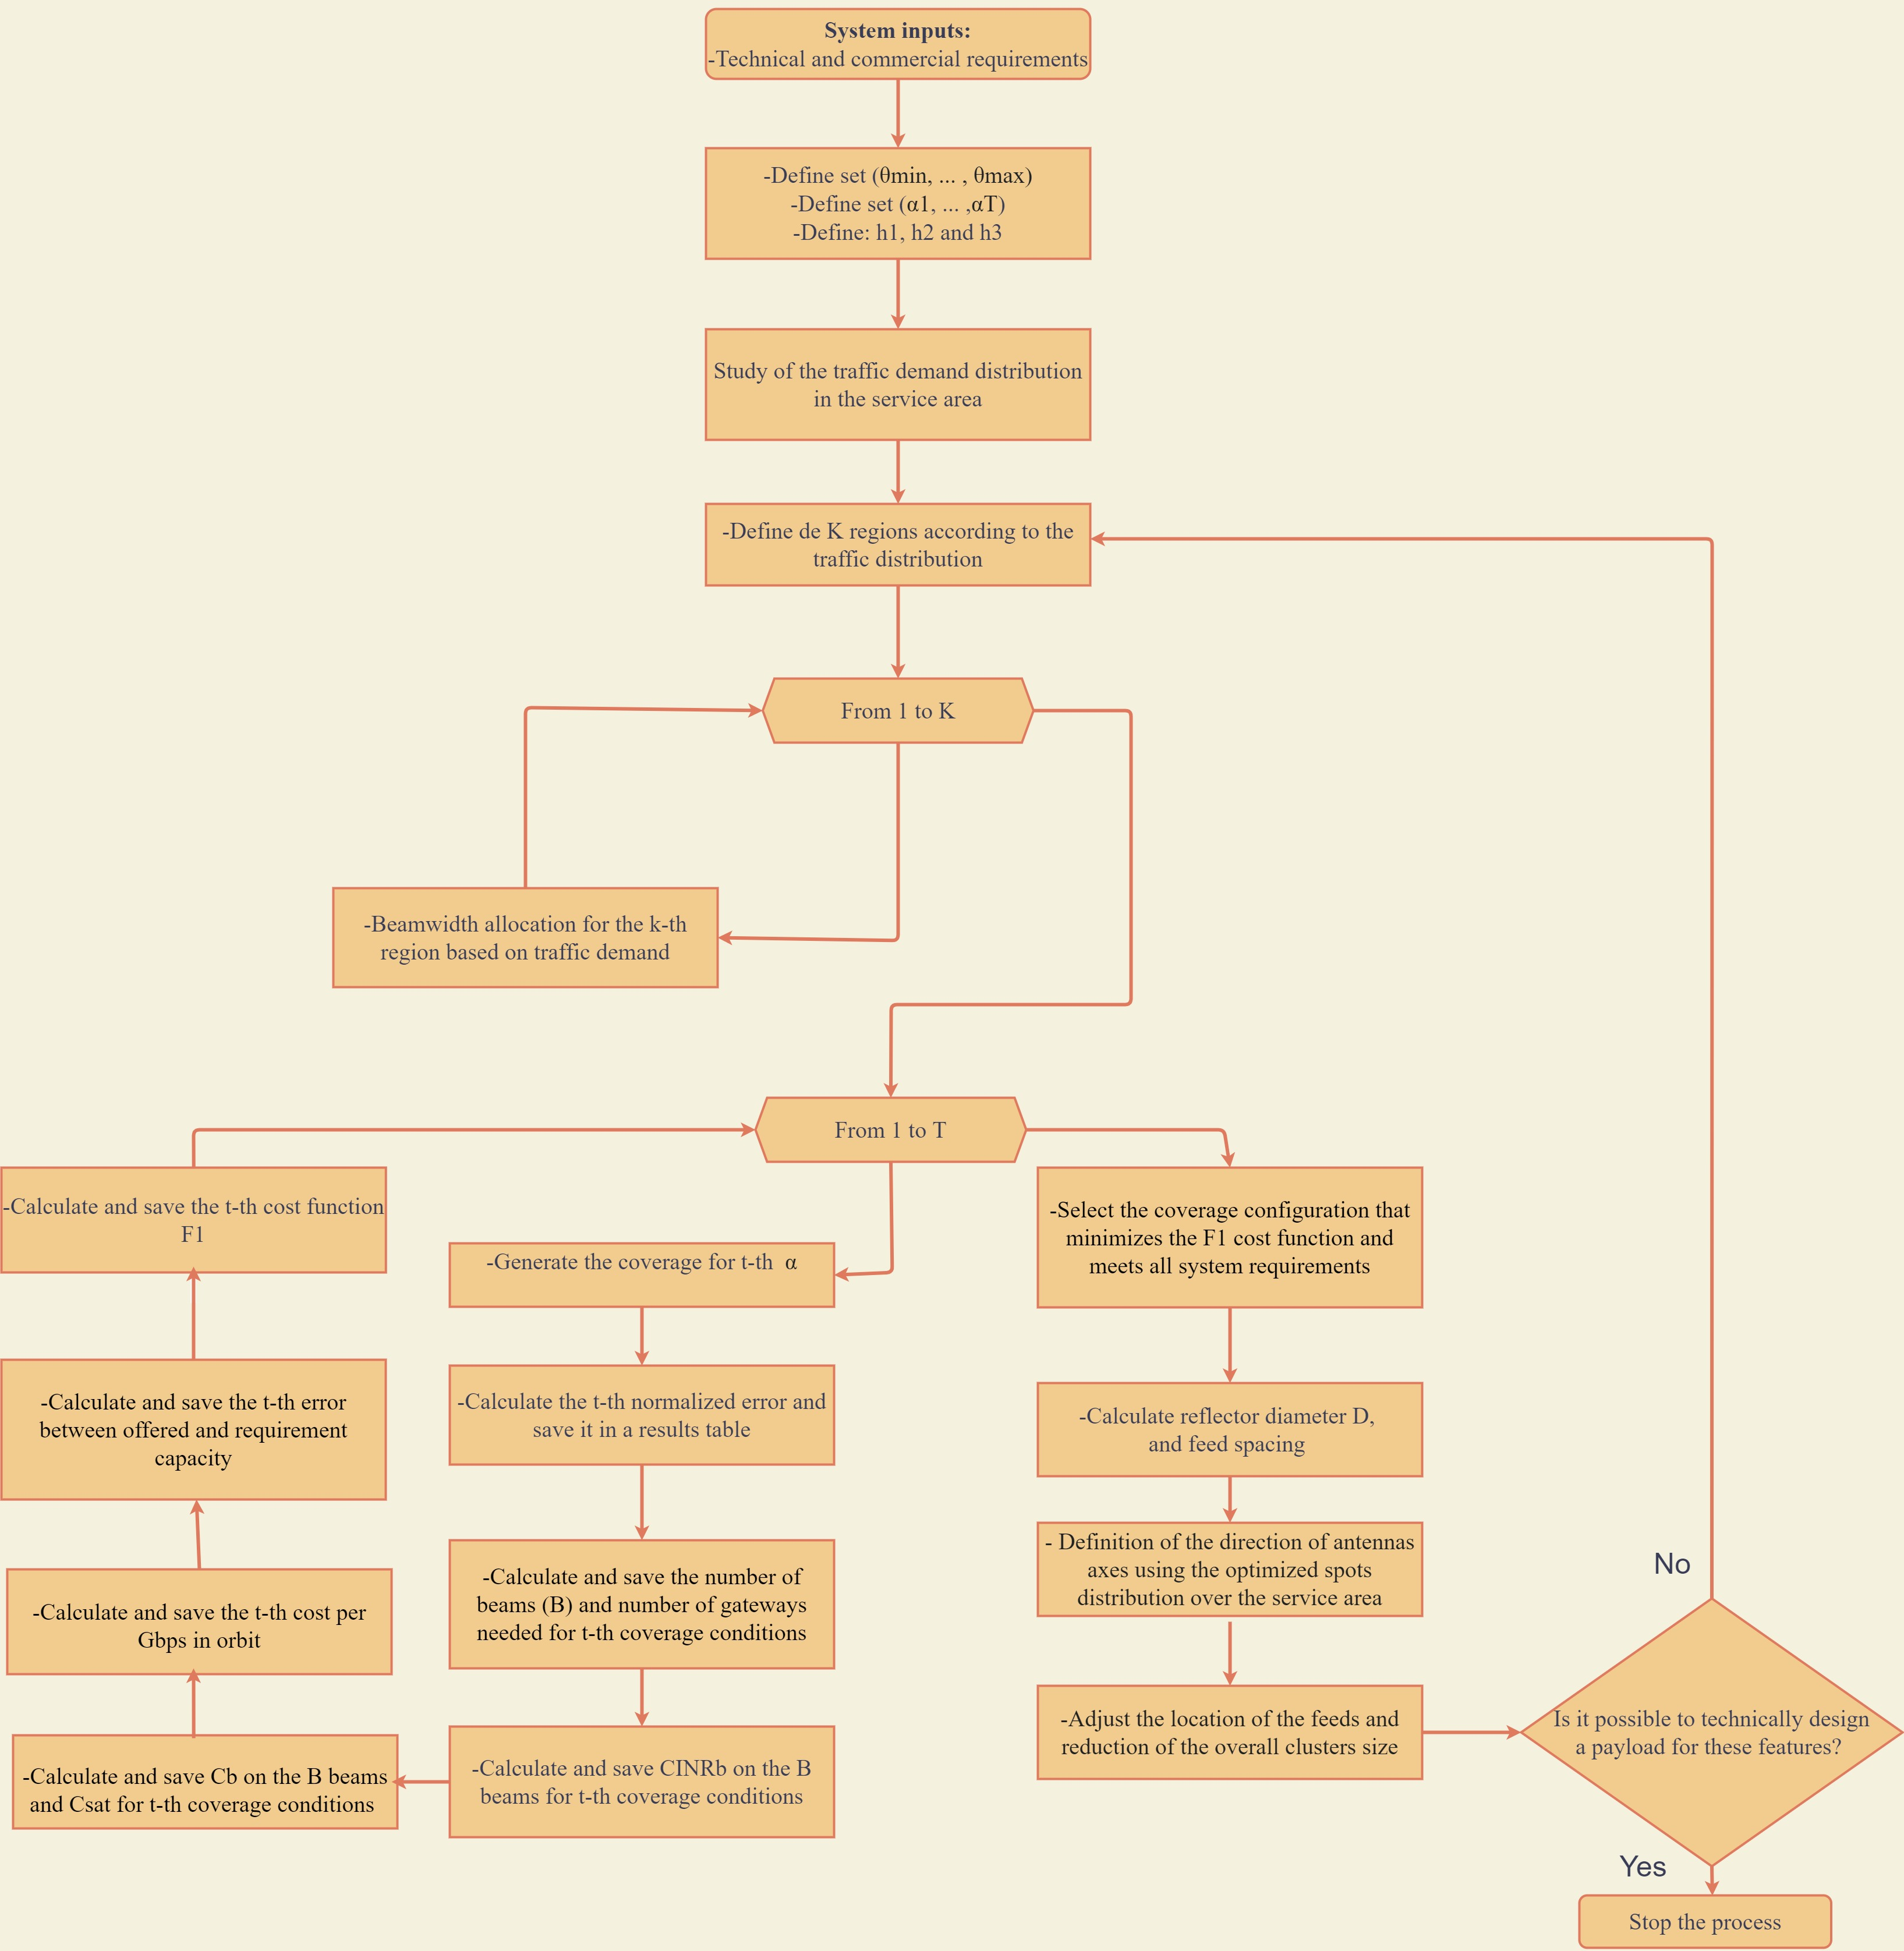
In this sense, Figure 9 shows the algorithm proposed, and all the steps used to find the optimal configuration of the irregular beams coverage in the service area that can be observed. This will directly impact the design of the satellite BFN, since with this methodology the number of beams needed, the beamwidth of each beam, and the tracking and orientation of each one are obtained optimally.
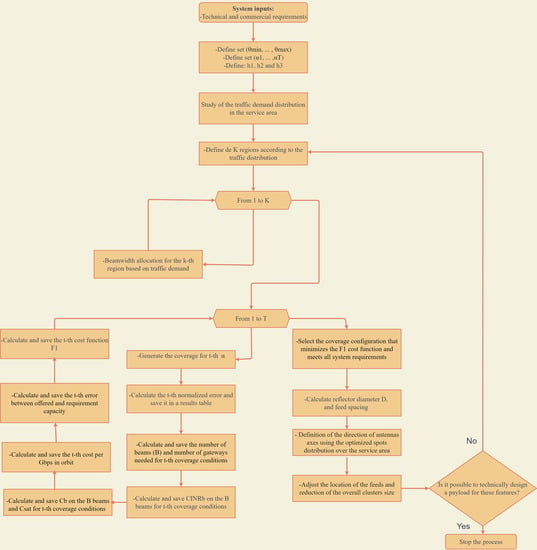
Figure 9.
Flowchart of the methodology of multibeam satellite design for irregular beams coverage.
The main goal of the methodology is to minimize the cost function proposed in (18), which allows minimizing the three main KPIs (Key Performance Indicator) proposed: the Offered Capacity Error, the Normalized Coverage Error, and cost per Gbps in orbit. Initially, system features such as service area (22), satellite orbital position, bandwidth, and power per beam must be defined. In addition, commercial requirements or constraints should be defined as the maximum cost of the system that it is acceptable to invest in. Additionally, technical requirements or constraints should be specified that will define allowable design parameters such as possible beamwidth values that can be assigned (20) or possible orientations that can be provided (21).
After defining all the system conditions, the distribution of average traffic demand in the service area should be studied and the service area divided into K regions. In addition, the beamwidth that the k-th region should have should be assigned as a function of the traffic demand distribution. For a higher traffic demand, narrower beams should be set, and for a lower traffic demand, larger beams should be assigned.
For each possible configuration of the gird orientation (), defined by the technological constraints, the coverage is designed. All link conditions must be evaluated, such as the resulting number of beams and gateways, the CINRb, the capacity offered in each beam, the capacity provided of the overall satellite, and the three KPIs (capacity offered error, coverage normalized error, and cost of Gbps in orbit) to calculate the cost function (18) for the t-th possible configuration of the gird orientation.
The configuration that minimizes the cost function (18) and meets all system requirements (22) is chosen. With this, the design parameters of the payload antenna are calculated, and if it is technically feasible, the optimization process is stopped; otherwise, the K-regions have to be modified and the process completed again.
In order to define the multibeam and beamwidth coverage over the service area, we can define the geometrical parameters of the feed cluster. For the latter, different technologies can be considered as follows:
- -
- MFB: this technology combines different feed horns of the cluster to form the appropriate illumination pattern to obtain a specific reflector pattern. This technology requires the use of a complex beamforming network (BFN) or limited butler matrix network with less flexibility. Usually, it is designed with passive waveguide technology to reduce losses; then, the cluster may be bulky.
- -
- Phased array feed: in this case, integrated RF circuits, ASICS, and active components are needed to implement this technology. The use of this technology results in more compact but complex antenna systems. This technology is also suitable for high-flexibility payload antennas in which the two colors can be implemented in one feed cluster.
- -
- SFB: using this technology, simple implementation can be completed but with a lack of flexibility. Furthermore, for a large service area and number of spots, several reflector antennas must be used.
- -
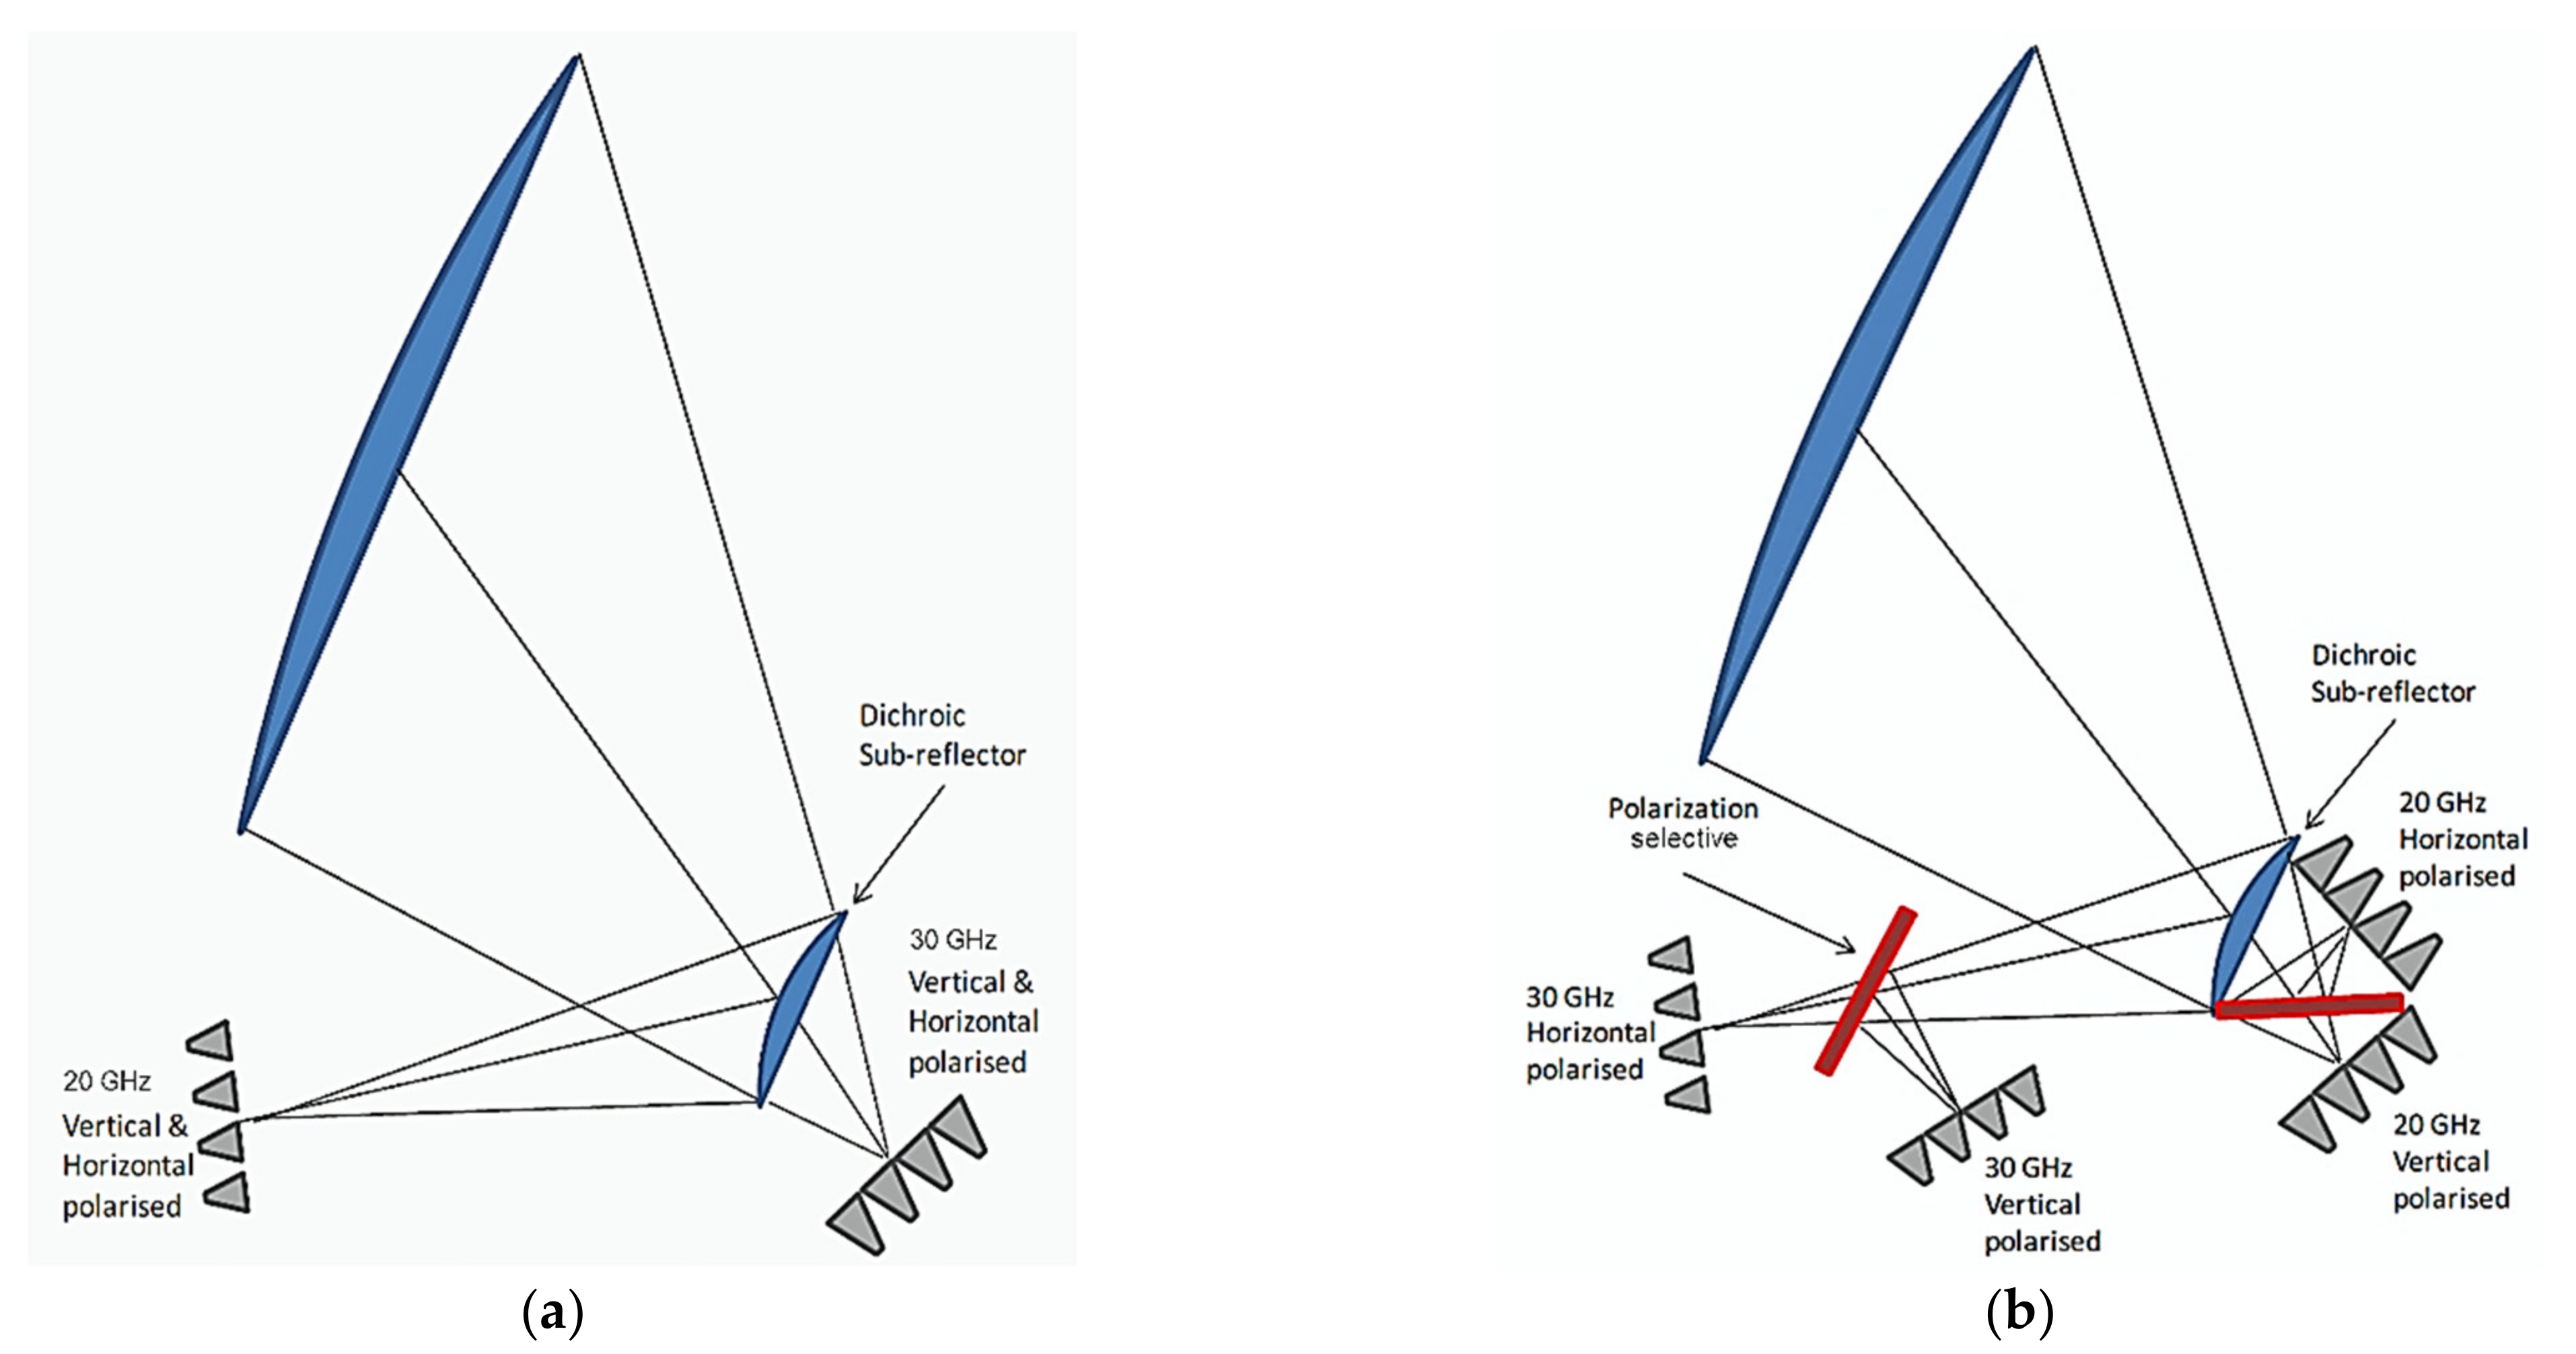
- Dichroic sub reflector: using any of the previous technologies, but to reduce the number of reflector antennas onboard the satellite, the use of dichroic multiband sub-reflector fed system is a promising option to locate many feeds using two different focal points of the reflector system (see Figure 10a). Note that depending on the feed cluster frequency, the volume needed may define the corresponding focal point to increase the clearance of the reflector antenna.
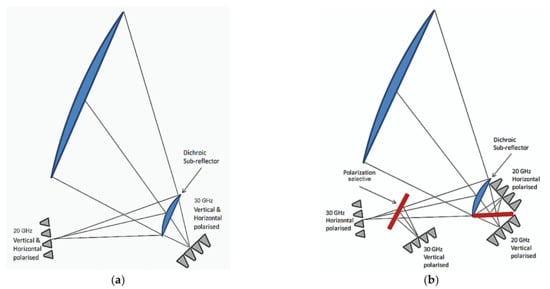 Figure 10. Deployable multi-feed antenna dual reflector (compensated) systems using dichroic and polarization selective surfaces. (a) Using dichroic sub reflector with any of the previous technologies, but to reduce the number of reflector antennas onboard the satellite. and (b) Using polarization selective surfaces: to reduce the complexity and separate the colors at feed level.
 - -
- Polarization selective surfaces: to reduce the complexity and separate the colors at feed level, polarization-selective surfaces can also be implemented (see Figure 10b).
We can assume the use of a dichroic fed reflector antenna technology to locate two feed clusters at the two different focal points of a dual reflector (Cassegrain or Gregorian). Using this concept, we can obtain a four-color scheme in down-link consisting of two polarization networks for each frequency band (with two bands at down-link and several bands at up-link as implemented in the KaSAT [36]). With the assumed configuration, only two reflector antennas onboard the satellite are required to provide a four-color scheme, for both down-link and up-link, over the service area.
5. Results
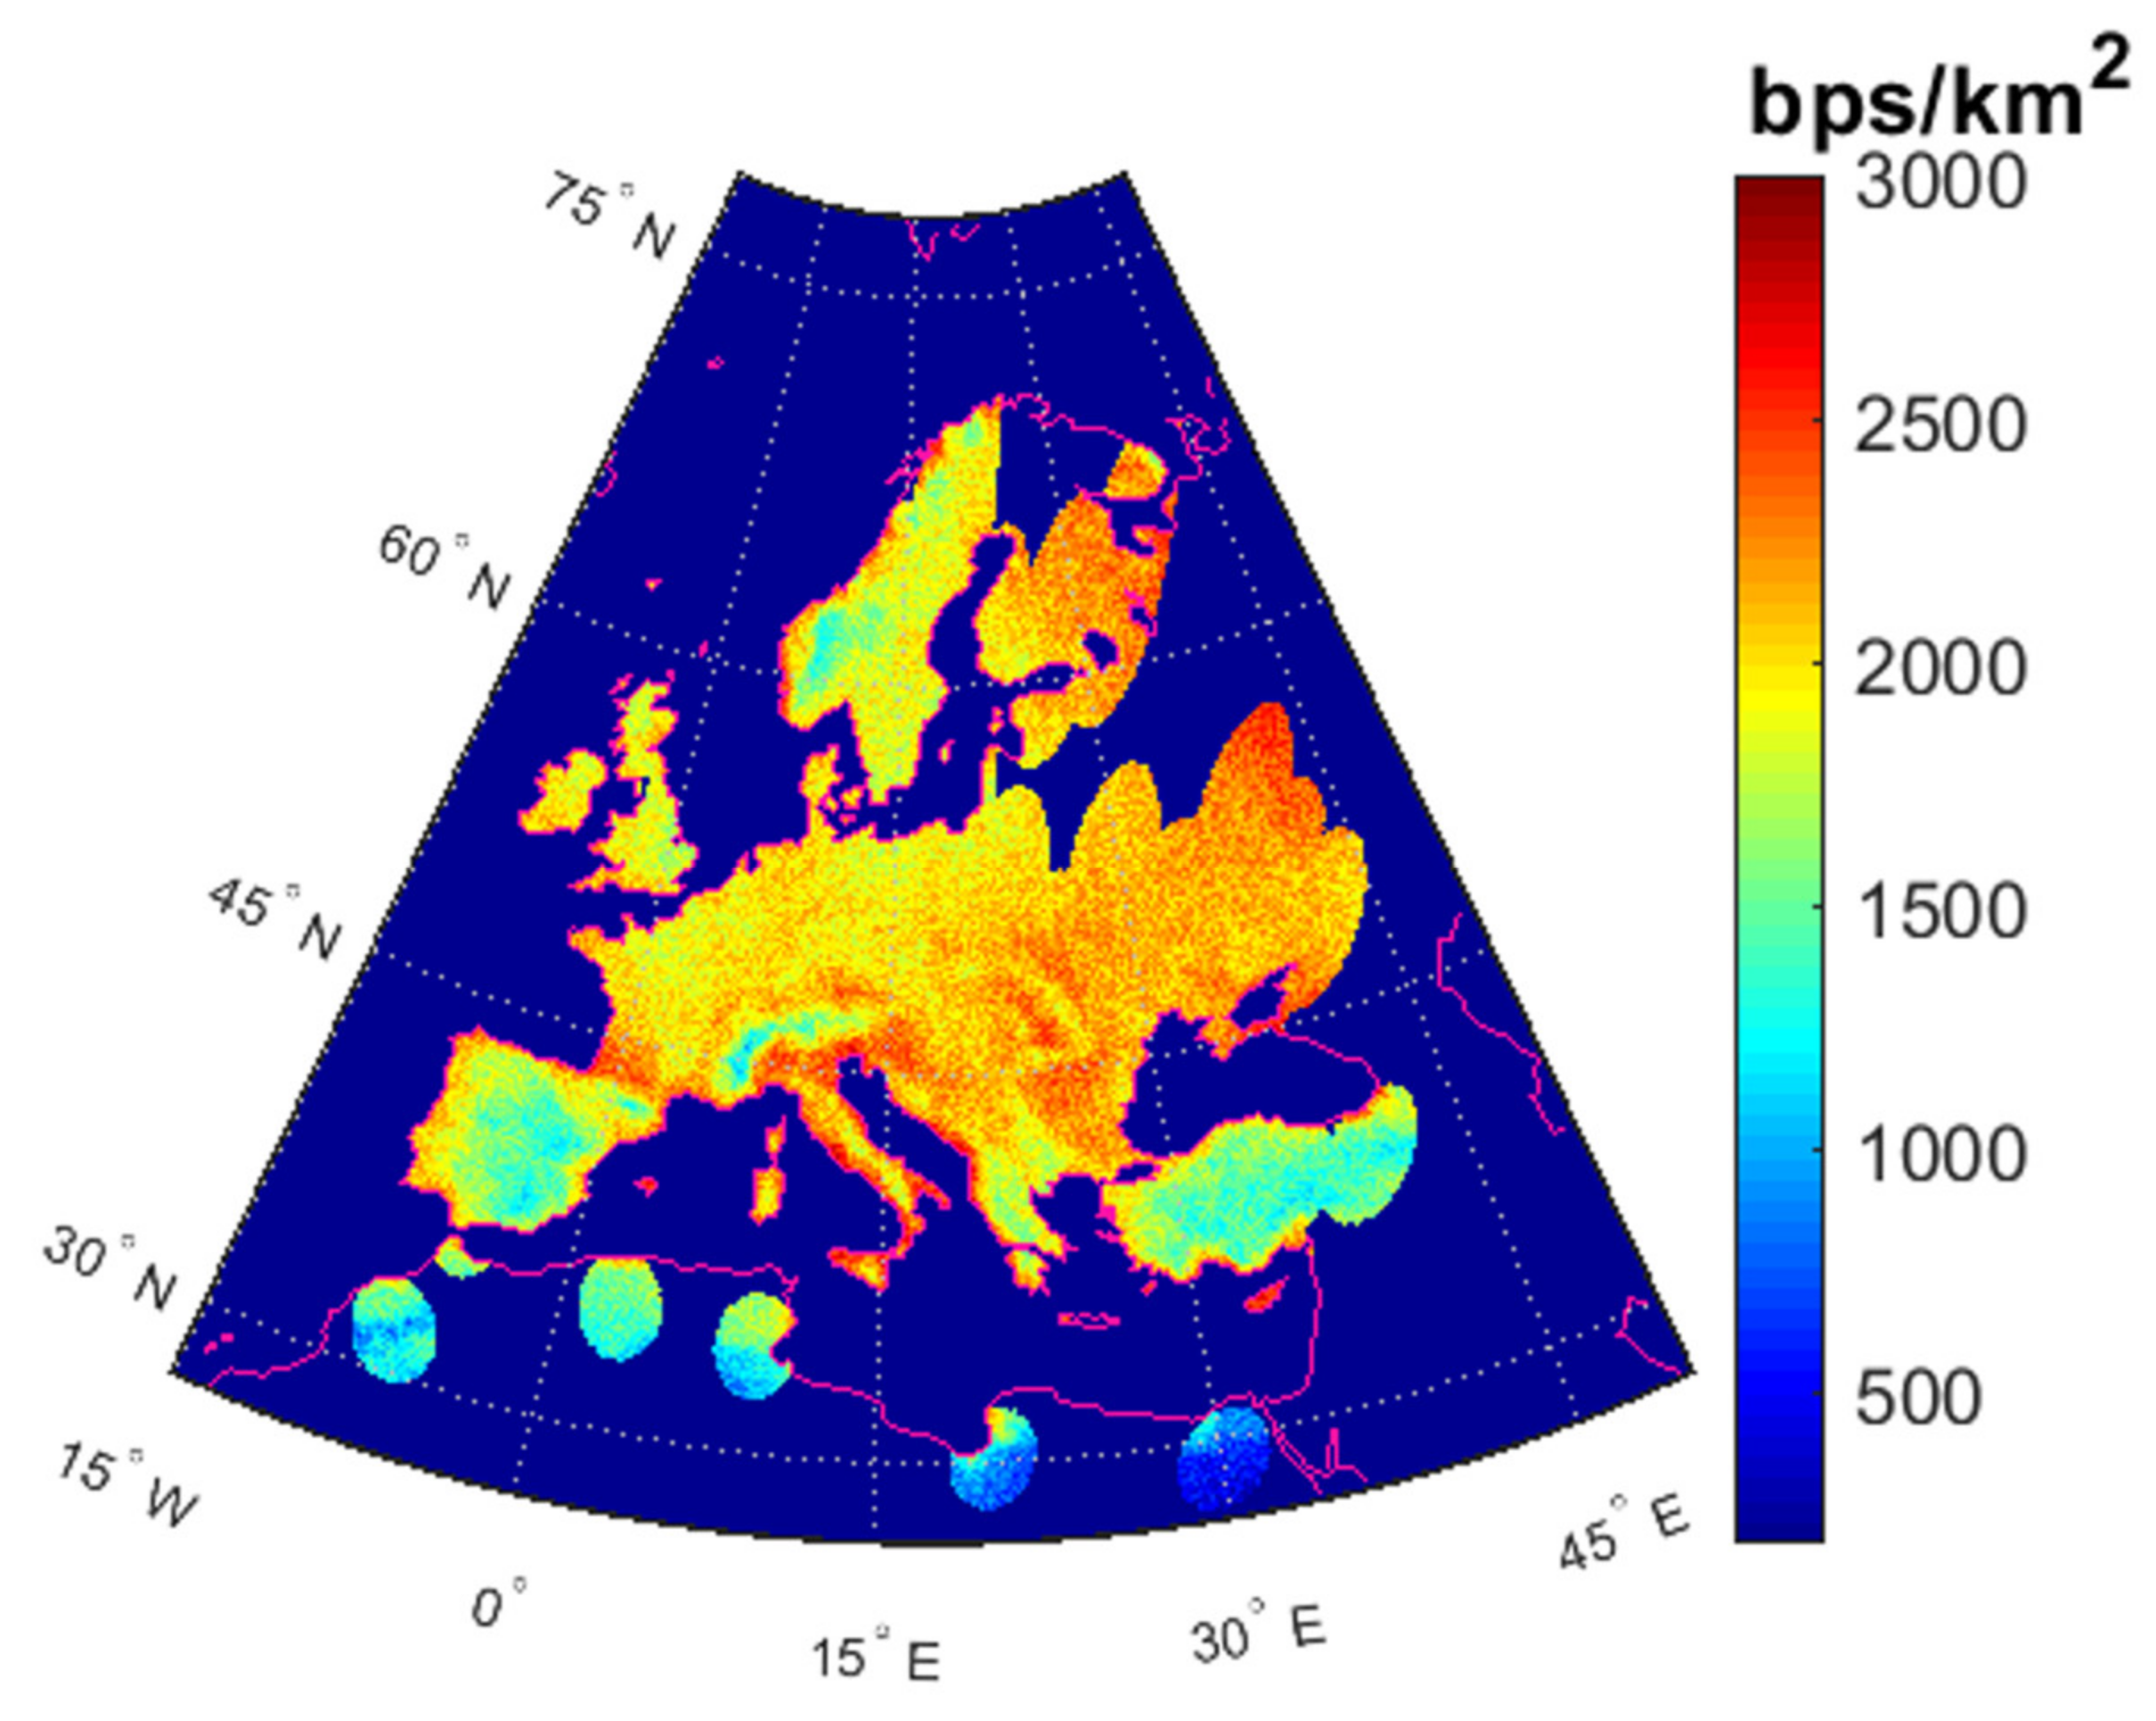
In order to evaluate the proposed methodology, it is applied to a case study that has a similar service area to that offered by the KaSat satellite [36]. The system features and technical and commercial requirements are presented in Table 1. Figure 11 shows the distribution of average traffic demand in the service area of the case study. This traffic demand distribution is a hypothetical case used to evaluate the performance of the methodology.

Table 1.
Features and constraints of the proposed case study system.
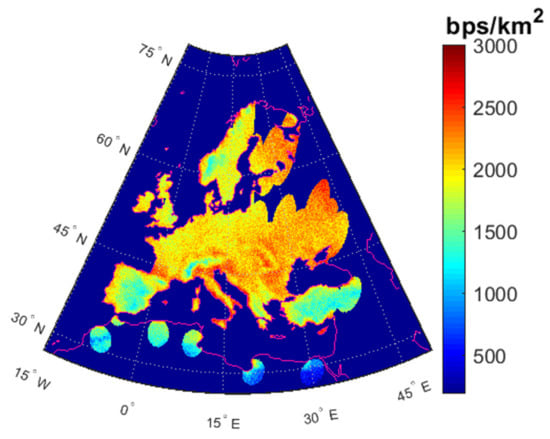
Figure 11.
Hypothetical distribution of traffic demand over the service area to evaluate the performance of the methodology.
In the proposed case study, the optimization of the coverage design is completed for an annual availability requirement of 95% (we assume clear sky); this is because rain attenuations and other atmospheric phenomena can be mitigated using techniques such as ACM (Adaptive Coding and Modulation) of the DVB-S2x standard. On the other hand, if a specific availability needs to be set, it can be adapted to the proposed methodology. For more details, see the previous work published in [8].
The cost function weights (18) are assigned so that the three terms have the same importance. The results presented are divided into two parts; the first is an analysis of the impact of the number of regions in which the service area is divided and the grid orientation on the system KPIs. The last part evaluates the performance of the proposed methodology.
5.1. Case Study Analysis
In this section, the numerical results obtained in the reference scenario are presented.
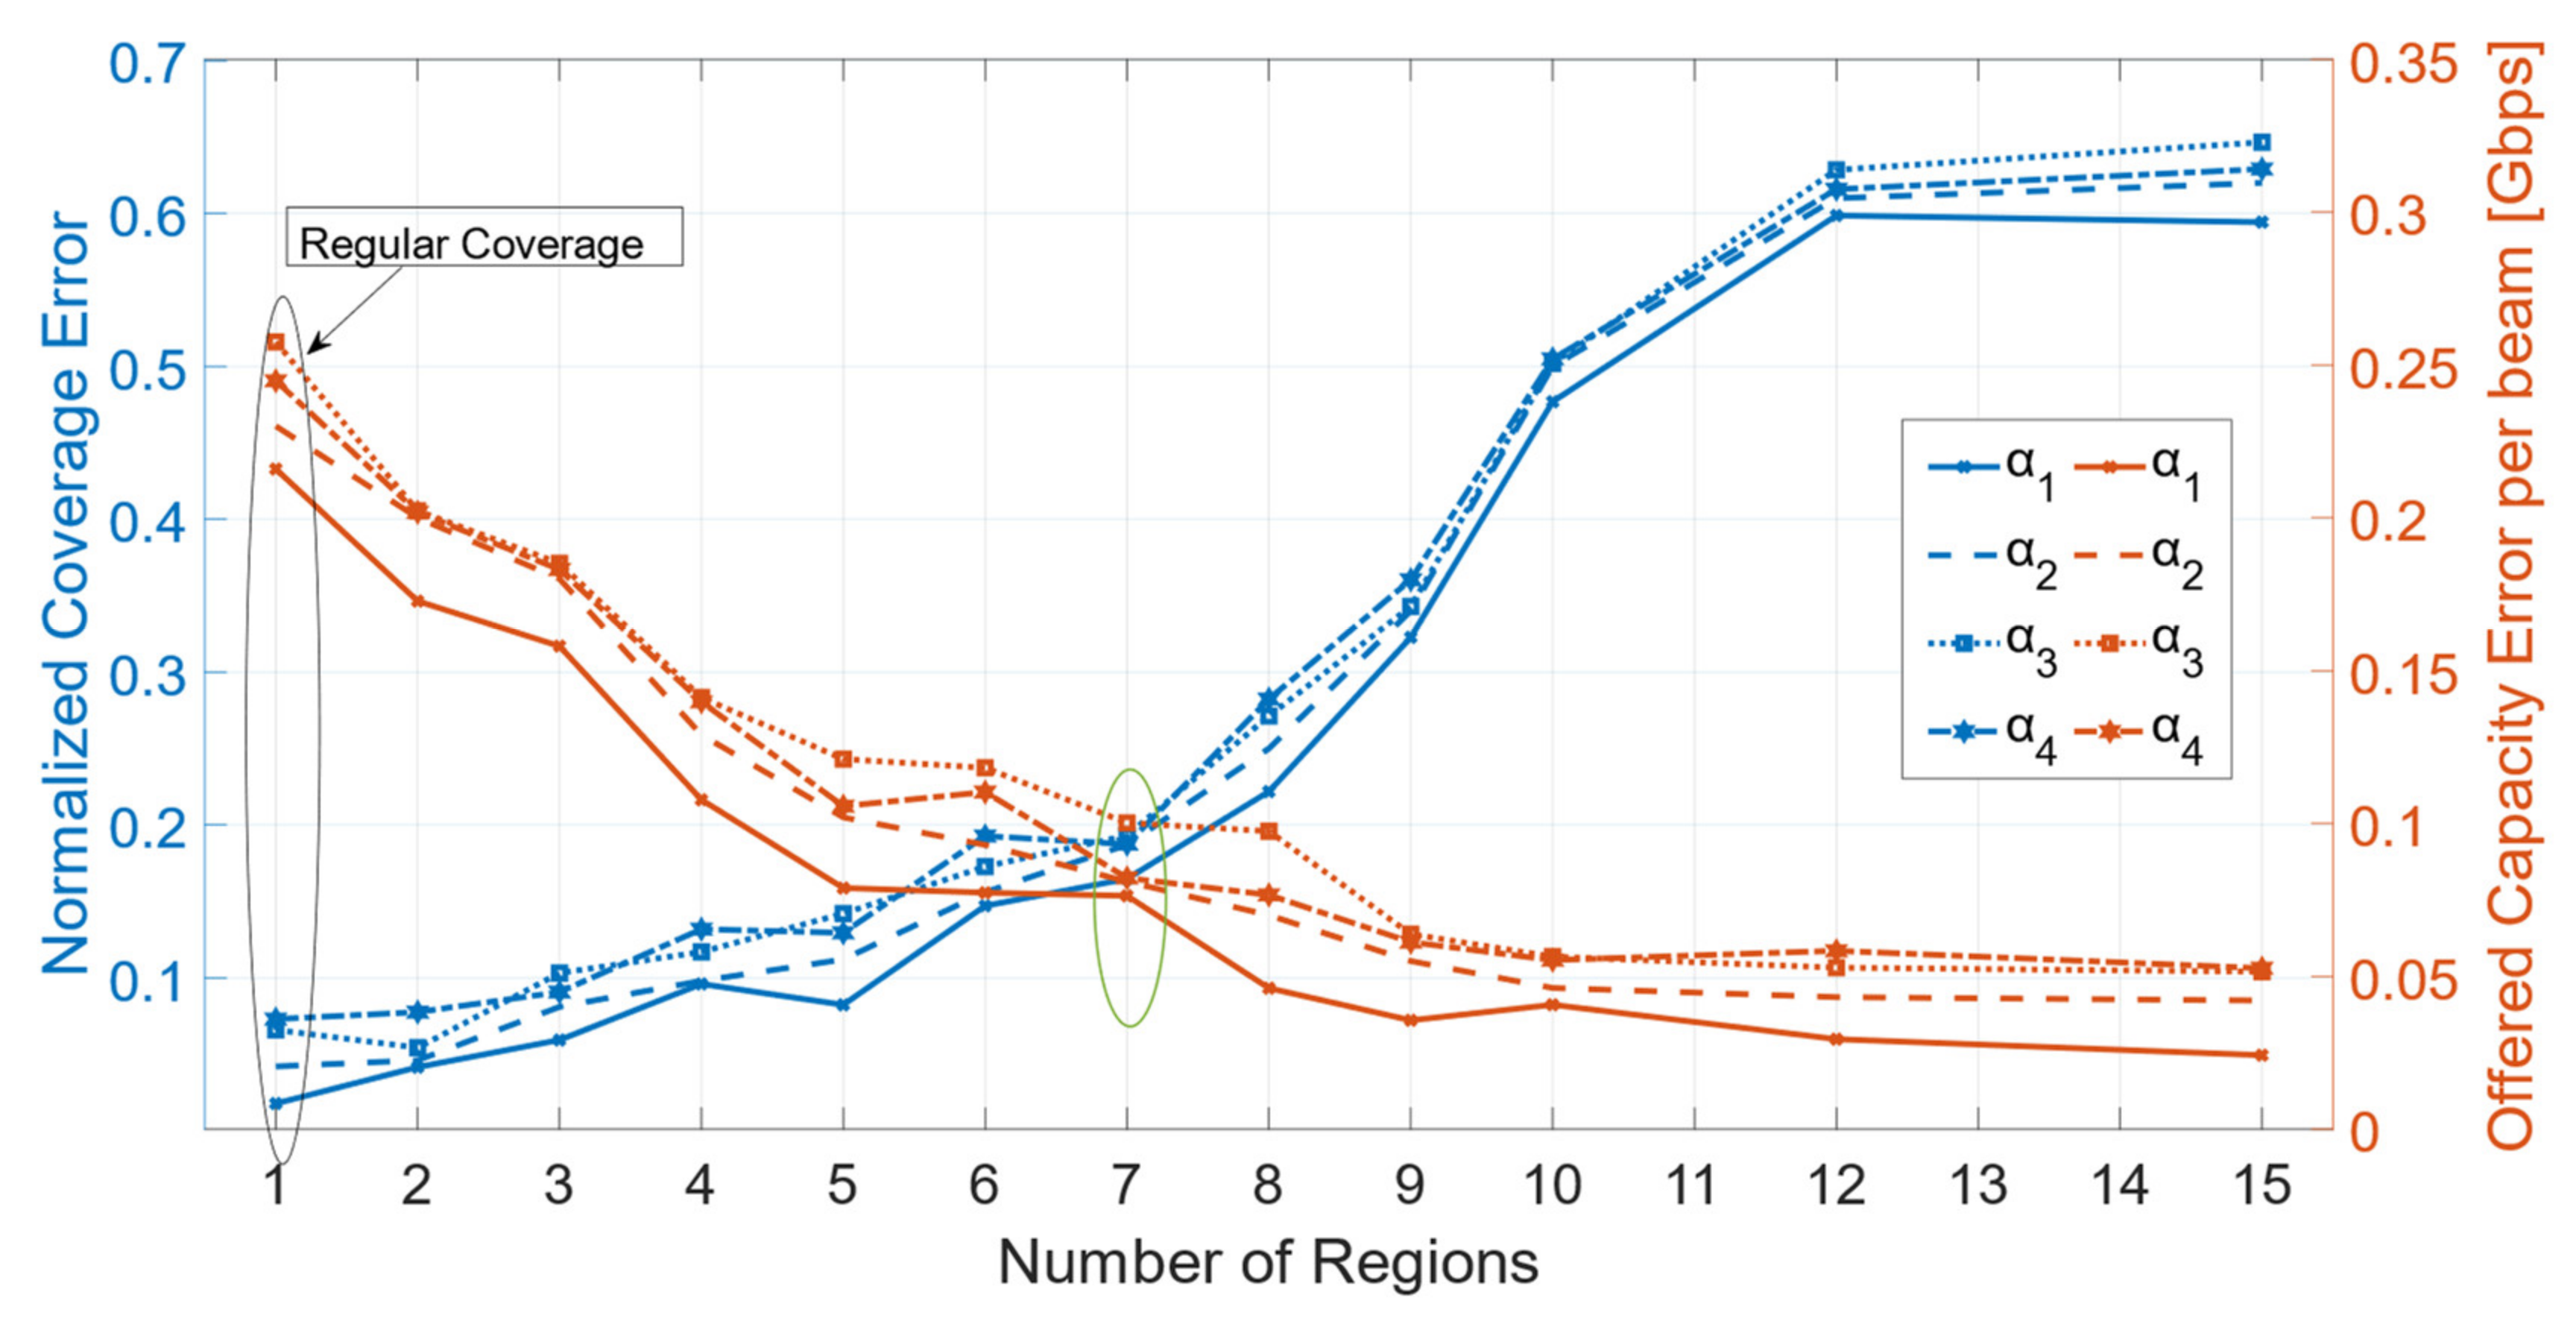
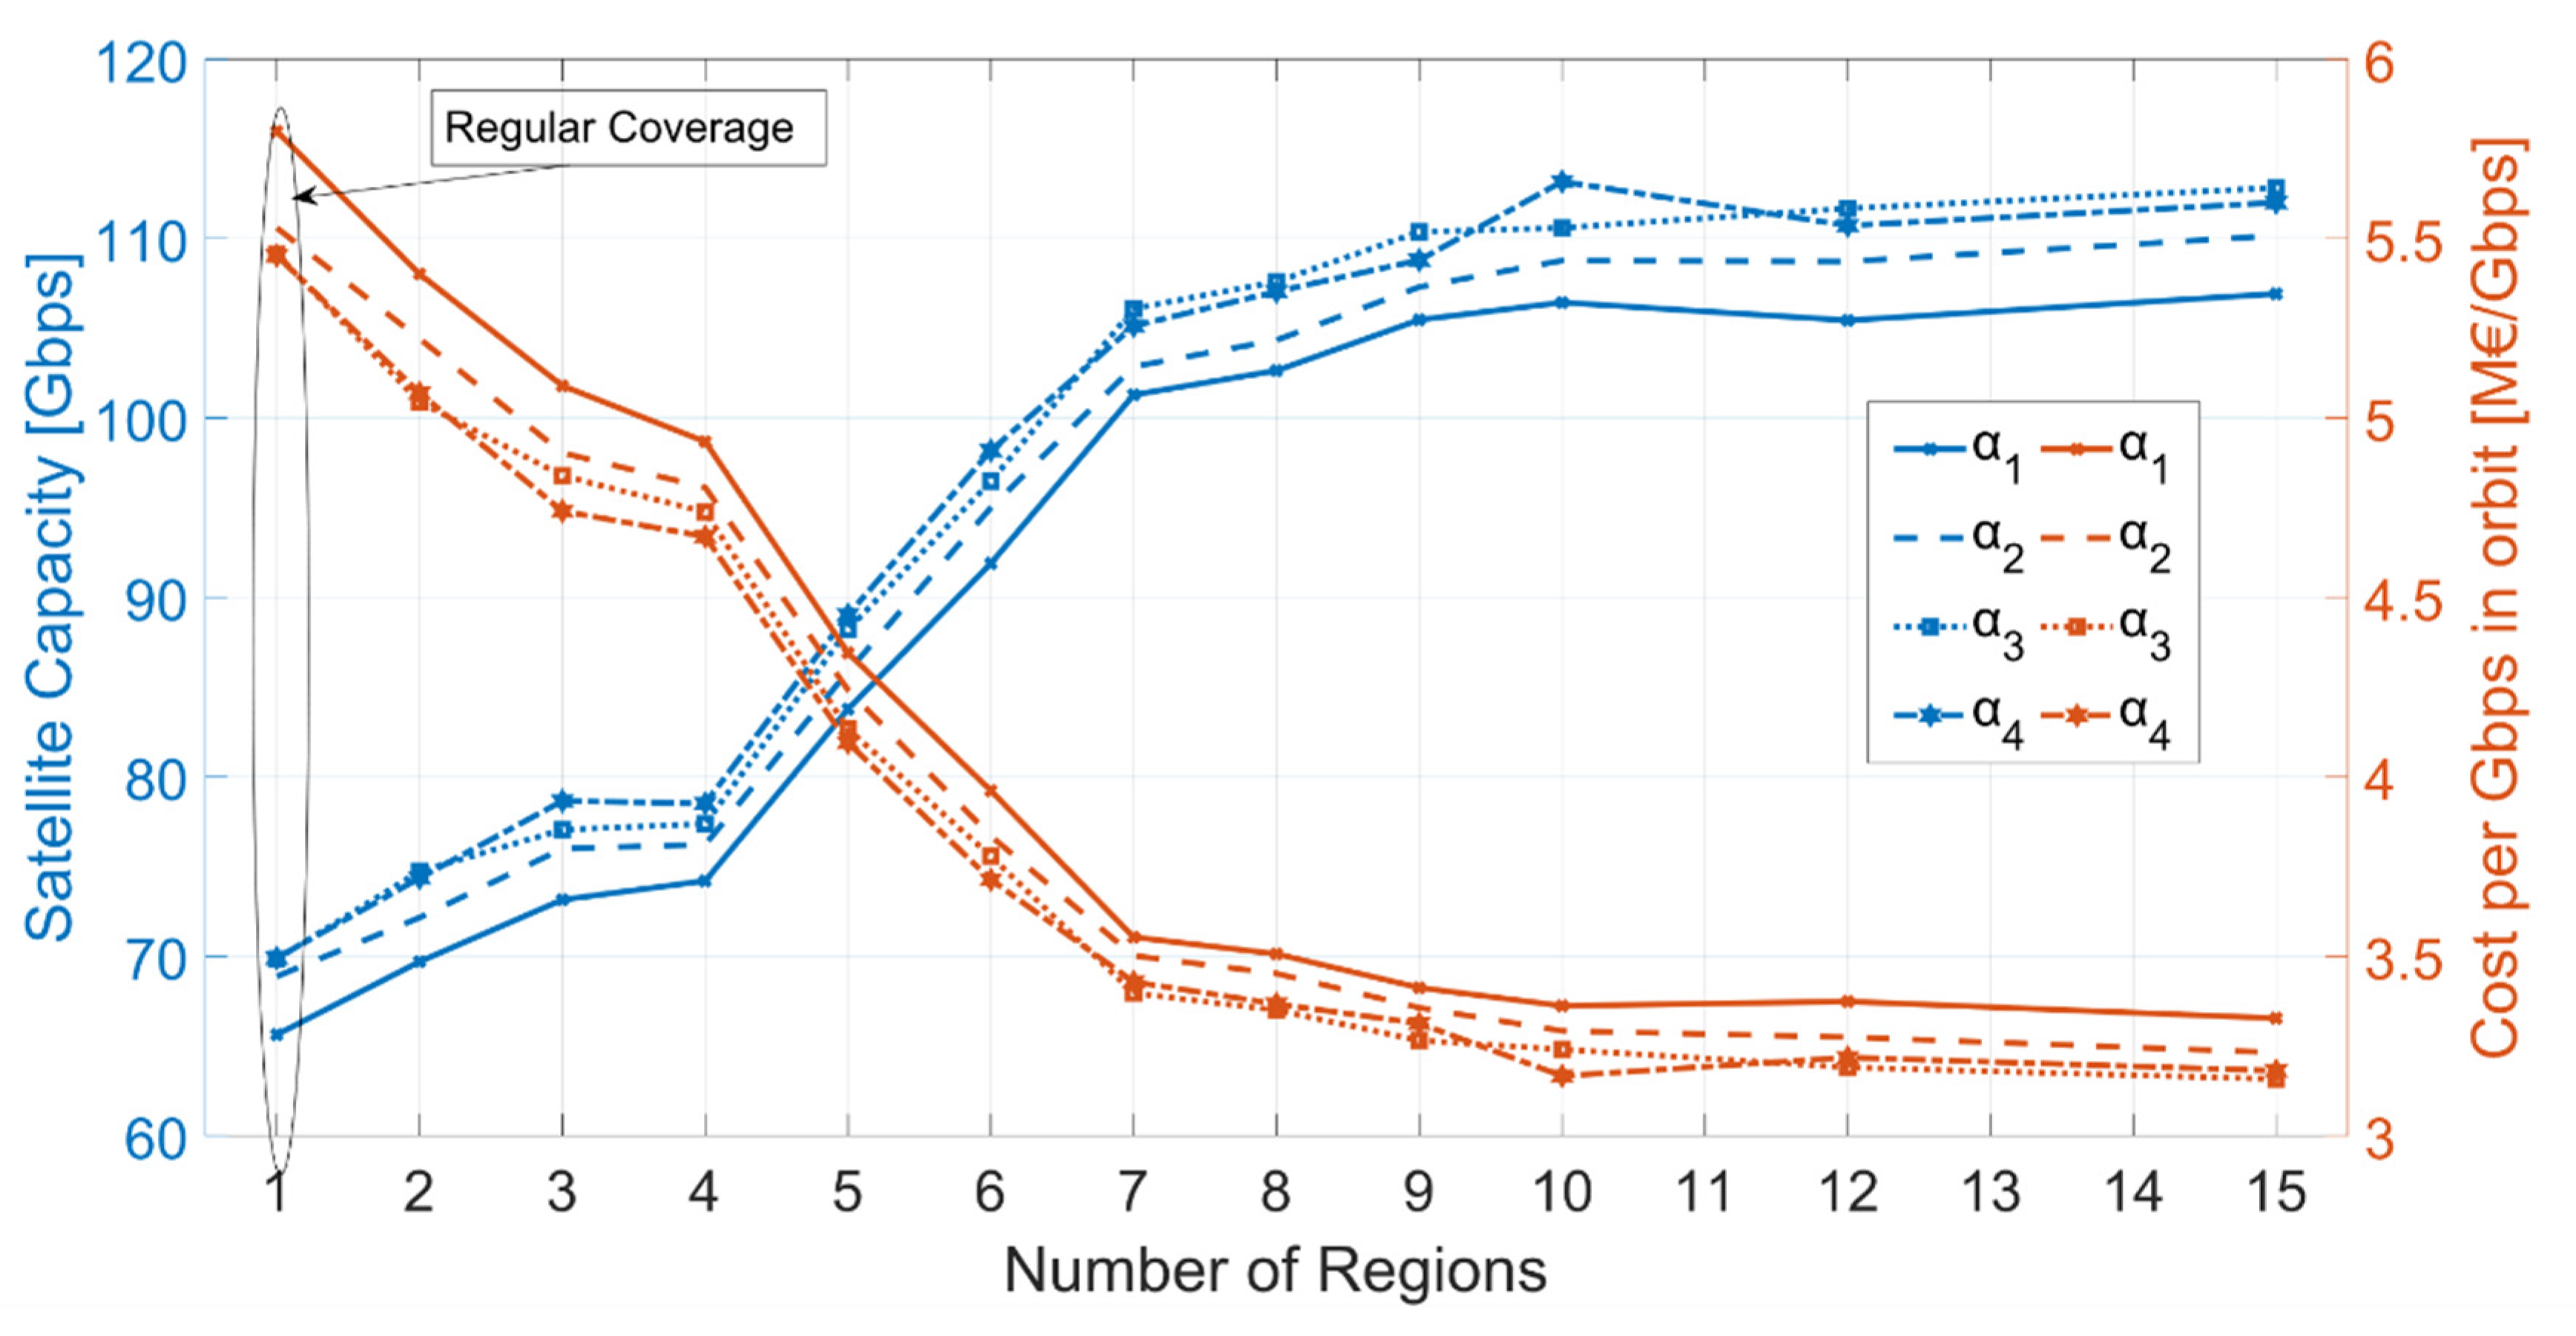
One of the important parameters of the proposed methodology is the number of regions into which the service area should be divided (K). In that sense, Figure 12 and Figure 13 show the impact of the number of regions and the orientation of the grid ().
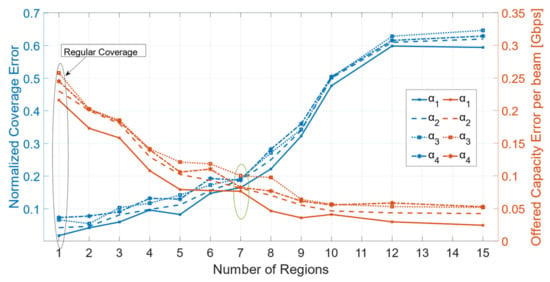
Figure 12.
Performance based on the number of regions into which the service area is divided and grid orientation: Normalized Coverage Error and Offered Capacity Error per beam.
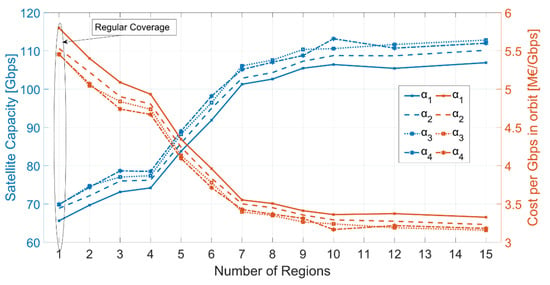
Figure 13.
Performance based on the number of regions into which the service area is divided and grid orientation: Satellite Capacity and Cost per Gbps in orbit.
When there is only one region in the service area, regular coverage and a beamwidth of 0.6° were assigned. Figure 12 shows that when the number of regions (K) increases, the Normalized Coverage Error will increase; this is because each region is assigned a beamwidth depending on the average traffic demand required in the region. When the number of regions is increased, there is more overlap at the edge of the region because the beams are not the same size.
has the best performance with respect to the Normalized Coverage Error for all the regions. Given the shape of the service area, the inclination of the grid with which the coverage is best adjusted is −10°. and have the highest Normalized Coverage Error concerning the number of regions. E varies on average by 0.032 depending on the used.
Figure 12 shows that when the number of regions increases, the Offered Capacity Error per beam decreases; this is because in having a greater number of regions for the same service area, the area of the regions becomes smaller, allowing to more accurately study the traffic demand in the region to assign an adequate beamwidth and decrease the Offered Capacity Error per beam.
has the best performance with respect to the Offered Capacity Error per beam for all the regions; this means that given the shape of the service area, the inclination of the grid with which the coverage is best adjusted is −10°. and have the highest Offered Capacity Error with respect to the number of regions. Offered Capacity Error varies on average by 0.038 Gbps depending on the used.
Depending on the Normalized Coverage Error and the Offered Capacity Error, using seven regions (green region) and a grid slope of −10°, the optimal conditions are obtained. It can also be seen that after the 12 regions, the change of both KPIs is no longer very noticeable (Figure 12).
Figure 13 shows the satellite capacity and cost per Gbps in orbit as a function of K and . With respect to the satellite capacity, it is observed that when the number of regions increases, the satellite capacity also increases; this is because the size of the regions decreases, and narrower beams can be assigned in the regions with the highest traffic requirement, increasing the number of beams in that region and the capacity that each beam can offer. After 10 regions, the increase is no longer noticeable, and the difference between using 1 region (regular coverage) and 10 regions is around 40 Gbps.
and (10° and 20°) are the inclination angles that obtain a higher satellite capacity due to the shape of the service area and the regions into which they are divided, since α directly affects the number of beams needed to cover a region. The difference between using and could be up to 7 Gbps (Figure 13).
Concerning the cost per Gbps in orbit, the higher the K, the lower the Gbps cost in orbit, the difference between only 1 region (regular coverage) and 10 regions can be up to 2.4 M EUR. is the most expensive configuration, since depending on the number of regions, 1 Gbps can cost up to 0.4 M EUR more using than using .
5.2. Optimization Methodology Performance
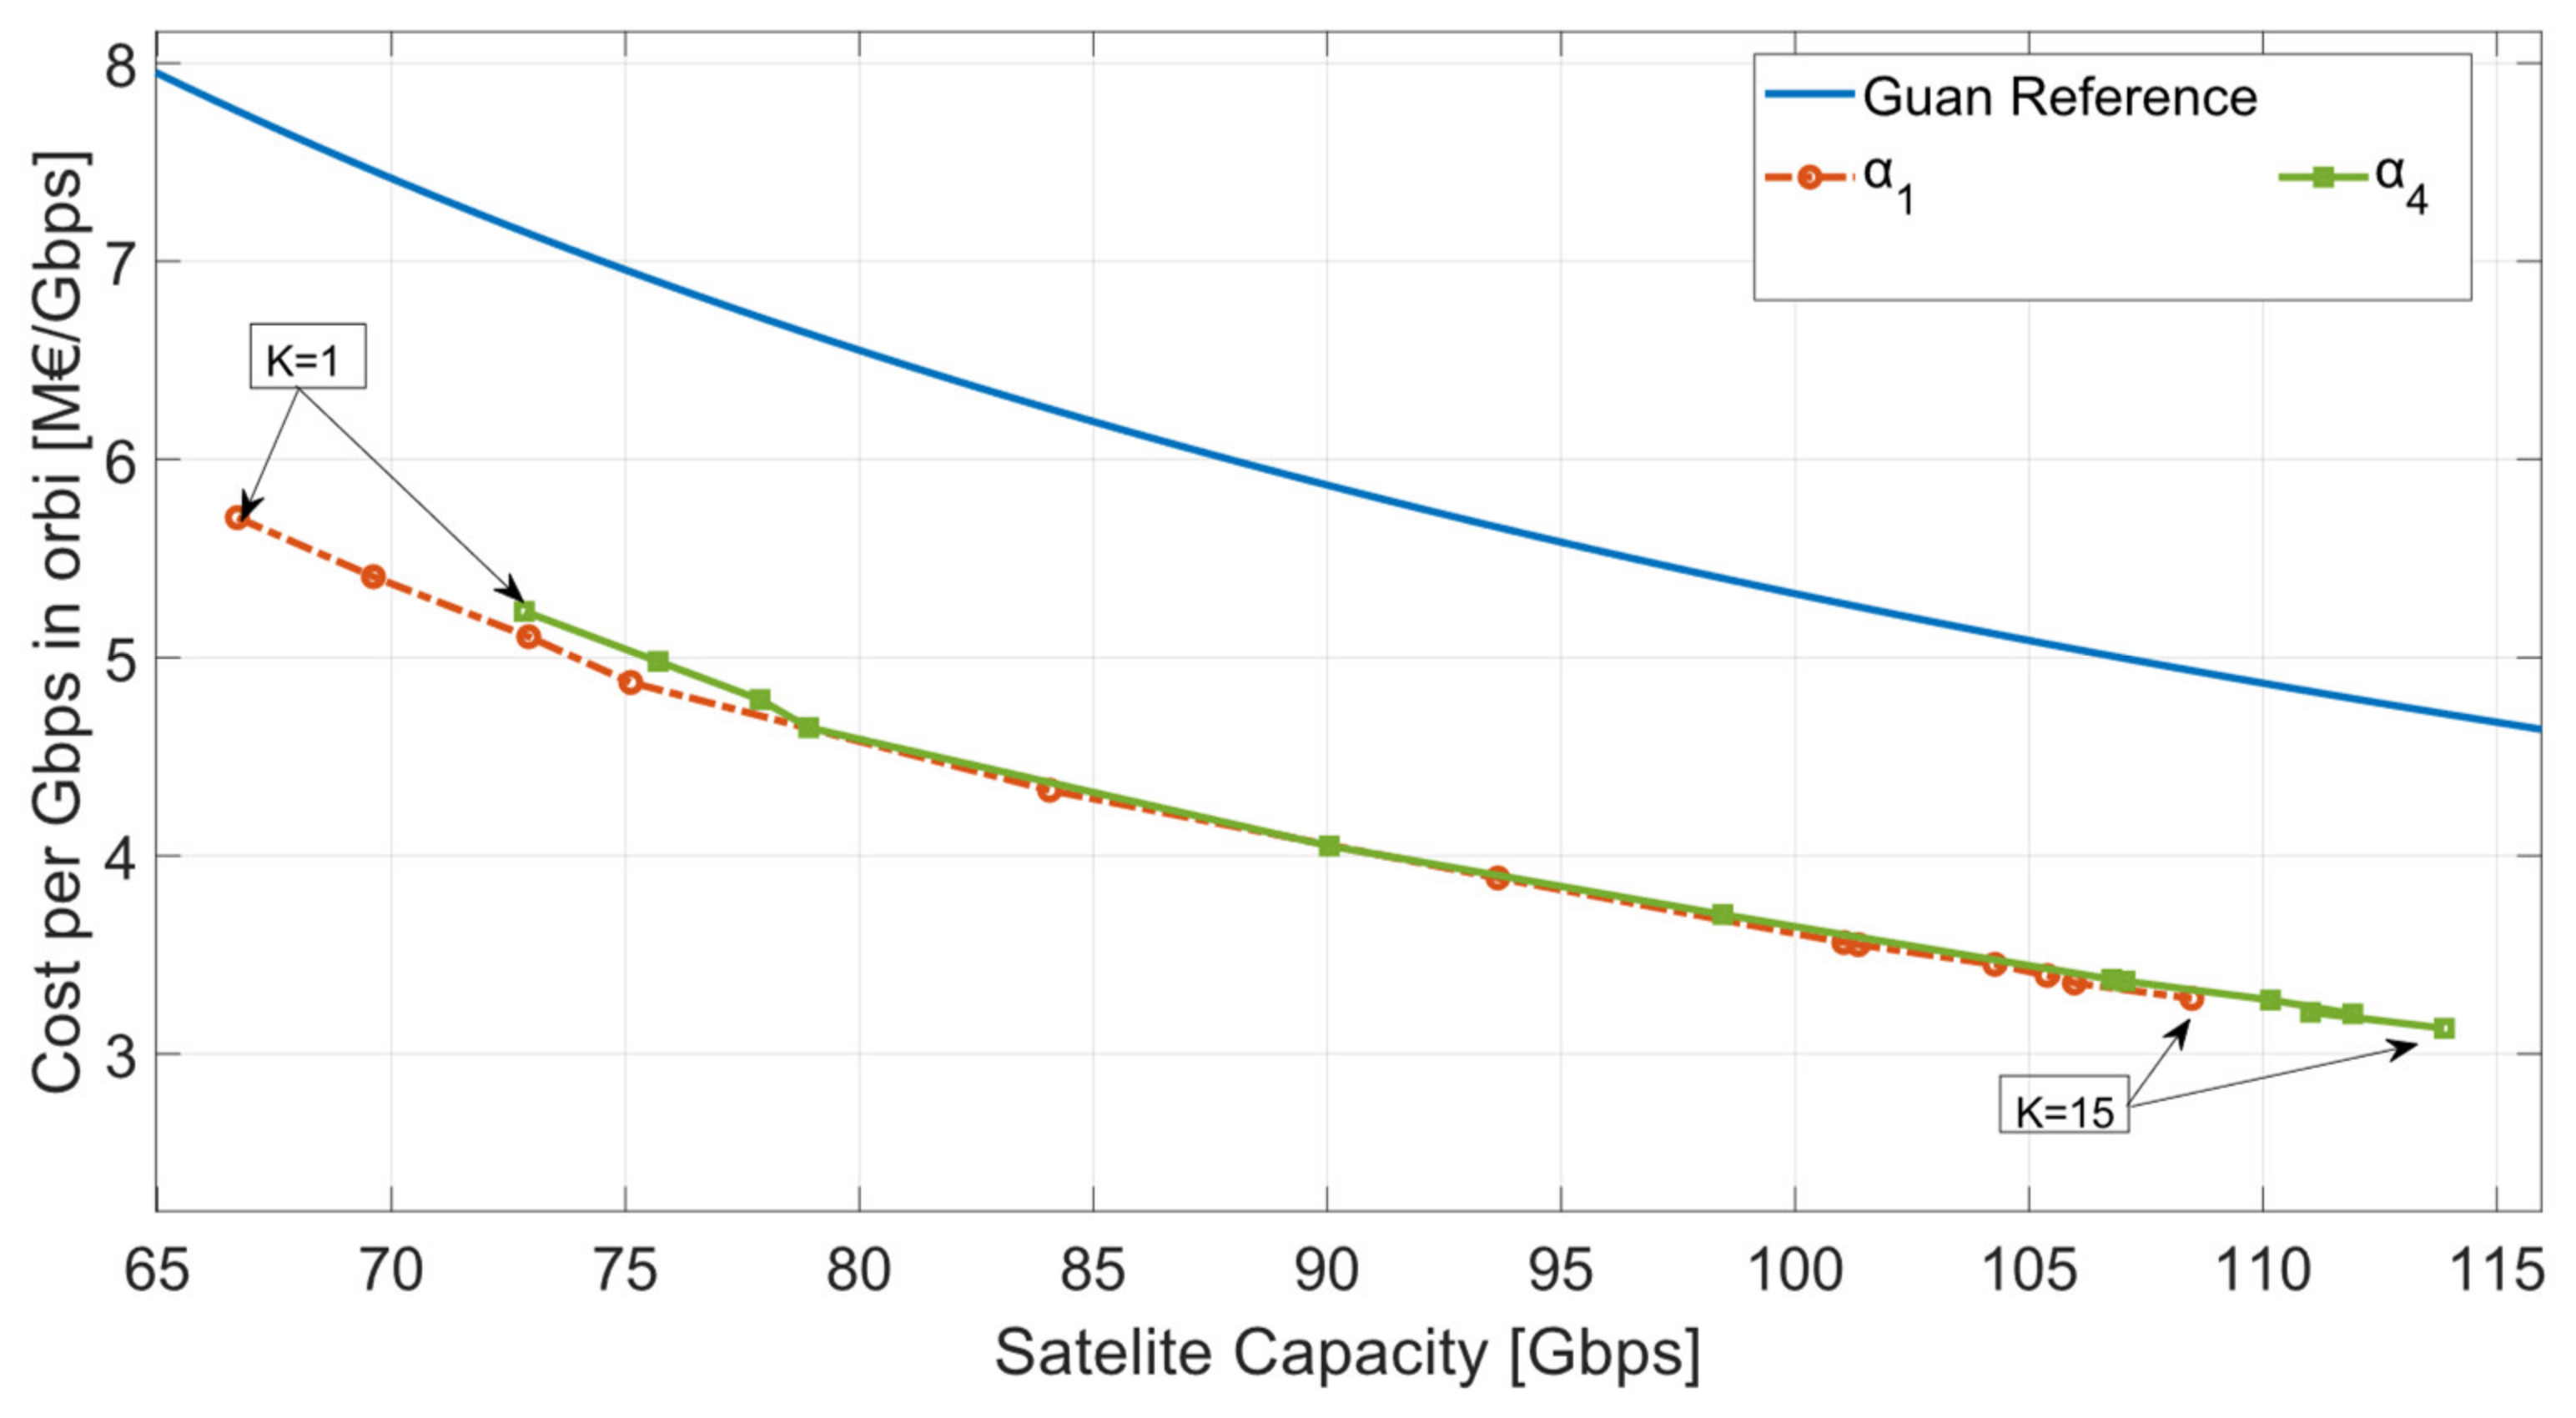
One of the KPIs in this methodology is the cost per Gbps in orbit, as shown when the results are compared with the affordability curve presented in [9]. and configurations below the reference curve, as shown in Figure 14. The reference curve presented in [9] does not consider launch and ground segment costs. However, in this paper, an average launch cost of 100 million euros has been added, plus a fixed cost of 80 million euros as a minimum price for a broadband payload, which is added to the corresponding ground segment cost.
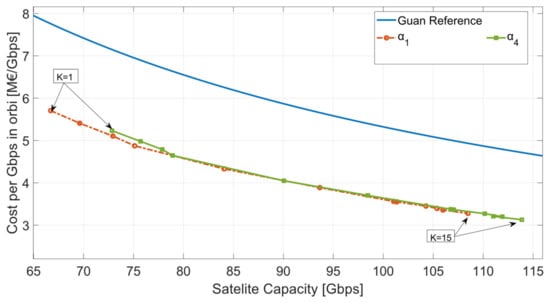
Figure 14.
Performance comparison of methodology on Very High Throughput Satellite (VHTS) affordability for throughput according to [9]. Note: the launch cost and the ground segment cost have been added.
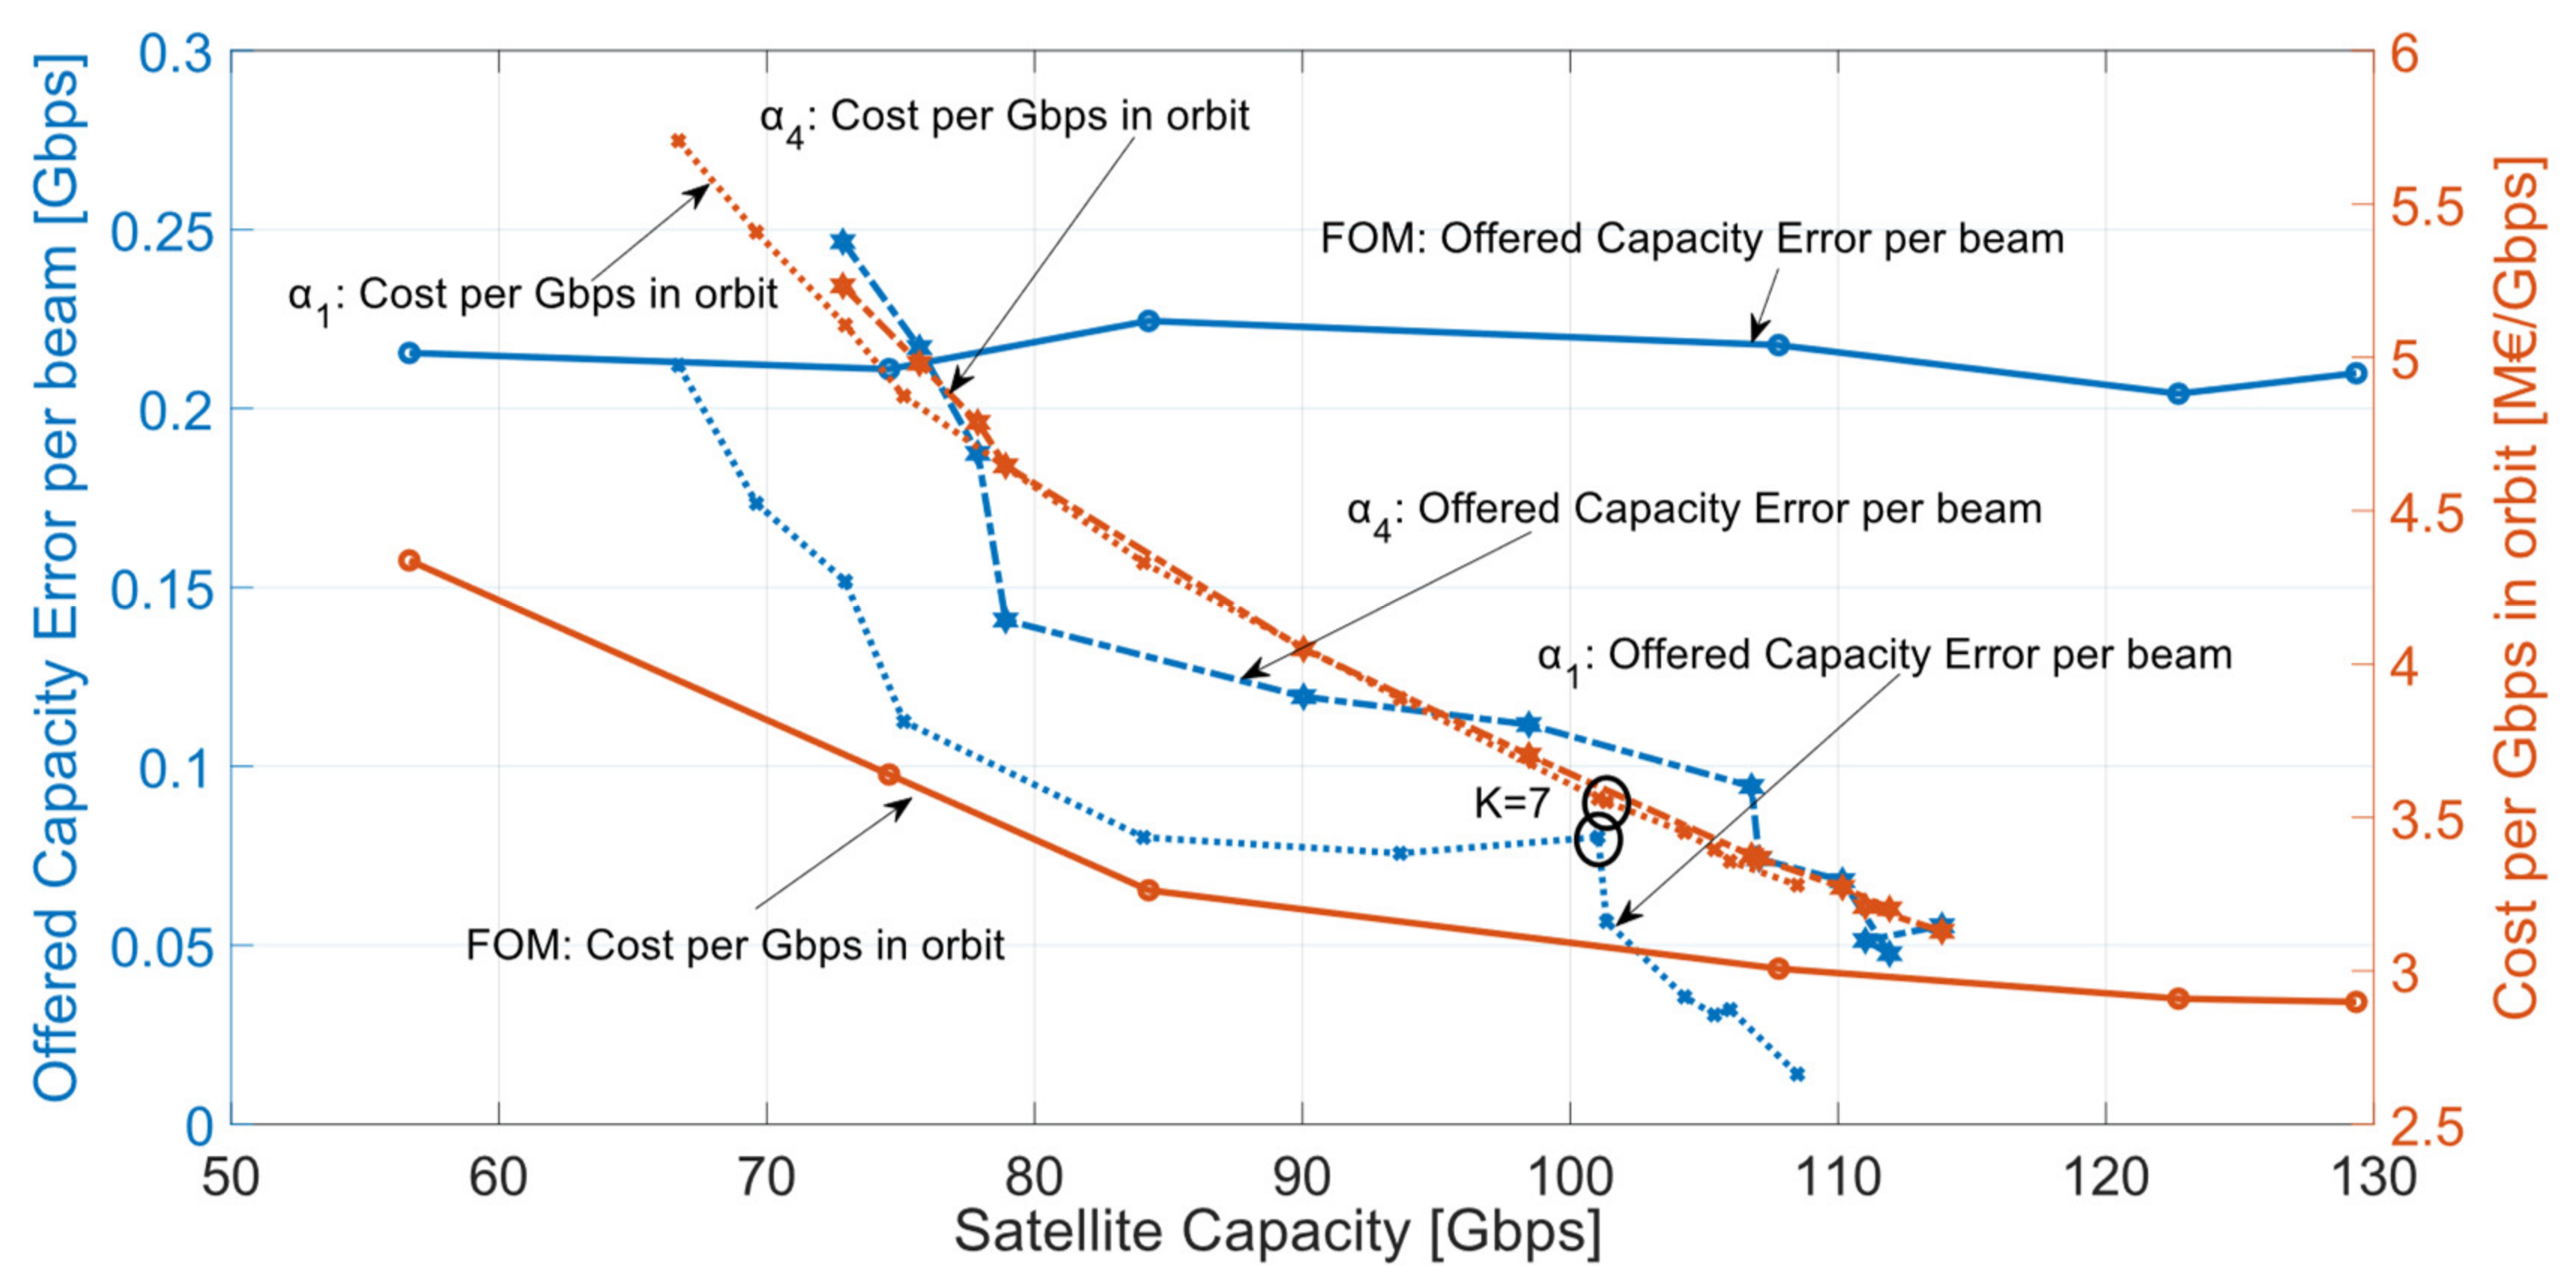
The proposed methodology was evaluated, and performance was compared with respect to the previous optimization methodology for VHTS system design presented in [8], where it proposes a Forward-link Optimization Methodology (FOM), and the comparison is presented in Figure 15.
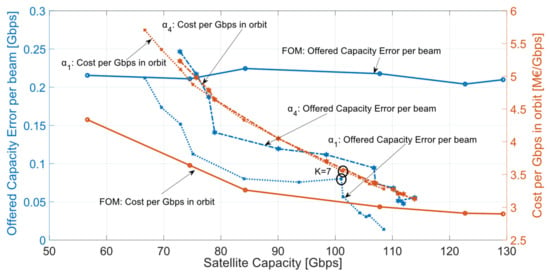
Figure 15.
Performance comparison of methodology on Very High Throughput Satellite (VHTS) according to previous methodology (FOM) [8].
FOM is an optimization methodology based on the number of beams, user G/T, and availability. Still, it always offers capacity in all satellite beams since it maintains regular coverage in the service area. Figure 15 shows the performance comparison of both methodologies comparing the cost per Gbps in orbit and the Offered Capacity Error per beam.
FOM shows a better performance in minimizing the cost of Gbps. However, the Offered Capacity Error per beam in FOM always stays in the range of 0.21–0.24 Gbps because, even though changing the assigned beamwidth (by changing the number of beams), the coverage is always regular, so it offers the same capacity in the whole service area regardless of the distribution of the average traffic demand.
On the other hand, with the methodology proposed in this paper, it can achieve an Offered Capacity Error per beam of fewer than 0.017 Gbps. In that sense, if we used seven regions and we would be obtaining a cost of 3.49 M EUR per Gbps in orbit and an Offered Capacity Error of 0.076 Gbps, while if we used the FOM methodology, we could obtain a cost of 3.1 M EUR per Gbps at the cost of having a 0.23 Gbps Offered Capacity Error. In other words, with the proposed methodology, each M EUR per Gbps in orbit would be better used. This comparison presented allows us to highlight the efficiency in allocating each Gbps in orbit for each M EUR invested.
On the other hand, a VHTS system with a capacity greater than 120 Gbps can be seen to further reduce the cost of Gbps in orbit compared to FOM (see Figure 15).
5.3. Cluster Definition
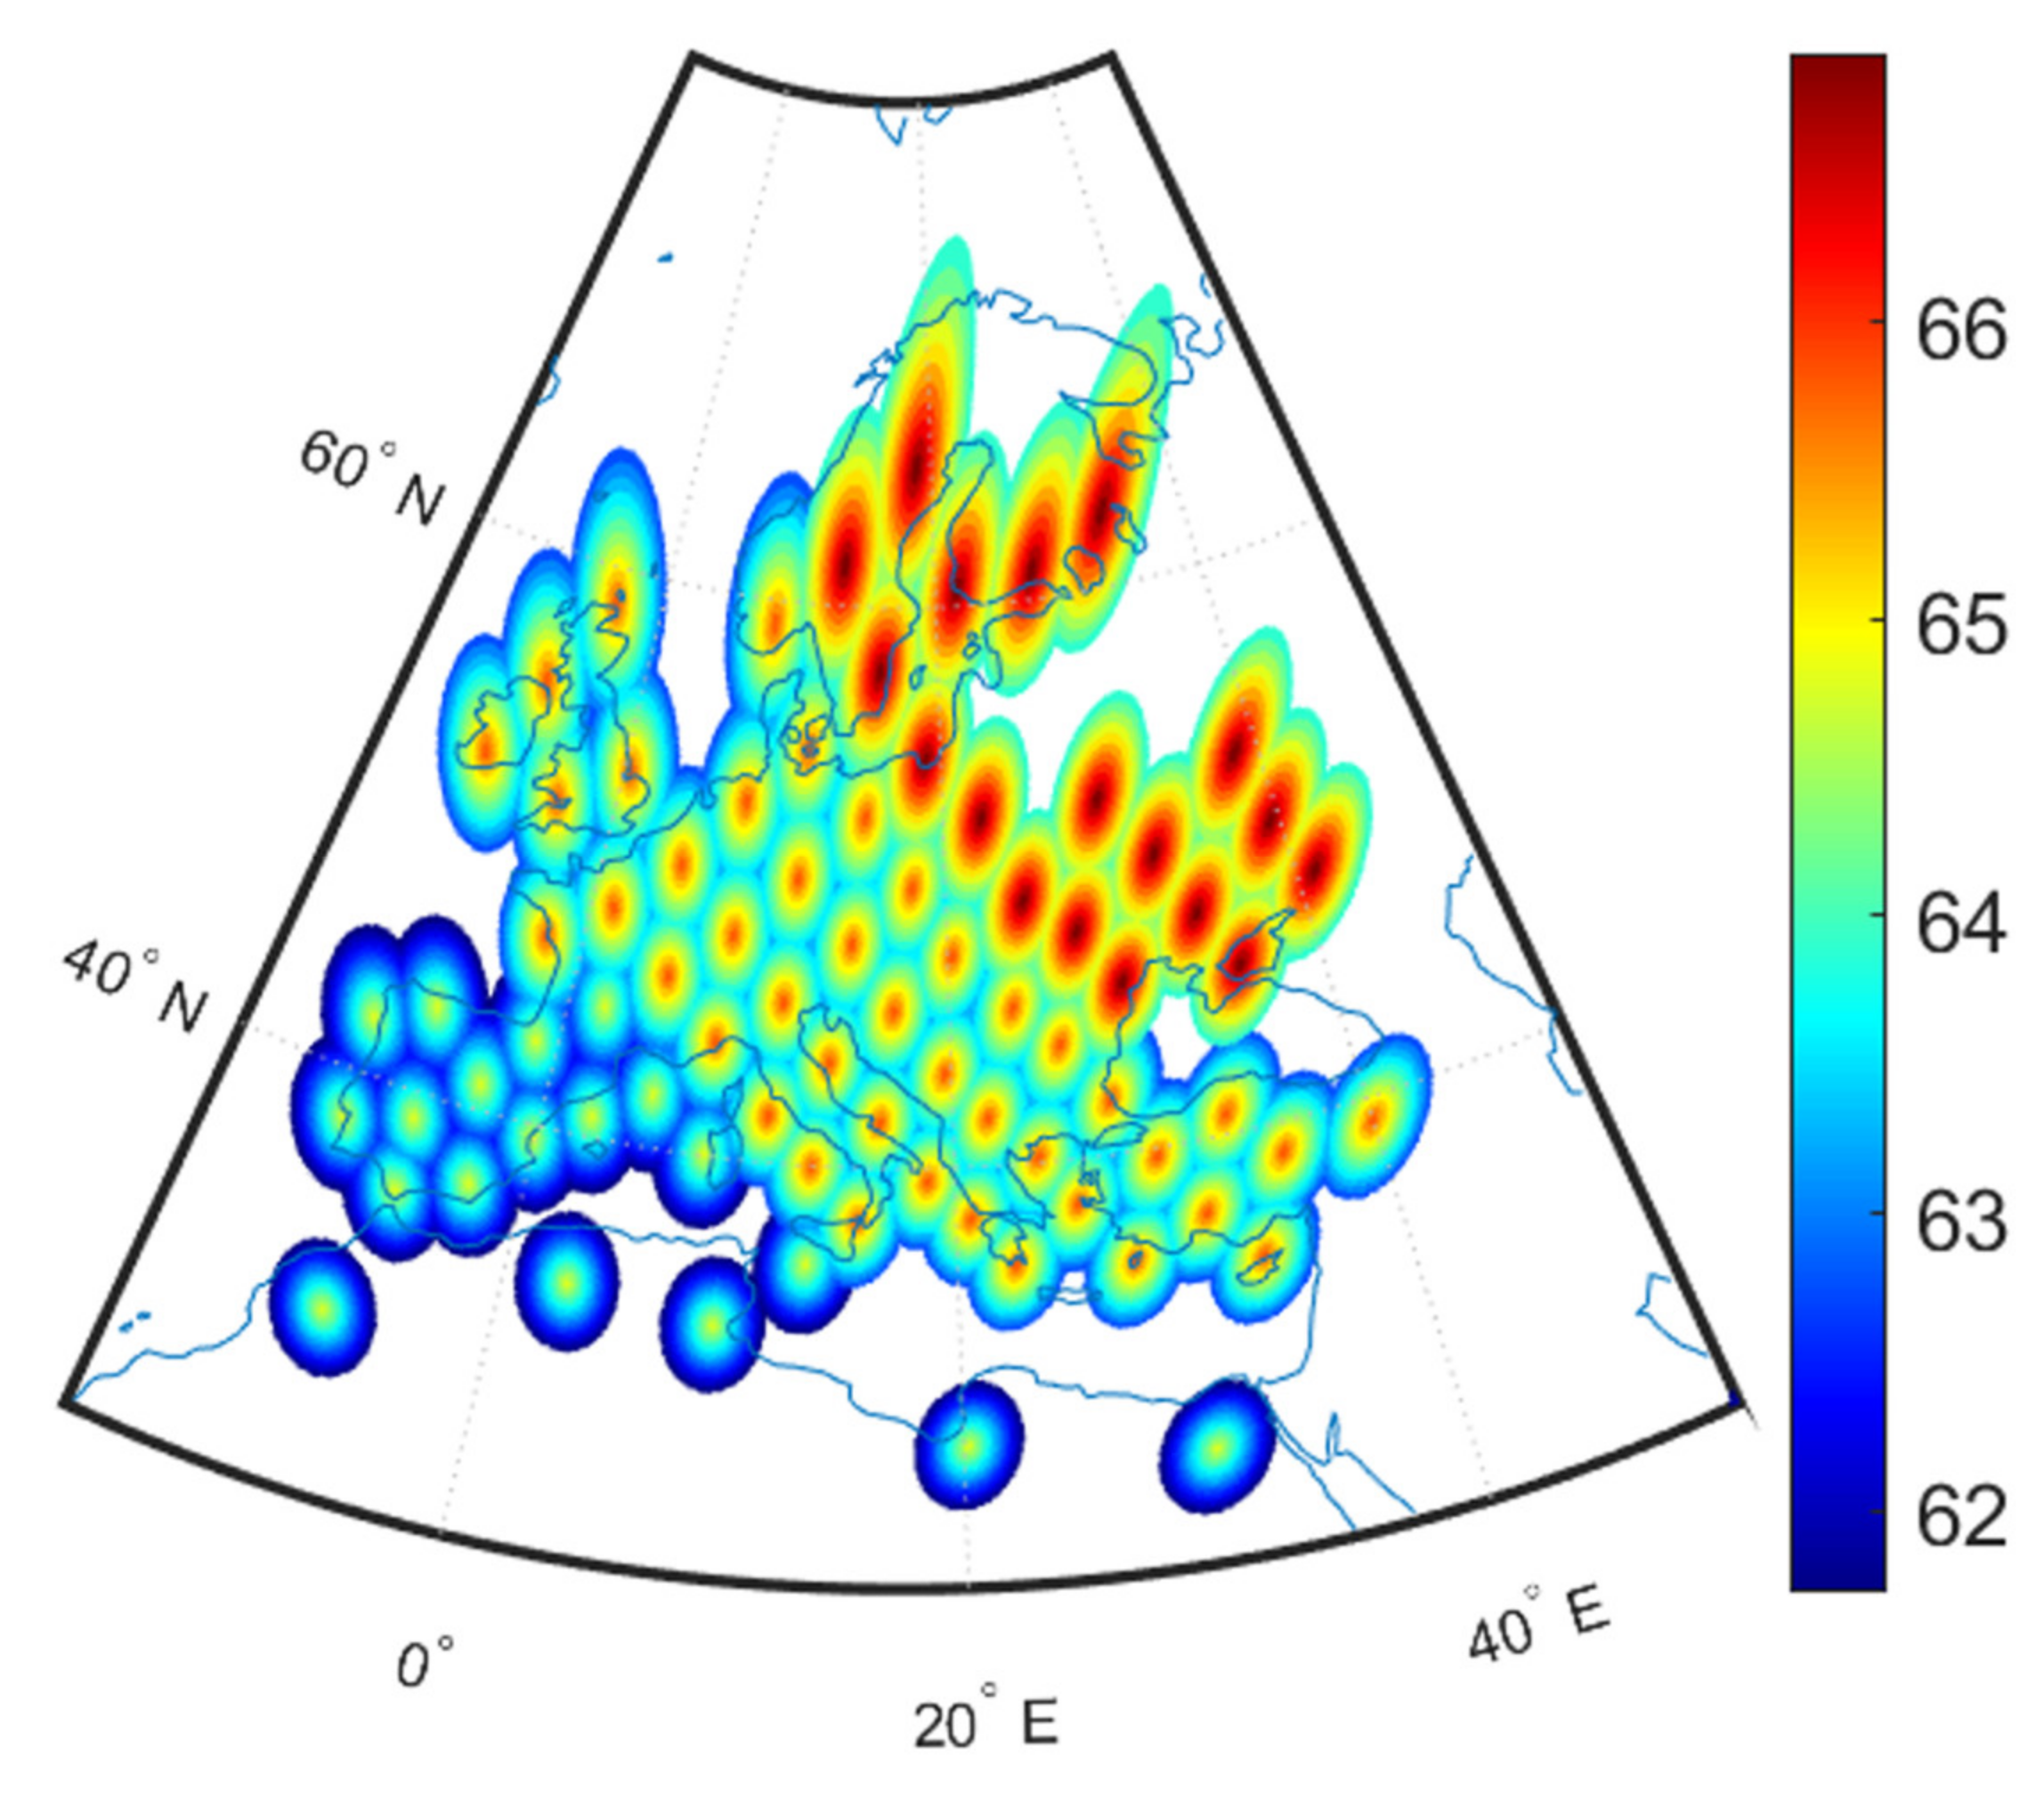
Figure 16 shows the EIRP map of the service area when divided into regions and is chosen (Section 5.1). Due to the projection from the orbital position of the satellite to the service area, the beams pointing to the higher latitudes and the longitudes farther from the orbital position on the Earth are ellipsoid with a lower axial ratio than those at lower latitudes and with longitudes closer to the sub-satellite point. On the other hand, it can be seen that the regions with a higher traffic demand have a narrower beamwidth assigned to them, so they obtain a higher EIRP reaching 66.9 dBW.
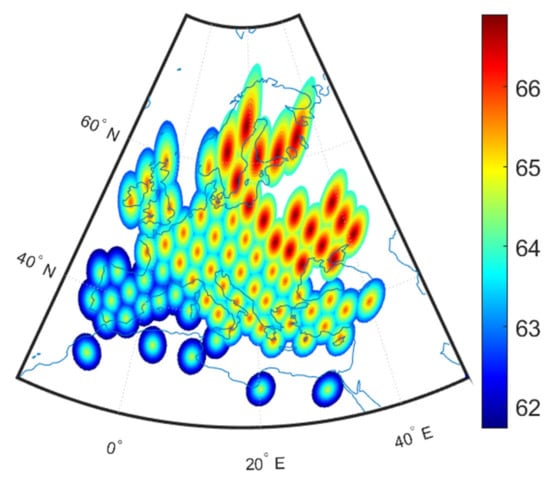
Figure 16.
EIRP (dBW) map over service area using irregular coverage for 4 regions.
Based on this coverage, Table 2 presents the standard deviation and variance resulting when the antenna axis A0 orientation is set to spots 41 (the best) and to spot 7. Note that the minimum values are obtained for the spot b = 41.

Table 2.
Standard deviation and variance for A0 to the spots 41 and 7.
The location of the feeds can be optimized by minimizing , including the condition of the minimum distance between feeds. This minimum distance depends on the spot size, so on the feed horn aperture diameter for each spot, for instance, when SFB is implemented. In this optimization, the focal distance is adjusted, since it defines the minimum distance. Table 3 presents the mean of the difference between the location of the feed horn of the cluster after optimization () and the locations obtained (). The difference between the adjusted and original for A0 oriented to spot b = 41 is about one order of magnitude less than the obtained to spot b = 7.

Table 3.
Mean of differences between the feed horns locations adjusted and original locations for both A0 to the spots 41 and 7.
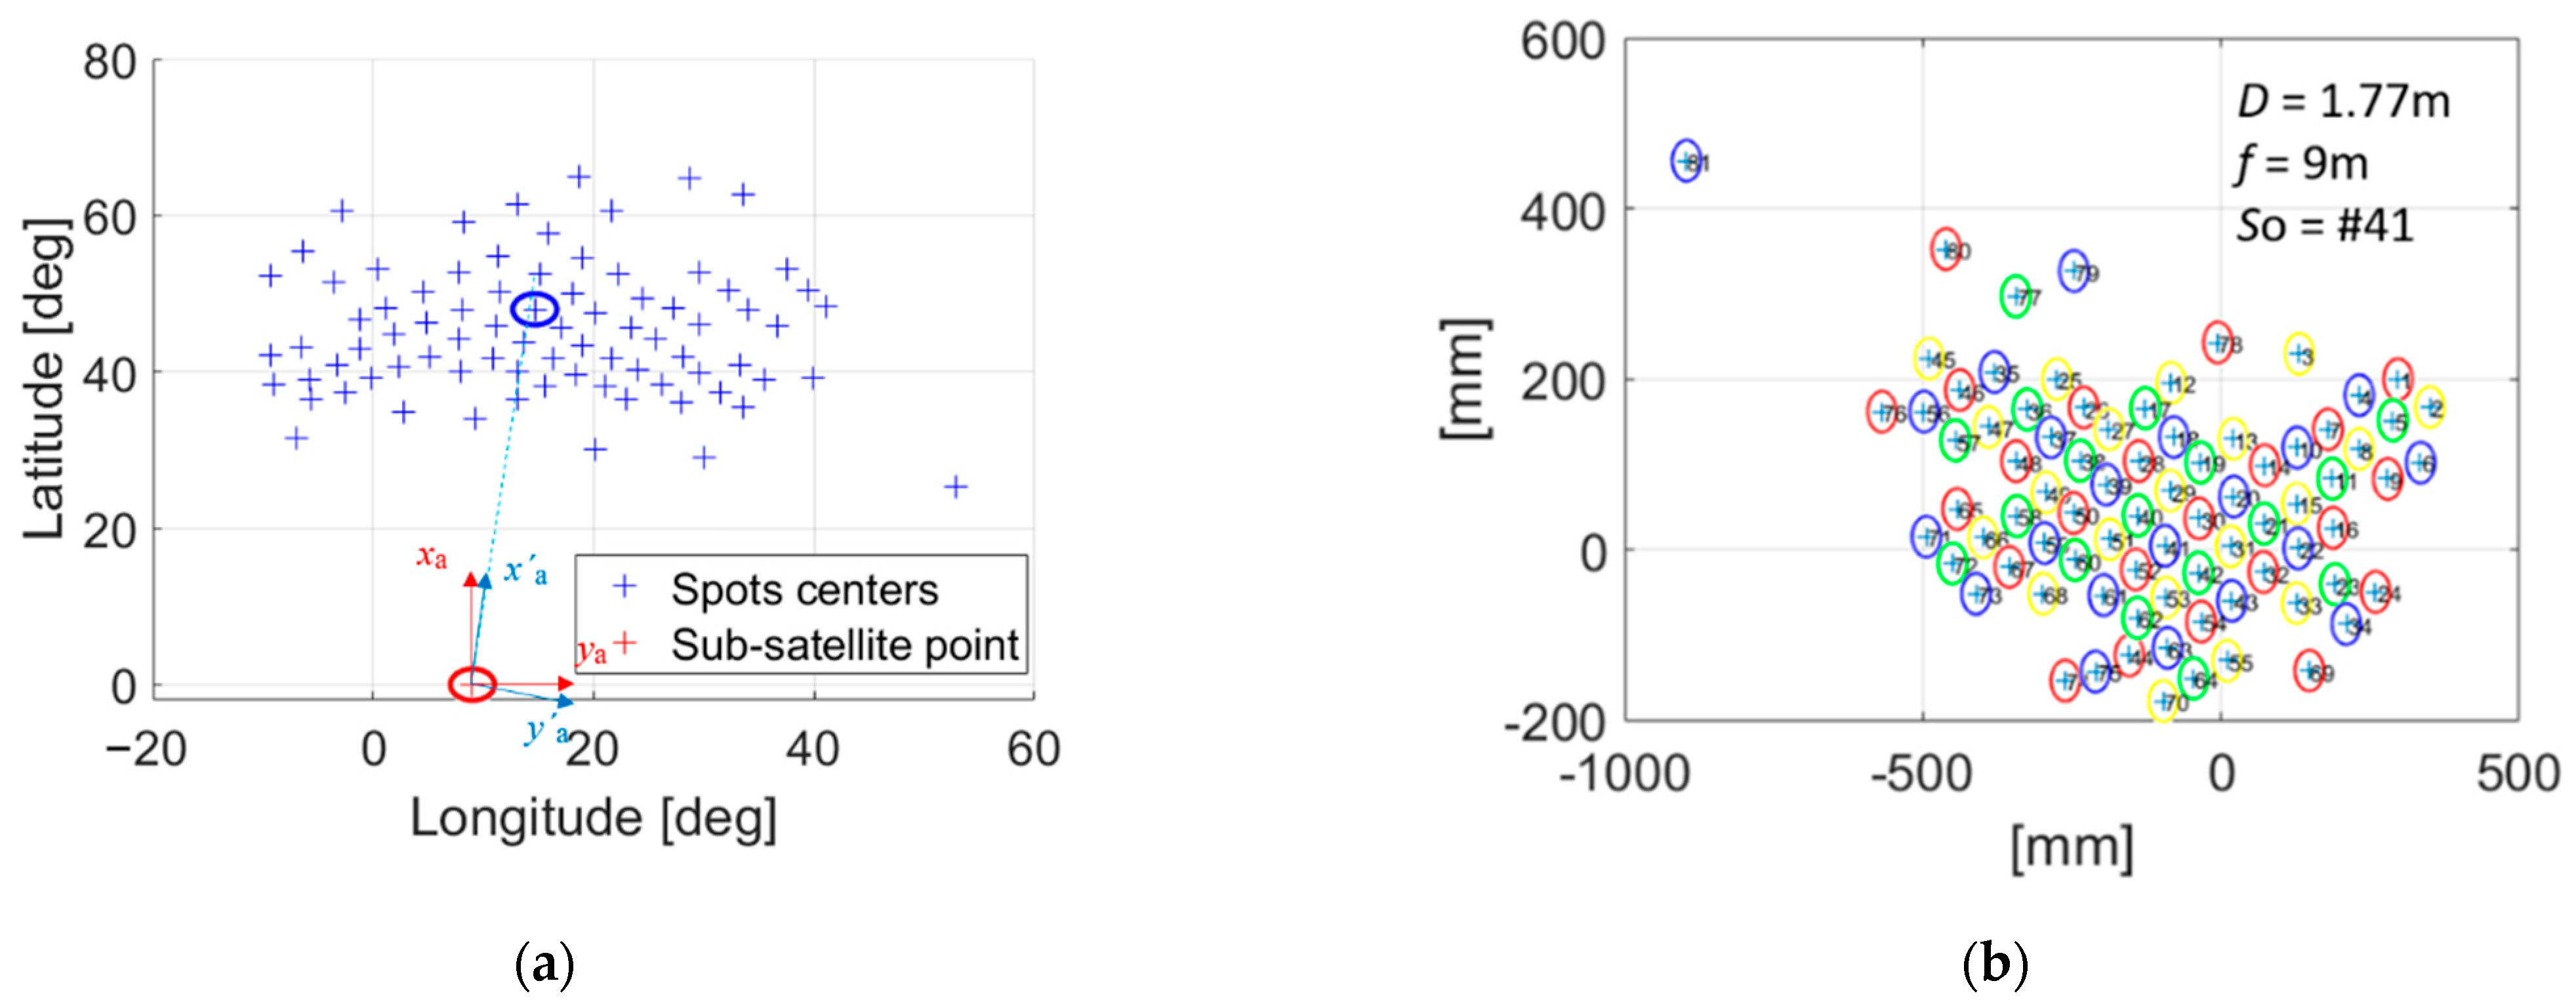
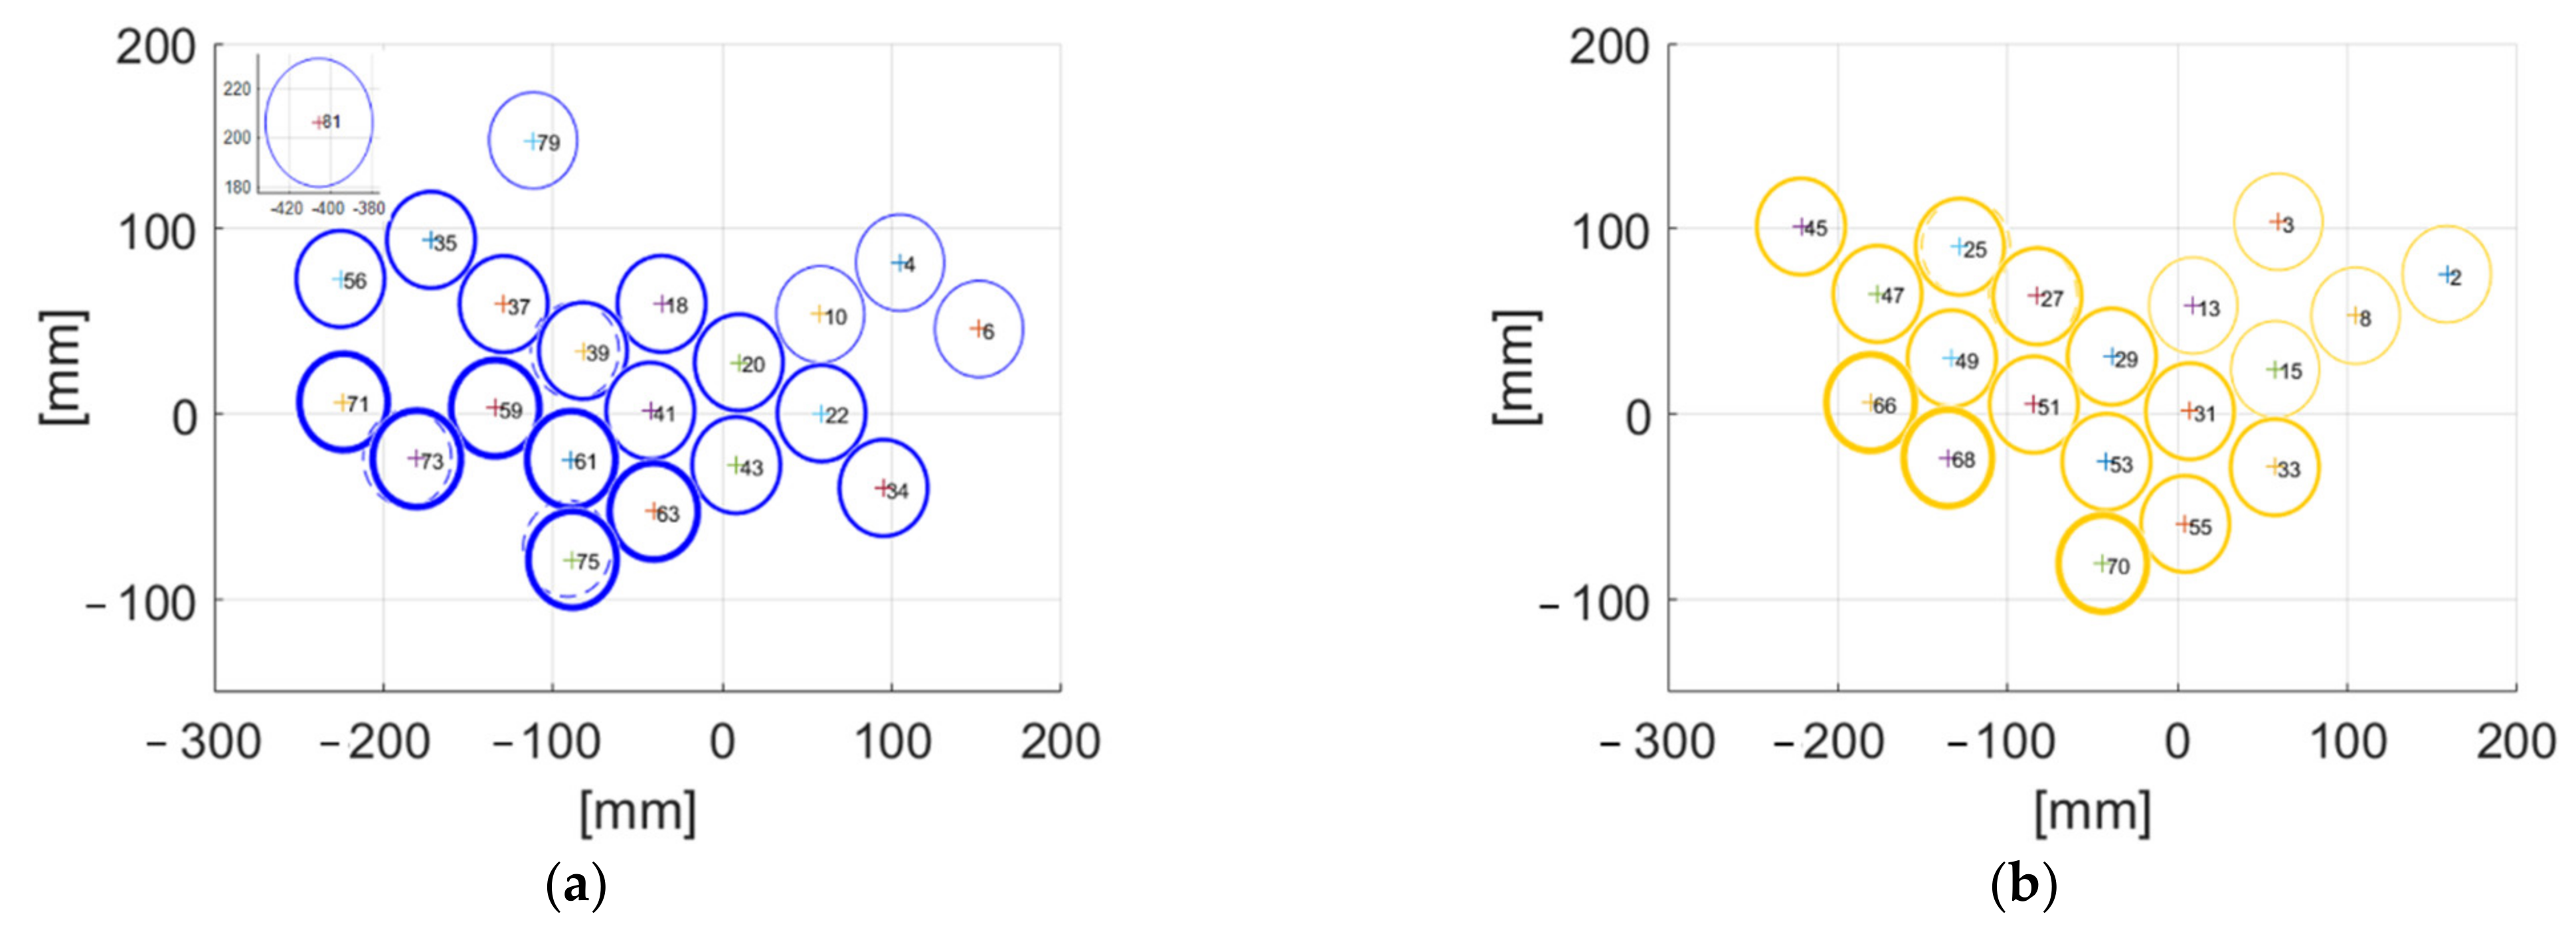
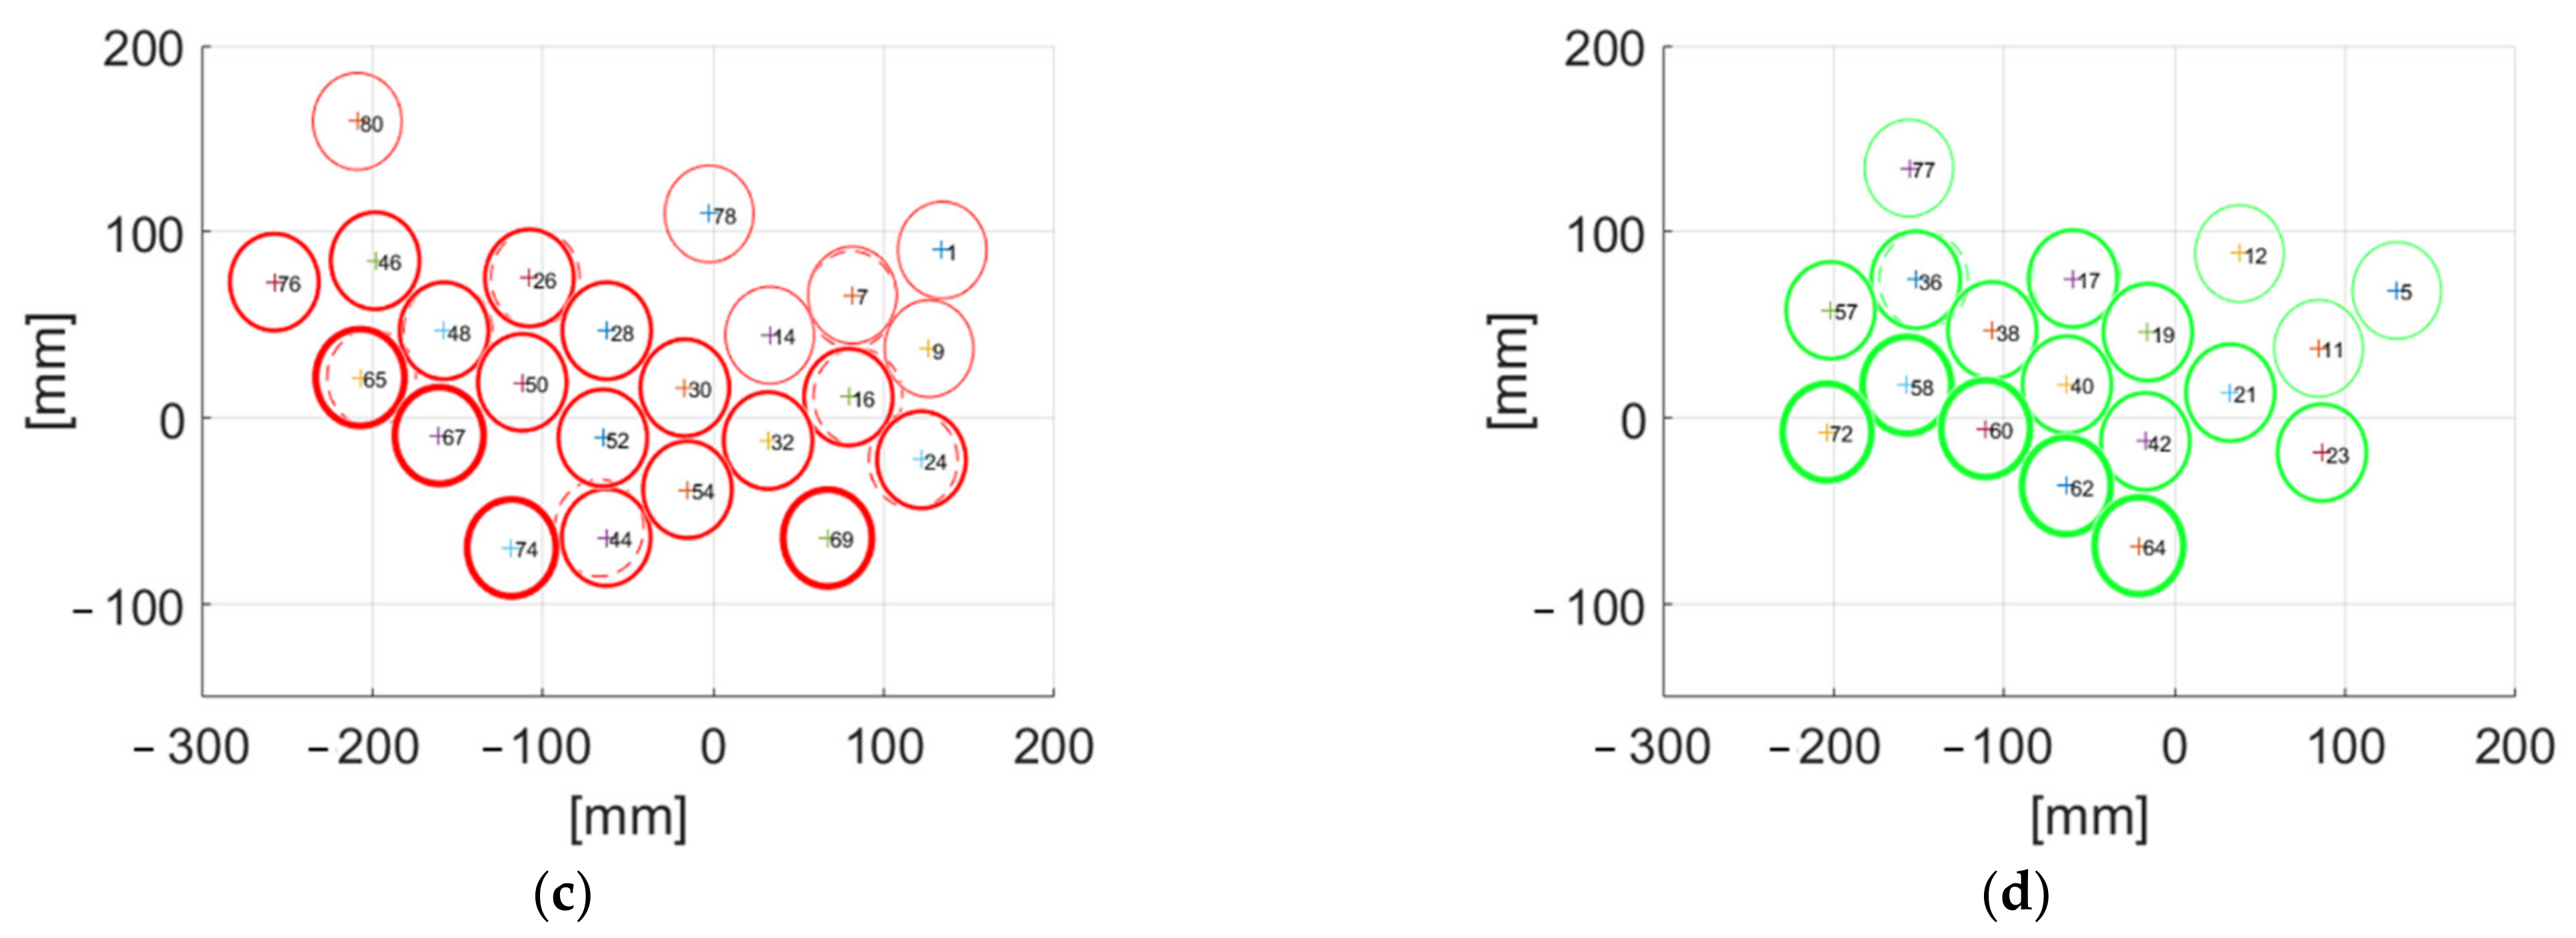
In this sense, Figure 17a shows the antenna orientation concerning the subsatellite point (9 E, see Table 1) for the coverage obtained. Each feed will have to be designed according to the pointing direction from the subsatellite point to the beam position. On the other hand, Figure 17b represents the positions of the feed with the antenna z-axis pointing to the selected spot for a diameter of 1.77 m and a focal length of 9 m. The frequency reuse scheme used is the four-color scheme; a reflector is proposed for each color: red, green, blue, and yellow, where each color represents a frequency and a polarization.
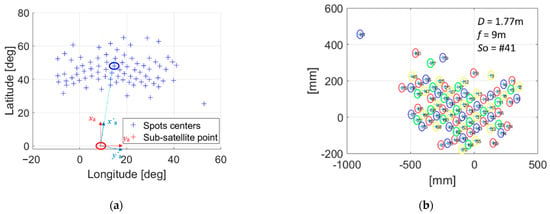
Figure 17.
(a) Position of the spots centers and z-axis direction; (b) Feeds positions with the antenna z-axis pointing to selected spot.
Figure 18 presents the four color clusters that result from the optimization of the multibeam service area with different spot sizes, including the geometry of the onboard antenna (three different linewidths). The four colors cluster are defined for the same north-oriented antennas to A0. In a real case, those can be north-, south-, east-, and west-oriented antennas. The impact of implementing those four different orientations will be observed in a different oriented separated cluster. Thus, in this proposal, it can be observed that the four colors clusters match with the whole cluster presented in Figure 17b. Furthermore, the resulted in focal distance , while the diameter of the reflector is , resulting in a . The can be reduced if the minimum spot size is reduced.
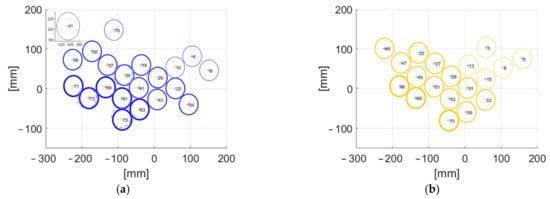
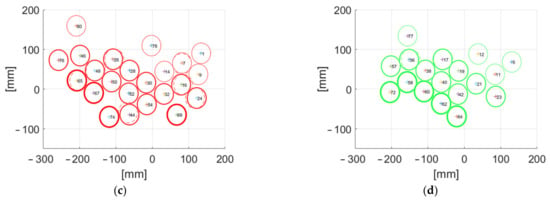
Figure 18.
Four colors feed clusters for the four colors scheme. (a) Blue, (b) yellow, (c) red, and (d) green.
6. Conclusions
Nowadays, some technologies allow the payload to allocate resources flexibly, e.g., power, bandwidth, or illumination time in case of beam hopping. Still, these technologies considerably increase the cost of the payload, thus losing the advantages offered by a VHTS system to reduce the cost of Gbps in orbit, plus added latency due to processing time. This work proposes a methodology that allows maintaining the cost advantages of a fixed VHTS system while reducing the error between the offered capacity and the required capacity by optimizing the satellite coverage design using irregular beam sizes. With this methodology, we seek to minimize three parameters: the Normalized Coverage Error, the Offered Capacity Error per beam, and the cost per Gbps in orbit.
The results obtained depend on the shape of the service area, traffic demand distribution, and system conditions and features. However, the methodology has been compared with a previous optimization method, and it is observed that with the proposal of this paper, each M EUR per Gbps is distributed in a more optimal way, minimizing the Offered Capacity Error.
Compared to the works presented in the state-of-the-art, this methodology considers the technical limitations for the design of the payload antenna and its feed clusters. The results obtained are viable to provide coverage with beams of irregular sizes.
With this methodology, it is possible to obtain the optimal parameters that allow designing the BFN of the satellite payload; as future work, we plan to include the design of the BFN and the architecture of the payload. The proposed methodology for optimizing the systems can be used for flexible payload when iterative processes are implemented, changing the input of coverage selected after minimizing the cost function.
In this sense, the proposed cost function generates a line for possible future solutions to this problem using various optimization techniques, such as genetic algorithms or Machine Learning techniques.
Author Contributions
Conceptualization, F.G.O.-G. and M.A.S.-N.; methodology, F.G.O.-G. and M.A.S.-N.; software, F.G.O.-G.; validation, M.A.S.-N., R.M. and S.L.-A.; formal analysis, F.G.O.-G. and M.A.S.-N.; investigation, F.G.O.-G.; writing—original draft preparation, F.G.O.-G.; writing—review and editing, M.A.S.-N. and R.M.; supervision, M.A.S.-N., R.M. and S.L.-A.; project administration, R.M.; funding acquisition, R.M. All authors have read and agreed to the published version of the manuscript.
Funding
This work has been supported by the Spanish Government, Ministerio de Economía, Industria y Competitividad through the National Program of Research, Development and Innovation within the FUTURE-RADIO project under Grant TEC2017-85529-C3-1-R, and a Ph.D. scholarship provided by Universidad Politécnica de Madrid.
Institutional Review Board Statement
Not applicable.
Informed Consent Statement
Not applicable.
Data Availability Statement
The data that support the findings of this study are available from the corresponding author upon reasonable request.
Acknowledgments
This paper was made possible thanks to the Spanish Government and the Universidad Politécnica de Madrid for their financial support.
Conflicts of Interest
The authors declare no conflict of interest.
Nomenclature
| Number of beams | |
| b-th beam | |
| One-sided half-power beamwidth | |
| Bandwidth in b-th beam | |
| b-th beamwidth | |
| Carrier to Interference plus ratio ratio in b-th beam | |
| Offered capacity in b-th beam | |
| Spectral efficiency in the b-th beam | |
| Specific geographic area of one km2 | |
| Throughput density per km2 | |
| Throughput per user | |
| Population density | |
| Penetration rate | |
| Concurrence rate | |
| Expected value over all the area inside b-th beam | |
| Area of b-th beam | |
| Ratio between the satellite orbital position and the geographical coordinate of the center of the b-th beam | |
| Cost per gateway | |
| User beam per gateway | |
| Antenna diameter of gateway | |
| Cost associate to | |
| Cost associate to | |
| Satellite cost | |
| Cost per Gbps in orbit | |
| Total system cost | |
| Satellite capacity | |
| Normalized error between the service area and the coverage area | |
| Coverage area | |
| Service area | |
| Beams grid orientation with respect to the equator | |
| Beam Coverage Efficiency | |
| Number of regions | |
| Area of k-th region that depends on traffic distribution | |
| Geographic position reference for the coverage area | |
| Geographic position reference for the k-th coverage area | |
| Beamwidth of k-th region that depends on traffic distribution | |
| Vector of size 1 × K containing the area of the K regions () | |
| Vector of size 1 × K containing the area of the K regions () | |
| Vector of size 1 × K containing latitudes of the first beam in the K regions (). | |
| Vector of size 1 × K containing longitudes of the first beam in the K regions (). | |
| Vector of size 1 × K containing the assigned beamwidth in the area of the K regions (). | |
| System cost function to optimize | |
| Weight of the capacity error in the cost function | |
| Weight of the normalized coverage error in the cost function | |
| Weight of the cost per Gbps in orbit in the cost function | |
| Number of system constraints | |
| m-th system constraint | |
| m-th set of possible values to the m-th system constraint | |
| Set size of grid inclination | |
| Diameter of the satellite reflector antenna | |
| Diameter of the feed |
References
- Liolis, K.; Geurtz, A.; Sperber, R.; Schulz, D.; Watts, S.; Poziopoulou, G.; Evans, B.; Wang, N.; Vidal, O.; Jou, B.T.; et al. Use cases and scenarios of 5G integrated satellite-terrestrial networks for enhanced mobile broadband: The SaT5G approach. Int. J. Satell. Commun. Netw. 2019, 37, 91–112. [Google Scholar] [CrossRef] [Green Version]
- Calabuig, J.; Monserrat, J.F.; Gómez-Barquero, D. 5th generation mobile networks: A new opportunity for the convergence of mobile broadband and broadcast services. IEEE Commun. Mag. 2015, 53, 198–205. [Google Scholar] [CrossRef]
- Recommendation ITU-R M.2083-0. IMT Vision—Framework and Overall Objectives of the Future Development of IMT for 2020 and Beyond; Electronic Publication: Geneva, Switzerland, 2015. [Google Scholar]
- Giambene, G.; Kota, S.; Pillai, P. Satellite-5G Integration: A Network Perspective. IEEE Netw. 2018, 32, 25–31. [Google Scholar] [CrossRef]
- Guerste, M.; Grotz, J.; Belobaba, P.; Crawley, E.; Cameron, B. Revenue Management for Communication Satellite Operators—Opportunities and Challenge. In Proceedings of the IEEE Aerospace Conference, Big Sky, MT, USA, 7–14 March 2020. [Google Scholar]
- Guidotti, A.; Vanelli-Coralli, A.; Conti, M.; Andrenacci, S.; Chatzinotas, S.; Maturo, N.; Evans, B.; Awoseyila, A.; Ugolini, A.; Foggi, T.; et al. Architectures and Key Technical Challenges for 5G Systems Incorporating Satellites. IEEE Trans. Veh. Technol. 2019, 68, 2624–2639. [Google Scholar] [CrossRef] [Green Version]
- S Commission Communication on: Competitive Digital Single Market. Towards a European Gigabit Society. COM 587 and Staff Working Document-SWS 300. 2016. Available online: https://digital-strategy.ec.europa.eu/en/library/communication-connectivity-competitive-digital-single-market-towards-european-gigabit-society (accessed on 30 May 2021).
- Ortiz-Gomez, F.; Martínez, R.; Salas-Natera, M.; Cornejo, A.; Landeros-Ayala, S. Forward Link Optimization for the Design of VHTS Satellite Networks. Electronics 2020, 9, 473. [Google Scholar] [CrossRef] [Green Version]
- Guan, Y.; Geng, F.; Saleh, J.H. Review of High Throughput Satellites: Market Disruptions, Affordability-Throughput Map, and the Cost Per Bit/Second Decision Tree. IEEE Aerosp. Electron. Syst. Mag. 2019, 34, 64–80. [Google Scholar] [CrossRef]
- Garau, J.J.; Pachler, M.; Guerster, M.; del Portillo, I. Artificial Intelligence Algorithms for Power Allocation in High Throughput Satellites: A Comparison. In Proceedings of the IEEE Aerospace Conference, Big Sky, MT, USA, 7–14 March 2020. [Google Scholar]
- New-Generation Satellite to Deliver High-Speed Broadband across Europe. Available online: https://www.eutelsat.com/home/satellites/future-satellites/konnect-vhts.html# (accessed on 27 September 2020).
- Martinez, E.; Martinez-de-Rioja, D.; Encinar, J.A.; Pino, A.; Gonzalez-Valdes, B.; Rodriguez, Y.; Aris, M.; Toso, G. Advanced Multibeam Antenna Configurations Based on Reflectarrays: Providing multispot coverage with a smaller number of apertures for satellite communications in the K and Ka bands. IEEE Antennas Propag. Mag. 2019, 61, 77–86. [Google Scholar] [CrossRef]
- Fenech, H.; Tomatis, A.; Amos, S.; Soumpholphakdy, V.; Serrano-Velarde, D. Future High Throughput Satellite systems. In Proceedings of the IEEE First AESS European Conference on Satellite Telecommunications (ESTEL), Rome, Italy, 2–5 October 2012. [Google Scholar]
- Rave, C.; Jacob, A.F. Architectures for efficient power sharing in active multiple-feed-per-beam satellite antennas. In Proceedings of the International Conference on Microwave, Radar and Wireless Communications (MIKON), Krakow, Poland, 9–11 May 2016. [Google Scholar]
- Zhang, L.; Zhang, W.; Shi, J.; Gong, Q.; Chen, X. Research of Beam Optimization for Multiple Feeds per Beam (MFB) Antennas Based on Genetic Algorithm; IEEE Asia-Pacific Microwave Conference (APMC): Singapore, 2019. [Google Scholar]
- Schneider, M.; Hartwanger, C.; Wolf, H. Antennas for multiple spot beam satellites. CEAS Space J. 2011, 2, 59–66. [Google Scholar] [CrossRef] [Green Version]
- Ortiz-Gomez, F.G.; Martinez Rodriguez-Osorio, R.; Salas-Natera, M.A.; Landeros-Ayala, S. Adaptive Resources Allocation for Flexible Payload Enabling VHTS Systems: Methodology and Architecture. In Proceedings of the 36th AIAA International Communications Satellite Systems Conference (ICSSC), Niagara Falls, ON, USA, 15–18 October 2018. [Google Scholar]
- Cocco, G.; de Cola, T.; Angelone, M.; Katona, Z.; Erl, S. Radio Resource Management Optimization of Flexible Satellite Payload for DVB-S2 Systems. IEEE Trans. Broadcasting 2017, 99, 1–15. [Google Scholar] [CrossRef] [Green Version]
- Ortiz-Gomez, F.G.; Tarchi, D.; Martínez, R.; Vanelli-Coralli, A.; Salas-Natera, M.A.; Landeros-Ayala, S. Convolutional Neural Networks for Flexible Payload Management in VHTS Systems. IEEE Syst. J. 2020. [Google Scholar] [CrossRef]
- Serrano-Velarde, D.; Lame, E.; Fenech, H.; Rodriguez, G.F. Novel Dimensioning Method for High-Throughput Satellites: Forward Link. IEEE Trans. Aerosp. Electron. Syst. 2016, 50, 2146–2163. [Google Scholar] [CrossRef]
- Ortiz-Gomez, F.G.; Martínez, R.; Salas-Natera, M.A.; Landeros-Ayala, S.; Tarchi, D.; Vanelli-Coralli, A. On the Use of Neural Networks for Flexible Payload Management in VHTS Systems. In Proceedings of the 25th Ka and Broadband Communications Conference, Sorrento, Italy, 29 September–2 October 2019. [Google Scholar]
- Kyrgiazos, A.; Evans, B.; Thompson, P. Irregular beam sizes and non-uniform bandwidth allocation in HTS multibeam satellite systems. In Proceedings of the 31st AIAA International Communications Satellite Systems Conference, Florence, Italy, 14–17 October 2013. [Google Scholar]
- Guidotti, A. Beam Size Design for New Radio Satellite Communications Systems. IEEE Trans. Veh. Technol. 2019, 68, 11379–11383. [Google Scholar] [CrossRef]
- Roumeliotis, A.J.; Kourogiorgas, C.; Panagopoulos, A. Optimal Capacity Allocation Strategies in Smart Gateway Satellite Systems. IEEE Commun. Lett. 2018, 23, 56–59. [Google Scholar] [CrossRef]
- Roumeliotis, A.J.; Kourogiorgas, C.; Panagopoulos, A. Dynamic Capacity Allocation in Smart Gateway High Throughput Satellite Systems Using Matching Theory. IEEE Syst. J. 2018, 13, 2001–2009. [Google Scholar] [CrossRef]
- International Telecommunication Union. Radiocommunication Sector. In ITU-R Recommendations 618-13: Propagation Data and Prediction Methods Required for the Design of Earth-Space Telecommunication Systems; International Telecommunication Union: Geneva, Switzerland, 2017. [Google Scholar]
- European Telecommunications Standards Institute. Digital Video Broadcasting (DVB) Second Generation Framing Structure, Channel Coding and Modulation Systems for Broadcasting, Interactive Services, News Gathering and Other Broadband Satellite Applications; Part 2: DVB-S2 Extensions (DVB-S2X); European Telecommunications Standards Institute: Sophia Antipolis, France, 2014. [Google Scholar]
- Hu, X.; Zhang, Y.; Liao, X.; Liu, Z.; Wang, W.; Ghannouchi, F.M. Dynamic Beam Hopping Method Based on Multi-Objective Deep Reinforcement Learning for Next Generation Satellite Broadband Systems. IEEE Trans. Broadcasting 2020, 66, 630–646. [Google Scholar] [CrossRef]
- Ferreira, P.V.; Paffenroth, R.; Wyglinski, A.M.; Hackett, T.M.; Bilen, S.G. Multi-Objective Reinforcement Learning–based Deep Neural Networks for Cognitive Space Communications. In Proceedings of the Cognitive Communications for Aerospace Applications Workshop (CCAA), Cleveland, OH, USA, 27–28 June 2017. [Google Scholar]
- Abe, Y.; Ogura, M.; Tsuji, H.; Miura, A.; Adachi, S. Resource and Network Management Framework for a Large-Scale Satellite Communications System. IEICE Trans. Fundam. Electron. Commun. Comput. Sci. 2020, 103, 492–501. [Google Scholar] [CrossRef] [Green Version]
- Ferreira, P.V.; Paffenroth, R.; Wyglinski, A.M.; Hackett, T.M.; Bilen, S.G.; Mortensen, J. Multi-Objective Reinforcement Learning–based Deep Neural Networks for Cognitive Space Communications. IEEE J. Sel. Areas Commun. 2017, 36, 1030–1041. [Google Scholar]
- Ferreira, P.V.; Paffenroth, R.; Wyglinski, A.M.; Hackett, T.M.; Bilen, S.G.; Mortensen, J. Reinforcement Learning for Satellite Communications: From LEO to Deep Space Operations. IEEE Commun. Mag. 2019, 57, 70–75. [Google Scholar] [CrossRef]
- Komiyama, N.; Miura, A.; Orikasa, T.; Fujino, Y. Development of Resource Allocation Re-construction Technology (Digital Beam Former and Digital Channelizer. J. Natl. Inst. Inf. Commun. Technol. 2015, 62, 151–160. [Google Scholar]
- De la Torre, D.; Ortiz-Gomez, F.G.; Salas-Natera, M.; Martinez, R. Analysis of the Traffic Demand on Very High Throughput Satellite for 5G. In Proceedings of the XXXV Simposio Nacional de la Unión Científica Internacional de Radio (URSI 2020), Malaga, Spain, 2–4 September 2020. [Google Scholar]
- Evans, B.; Thompson, P. Key issues and technologies for a Terabit/s satellite. In Proceedings of the AIAA International Communications Satellite Systems, Anaheim, CA, USA, 27–30 September 2010. [Google Scholar]
- Satbeam. Eutelsat KA-SAT. Available online: https://www.satbeams.com/satellites?norad=37258 (accessed on 1 September 2020).
Publisher’s Note: MDPI stays neutral with regard to jurisdictional claims in published maps and institutional affiliations. |
© 2021 by the authors. Licensee MDPI, Basel, Switzerland. This article is an open access article distributed under the terms and conditions of the Creative Commons Attribution (CC BY) license (https://creativecommons.org/licenses/by/4.0/).

