Article

The Dynamics of Hongjian Nur, the Largest Desert Freshwater Lake in China, during 1990–2017

1
College of Earth and Environmental Sciences, Lanzhou University, Lanzhou 730000, China
2
School of Environmental Science & Engineering, Southern University of Science and Technology, Shenzhen 518055, China
3
Department of Geography and Geospatial Sciences, Kansas State University, Manhattan, KS 66506, USA
4
Institute of Geodesy and Geophysics, Chinese Academy of Sciences, Wuhan 430077, China
5
Department of Civil and Environmental Engineering, Princeton University, Princeton, NJ 08544, USA
6
Key Laboratory of Poyang Lake Wetland and Watershed Research, Ministry of Education, JiangXi Normal University, Nanchang 330022, China
*
Author to whom correspondence should be addressed.
Remote Sens. 2021, 13(14), 2690; https://doi.org/10.3390/rs13142690
Submission received: 25 May 2021 / Revised: 28 June 2021 / Accepted: 30 June 2021 / Published: 8 July 2021
(This article belongs to the Section Urban Remote Sensing)

Abstract

:
China’s largest desert freshwater lake, Hongjian Nur (HN), which is the largest habitat of relict gull (Larus relictus), has rapidly changed in recent years. However, it is difficult to quantitatively monitor the dynamics of the lake and determine the causes of its changes due to the lack of in situ observation. In this study, a remote sensing-based approach was utilized to overcome these limitations. The monthly water areas during 1990–2017 were first extracted from Landsat multispectral images via an improved method based on the floating algae index (FAI). Then, lake surface elevations measured by real-time kinematics (RTK) were used to calculate the variations in the water storage of HN. Finally, the driving factors of the rapidly changed HN in different periods were investigated by correlation analysis. The result indicated that the drivers affecting the water storage of HN in different periods were not the same. Climate change was the main driving factor of lake level fluctuation during the HN relatively stable stage (1990–1998). Drought and the intensification of human activities were the main factors for the rapid shrinkage of the HN during 1999–2010. Human activities, especially coal-related industries and reservoir impoundment, likely was the primary factors driving the decrease in the water storage of HN from 2010 to 2015. After 2015, the policies that decreased the water consumed by human activities formulated by the government and humid climate were the main factor for the expansion of HN.

Graphical Abstract

1. Introduction

Lakes in arid and semi-arid regions play an important role in local water circulation and ecological environment protection and therefore have special significance for local human inhabitants, animals, and plants [1,2,3]. As lakes are highly sensitive to changes in the climate and environment [4,5,6,7,8,9], quantifying the changes of the lake area, water level, and water storage is crucial to understanding various ecosystem processes, including the water balance [10,11], carbon cycle [12,13], and surface-groundwater dynamics [14]. In recent years, lake ecological environments have continued to deteriorate under the effects of climate change and human activities; as a result, many lakes have shrunk or even dried up completely in China’s arid and semi-arid regions [11,15,16] In order to prevent further deterioration of lake environments in arid and semi-arid regions, monitoring changes of the lake area, water level, and water storage in these lakes and improving our understanding of the underlying factors driving these changes is urgent.
Hongjian Nur (HN, 109°49′46″E, 39°07′55″N, 1225 m a.s.l.) is the largest desert freshwater lake in China and the world’s largest habitat for relict gull (Larus relictus) [17,18], which is an endangered bird and has been on the Red List of the International Union for Conservation of Nature (IUCN) since 2000. HN has experienced rapid changes in recent years. Hence, it is critical to understand the driving forces for the rapid change of HN to protect the relict gull.
The lack of meteorological and hydrological station data in the HN basin has made it difficult to quantitatively analyze lake dynamics and determine the causes of rapid changes. Fortunately, it is possible to use multi-source satellite observations to directly monitor the dynamics of lakes such as HN with advances in remote sensing technology [19,20,21,22,23,24]. To date, existing remote sensing-based studies of HN have focused primarily on monitoring changes in the lake area [18,25,26,27,28,29]. Few studies have monitored the change of water storage in the HN. However, this information is of great significance for analyzing the causes of the rapid change of HN and better predicting the lake dynamics of HN.
The change of lake water storage can be calculated by area and water level. Satellite radar altimeter can directly provide surface elevation for inland water bodies [30,31,32,33,34,35,36,37,38]. Unfortunately, the HN cannot be adequately monitored by existing radar altimetry due to its relatively low spatial resolution and the complexity of the surrounding terrain.
Two indirect methods, the water boundary overlapped with the topographic data (WBET) method and the level-surface area relationship curve (LRC) method, have been developed to overcome such limitations [39]. The WBET method uses topographic data and satellite images to estimate the water level of lakes [40,41]. In contrast, the LRC method correlated the water surface area obtained by the satellite with the water level data to fit the water level-area curve [19,42].
The overall objective of this study was to quantify the changes in the lake area, water level, and water storage of HN from 1990 to 2017 to evaluate the factors driving the variations in the HN. For this purpose, we developed an improved method based on the floating algae index (FAI) [43] to automatically process Landsat images from 1990 to 2017. The lake water levels at different time periods were estimated using the WBET and LRC methods based on real-time kinematic (RTK) measurements. Additionally, the water storage variation time series was derived from the concurrent lake area and elevation of the water surface from 1990 to 2017. The HN is a closed lake that is fed mainly by surface runoff, lake surface precipitation, and groundwater, and it is consumed mainly by lake surface evaporation and human activities. The components of the HN water balance were calculated, and the factors driving the changes in HN were ultimately identified.
From 1990 to 2017, the HN was relatively stable (1990–1998), rapidly shrank (1999–2015), and expanded (2016–2017). In addition, two reservoirs were built on the main tributaries of HN in 2005 and 2010, respectively. Therefore, in this study, we analyzed the driving factors of rapid change HN in five phases: 1990–1998, 1999–2005, 2006–2010, 2011–2015, and 2016–2017. The remainder of this paper is organized as follows. First, the study area and the data used for analysis are described. Then, the improved water area extraction and water storage estimation approaches are introduced. Finally, the change processes affecting the HN are analyzed, and the driving factors are identified and evaluated.

2. Materials

2.1. Study Area

HN is located at the boundary between the Shaanxi Province (SX) and Inner Mongolia Autonomous Region (IM), China. In the mid-1990s, the lake surface area was 54.5 km 2 (Ma et al. 2014, Shen et al. 2005a) [44,45]. The HN basin is a naturally closed basin with an elevation of 1200–1417 m and a drainage area of 1352 km 2 . Seven seasonal rivers, the Qibosu, Zhashake, Mudushili, Songdao, Erlintu, Haolai, and Maogaitu Rivers, flow into HN. There are no hydrological and meteorological stations in the HN Basin (Yin et al. 2008). There are three towns in the HN Basin (Figure 1). The Zhashake and Maogaitu reservoirs were built on two main tributaries of HN in 2005 and 2010, respectively (Figure 2). The HN basin is surrounded by numerous coal mines and coal-related enterprises currently.

2.2. Materials

To identify the effects of different driving forces on the water balance of HN, five different datasets were collected and used in this study:
(1)
Landsat surface reflectance data for 1990–2017 were used to extract the lake areas. Only cloud-free images from April to November were selected to avoid cloud contamination and to exclude periods when the lake was frozen.
(2)
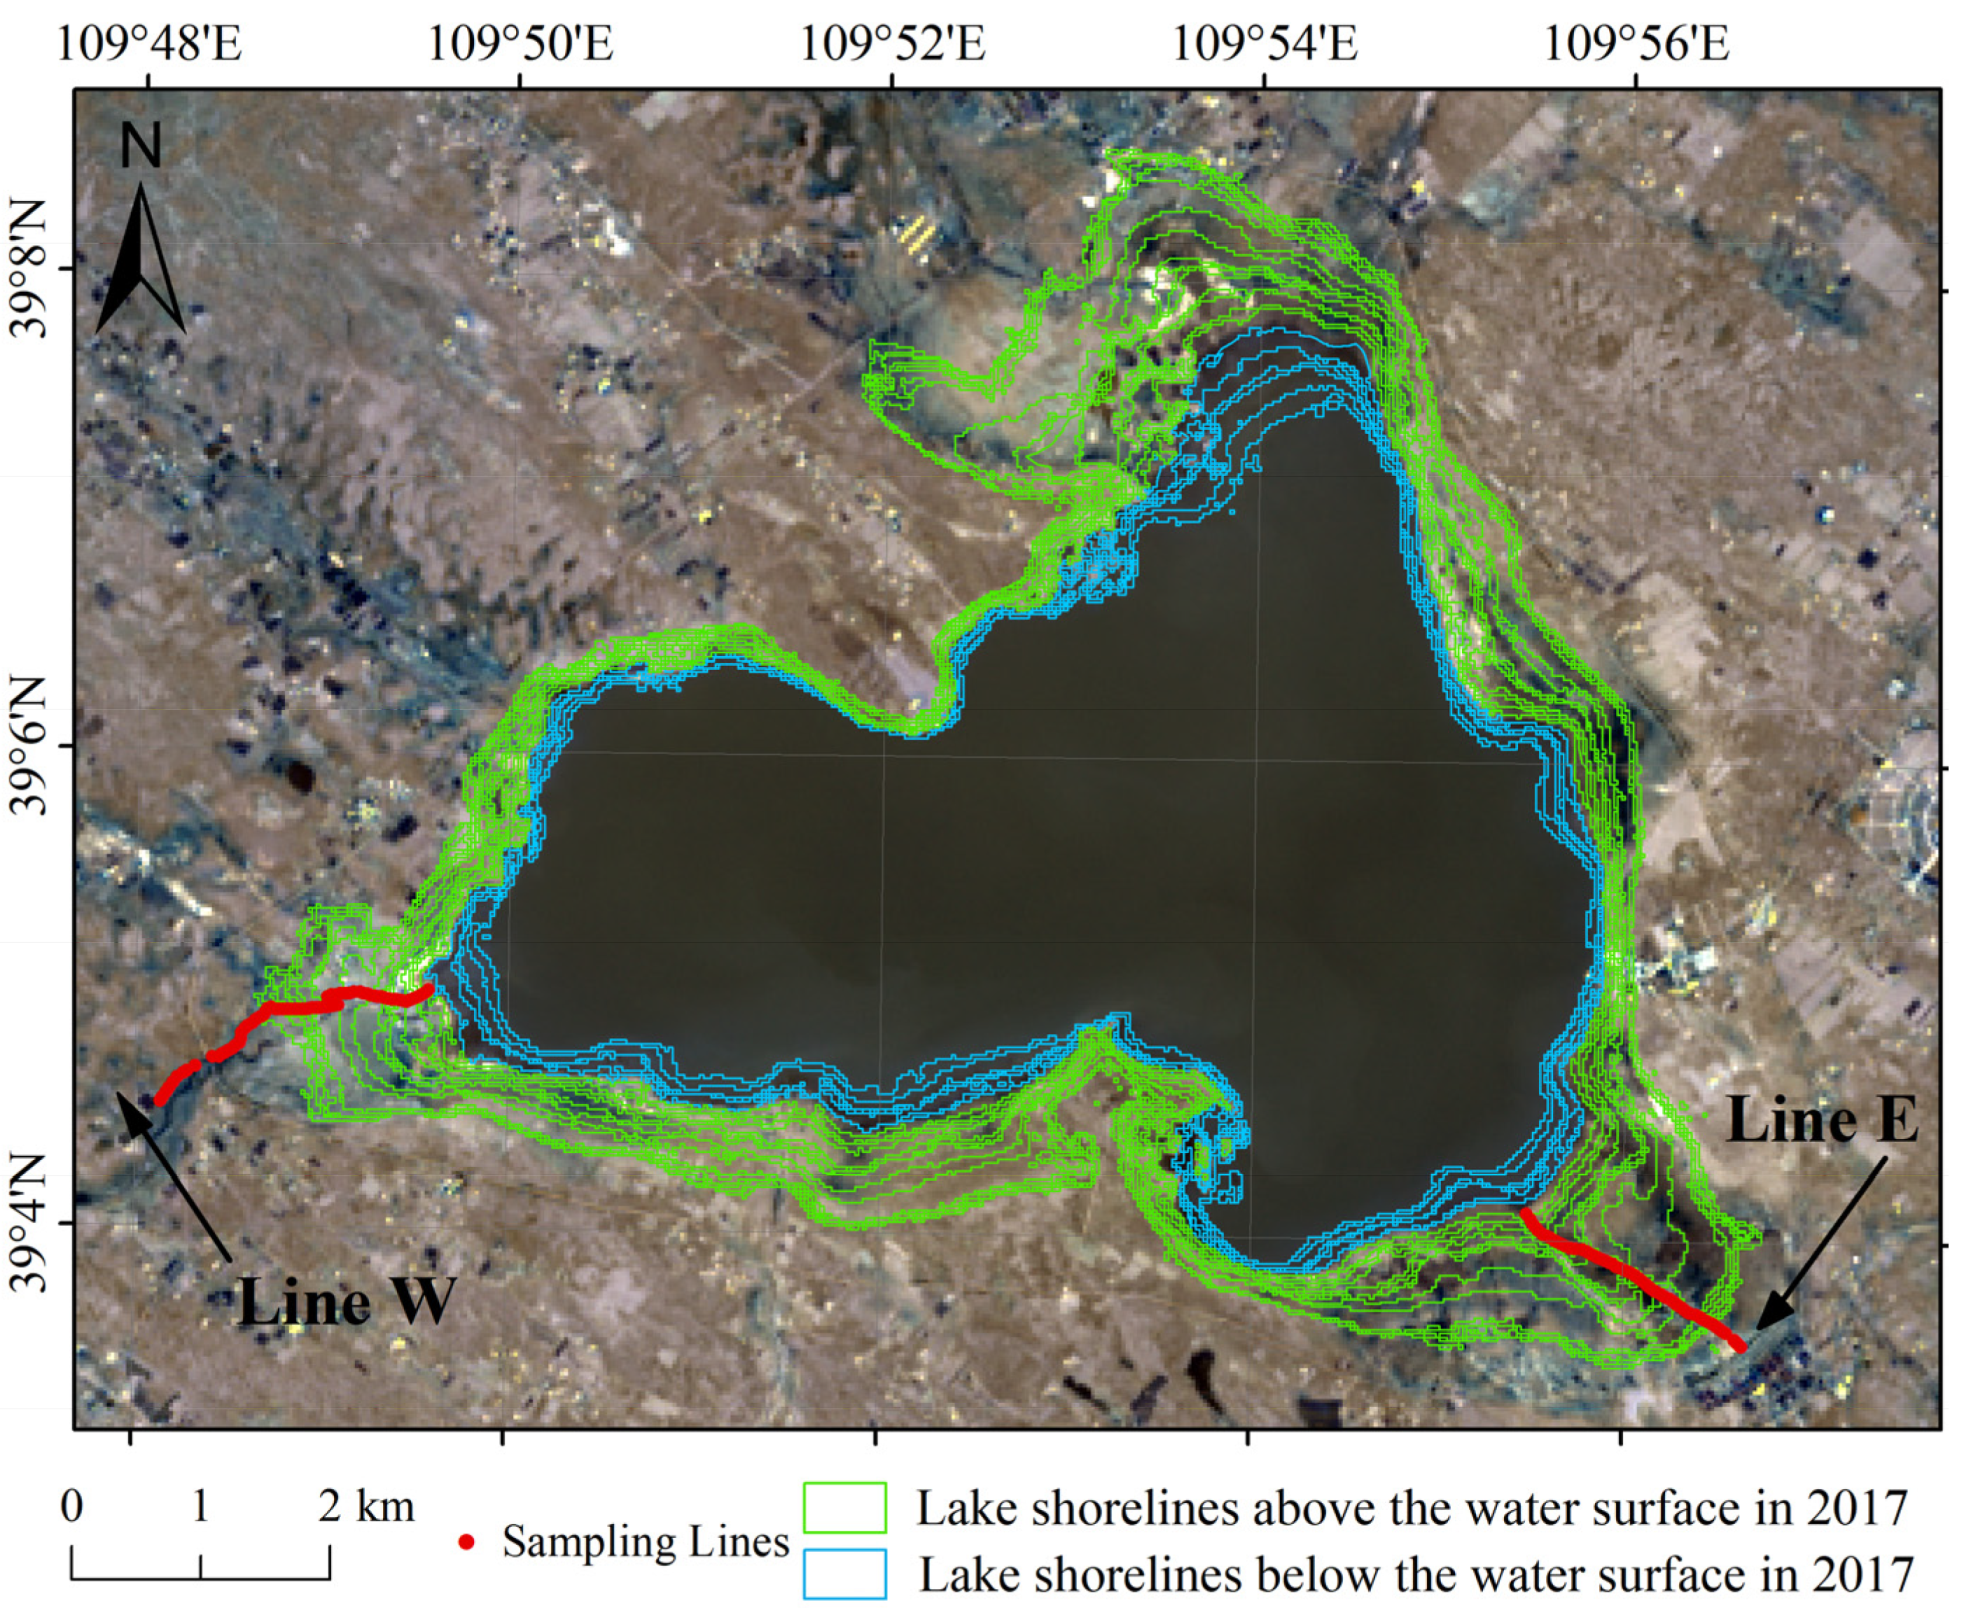
The x, y, and z coordinates in WGS84 of two routes around HN were measured with RTK positioning in November 2017 to retrieve the height of the lake surface in different historic periods (Figure 3).
(3)
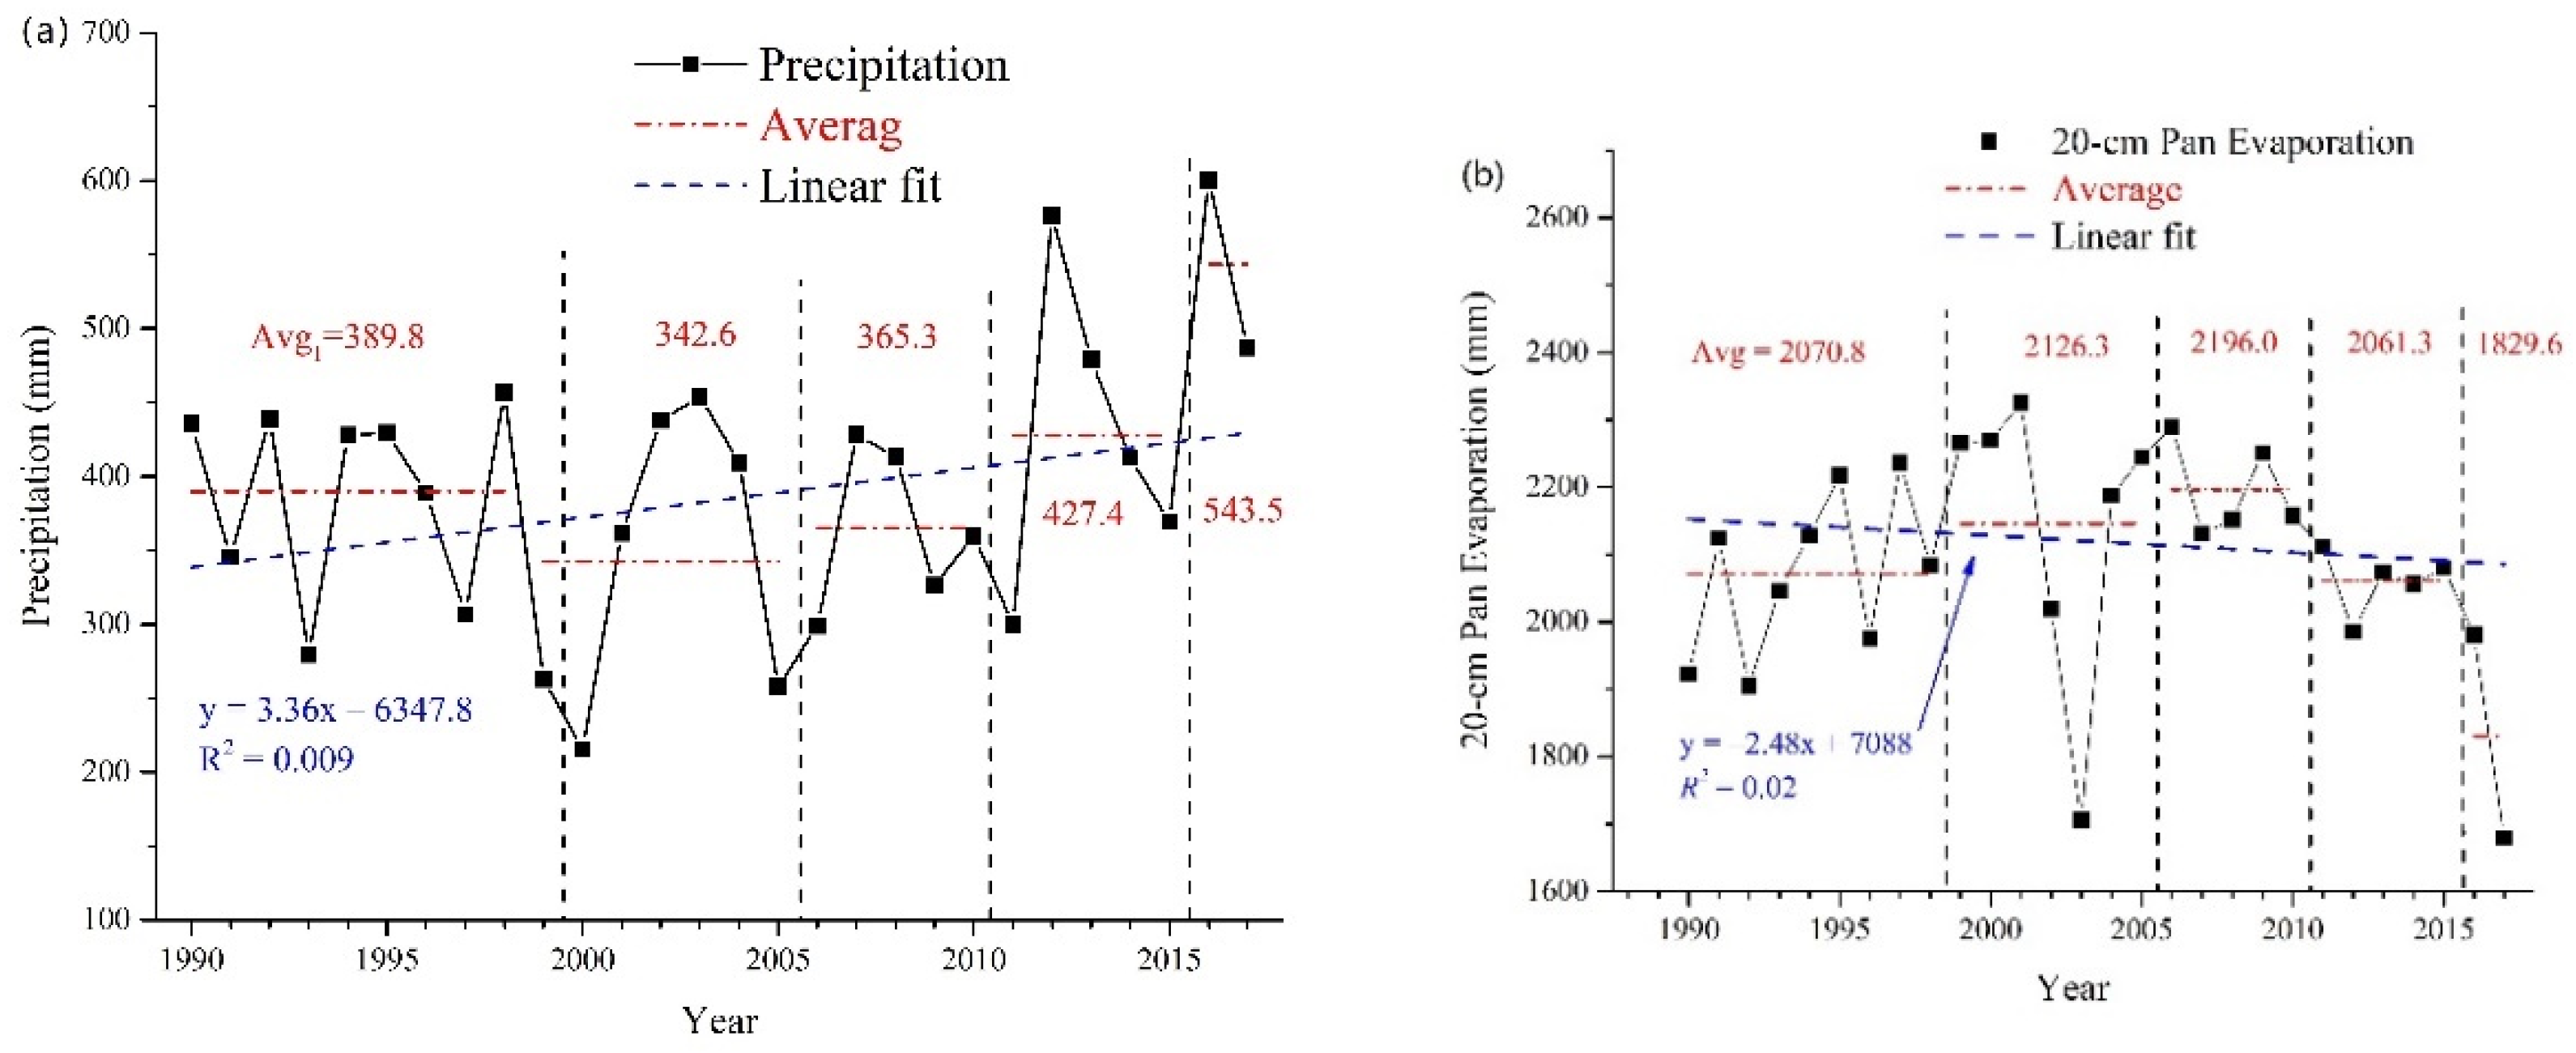
Pan evaporation and precipitation of two nearest meteorological stations (Yulin and Dongsheng) away from the HN basin for 1990–2017 were downloaded from the Greenhouse Data website (http://data.sheshiyuanyi.com/WeatherData/, 15 August 2020). In this study, the mean values of the evaporation and precipitation data of these two meteorological stations are used as the evaporation and precipitation data of the HN Basin.
(4)
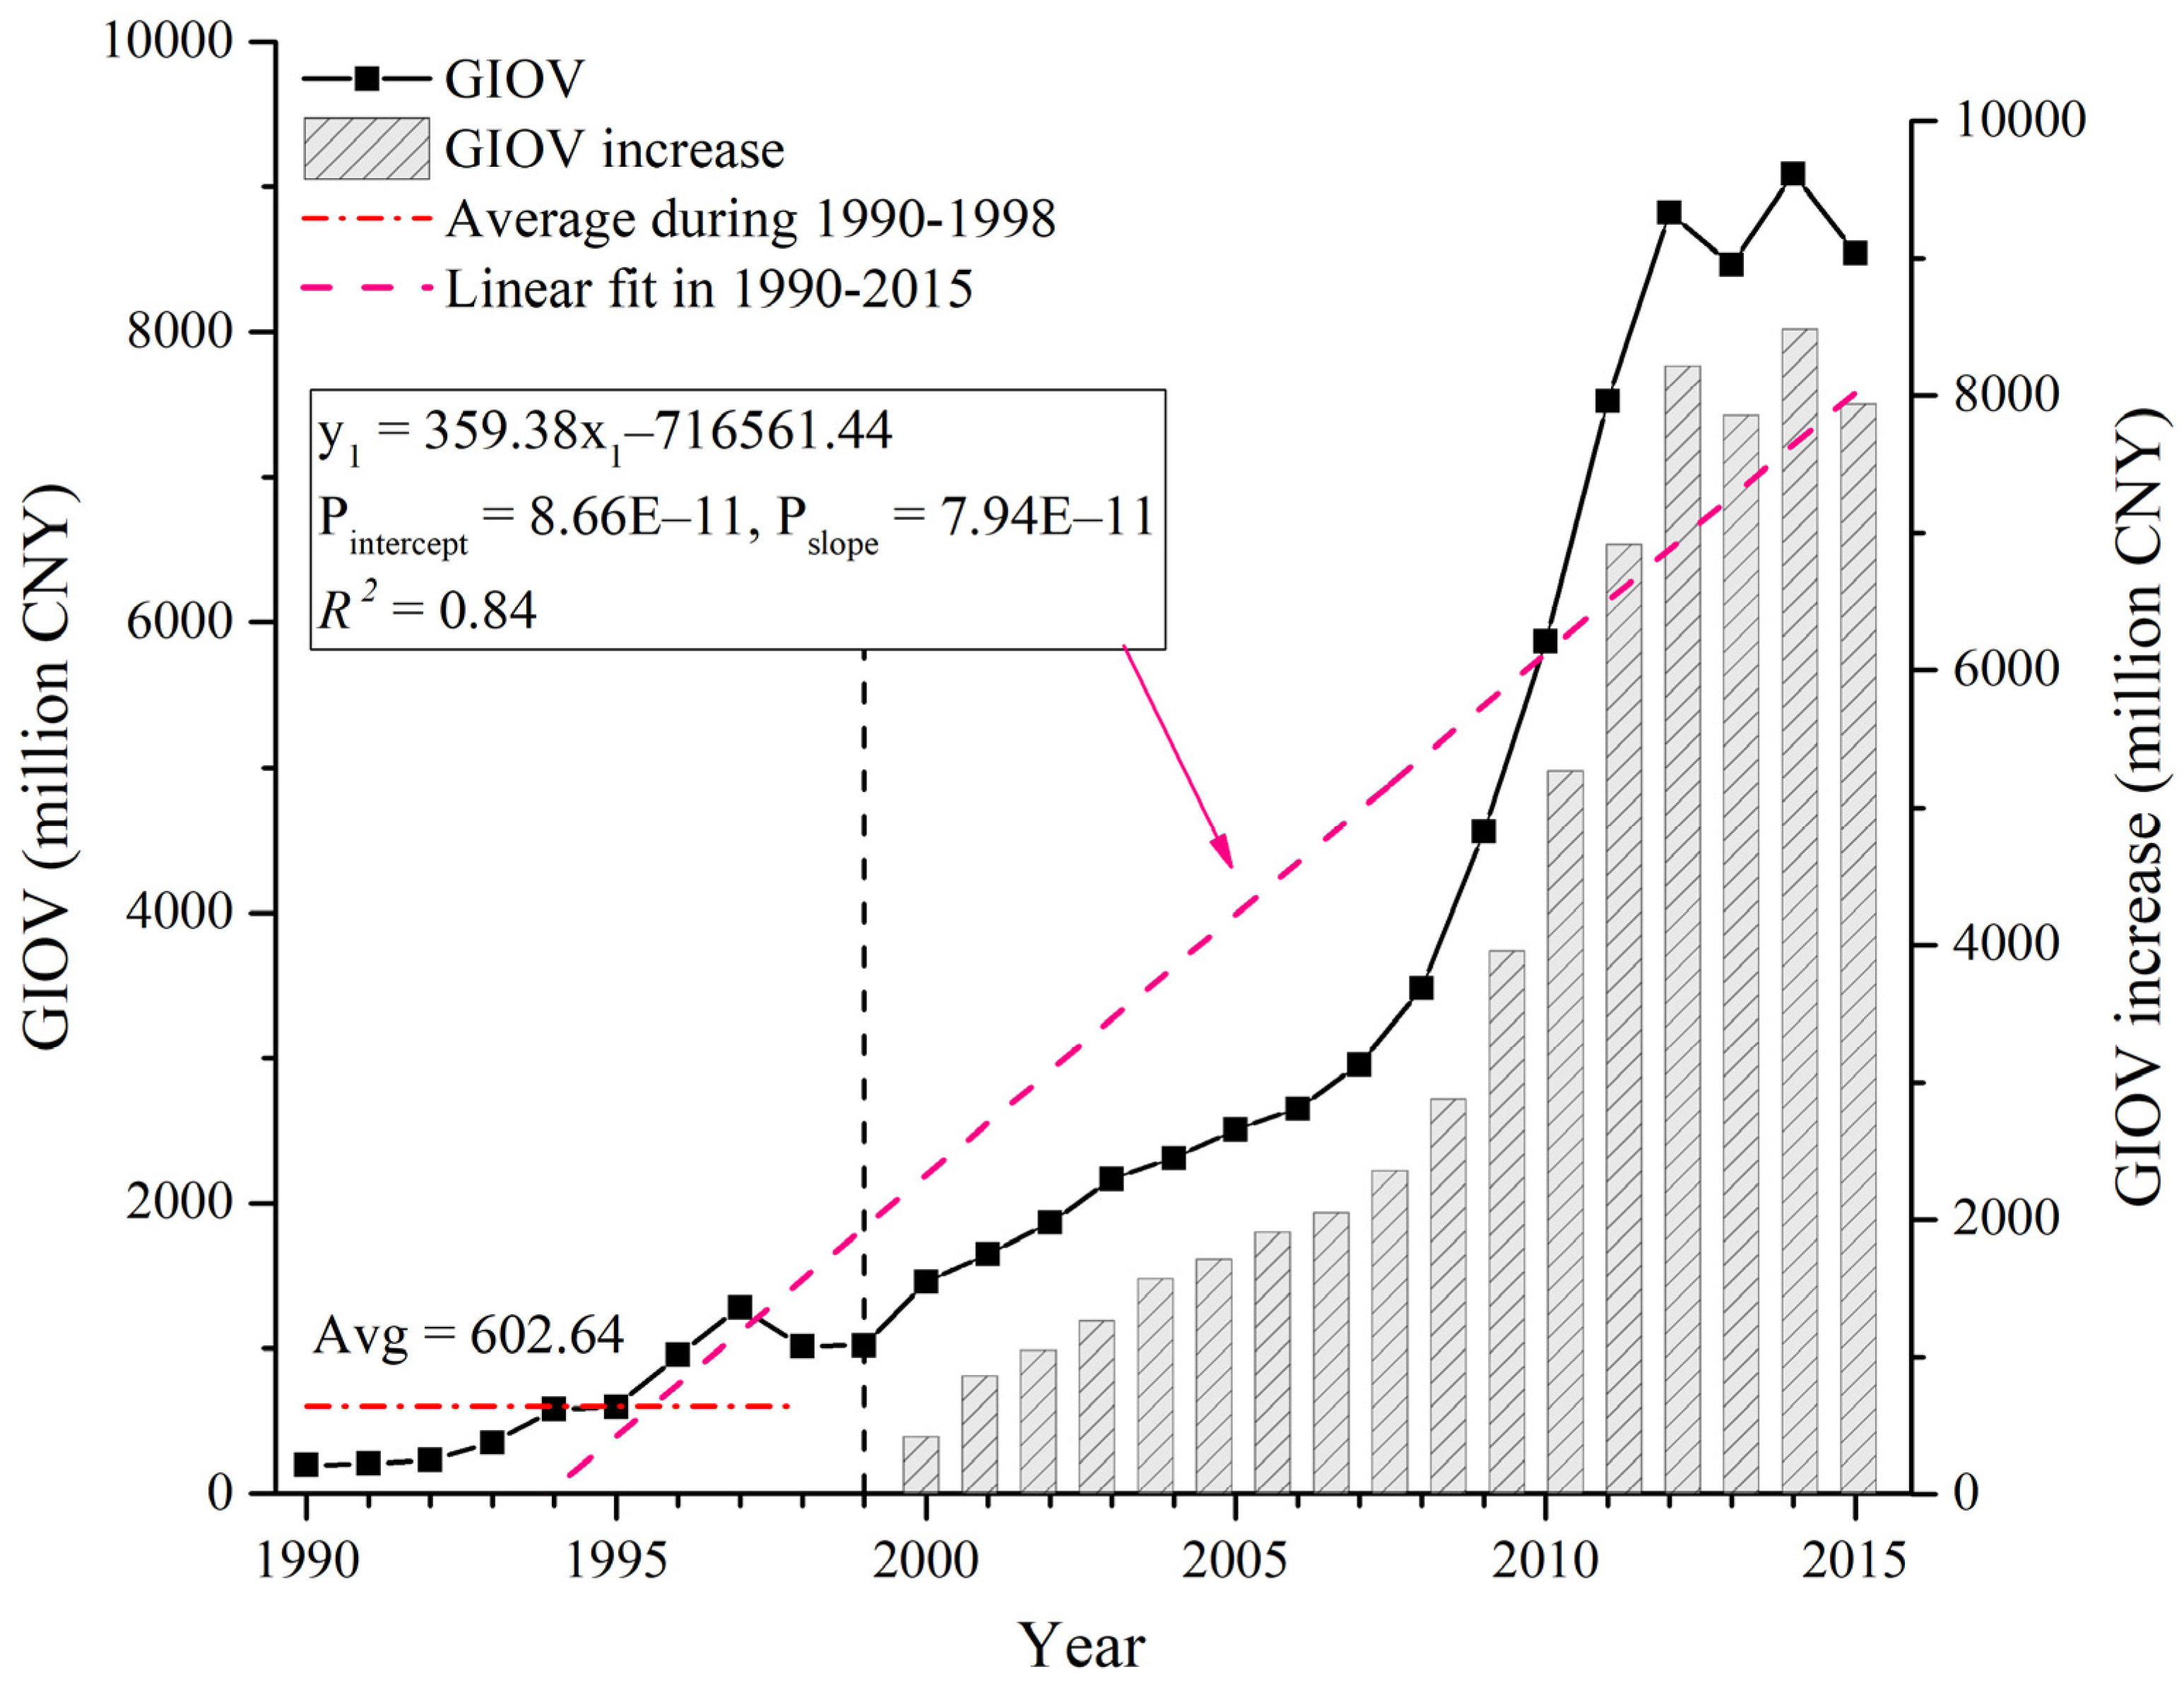
The data of gross industrial output value and population came from China Statistical Yearbook (volume of towns and villages). The data for agriculture and livestock before 2015 are derived from the literature [18].

3. Methodology

3.1. Water Area Extraction

The FAI (Hu 2009), which was used to extract the water area, is defined as:
FAI = (RNIRRRed) + (RRedRSWIR) × (λNIRλRed)/(λSWIRλRed),
where R is the reflectance and λ denotes the wavelength for the red, near-infrared (NIR), and shortwave infrared (SWIR) bands of Landsat 5, 7, and 8 images. The FAI was calculated for each image for the HN region, and the widely used threshold segmentation method was adopted to delineate the water–land boundary of HN [46,47,48].
To address any potential misclassification caused by the presence of mixed pixels along land–water boundaries [49] and any possible geometric registration errors, a logical checking procedure was introduced to refine the water area extraction results according to the following criterion: a pixel should be classified as water at a higher water level if it was classified as water at a lower water level; for example, if a pixel is submerged at a water level of 50 m, it will also be submerged at 70 m, and vice versa [50]. To eliminate the noise caused by water waves, boats, and other high-reflectivity objects, a morphological reconstruction method was further applied to smooth the results within the inundation area [51]. The interannual variation of water area was estimated using the average lake area every year.

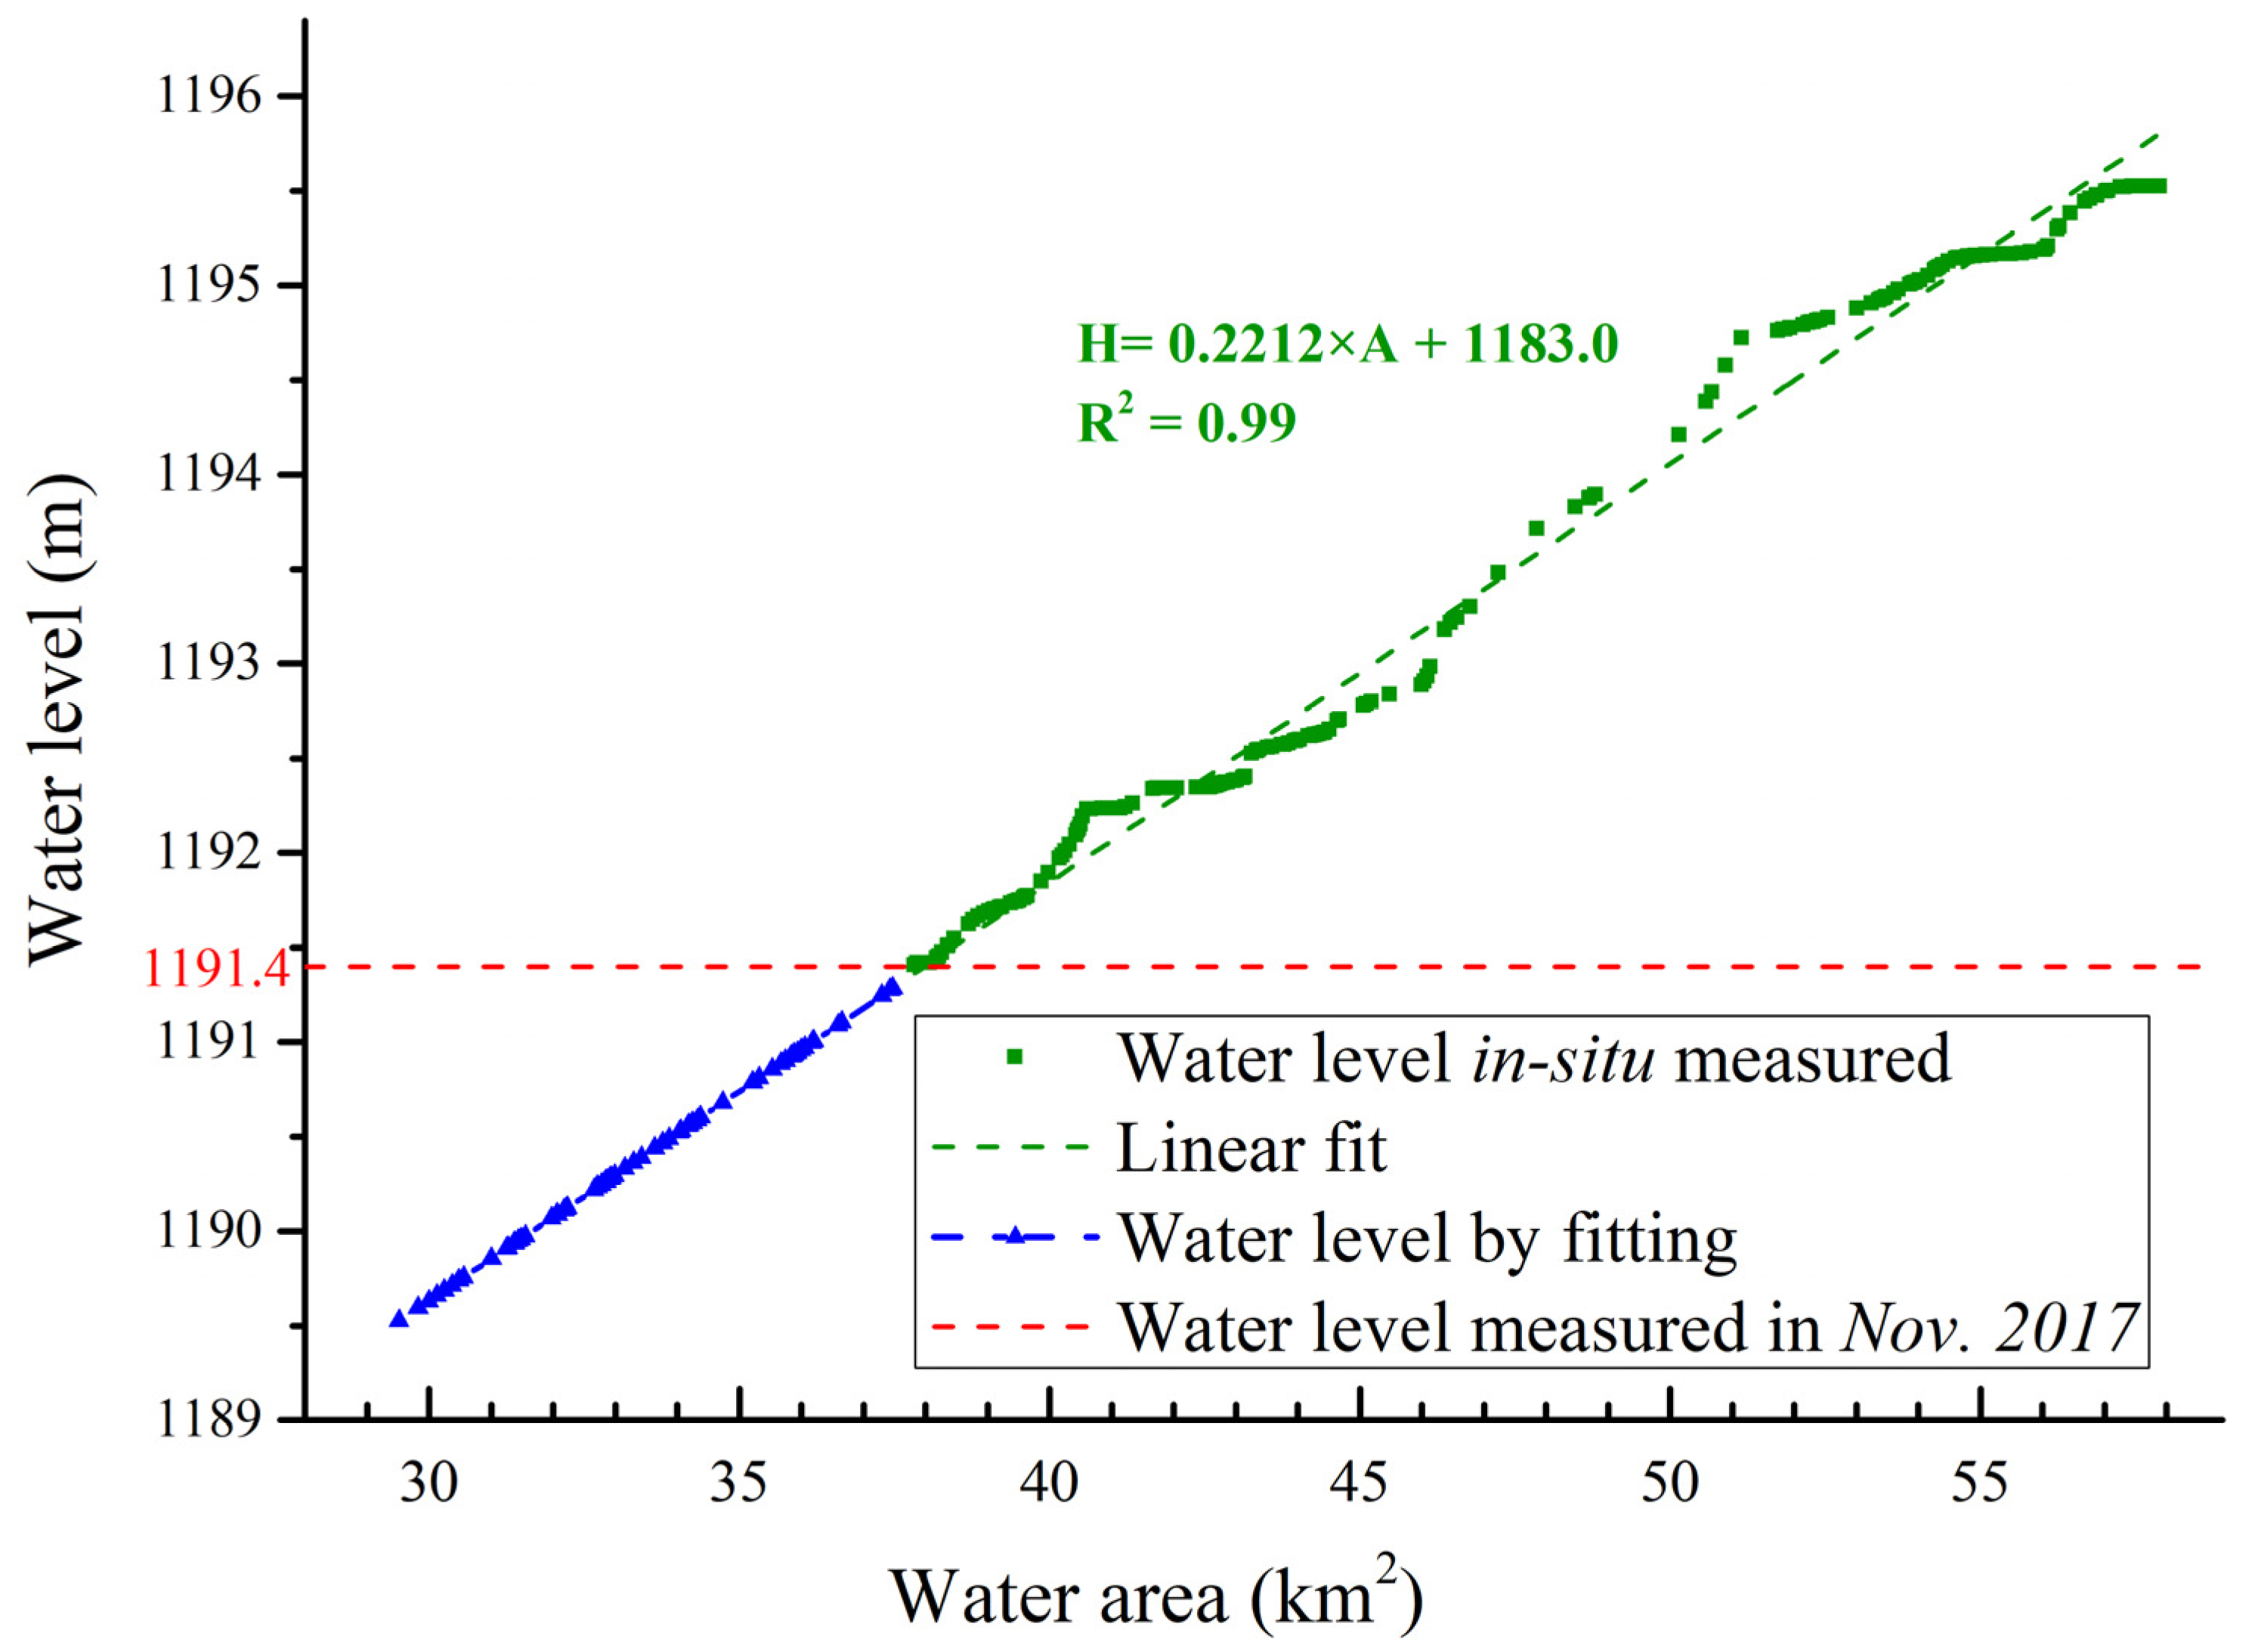
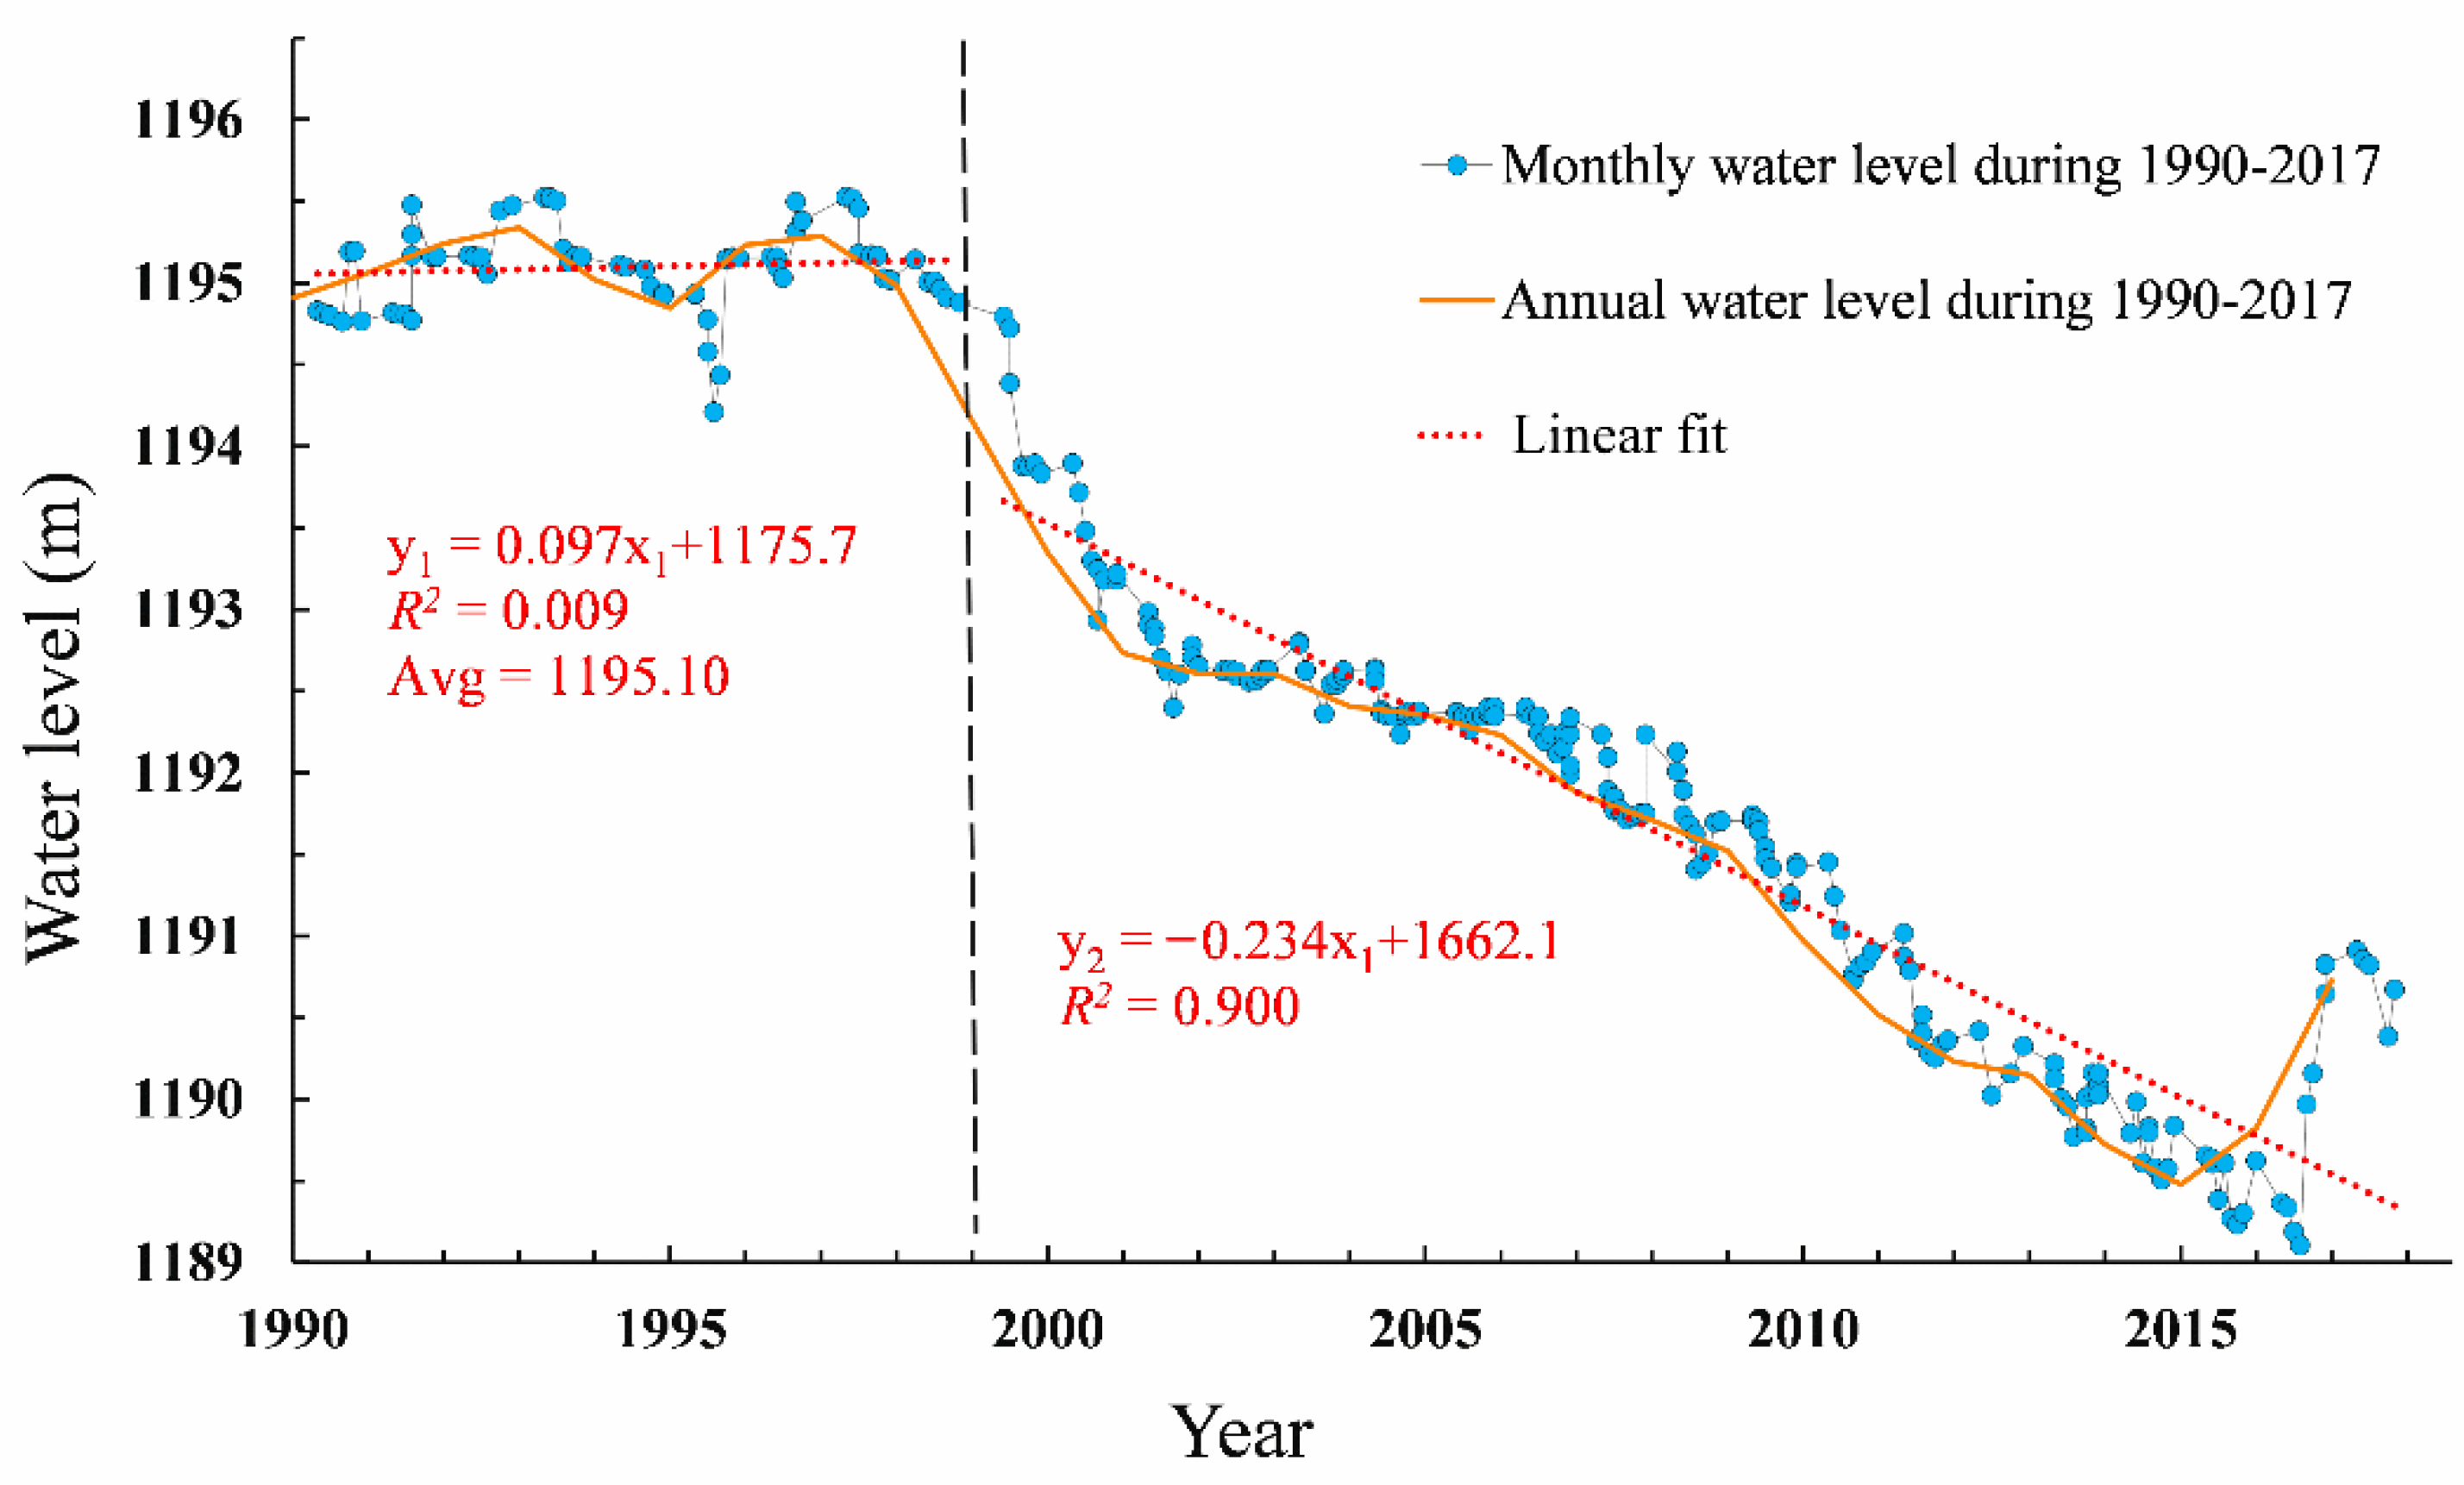
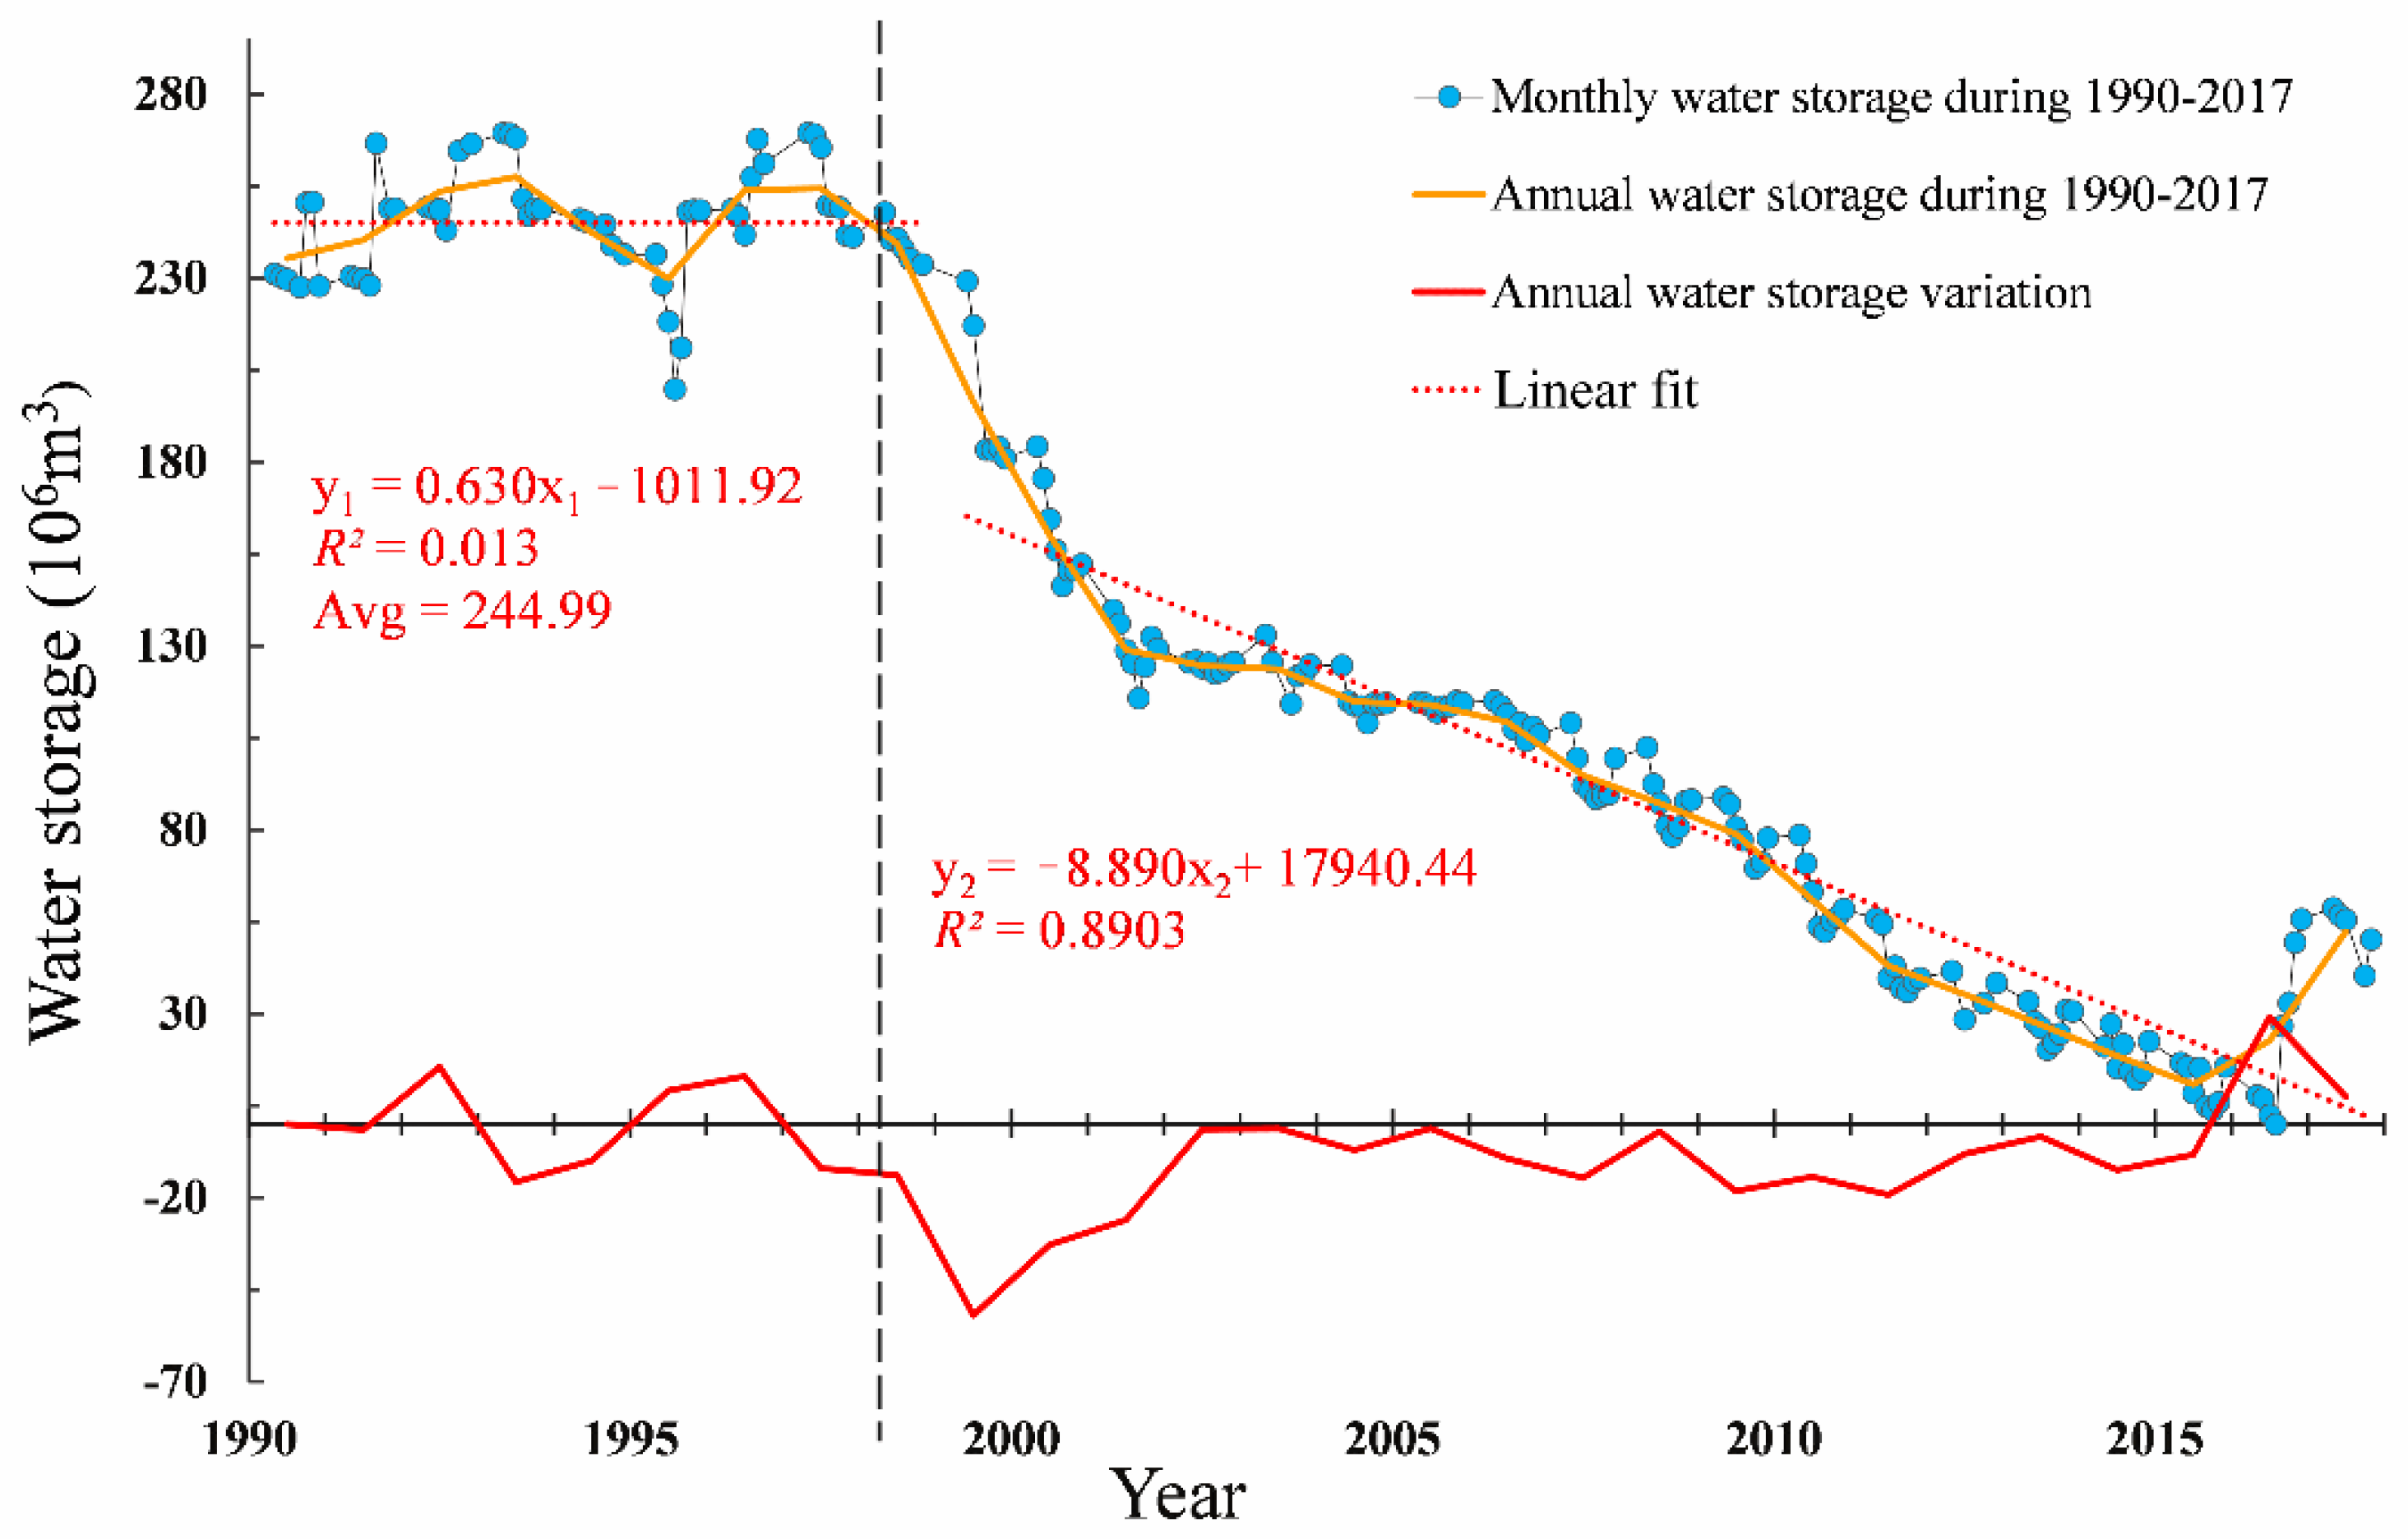
3.2. Water Level and Storage

The water boundary of HN at different times was superimposed on the RTK data. The mean of two measurements of the height difference between two points of one water boundary (Figure 3) in the two routes of RTK measurements for which the difference was small (<10 cm) was used to approximate the water level of HN. A shape-preserving piecewise cubic interpolation function which was employed to interpolate the lake water levels was constructed. In addition, linear extrapolation was applied to estimate the water areas above the minimum inundation level but were submerged in November 2017 when the ground survey was carried out:
H = 0.2212 × A + 1183.0   ( R 2 = 0.9893 )
where H is the lake water level (m) relative to the reference ellipsoid (Figure 4) and A is the water area ( km 2 ).
Using the water area time series extracted with Landsat data and the corresponding water levels derived from either interpolation or extrapolation, the hypsometric relationship curve between the water level and water area was built (Figure 4). The isobath heights of inundation areas less than the area in November 2017 were derived by the curve. Then, all the isobath heights were used to obtain the lake bathmetric map, and the concurrent water storage results were calculated.

3.3. Water Balance

The HN basin is an endorheic basin, in which the water budget of major components can be represented by the equation below:
d V = P w + R + G H a E w
where dV is the change in the water storage of HN. The water supply of HN is mainly through surface runoff R, precipitation on lake surface P w , and groundwater exchange G. The water of HN is consumed mainly by lake surface evaporation Ew and human activities H a . The annual surface runoff R throughout HN can be estimated using the following equation (Liu et al. 2009):
R = P × A H N × K × 10 3
where P is the annual precipitation in the HN basin ( mm ), A H N denotes the area of the HN basin, K is the runoff coefficient, and the long-time average annual value of K is 0.11 in an area 20 km away from the study area [52].
The precipitation on the lake surface ( P w ) and the evaporation of the lake surface ( E w ) were calculated based on meteorological data:
P w = P × A a v g × 10 3
E w = E × I × A a v g × 10 3
where A a v g is the annual average area of HN ( km 3 ), E is the evaporation of a 20 cm pan ( mm ), and I is a conversion coefficient between the small evaporation pan and the evaporation of the lake surface, which is considered to be 0.43 in this study area (Yuan 2006).
The water consumed by human activities ( H a ) mainly includes residential water consumption, livestock water demand, agricultural irrigation water, hydraulic engineering construction, and water consumption for industry.
The domestic water and livestock water consumptions in the three towns within the HN basin were calculated by the population, the sheep population, the domestic water consumption quota, and the livestock water consumption quota (Wang et al. 2011). The water consumption quotas for residents (with the development of the economy, the quota of water used by residents has also increased. Before 2010, it was 39 L / p · d 1 . Since 2010, it has averaged 45 L / p · d 1 ) and livestock were taken from Chen et al. [53]. We could not estimate the amount of water used for irrigation and industry because the detailed data on irrigated land and industry were unavailable.
The effect ( d V r ) of the Zhashake and Maogaitu Reservoirs, which were built on two main tributaries of HN, can be estimated by the following formula:
d V r = S r + E w
where S r is the annual average water storage of reservoirs and E w is the evaporation of the reservoir surface.
The amount of water needed to keep the lake area stable can be estimated according to Equation (3) when d V = 0 . The water consumed by human activities ( H a ) can be approximately estimated using Equation (8):
H a = P w + R + G E w d V .

3.4. Statistical Methods

In this study, linear regression analysis and Pearson correlation analysis were used to research the trends in the time-series data and the relationships between lake storage and the driving forces for the changes in lake storage. Linear regression can analyze trends and variation rate of hydrological and meteorological variables in different stages [54].

4. Results

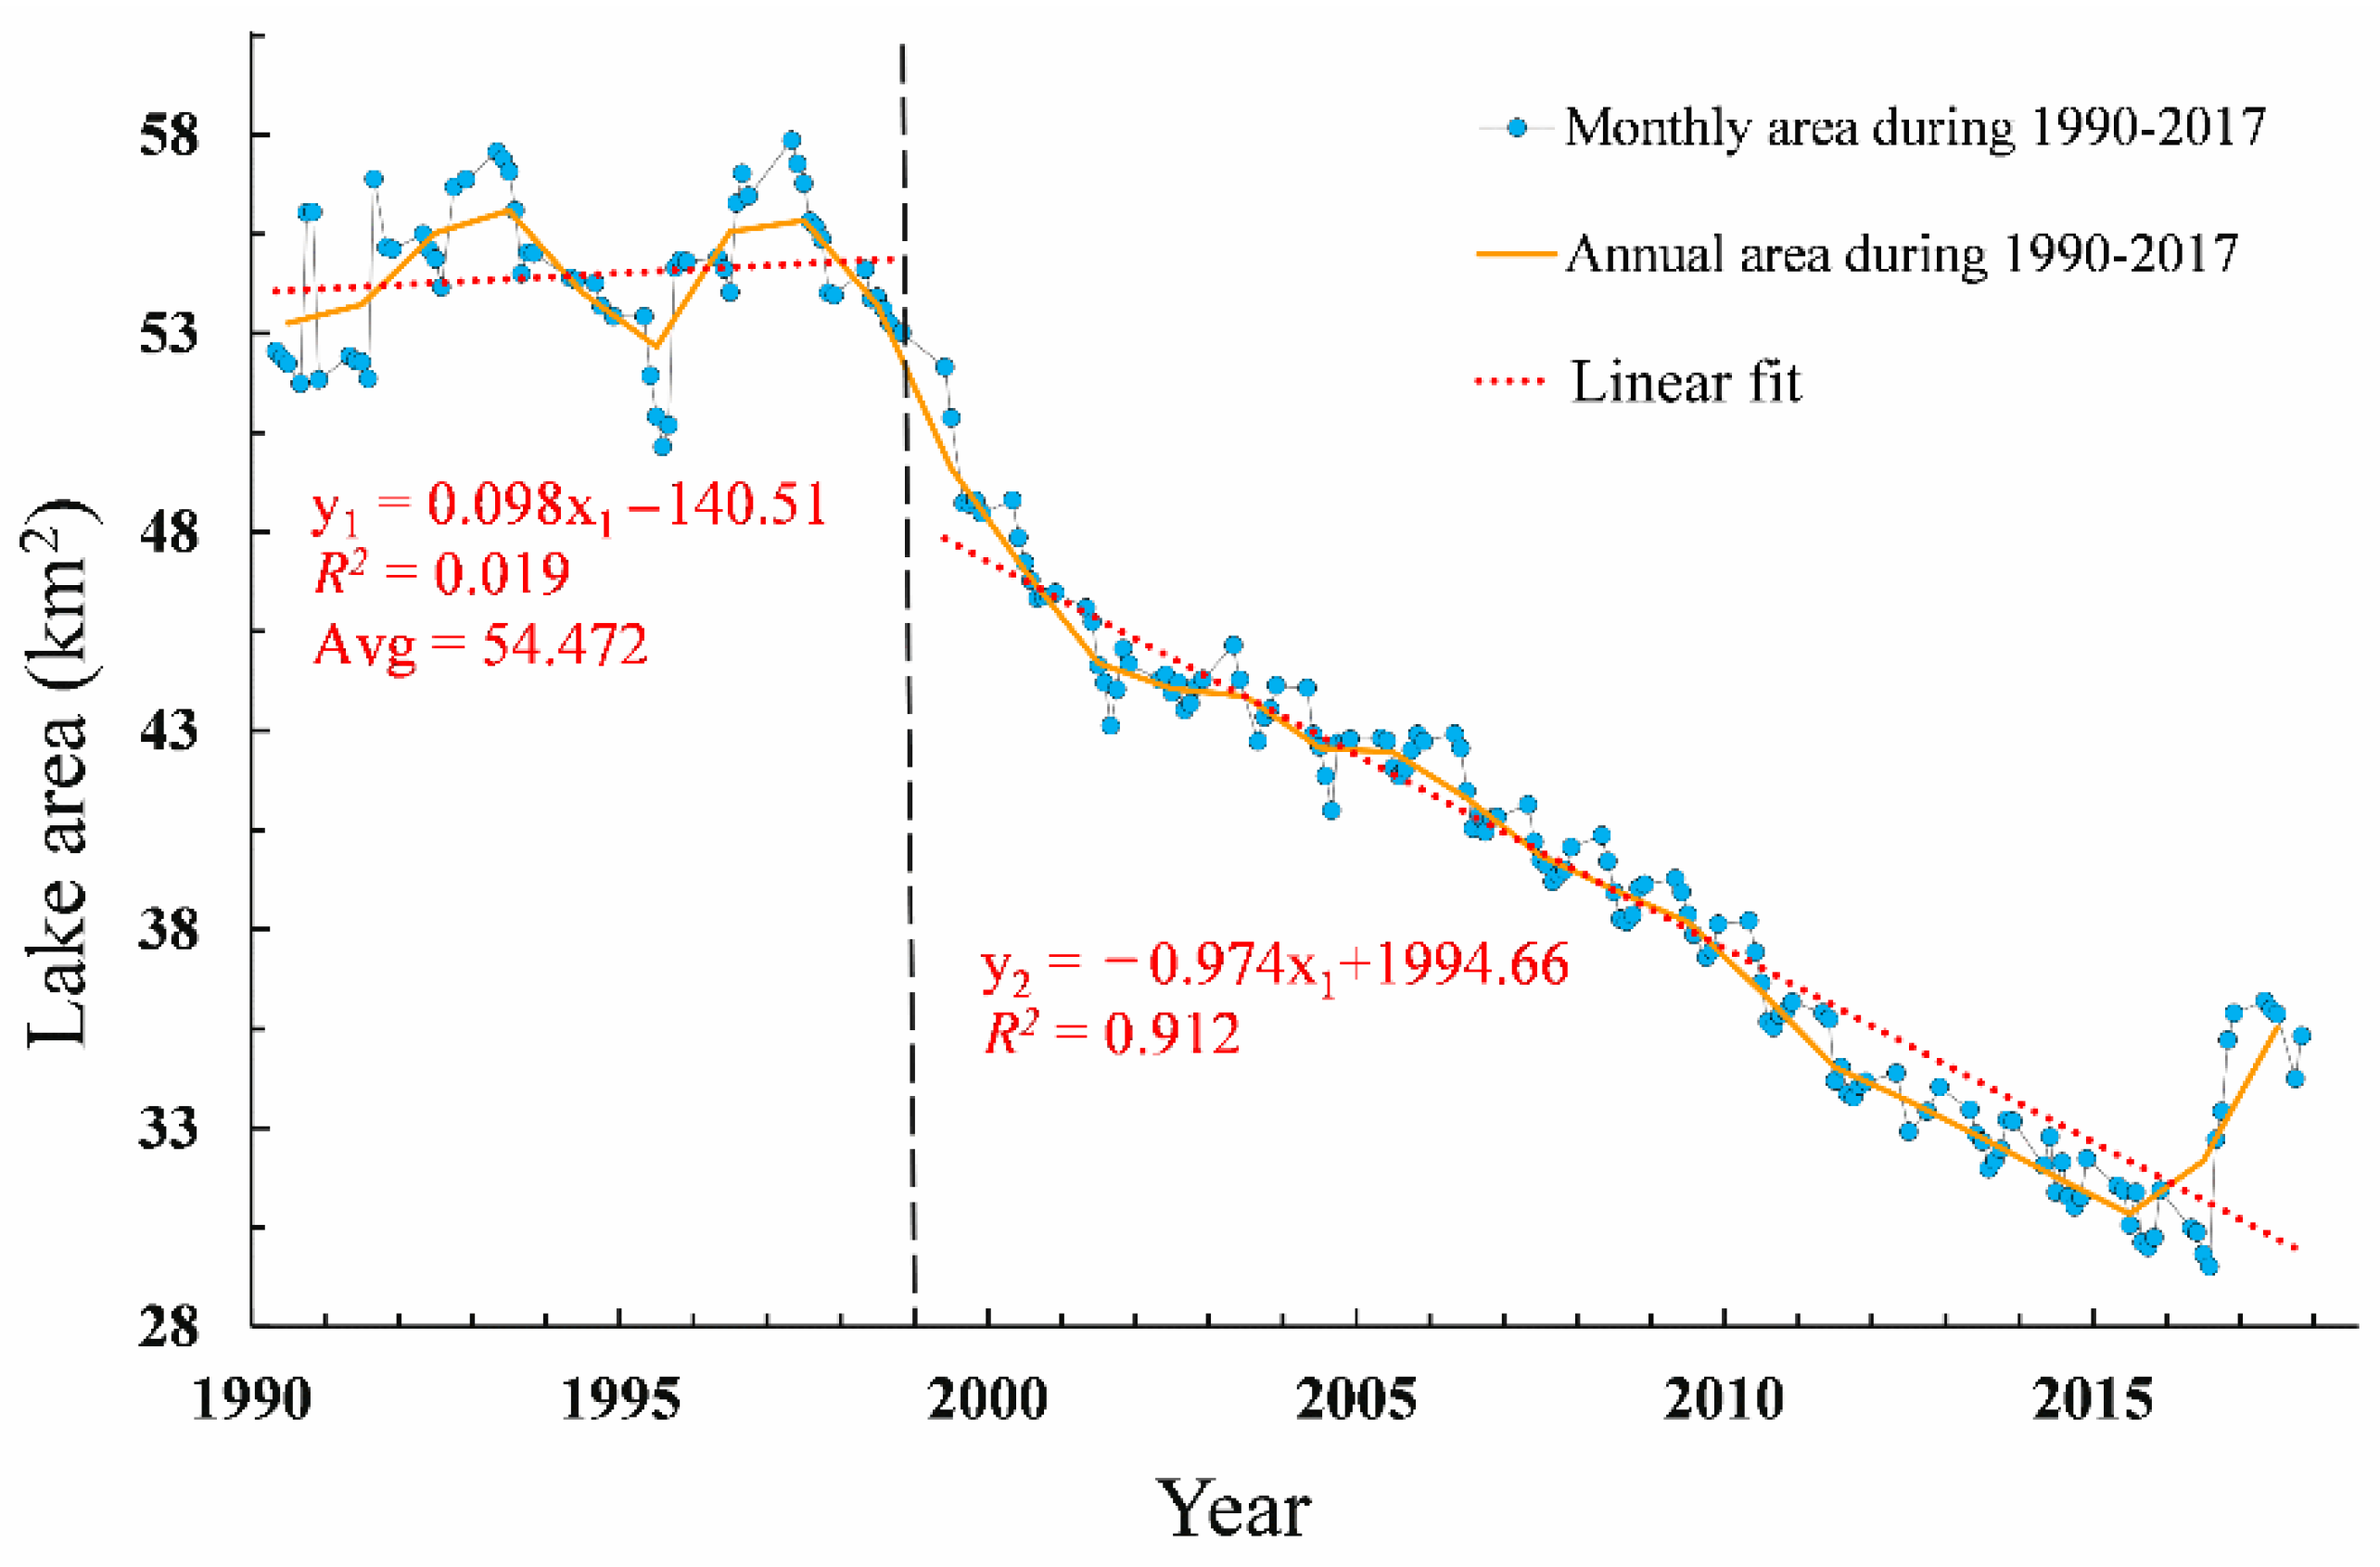
4.1. Changes in Water Area, Level and Storage

Figure 5 shows the changes in the spatial extent of HN during 1990–2017. The northwestern, southwestern, and southeastern parts of HN showed the greatest shrinkage toward the center of the lake with distances of 2.7, 1.8, and 2.0 km , respectively. The mean of the recession distance to the center was 0.95 ± 0.58 km.
The monthly and annual changes in the HN water area (April–November over 1990–2017) are shown in Figure 6. The water area from 1990 to 1998 ranged between 50.1 (July 1995) and 57.9 km 2 (April 1997) with an average value of 54.5 ± 1.1 km 2 . The inundation of HN showed a significant decreasing trend with a decreasing rate of 1.19 km 2   y 1 (p < 0.001) during 1999–2015. The inundation of HN in 2016 represented only 56% of that in 1998. Substantial expansion was also observed between 2016 and 2017, during which the inundation of HN increased from 30 to 34 km2.
The monthly and annual changes in the HN water level and water storage during 1990–2017 are shown in Figure 7 and Figure 8. The maximum and minimum HN water level and storage were reached in April 1997 and July 2016, respectively, with the difference of 6.4 m and 2.7 ×   10 8   m 3 . In contrast to the relatively stable conditions before 1999, the water level and storage of HN showed a significant decreasing trend in the later period of 1999–2016 with a decreasing rate of 0.3 m   y 1 (p < 0.001) and 0.15 ×   10 8   m 3   y 1 (p < 0.001). This situation has been reversed since July 2016. The water level and storage of HN increased by 1.6 m and 0.36 ×   10 8   m 3 from July 2016 to October 2017, respectively.

4.2. The HN Water Balance

The HN water balance was estimated based on surface runoff ( R ), precipitation on the lake surface ( P w ), groundwater exchange ( G ), evaporation of the lake surface ( E w ), the water consumed by human activities ( H a ), and the change in the water storage of HN (dV).
The water supply of HN is mainly through surface runoff, precipitation on lake surface, and groundwater exchange. As shown in Table 1, the annual average of surface runoff in the HN basin was 56.2 × 10 6   m 3   y 1 during 1990–1998. Due to the decrease in precipitation, the annual average of surface runoff decreased by 6.4 × 10 6   m 3   y 1 and 2.9 × 10 6   m 3   y 1 during 1999–2005 and 2006–2010 compared with this from 1990 to 1998 respectively. The annual average of surface runoff during 2010–2015 and 2016–2017 reached 62.7 × 10 6   m 3   y 1 and 79.8 × 10 6   m 3   y 1 with the increase of precipitation, respectively, which exceeded those during 1990–1998. The precipitation on the lake surface ( P w ) is affected by the area of HN and precipitation.
The annual average of precipitation on the lake surface was 21.2 × 10 6   m 3   y 1 from 1990 to 1998. Due to the shrinking of HN and the change of precipitation, the annual average lake surface precipitation in the five phases was 5.8 × 10 6   m 3   y 1 , 6.9 × 10 6   m 3   y 1 , 7.1 × 10 6   m 3   y 1 , and 2.9 × 10 6   m 3   y 1 less than that during 1990–1998, respectively (Figure 9). The groundwater exchange was relatively stable, about 6.67 × 10 6   m 3   y 1 [55], due to the HN is located in the lowest part of the HN basin.
Since HN is an inner-flowing lake, its water is mainly consumed by human activities and lake evaporation. The annual average of water consumed by human activities ( H a ) was 37.1 × 10 6   m 3   y 1 from 1990 to 1998. The H a continued to increase after 1998 and reached a peak of 64.3 × 10 6   m 3   y 1 during 2010–2015. In 2016–2017, the H a dropped to 59.8 × 10 6   m 3   y 1 . The annual average of evaporation of the lake surface ( E w ) was 48.5 × 10 6   m 3   y 1 , 41.8 × 10 6   m 3   y 1 , 37.2 × 10 6   m 3   y 1 , 29.2 × 10 6   m 3   y 1 , and 26.5 × 10 6   m 3   y 1 in five phases, respectively, which has the same trend with the lake area (Figure 9).
The change in the water storage of HN (dV) was caused by the difference of water supply and loss. During 1990–1998, the HN was in a relatively stable state, the annual average change in the water storage only was 1.53 × 10 6   m 3   y 1 . The dV was 17.13 × 10 6   m 3   y 1 , 11.63 × 10 6   m 3   y 1 , 10.03 × 10 6   m 3   y 1 , and 18.47 × 10 6   m 3   y 1 in the four phases that followed, respectively.

5. Discussion

5.1. Driving Factors

5.1.1. Phase I

During this period, there was no significant change in water area, level, and storage (p > 0.05). The annual average precipitation was 389.8 mm (Figure 10a). The annual average 20 cm pan evaporation 2070.8 mm (Figure 10b). The annual average of the lake water supply was about 83.9 ×   10 6   m 3   y 1 . The annual average of water needed to keep the HN stable was only 46.8 ×   10 6   m 3   y 1 . The difference between them was 37.1 ×   10 6   m 3   y 1 , which was probably consumed by human activities.
In this stage, the correlation coefficient (Table 2) between the lake water volume and the three human factors were very small, indicating that human activities had little influence on the lake water storage change.
The gross industrial output value of three towns in the HN basin increased about fivefold (Figure 11), but the total was small. The annual average of residential water and livestock water consumption was about 1.6 ×   10 6   m 3   y 1 . According to other studies in the area [55,56], agricultural irrigation consumed about 30 ×   10 6   m 3   y 1 water in this phase. The H a remained relatively constant.

5.1.2. Phase II

The annual average precipitation decreased by 47.2 mm, and the annual average 20 cm pan evaporation increased by 55.7 mm compared with those in phase I. At the same time, human activity had intensified. The H a increased about 10 ×   10 6   m 3   y 1 compared to those from 1990 to 1998. Among all human activity, the gross industrial output value in the HN basin increased from 1018.3 ×   10 6   C N Y to 2507.9 ×   10 6   C N Y during this period (Figure 11). The annual average of residential water and livestock water consumption increased 0.3 ×   10 6   m 3   y 1 (Figure 12). In addition, although we do not have data on farmland, a reasonable assumption is that the drought led to an increase in water consumption of irrigation. According to the above analysis, the drought climate and the rapid development of industry led to the HN shrinking rapidly in this phase.

5.1.3. Phase III

The climate was persistently dry. The annual average precipitation decreased by 24 mm, and the annual average 20 cm pan evaporation increased by 125 mm compared with those from 1990 to 1998. The gross industrial output value increased from 2651.4 ×   10 6   C N Y to 5868.7 ×   10 6   C N Y , with an increase of 121.3% (Figure 11). Meanwhile, the annual average of residential water and livestock water consumption increased to 2.7 ×   10 6   m 3   y 1 (Figure 12). In addition, the Zhashake reservoirs were built on the Zhashake River in 2005. The annual average water storage of the Zhashake Reservoir was 4.5 ×   10 6   m 3 , and the evaporation of the lake surface was 3.0 × 10 6   m 2 y 1 . However, the H a was about 48.8 ×   10 6   m 3   y 1 which was almost the same as that during 1999–2005. The reason that H a had not increased significantly was that the area of cultivated land has been reduced by 55 km 2 [18] due to the implementation of policy aimed at converting farmland back into forests and grasslands in the HN basin [56]. The irrigation water use should decrease due to this policy, too. The HN continued to shrink in this phase. In addition to the continuous drought, human activities are the main reason for the shrinkage of the HN. The way of human activities had changed: the water consumption of industrial and reservoir impoundment had increased significantly, while the water consumption of agricultural irrigation had decreased.

5.1.4. Phase IV

Rainfall was abundant during this period. The annual average precipitation increased by approximately 38 mm (Figure 10a) and the annual average 20 cm pan evaporation decreased by 9 mm (Figure 10b) compared with those in the first phase. The average annual water supply of the lake is almost equal to those from 1990 to 1998 (Table 1). Nevertheless, the HN continued to shrink. The H a was about 64.3 ×   10 6   m 3   y 1 , which was almost 1.7 times as much as those during 1990–1998.
The domestic water consumption increased by 0.237 ×   10 6   m 3   y 1 with the increase in population (Figure 12a). The livestock water consumption increased by 1.927 ×   10 6   m 3   y 1 from 1990 to 1998. (Figure 12b). The Maogaitu Reservoir was impounded in 2010, and thus, no data indicating its water storage are available. Here, its water storage was estimated as 0.8 ×   10 6   m 3 because its water area was one-sixth of that of the Zhashake Reservoir, and the evaporation on the water surface was 0.5 × 10 6   m 2 y 1 . The annual average water storages and evaporation of these two reservoirs were about 8.8 ×   10 6   m 3 .
The annual average gross industrial output value in the HN basin increased to 8488 ×   10 6   C N Y , which was 13 times that during 1990–1998 (Figure 11) with an annual increase rate of 13.33% (p < 0.001) after 2000.
Although there are no large-scale coal mining activities in the HN basin, the impact of coal mining cannot be ignored. The nearest coal mine is only 10 km away from the HN basin. The large-scale coal mining around the HN basin is likely to have had significant impacts on the groundwater flow within the basin [57,58,59,60].

5.1.5. Phase V

The area of HN began to expand. The largest annual precipitation since 1990 occurred in 2016, which reached 600 mm. The annual average precipitation increased by 160 mm and the annual average 20 cm pan evaporation decreased by 241 mm compared with those from 1990 to 1998.
The H a was about 59.8 ×   10 6   m 3   y 1 , which declined 4.5 ×   10 6   m 3   y 1 compared with those during 2010–2015. The decrease in H a may be for two reasons as follows:
  • According to “The 13th Five-Year Plan” drawn up by the Chinese government, coal consumption will drop from 5.7 billion tons to 3.4 billion tons from 2015 to 2020. Many coal mining-related businesses have had to close or reduce capacity.
  • There was 1.0 × 10 6   m 3 of water discharged each year from the Zhashake reservoir and Maogaitu reservoir to the HN after 2015.

5.2. Uncertainties and Limitations

Several uncertainties and limitations exist in this study. First, the lake area was extracted from Landsat data with a resolution of 30 m, which can lead to deviation in the estimated lake area [61]. At the same time, the water level is determined by the lake boundary and RTK data, the deviation of the lake boundary will lead to the bias of the estimated water level. In future studies, higher spatial resolution remote sensing images will help improve the accuracy of water area and water levels. Second, the mean precipitation and evaporation of two nearby meteorological stations was used to estimate the meteorological data, which may not reflect the actual weather conditions in the HN basin. In addition, runoff coefficients in the vicinity of the HN basin may not reflect the true hydrological conditions of the HN basin. Meteorological and hydrologic stations should be established in the HN basin to obtain more accurate weather and hydrologic data for the HN in the future. Third, due to the lack of some social and economic data, it is impossible to accurately estimate the impact of policies drawn by the government on HN.

6. Conclusions

In this study, the variations in the lake area, level, and storage of HN during 1990–2017 were investigated using Landsat imagery and in situ measurements, and the driving factors of these changes were analyzed. The main conclusions are as follows. (1) The water storage of HN decreased by approximately 2.7 × 10 8   m 3 in total during 1999–2015, and the area of HN began to expand after 2015. (2) In different periods, the human activities affecting the HN were also undergoing great changes due to economic development and policies drawn up by government. (3) The major factors caused by the HN change were different in several phases. Climate drought and the intensification of human activities were the main driving factors for the rapid shrinkage of the HN during 1999- 2010. Human activities likely was the primary factor driving the decrease in the water storage of HN from 2010 to 2015. After 2015, the policies that decreased the water consumed by human activities made by the government and humid climate were the main factor for the expansion of HN. The results of this study will provide important scientific guidance for future water management and conservation in HN. In addition, the method used in our study is potentially applicable to similar ungauged basins elsewhere in the world to study their responses to climate change and human activities.

Author Contributions

Conceptualization, Z.J.; methodology, Z.J., J.W., S.L.; software, S.L.; formal analysis, Z.J., P.L. and H.Z.; investigation, X.C.; data curation, S.L.; writing—original draft preparation, Z.J.; writing—review and editing, J.W.; supervision, L.F.; project administration, X.W. All authors have read and agreed to the published version of the manuscript.

Funding

This study supported by the National Natural Science Foundation of China (41201437, 41571344, 41701379) and the Fundamental Research Funds for the Central Universities (lzujbky-2021-ey05).

Conflicts of Interest

The authors declare no conflict of interest.

References

  1. Micklin, P. Desiccation of the Aral Sea: A water management disaster in the Soviet Union. Science 1988, 241, 1170–1176. [Google Scholar] [CrossRef] [PubMed] [Green Version]
  2. Sellinger, C.; Stow, C.; Lamon, E.; Qian, S. Recent water level declines in the Lake Michigan-Huron system. Environ. Sci. Technol. 2008, 42, 367–373. [Google Scholar] [CrossRef]
  3. Wurtsbaugh, W.A.; Miller, C.; Null, S.E.; DeRose, J.; Wilcock, P.; Hahnenberger, M.; Howe, F.; Moore, J. Decline of the world’s saline lakes. Nat. Geosci. 2017, 10, 816–823. [Google Scholar] [CrossRef]
  4. Williamson, C.E.; Saros, J.E.; Vincent, W.F.; Smol, J.P. Lakes and reservoirs as sentinels, integrators, and regulators of climate change. Limnol. Oceanogr. 2009, 54, 2273–2282. [Google Scholar] [CrossRef]
  5. MacDonald, G.M.; Edwards, T.W.D.; Moser, K.A.; Pienitz, R.; Smol, J.P. Rapid response of treeline vegetation and lakes to past climate warming. Nature 1993, 361, 243–246. [Google Scholar] [CrossRef]
  6. Song, C.; Huang, B.; Ke, L.; Richards, K.S. Seasonal and abrupt changes in the water level of closed lakes on the Tibetan Plateau and implications for climate impacts. J. Hydrol. 2014, 514, 131–144. [Google Scholar] [CrossRef]
  7. Yuan, Y.; Zeng, G.; Liang, J.; Huang, L.; Hua, S.; Li, F.; Zhu, Y.; Wu, H.; Liu, J.; He, X.; et al. Variation of water level in Dongting Lake over a 50-year period: Implications for the impacts of anthropogenic and climatic factors. J. Hydrol. 2015, 525, 450–455. [Google Scholar] [CrossRef]
  8. Natugonza, V.; Ogutu-Ohwayo, R.; Musinguzi, L.; Olokotum, M.; Naigaga, S.; Kitabona, J. Implications of climate warming for hydrology and water balance of small shallow lakes: A case of Wamala and Kawi, Uganda. Aquat. Ecosyst. Health Manag. 2016, 19, 327–335. [Google Scholar] [CrossRef]
  9. Wang, J.; Sheng, Y.; Wada, Y. Little impact of the Three Gorges Dam on recent decadal lake decline across China’s Yangtze Plain. Water Resour. Res. 2017, 3854–3877. [Google Scholar] [CrossRef] [Green Version]
  10. Francesco, S.D.; Biscarini, C.; Montesarchio, V.; Manciola, P. On the role of hydrological processes on the water balance of Lake Bolsena, Italy. Lakes Reserv. Res. Manag. 2016, 21, 45–55. [Google Scholar] [CrossRef]
  11. Wang, J.; Song, C.; Reager, J.T.; Yao, F.; Famiglietti, J.S.; Sheng, Y.; MacDonald, G.M.; Brun, F.; Schmied, H.M.; Marston, R.A.; et al. Recent global decline in endorheic basin water storages. Nat. Geosci. 2018, 11, 926–932. [Google Scholar] [CrossRef] [Green Version]
  12. Cardille, J.A.; Carpenter, S.R.; Coe, M.T.; Foley, J.A.; Hanson, P.C.; Turner, M.G.; Vano, J.A. Carbon and water cycling in lake-rich landscapes: Landscape connections, lake hydrology, and biogeochemistry. J. Geophys. Res. 2007, 112, 1–18. [Google Scholar] [CrossRef] [Green Version]
  13. Crawford, J.T.; Lottig, N.R.; Stanley, E.H.; Walker, J.F.; Hanson, P.C.; Finlay, J.C.; Striegl, R.G. CO2 and CH4 emissions from streams in a lake-rich landscape: Patterns, controls, and regional significance. Glob. Biogeochem. Cycles 2014, 28, 197–210. [Google Scholar] [CrossRef]
  14. El-Zehairy, A.A.; Lubczynski, M.W.; Gurwin, J. Interactions of artificial lakes with groundwater applying an integrated MODFLOW solution. Hydrogeol. J. 2018, 26, 109–132. [Google Scholar] [CrossRef]
  15. Liu, H.; Yin, Y.; Piao, S.; Zhao, F.; Engels, M.; Ciais, P. Disappearing Lakes in Semiarid Northern China: Drivers and Environmental Impact. Environ. Sci. Technol. 2013, 47, 12107–12114. [Google Scholar] [CrossRef]
  16. Tao, S.; Fang, J.; Zhao, X.; Zhao, S.; Shen, H.; Hu, H.; Tang, Z.; Wang, Z.; Guo, Q. Rapid loss of lakes on the Mongolian Plateau. Proc. Natl. Acad. Sci. USA 2015, 112, 2281–2286. [Google Scholar] [CrossRef] [Green Version]
  17. Tan, L.; Zhang, H.; Zhang, R.; Luo, z.; Li, X.; Liu, P. Study on landscape pattern change of Hongjian Lake basin in northern Shaanxi province, China. J. Xian Jiaotong Univ. 2010, 44, 126–132. [Google Scholar]
  18. Liang, K.; Yan, G. Application of Landsat Imagery to Investigate Lake Area Variations and Relict Gull Habitat in Hongjian Lake, Ordos Plateau, China. Remote Sens. 2017, 9, 1019. [Google Scholar] [CrossRef] [Green Version]
  19. Song, C.; Huang, B.; Ke, L. Modeling and analysis of lake water storage changes on the Tibetan Plateau using multi-mission satellite data. Remote Sens. Environ. 2013, 135, 25–35. [Google Scholar] [CrossRef]
  20. Song, C.; Huang, B.; Richards, K.; Ke, L.; Phan, V.H. Accelerated lake expansion on the tibetan plateau in the 2000s: Induced by glacial melting or other processes? Water Resour. Res. 2014, 50, 3170–3186. [Google Scholar] [CrossRef] [Green Version]
  21. Song, C.Q.; Ye, Q.H.; Cheng, X. Shifts in water-level variation of Namco in the central Tibetan Plateau from ICESat and CryoSat-2 altimetry and station observations. Sci. Bull. 2015, 60, 1287–1297. [Google Scholar] [CrossRef] [Green Version]
  22. Smith, L.C.; Sheng, Y.; MacDonald, G.M.; Hinzman, L.D. Disappearing Arctic Lakes. Science 2005, 308, 1429. [Google Scholar] [CrossRef] [Green Version]
  23. Wang, J.; Sheng, Y.; Tong, T.S.D. Monitoring decadal lake dynamics across the Yangtze Basin downstream of Three Gorges Dam. Remote Sens. Environ. 2014, 152, 251–269. [Google Scholar] [CrossRef]
  24. Yang, K.; Yao, F.; Wang, J.; Luo, J.; Shen, Z.; Wang, C.; Song, C. Recent dynamics of alpine lakes on the endorheic Changtang Plateau from multi-mission satellite data. J. Hydrol. 2017, 552, 633–645. [Google Scholar] [CrossRef]
  25. Deng-ke, L.; Jing, Z.; Zhao, W. Effect of Human Activities and Climate Change on the Water Surface Area of Hongjiannao Lake. J. Glaciol. Geocryol. 2009, 31, 1110–1115. [Google Scholar]
  26. Yin, L.; Zhang, M.; Dong, J. Area variation and controlling factors of Lake Hongjian, Mu Us desert, China based on remote sensing techniques. Geol. Bull. China 2008, 27, 1151–1156. [Google Scholar] [CrossRef]
  27. Li, B.; Yu, Z.; Liang, Z.; Acharya, K. Hydrologic response of a high altitude glacierized basin in the central Tibetan Plateau. Glob. Planet. Chang. 2014, 118, 69–84. [Google Scholar] [CrossRef]
  28. Ying, L.; Li-xin, W.; Hui, Y. Monitoring of Hongjiannao Lake Area Based on landsat and HJ Imageries. Geogr. Geo-Inf. Sci. 2015, 31, 60–64. [Google Scholar] [CrossRef]
  29. Ying, L.; Hui, Y. Analysis of Hongjiannao Lake Area Based on SMMI. Sci. Technol. Eng. 2016, 16, 122–127. [Google Scholar]
  30. Zhang, G.; Xie, H.; Kang, S.; Yi, D.; Ackley, S.F. Monitoring lake level changes on the Tibetan Plateau using ICESat altimetry data (2003–2009). Remote Sens. Environ. 2011, 115, 1733–1742. [Google Scholar] [CrossRef]
  31. Kropácek, J.; Braun, A.; Kang, S.; Feng, C.; Ye, Q.; Hochschild, V. Analysis of lake level changes in Nam Co in central Tibet utilizing synergistic satellite altimetry and optical imagery. Int. J. Appl. Earth Obs. Geoinf. 2012, 17, 3–11. [Google Scholar] [CrossRef]
  32. Singh, A.; Seitz, F.; Schwatke, C. Inter-annual water storage changes in the Aral Sea from multi-mission satellite altimetry, optical remote sensing, and GRACE satellite gravimetry. Remote Sens. Environ. 2012, 123, 187–195. [Google Scholar] [CrossRef]
  33. Deus, D.; Gloaguen, R.; Krause, P. Water Balance Modeling in a Semi-Arid Environment with Limited in situ Data Using Remote Sensing in Lake Manyara, East African Rift, Tanzania. Remote Sens. 2013, 5, 1651–1680. [Google Scholar] [CrossRef] [Green Version]
  34. Duan, Z.; Bastiaanssen, W.G.M. Estimating water volume variations in lakes and reservoirs from four operational satellite altimetry databases and satellite imagery data. Remote Sens. Environ. 2013, 135, 403–416. [Google Scholar] [CrossRef]
  35. Tong, X.; Pan, H.; Xie, H.; Xu, X.; Li, F.; Chen, L.; Luo, X.; Liu, S.; Chen, P.; Jin, Y. Estimating water volume variations in Lake Victoria over the past 22 years using multi-mission altimetry and remotely sensed images. Remote Sens. Environ. 2016, 187, 400–413. [Google Scholar] [CrossRef]
  36. Zhu, W.; Yan, J.; Jia, S. Monitoring Recent Fluctuations of the Southern Pool of Lake Chad Using Multiple Remote Sensing Data: Implications for Water Balance Analysis. Remote Sens. 2017, 9, 1032. [Google Scholar] [CrossRef] [Green Version]
  37. Crétaux, J.-F.; Abarca-del-Río, R.; Bergé-Nguyen, M.; Arsen, A.; Drolon, V.; Clos, G.; Maisongrande, P. Lake Volume Monitoring from Space. Surv. Geophys. 2016, 37, 269–305. [Google Scholar] [CrossRef] [Green Version]
  38. Badulin, S.; Zinchenko, V.; Belonenko, T. Altimetry for the future: Building on 25 years of progress. Adv. Space Res. 2021. [Google Scholar] [CrossRef]
  39. Cai, X.; Gan, W.; Ji, W.; Zhao, X.; Wang, X.; Chen, X. Optimizing Remote Sensing-Based Level-Area Modeling of Large Lake Wetlands: Case Study of Poyang Lake. IEEE J. Sel. Top. Appl. Earth Obs. Remote Sens. 2015, 8, 471–479. [Google Scholar] [CrossRef]
  40. Smith, L.C.; Pavelsky, T.M. Remote sensing of volumetric storage changes in lakes. Earth Surf. Process. Landf. 2009, 34, 1353–1358. [Google Scholar] [CrossRef]
  41. Yang, C.; Cai, X.; Wang, X. Remote Sensing of Hydrological Changes in Tian-e-Zhou Oxbow Lake, an Ungauged Area of the Yangtze River Basin. Remote Sens. 2018, 10, 27. [Google Scholar] [CrossRef] [Green Version]
  42. Pan, F.; Liao, J.; Li, X.; Guo, H. Application of the inundation area—lake level rating curves constructed from the SRTM DEM to retrieving lake levels from satellite measured inundation areas. Comput. Geosci. 2013, 52, 168–176. [Google Scholar] [CrossRef]
  43. Hu, C. A novel ocean color index to detect floating algae in the global oceans. Remote Sens. Environ. 2009, 113, 2118–2129. [Google Scholar] [CrossRef]
  44. Shen, J.; Wang, Y.; Yang, X.; Zhang, E.; Yang, B.; Junfeng, J.I. Paleosandstorm characteristics and lake evolution history deduced from investigation on lacustrine sediments--The case of Hongjiannao Lake, Shaanxi Province. Sci. Bull. 2005, 50, 2355–2361. [Google Scholar] [CrossRef]
  45. Ma, B.; Wu, L.; Zhang, X.; Li, X.; Liu, Y.; Wang, S. Locally adaptive unmixing method for lake-water area extraction based on MODIS 250 m bands. Int. J. Appl. Earth Obs. Geoinf. 2014, 33, 109–118. [Google Scholar] [CrossRef]
  46. Feng, L.; Hu, C.M.; Chen, X.L.; Cai, X.B.; Tian, L.Q.; Gan, W.X. Assessment of inundation changes of Poyang Lake using MODIS observations between 2000 and 2010. Remote Sens. Environ. 2012, 121, 80–92. [Google Scholar] [CrossRef]
  47. Feng, L.; Hu, C.; Chen, X.; Zhao, X. Dramatic inundation changes of China’s two largest freshwater lakes linked to the Three Gorges Dam. Environ. Sci. Technol. 2013, 47, 9628–9634. [Google Scholar] [CrossRef]
  48. Xing, Q.; Hu, C. Mapping macroalgal blooms in the Yellow Sea and East China Sea using HJ-1 and Landsat data: Application of a virtual baseline reflectance height technique. Remote Sens. Environ. 2016, 178, 113–126. [Google Scholar] [CrossRef]
  49. Hsieh, P.-F.; Lee, L.C.; Chen, N.-Y. Effect of Spatial Resolution on Classification Errors of Pure and Mixed Pixels in Remote Sensing. IEEE Trans. Geosci. Remote Sens. 2001, 39, 2657–2663. [Google Scholar] [CrossRef]
  50. Shen, X.; Ouyang, Z.; de Leeuw, J. Constructing a DEM of Baiyang Lake Area from a series of Landsat Images. Geogr. Geo-Inf. Sci. 2005, 21, 16–19. [Google Scholar] [CrossRef]
  51. Vincent, L. Morphological grayscale reconstruction in image analysis: Applications and efficient algorithms. IEEE Trans. Image Processing 1993, 2, 176–201. [Google Scholar] [CrossRef] [Green Version]
  52. Long-bin, L.; Qiang, F.; Jin-bai, H. Runoff Conditions and Runoff Coefficient of the wind-water Erosion Crisscross Region on the Northern Loess Plateau. Res. Soiland Water Conserv. 2013, 20, 17–23. [Google Scholar]
  53. Chen, H.; Wang, Y.; Yang, L.; Gong, H. Economic development and water demand prediction in northwest China. Yellow River 2002, 24, 15–16. [Google Scholar] [CrossRef]
  54. Mislick, G.K.; Nussbaum, D.A. Linear Regression Analysis; World Scientific: Singapore, 2015. [Google Scholar]
  55. Qiang, D. Study on Water Environment of Lake in Arid and Semi-arid Areas in Northwest China—A Case Study of Hongjiannao in Shanxi Province; North West University: Xi’an, China, 2017. [Google Scholar]
  56. Liu, P.; Gan, W.; Zhang, R.f. Quantitative analysis on water volume change and impacting factors for Hongjiannao watershed in northern Shaanxi province. J. Xi’an Jiaotong Univ. 2009, 43, 119–124. [Google Scholar] [CrossRef]
  57. Li, L. Study on the Environmental Carrying Capacity of Jurassic Coalfield in Northern Shananxi Province; Xi’an University of Technology: Xi’an, China, 2008. [Google Scholar]
  58. Xueya, D.; Maosheng, Z.; Ying, D. Research on protection and exploitation of groundwater resources in Northern Shaanxi Jurassic Coalfield. Earth Sci. Front. 2010, 17, 200–207. [Google Scholar]
  59. Zhang, B.; Zhang, J. Coal mining destruction of ecological balance and compensation mechanism in Northern Shaanxi energy and industry base. Coal Geol. China 2010, 22, 38–43. [Google Scholar]
  60. Xiufen, M.; Lijuan, Z.; Yaojun, F.; Yanbo, T.; Qiming, L.; Jian, M.; Jinxia, M.; Yan, L. A Study on Aquifers and Their Protection in Ordos Basin Coal Base. Coal Geol. China 2012, 24, 36–42. [Google Scholar] [CrossRef]
  61. Lyons, E.A.; Sheng, Y.; Smith, L.C.; Li, J.; Hinkel, K.M.; Lenters, J.D.; Wang, J. Quantifying sources of error in multitemporal multisensor lake mapping. Int. J. Remote Sens. 2013, 34, 7887–7905. [Google Scholar] [CrossRef]
Figure 1. Map of the Hongjian Nur basin (HN basin).
Remotesensing 13 02690 g001
Figure 2. Locations of the Zhashake Reservoir and the Maogaitu Reservoir.
Remotesensing 13 02690 g002
Figure 3. Spatial distribution of real-time kinematic sampling lines.
Remotesensing 13 02690 g003
Figure 4. Relationship between the water level of HN and its lake area.
Remotesensing 13 02690 g004
Figure 5. The changes in the shorelines of HN during 1990–2017.
Remotesensing 13 02690 g005
Figure 6. Changes in and trend of the lake area of HN during 1990–2017.
Remotesensing 13 02690 g006
Figure 7. Changes in and trend of the lake level of HN during 1990–2017.
Remotesensing 13 02690 g007
Figure 8. Changes in and trend of the water storage of HN during 1990–2017.
Remotesensing 13 02690 g008
Figure 9. Annual average precipitation and evaporation of the lake surface during 1990–2017.
Remotesensing 13 02690 g009
Figure 10. The variations of (a) annual precipitation and (b) 20 cm pan evaporation within the HN basin from 1990 to 2017.
Remotesensing 13 02690 g010
Figure 11. Gross industrial output value (GIOV) of the three towns in the HN basin.
Remotesensing 13 02690 g011
Figure 12. The variations of (a) residential water consumption and (b) livestock water consumption within the HN basin from 1990 to 2015.
Remotesensing 13 02690 g012
Table 1. The HN water balance from 1990 to 2017.
Water Balance Components1990–19981999–20052006–20102011–20152016–2017
Annual Average
( 1 × 10 6   m 3   y 1 )
Annual Average
( 1 × 10 6   m 3   y 1 )
Annual Average
( 1 × 10 6   m 3   y 1 )
Annual Average
( 1 × 10 6   m 3   y 1 )
Annual Average
( 1 × 10 6   m 3   y 1 )
Lake water supply R 56.249.853.362.779.8
P w 21.215.414.314.118.3
G 6.676.676.676.676.67
Loss of lake water H a 37.147.248.764.359.8
E W 48.541.837.229.226.5
d v *−1.53−17.13−11.63−10.03+18.47
* “−” means a decrease in water storage; “+” indicates an increase in water storage.
Table 2. The Pearson correlation coefficient between the volume of HN and its driving factors.
PET_PANRCLCGIOV
HN volume 1990–2015−0.11−0.09−0.69 −0.92 −0.89
HN volume 1990–1998−0.11−0.55−0.16 −0.23 −0.25
HN volume 1999–2005−0.560.310.84 −0.68 −0.91
HN volume 2006–2010−0.020.32−0.82 −0.98 −0.98
HN volume 2011–20150.080.00−0.89−0.95−0.61
P means precipitation, ET_PAN stands for pan evaporation and, RC means residential water consumption, LC stands for livestock water consumption.
Publisher’s Note: MDPI stays neutral with regard to jurisdictional claims in published maps and institutional affiliations.

