Article

Measuring the Contribution of Leaves to the Structural Complexity of Urban Tree Crowns with Terrestrial Laser Scanning

by
Georgios Arseniou
1,
David W. MacFarlane
1,* and
Dominik Seidel
2
1
Department of Forestry, Michigan State University, East Lansing, MI 48840, USA
2
Department of Silviculture and Forest Ecology of the Temperate Zones, University of Göttingen, 37077 Göttingen, Germany
*
Author to whom correspondence should be addressed.
Remote Sens. 2021, 13(14), 2773; https://doi.org/10.3390/rs13142773
Submission received: 11 June 2021 / Revised: 1 July 2021 / Accepted: 5 July 2021 / Published: 14 July 2021
(This article belongs to the Special Issue Remote Sensing of Urban Forest Structure)

Abstract

:
Trees have a fractal-like branching architecture that determines their structural complexity. We used terrestrial laser scanning technology to study the role of foliage in the structural complexity of urban trees. Forty-five trees of three deciduous species, Gleditsia triacanthos, Quercus macrocarpa, Metasequoia glyptostroboides, were sampled on the Michigan State University campus. We studied their structural complexity by calculating the box-dimension (Db) metric from point clouds generated for the trees using terrestrial laser scanning, during the leaf-on and -off conditions. Furthermore, we artificially defoliated the leaf-on point clouds by applying an algorithm that separates the foliage from the woody material of the trees, and then recalculated the Db metric. The Db of the leaf-on tree point clouds was significantly greater than the Db of the leaf-off point clouds across all species. Additionally, the leaf removal algorithm introduced bias to the estimation of the leaf-removed Db of the G. triacanthos and M. glyptostroboides trees. The index capturing the contribution of leaves to the structural complexity of the study trees (the ratio of the Db of the leaf-on point clouds divided by the Db of the leaf-off point clouds minus one), was negatively correlated with branch surface area and different metrics of the length of paths through the branch network of the trees, indicating that the contribution of leaves decreases as branch network complexity increases. Underestimation of the Db of the G. triacanthos trees, after the artificial leaf removal, was related to maximum branch order. These results enhance our understanding of tree structural complexity by disentangling the contribution of leaves from that of the woody structures. The study also highlighted important methodological considerations for studying tree structure, with and without leaves, from laser-derived point clouds.

Graphical Abstract

1. Introduction

Trees have an inherent fractal-like branching architecture [1,2,3] mirroring principles of fractal geometry [4]. However, tree branching networks are not perfect fractals, lacking self-similarity across all scales of the branching hierarchy [1,5,6]. Nonetheless, major theories linking tree morphology to tree physiology (e.g., pipe model theory [7,8,9,10]; metabolic scaling theory [11]) and mechanical stability (e.g., resisting wind stress [12]) have been advanced by assuming that the fractal-like character of trees explains the structural complexity of their crowns [13] and how they grow to occupy space [14,15]. One of the main challenges in testing such theories is finding reliable ways to accurately measure the structural complexity of trees in a way that reflects the fractal dimension of tree crowns.
The growing environment of a tree affects its crown architecture and competition for light from neighboring trees [16] significantly disrupts the inherent fractal-like character of trees growing in forest stands and plantations [17,18]. According to Seidel [13], Douglas-fir trees growing in forest gaps had more complex crowns compared to trees of the same species growing in closed canopy conditions; this implies that the light regime significantly affects the fractal dimension of a tree, which negatively relates to competition [19]. Therefore, we expect that the typically lower number, or complete absence of, neighboring trees in cities should allow urban trees to better express their inherent fractal character; this was an important reason to focus on urban open-grown trees in this study. Of course, cities have heterogeneous growing conditions [20,21,22,23,24,25,26], characterized by anthropogenic barriers to root and crown expansion [27,28,29], systematic tree pruning [29,30], increased atmospheric temperatures and reduced water infiltration [22,31,32], air pollutants [33], and heterogeneous soil properties [34,35], which can affect the fractal dimension of tree crowns [36]. Nonetheless, the inherent fractal-like character of open-grown trees should be more evident compared to trees growing in competition with other trees.
Open-grown trees can be found both in urban and rural forest conditions, but for urban conditions there is a shortage of robust models. This limits our understanding of the basic ecological services of urban forests [37], despite the fact that urban trees provide a range of significant ecological services, e.g., carbon storage [35,38,39,40], air pollutant uptake [41,42,43], water purification, pollination, biodiversity, and energy savings for buildings [23,24,41,44]. In order to optimize the benefits of urban forests, we need to study the structure and function of trees in cities. For example, we know that the fractal dimension of tree crowns relates to their ability to tolerate shade [45,46], which affects the shading benefits of trees, as well as their ability to tolerate the drought and the heat of cities [36].
New advances in terrestrial laser scanning (TLS) technology allow for accurate, direct measurements of the three-dimensional structure of trees [6,47] and many studies have utilized TLS to quantify stem profiles and timber volume [48,49,50,51,52], leaf and crown attributes [53,54,55], and above-ground tree biomass [56,57,58,59,60,61]. TLS creates ‘point clouds’ of trees by emitting laser pulses and analyzing the returned energy as a function of either time (time-of-flight systems) or shift in the phase of the light wave of the emitted laser beam (phase-shift technology) [56,62]. One way to generate data for analyzing the fractal-like character of tree branching networks from TLS point clouds is the generation of Quantitative Structure Models (QSMs), by fitting cylinders to a tree’s point cloud that preserve branch and stem topology [63,64,65,66,67]. Lau et al. [68] generated QSMs of tropical trees to study the theoretical scaling exponents derived from the metabolic scaling theory [11] that describes the fractal-like structure of trees.
Another approach is the “box-counting” method [15], which considers the number of boxes that are needed to encapsulate all points of a laser-scanned tree, as box size iteratively reduces. Seidel [13] showed how the “box-dimension” metric can be calculated from the point cloud of a tree to describe its fractal dimension in terms of structural complexity. The box-dimension metric has no units and its possible values range between one and three. Trees with great structural complexity and “space-filling character” have box-dimension values closer to three, whereas a box-dimension value equal to one implies a perfectly cylindrical stem with no branches, e.g., a dead tree [13]. Box-dimension values smaller than one imply that the lower “cut-off” has not been properly defined because the mean distance between points is greater than the edge-length of the smallest box. Values of three (or greater) would imply that a tree is a solid cube, which is not valid. The box-dimension is a more direct and simple way to measure the fractal-like character of a tree because it lacks the assumptions and stochasticity inherent in QSMs, using only the raw point cloud data generated by TLS.
Leaves increase uncertainty in the underlying branching architecture because they occlude underlying branches and move more in the wind [47,69]. Davison et al. [70], for example, showed how leaf phenology affects the estimation uncertainty of metrics of forest structural diversity when laser scanning data are used. “Leaf-off” laser scanning data can provide better estimates of the crown architecture of deciduous tree species [70] because leaf occlusion effects are avoided.
There are several studies that have explored how leaf-off and leaf-on airborne laser scanning data compare for the estimation of forest volume and other forest inventory attributes [71,72,73,74], but few, if any, have examined the effects of leaf-on computation of the fractal metrics of tree branching architecture. Perhaps more importantly, we lack a basic understanding regarding the role of foliage in the structural complexity of trees, which is fundamental to understanding how trees position their leaves and branches to maximize light capture and minimize self-shading [45,46,75], optimize crown architecture to improve water transport and resist drought [36], and reduce wind stress [12,76,77], which has been shown to be affected by both the increased drag of foliage [78,79] and the uncertain effects of branches.
Artificial leaf separation from the leaf-on point clouds of trees is a promising methodology to deal with the fact that trees can’t always be scanned in a leaf-off condition (e.g., evergreen trees). There are three main types of algorithms to separate the leaf from the woody material of laser point clouds of trees: (1) algorithms that use the geometry of laser points, (2) algorithms that consider the radiometric properties of the returned laser pulses, and (3) algorithms that combine the previous approaches [80,81,82,83]. The radiometric-based algorithms assume that the leaves and the woody material of trees have different intensity characteristics at the wavelength of the laser scanner, which depend on the laser scanning distance, the incidence angle, and the technical characteristics of each instrument [83]. However, the geometry-based algorithms consider only the 3D coordinates of the points of a laser-scanned tree based on supervised machine learning [80,84] or unsupervised classification methods [81,83]. In general, we still need a better understanding of the effect of these classification algorithms for leaf separation when studying tree architecture [81].
In this study, we used the box-dimension metric to quantify the structural complexity of three deciduous tree species in their leaf-on and leaf-off conditions. Furthermore, we artificially removed the leaves from the tree point clouds generated from leaf-on data, using the TLSeparation algorithm [85], and we computed the box-dimension metric for the leaf-removed tree point clouds. The questions that we wanted to answer were the following:
  • How do changes in leaf condition of deciduous tree species with different leaf types affect their structural complexity?
  • How do differences in the contribution of leaves to the structural complexity of the study trees relate to their above-ground architecture?
  • What is the effect of artificial leaf removal from leaf-on tree point clouds on estimated structural complexity? Is there an error in estimating the structural complexity of the tree point clouds after artificial leaf-removal, compared to leaf-off point clouds of the same trees?
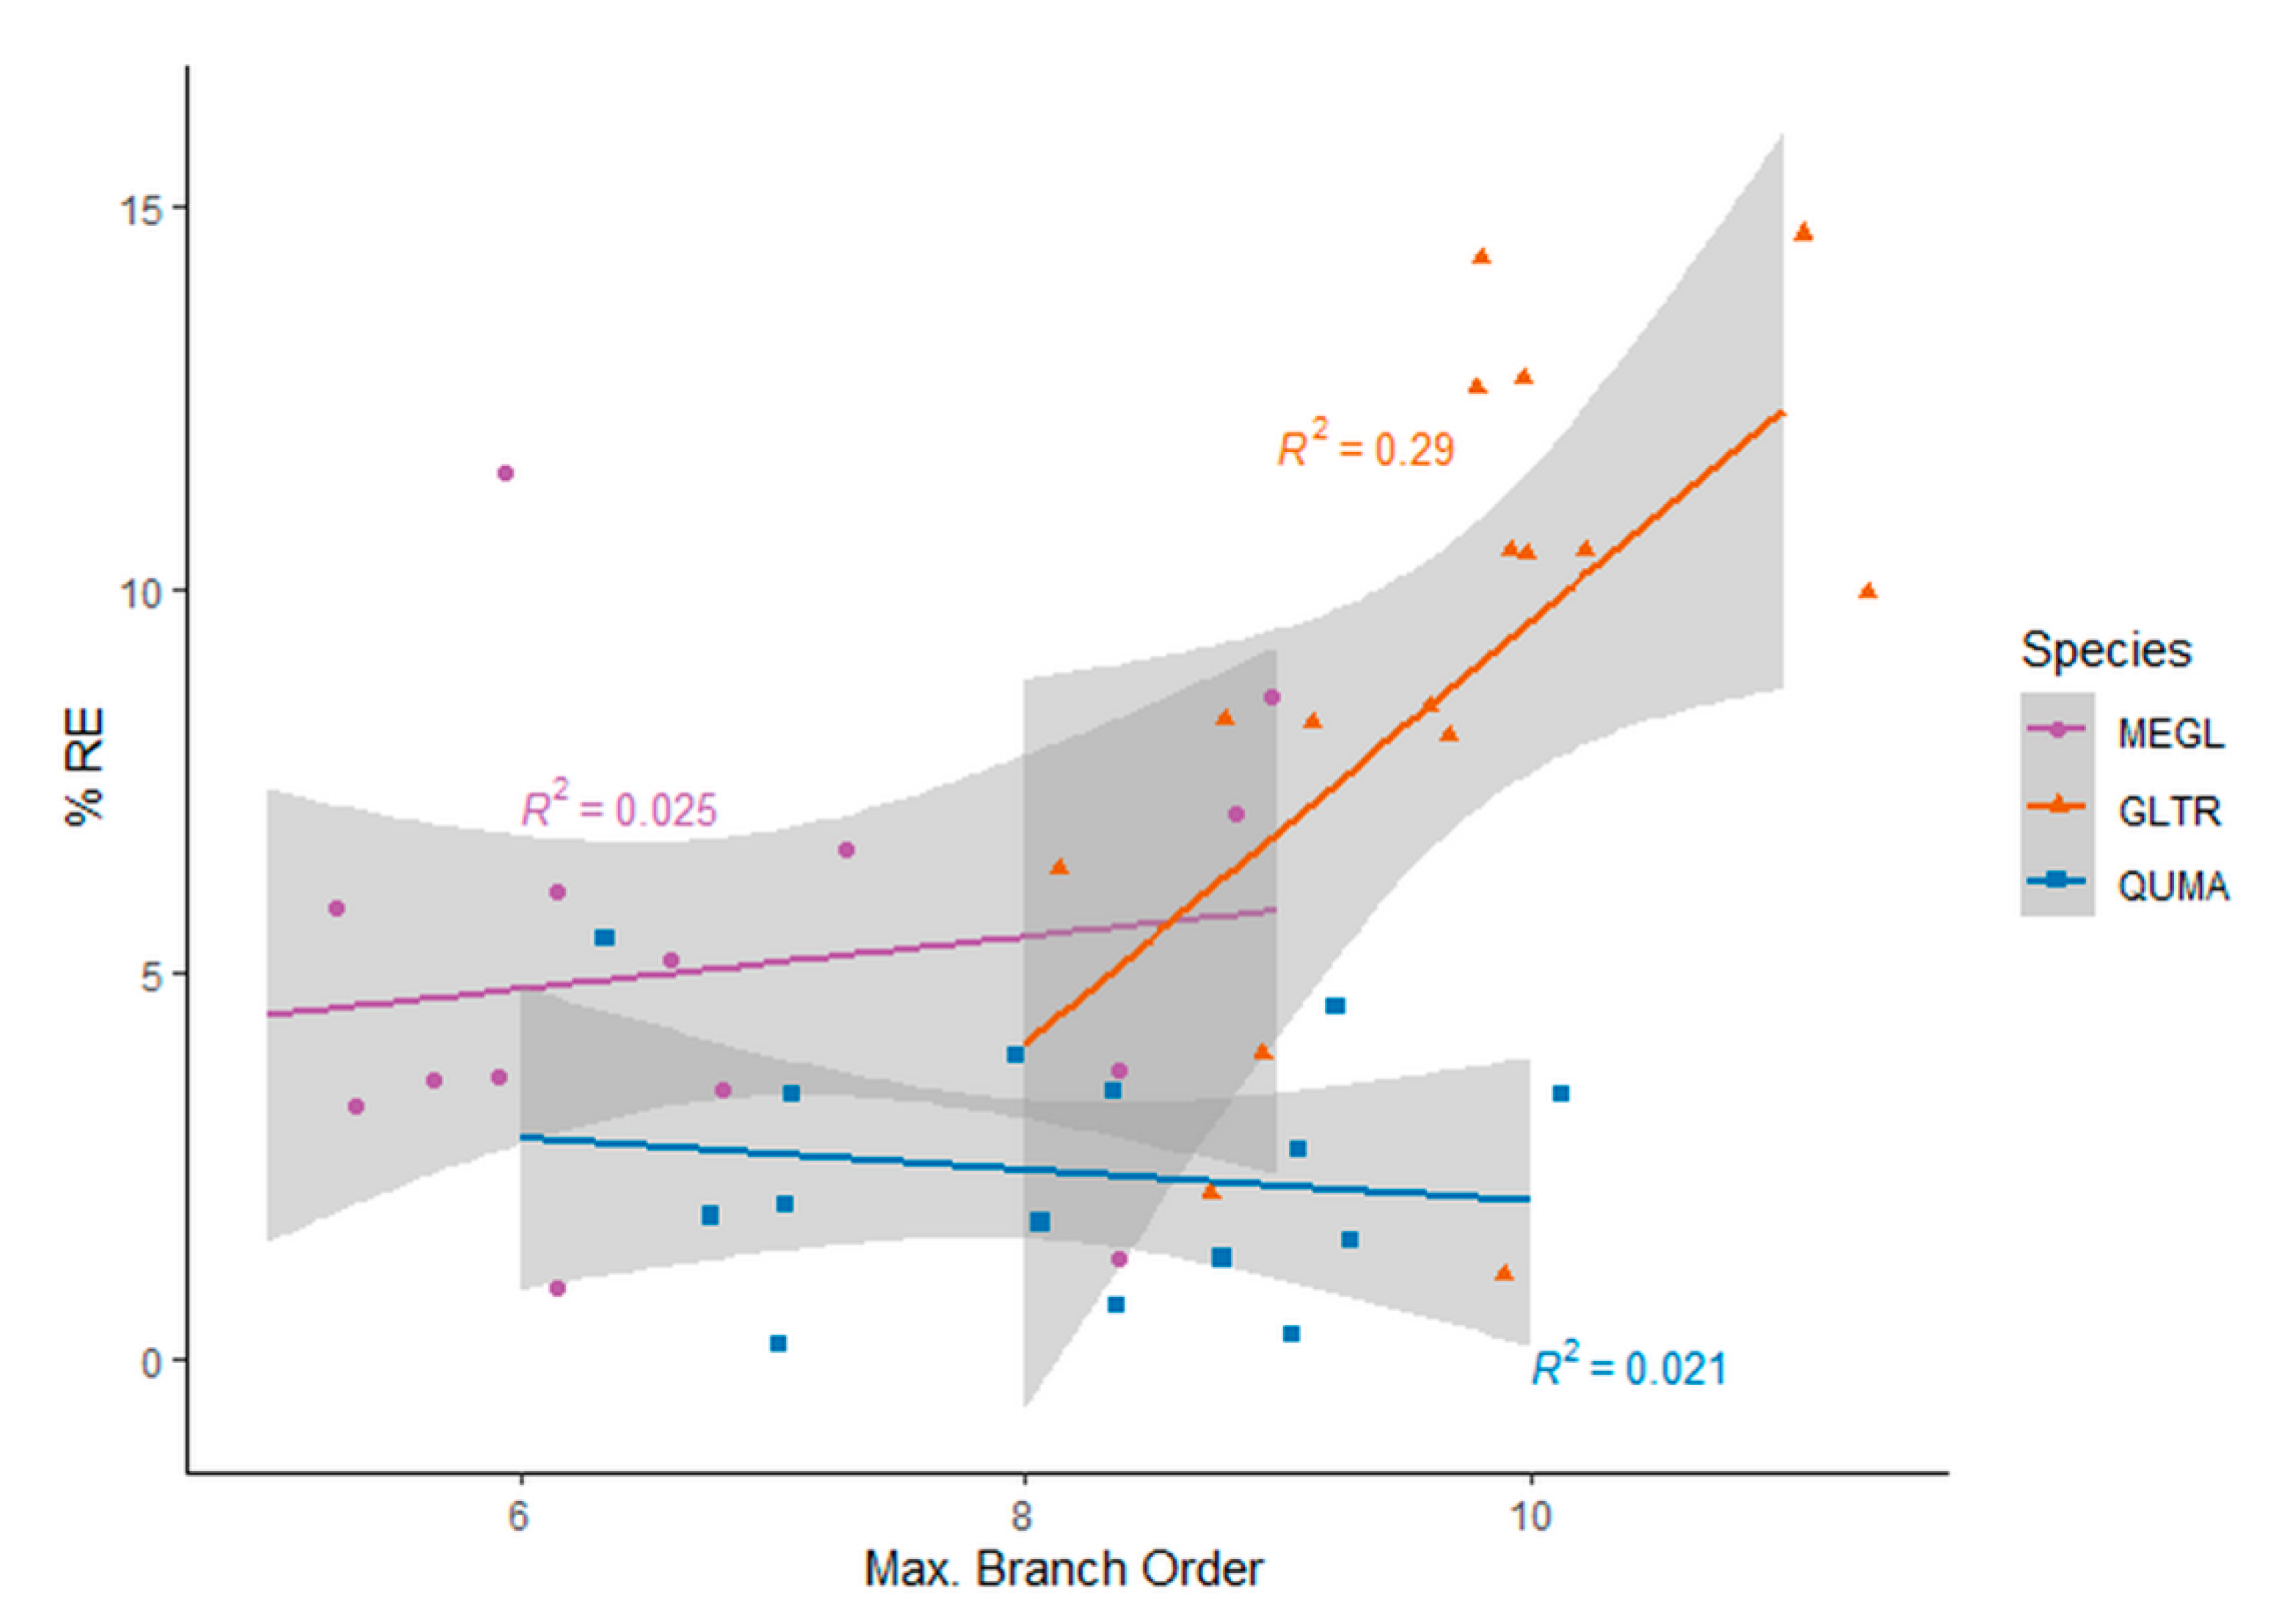
  • How does potential error in estimating the structural complexity of the tree point clouds due to the artificial leaf removal relate to the branch architecture of trees?
We hypothesized that the leaves of trees would significantly increase their structural complexity because the irregular outline shape of leaves is fractal-like [86,87,88], and the presence of foliage implies that more space is occupied by a tree and, consequently, more laser points are captured in its crown. So, a larger number of boxes is required to encapsulate all points of the laser-scanned tree, which results in a greater value of the box-dimension metric [13,89,90]. Furthermore, we hypothesized that differences in the contribution of leaves to tree structural complexity have ecological importance because differences should relate to self-shading of tree crowns [91], the shade tolerance of the tree species, and the type and shape of the leaves [36,92].
We also hypothesized that errors in estimation of the box-dimension resulting from artificial leaf removal, would relate to the type of leaf (broad vs. needle and compound vs. simple) and the order and the size of the branches of a tree, the latter of which because the point cloud density can change across the branching network of a tree and leaf separation algorithms are sensitive to this [80,81].

2. Materials and Methods

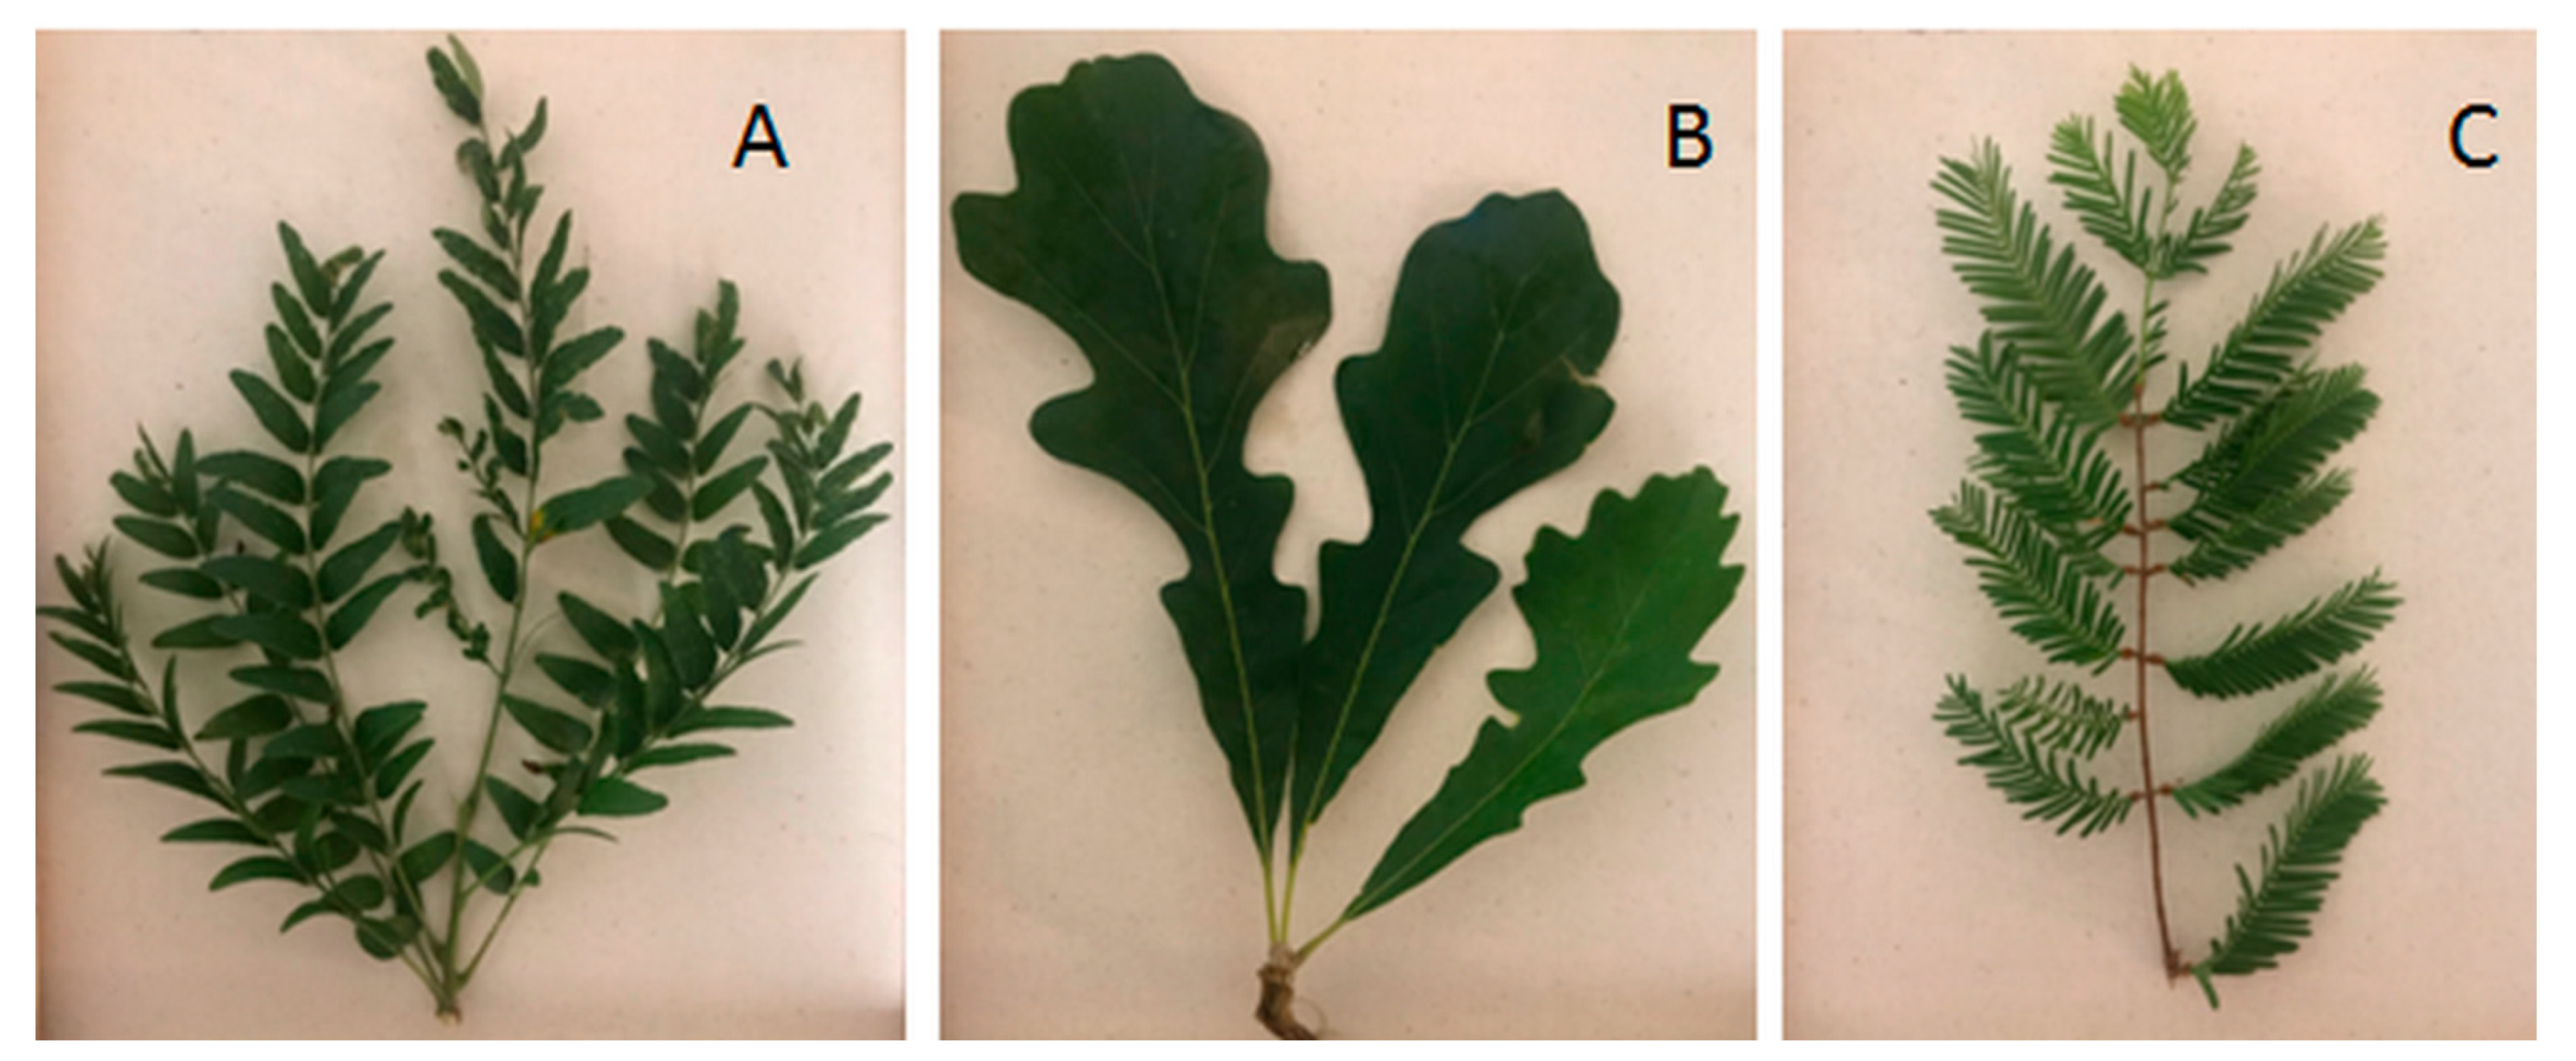
2.1. Urban Tree Data

Forty-five trees of three species, representing different tree functional types, were sampled on the Michigan State University campus: sixteen Gleditsia triacanthos (honey locust) trees, which are compound-leaved, deciduous angiosperms, fifteen Quercus macrocarpa (bur oak) trees, which are entire-leaved, deciduous angiosperms, and fourteen Metasequoia glyptostroboides (dawn redwood) trees, which are needle-leaved, deciduous gymnosperms (Figure 1). The trees were selected to cover a large range of sizes within each species (see Table 1).
The G. triacanthos and Q. macrocarpa trees were laser-scanned with leaves-on in July and August 2019, and the M. glyptostroboides trees were laser-scanned with leaves-on in August 2020 (see specific methods below). The same trees were also laser-scanned in leaves-off condition between January and March 2020. Before re-scanning the study trees, we confirmed that none of them were pruned between the leaves-on and leaves-off scans by the Michigan State University arborists. Therefore, pruning did not cause any bias in the quantification of the structural complexity of the trees during the study period. Following this experimental design, any change in the structural complexity of the study urban trees between the leaves-on and leaves-off scans should be attributed only to changes in their foliage, not their branching architecture. Of course, tree pruning prior to the study should have an effect on the crown architecture of the study trees, but it did not influence the changes in their structural complexity during the study period.

2.2. Terrestrial Laser Scanning and Point Cloud Processing

The FARO Focus3D × 330 terrestrial laser scanner was used to scan the trees. This laser scanner operates with laser light of 1550 nm wavelength, typical beam divergence 0.19 mrad, and a range of 0.6–330 m. In order to minimize occlusion effects in the point clouds, each individual tree was scanned at high resolution from a minimum of four different directions at different distances, and five reference target-spheres were placed around a laser-scanned tree to spatially reference all scans and create a single point cloud for each tree, following the field scanning protocols suggested by Wilkes et al. [69]. The first two scans were conducted in opposite directions, from distances that allowed the top of the focal tree to be clearly visible. The other two scans were also conducted in opposite directions (perpendicularly to the first two scans) but from a closer distance to the tree, to better capture its branching architecture and get closer views of the main stem. Two or three additional scans were conducted underneath the crown of large trees with wide crowns in order to capture more dense point clouds of the branches. All laser scans were conducted when there was little or no wind.
The software SCENE 2019.2 (FARO Technologies Inc., Lake Mary, FL, USA, 2019.2) was used to spatially co-register and noise-filter all scans in an automatic way. With the same software, each tree was then manually separated from the point cloud of the urban site background. This process has been shown to be an accurate alternative to a fully automatic segmentation process [93].

2.3. Leaf and Wood Classification of the Point Clouds

The TLSeparation algorithm [85] was applied to the point clouds of the trees with their leaves-on. This algorithm separates points that belong to the woody components of the trees from points that belong to their foliage, based on unsupervised classification of geometric features (leaf and wood materials within the point cloud have different spatial arrangement) and “shortest-path” analysis, which facilitates detection of paths through the branching network (from tree base to branch tip) with high occurrence frequency [81]. This approach was used to generate a single point cloud for each tree containing only points classified as woody parts of the tree.

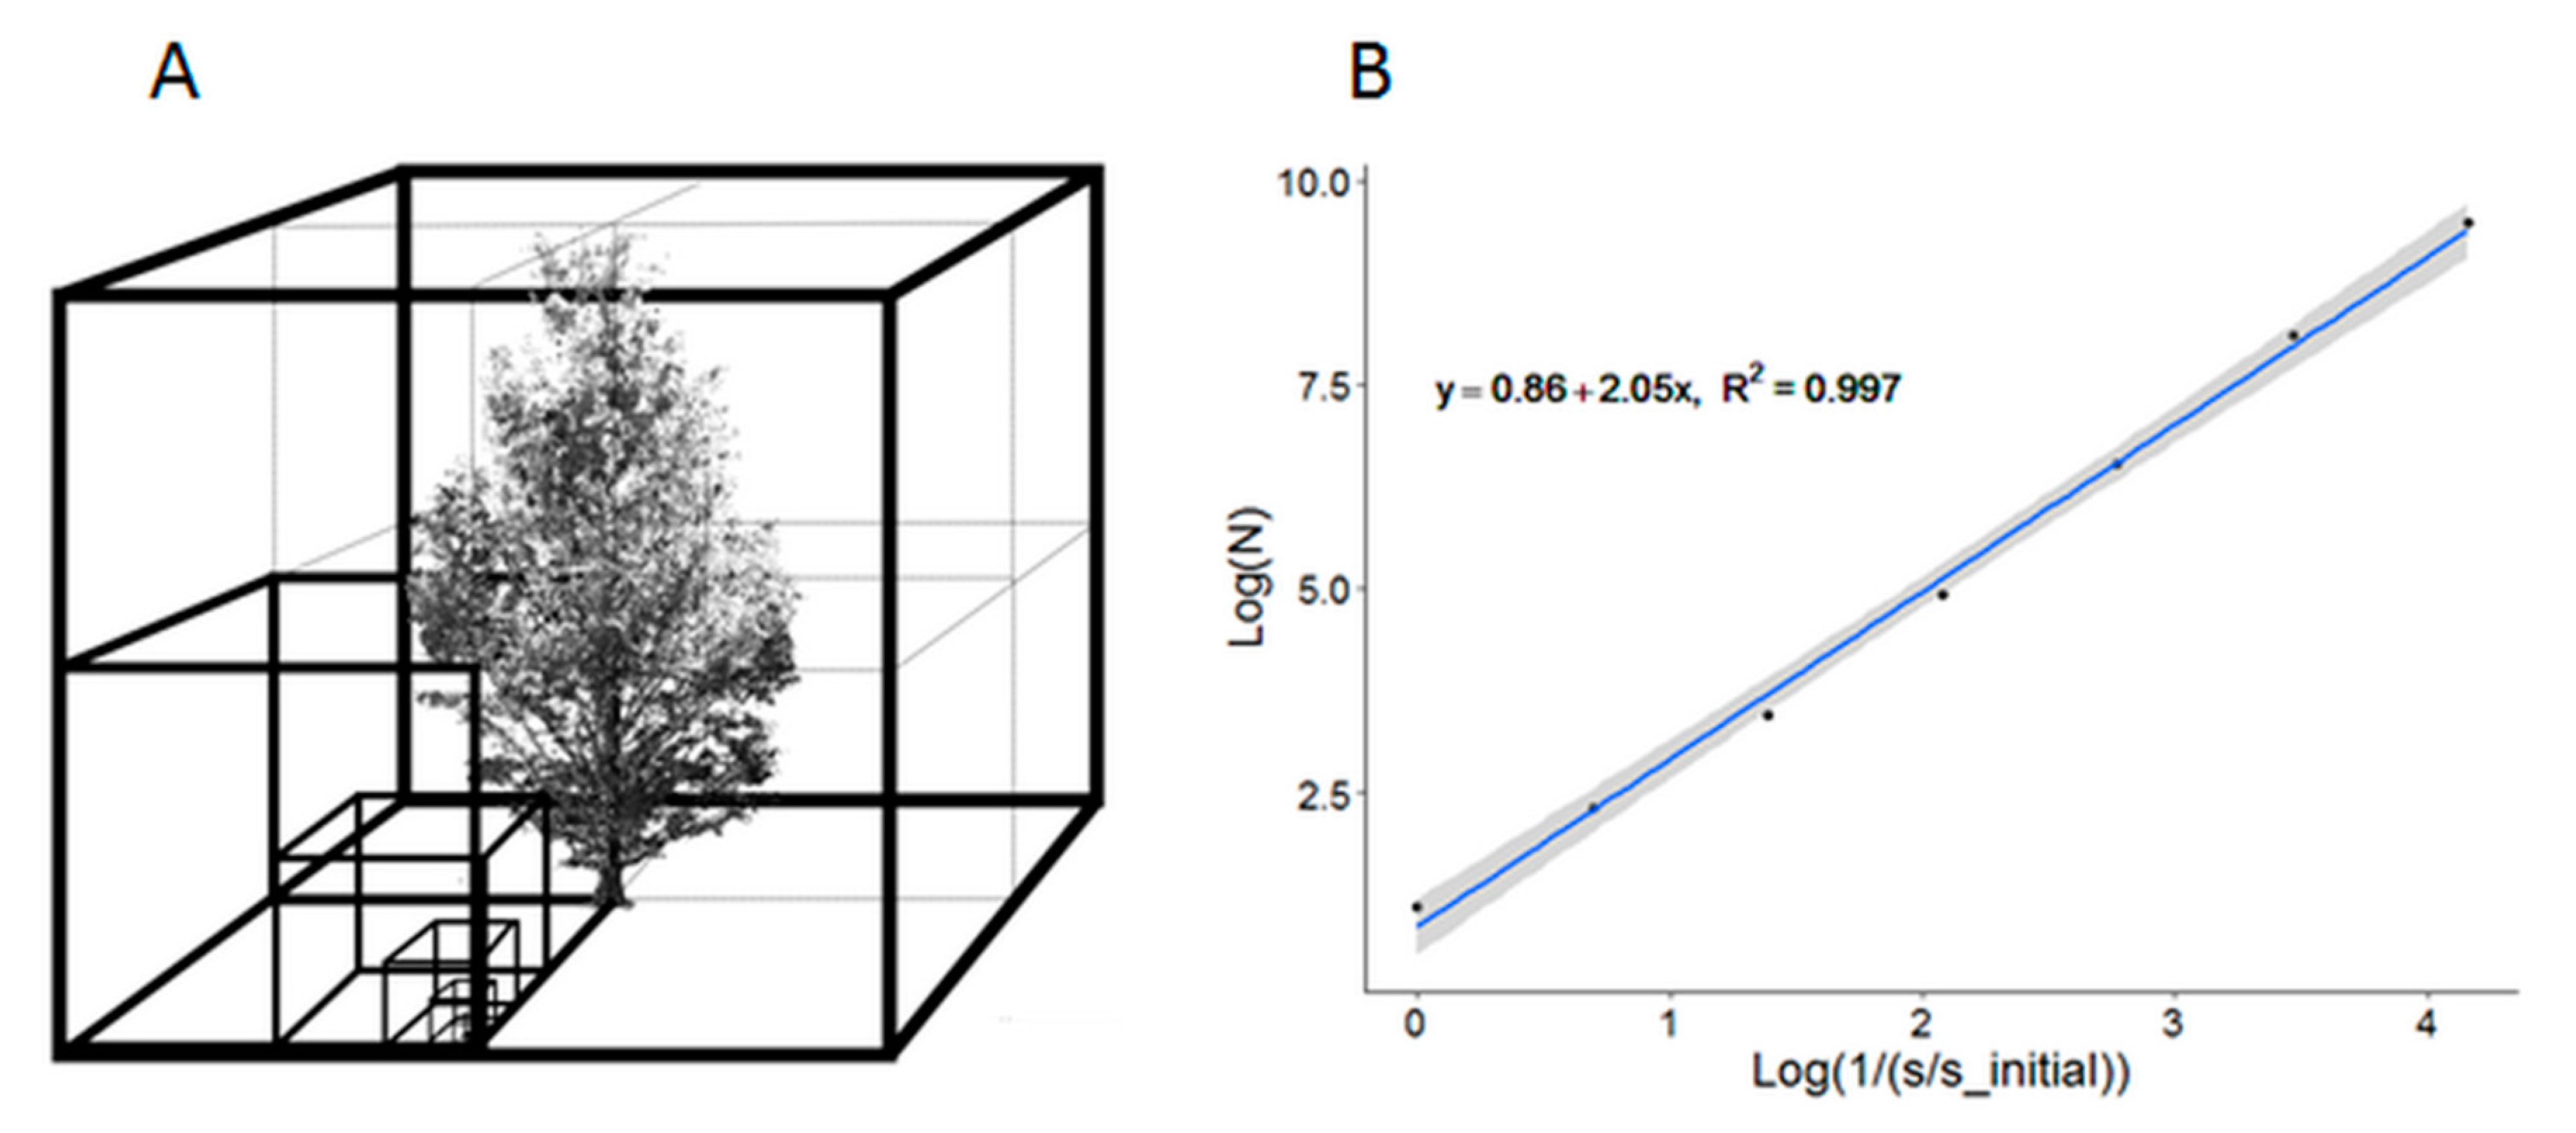
2.4. Quantification of the Structural Complexity of Trees

The box-dimension metric (Db), which is derived from fractal geometry principles [4], was used to quantify the above-ground structural complexity (fractal dimension) of the trees [90] in three conditions: (1) leaf-on, (2) leaf-off, and (3) after the leaves were artificially removed from the leaf-on point clouds. The box-dimension equals the slope of the least-squares line when the logarithm of the number of boxes required to capture all points of a laser-scanned tree is regressed against the logarithm of the inverse of the size of a box relative to the size of the initial box, which is the smallest box encapsulating the whole tree, i.e., “upper cut-off” (Figure 2, [13,90]). The intercept of the regression line describes the size of the crown of a tree (i.e., crown radius, [19]). The size of the smallest box (“lower cut-off”) was 10 cm in this study. This was selected based on a very liberal estimate of the maximum distance between two neighboring laser points at any given location in the tree because the “lower cut-off” must ensure that no box is empty due to missing data, i.e., it fits in the “unsampled” space of a scanned tree. The algorithm written in Mathematica 12.2 [94] for the computation of the Db metric is available online as Supplementary Materials.

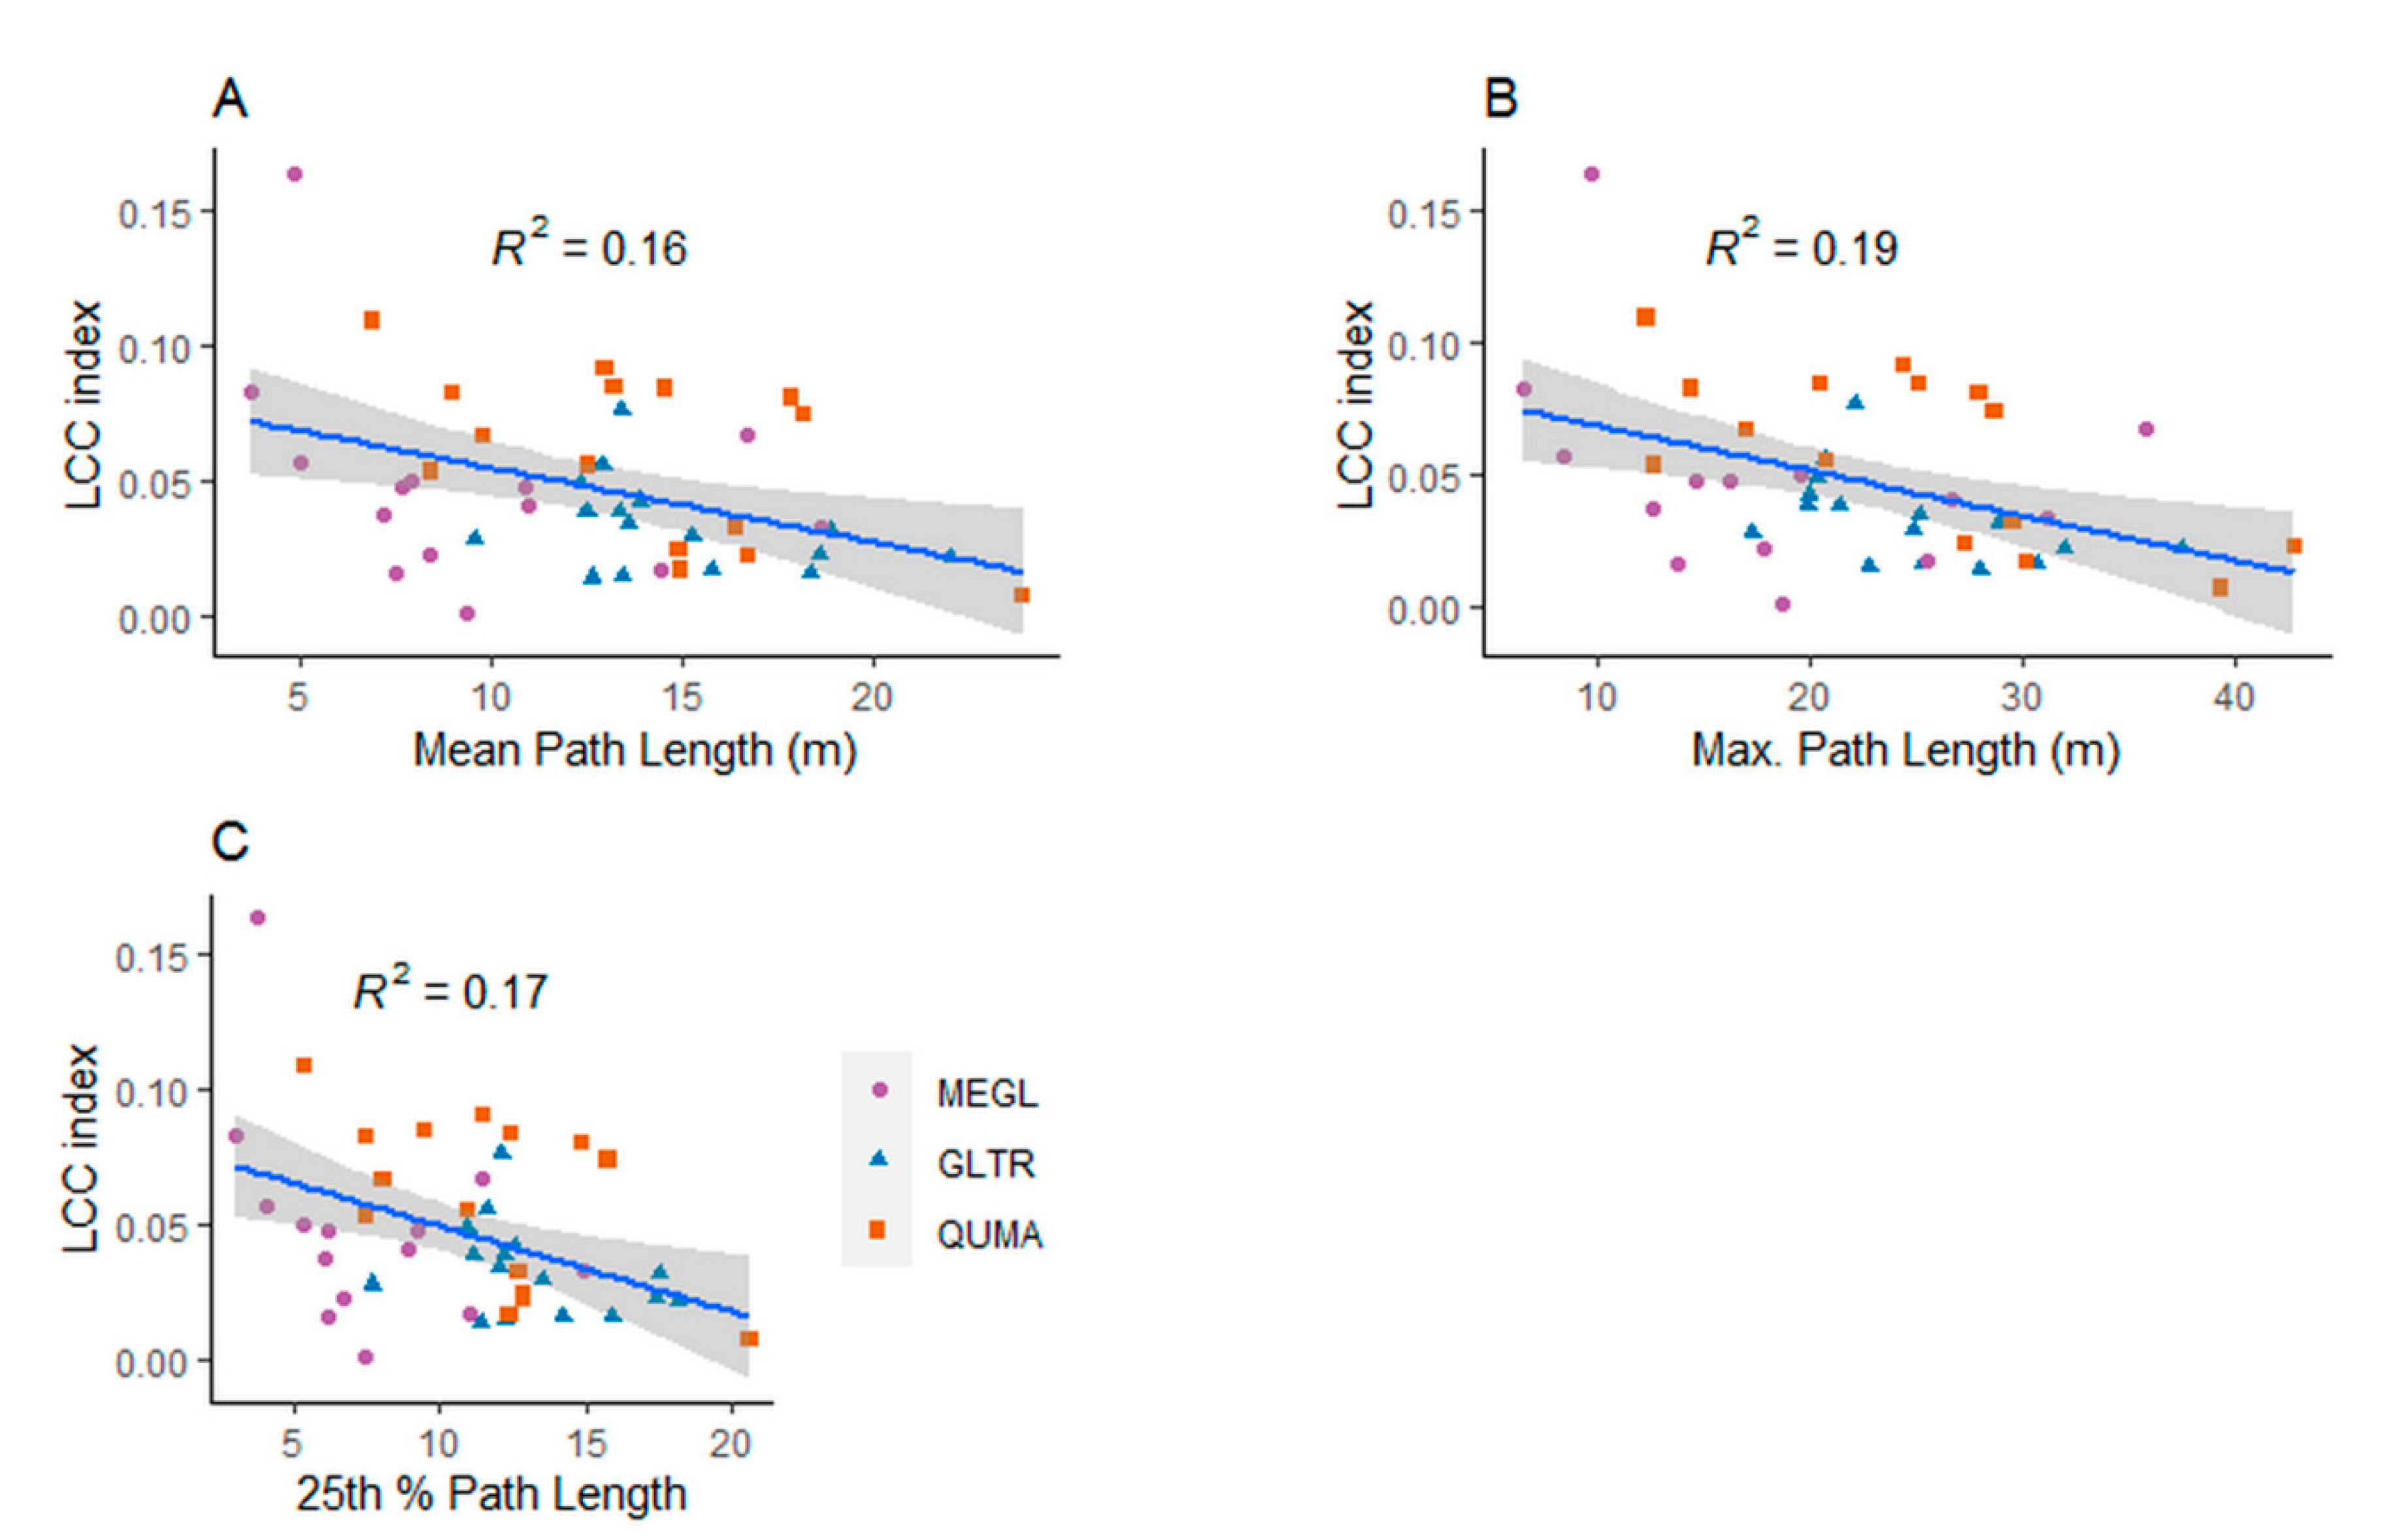
2.5. The LCC Difference Index and Error Metric Computation

The role of leaves in the above-ground structural complexity of the trees was quantified with the Leaf Complexity Contribution index
LCC = D b leaf . on D b leaf . off 1
where D b leaf . on is the box-dimension of the leaf-on point cloud of each study tree, and D b leaf . off is the box-dimension of the leaf-off point cloud of each study tree. If LCC = 0, the Db of the leaf-on and leaf-off point clouds of a tree are equal and there is no contribution of the leaves to the structural complexity of the tree. If LCC > 0, it means that the leaf-on Db of a tree is greater than the leaf-off Db of the tree, indicating that leaves increase tree structural complexity. Similarly, if LCC < 0, it means that the leaf-off Db of a tree is greater than the leaf-on Db of the tree, indicating that leaves reduce structural complexity, most likely because they occlude the woody components that are not adequately laser-scanned.
The effect of the artificial leaf removal using the TLSeparation algorithm on the structural complexity of each study tree was quantified with the percent relative error metric [95,96]
% R E = | D b lf . off D b lf . rm | D b lf . off × 100
where D b leaf . rm is the Db of the point cloud of each study tree after the artificial leaf removal.

2.6. Computation of Other Structural Metrics of Trees

We computed additional metrics that characterize the structure of trees to test our hypotheses regarding how the LCC index and the %RE relate to the above-ground tree architecture. According to major theories of tree structural complexity (i.e., pipe model theory [7]; metabolic scaling theory [11]), the “pipes” of the vascular system of a tree connect the roots to the leaves, with a surface area that scales with their volume [97]. Consequently, the structural complexity of the vascular structure of a tree depends on the length and diameter of its pipes [97,98]. Therefore, we expected that the LCC should relate to different metrics of the length of the paths from the base of a tree to each branch tip (e.g., the “path fraction” metric of Smith et al. [99]).
The algorithm TreeQSM v.2.3.0 [100] was used to produce quantitative structure models (QSMs) from the leaf-off point clouds of the trees. TreeQSM includes two main steps: (1) the point cloud segmentation into stem and branches based on cover sets and (2) the reconstruction of the volume and the surface area of the segments with cylinders [56,101]. The algorithm produced several QSMs for each tree point cloud based on a range of values for the minimum and maximum size of the cover sets and it finally determined the optimal QSM [67]. Based on the parameters of the optimal QSM, the algorithm produced 30 additional QSMs in order to estimate the variation of the modeled tree variables (e.g., woody surface area) because of the inherent stochasticity of the TreeQSM algorithm [67]. The algorithm separated the main stem from the branches of a tree based on the following criteria: (1) the main stem extends near the top of a tree, (2) it goes almost straight up, and (3) it is not too curved, which means that the ratio of the stem length to the stem base-tip distance must be the minimum among all candidate main stems; the branches were further categorized by branching order based on certain criteria for branch topology, branch length, and branch base-tip distance (P. Raumonen, personal communication, 2 June 2020).
From the optimal QSMs of the leaf-off point clouds of the study trees, their total woody surface area (the surface area outside of the bark tissues) was computed as the sum total surface area of the cylinders that were fitted to the point cloud of each tree. The total woody surface area of each tree was also separated into the main stem and the branch woody components.
“Path lengths” [99] were also used to create alternative structural metrics of the trees. The lengths of all paths from the stem base of a tree to all branch tips were computed from the lengths of the QSM cylinders, whose topological structure is preserved in a QSM. The distribution of the path lengths for each tree was computed, i.e., the percentiles of the path lengths (25th, 50th, and 75th percentiles), as well as minimum, maximum, and mean path lengths. Smith et al. [99] showed that relative path length variation is an intrinsic element of tree branching architecture relating to tree hydraulic conductance, volume, mechanical stability, and light interception.

2.7. Statistical Analyses

All statistical analyses for this study were carried out with custom coding and available packages written in the R software language [102].
Differences in the mean value of the Db of the trees for leaves-on versus -off, and leaves-artificially removed versus -off, were evaluated with t-tests, for each species separately (G. triacanthos, Q. macrocarpa, and M. glyptostroboides), and for all species combined. T-tests were also used to evaluate differences in the mean value of the LCC index, %RE, and Db of leaf-on, leaf-off, and leaf-removed tree point clouds between the study species. The “sma” function of the standardized major axis regression and testing routines (“smatr”) R package [103] was used to conduct hypothesis tests regarding the intercepts and the slopes of the species sub-population regression lines. In all statistical tests, significant differences were assessed at α = 5%.
The relationships between the leaf-on, leaf-off, and leaf-artificially removed Db values, and the relationships of the LCC index and the %RE with the tree structural metrics (see Section 2.6) were analyzed using linear regression analysis and relationship strength was quantified with the Pearson correlation coefficient (r); statistical significance was assessed at α = 5%.

3. Results

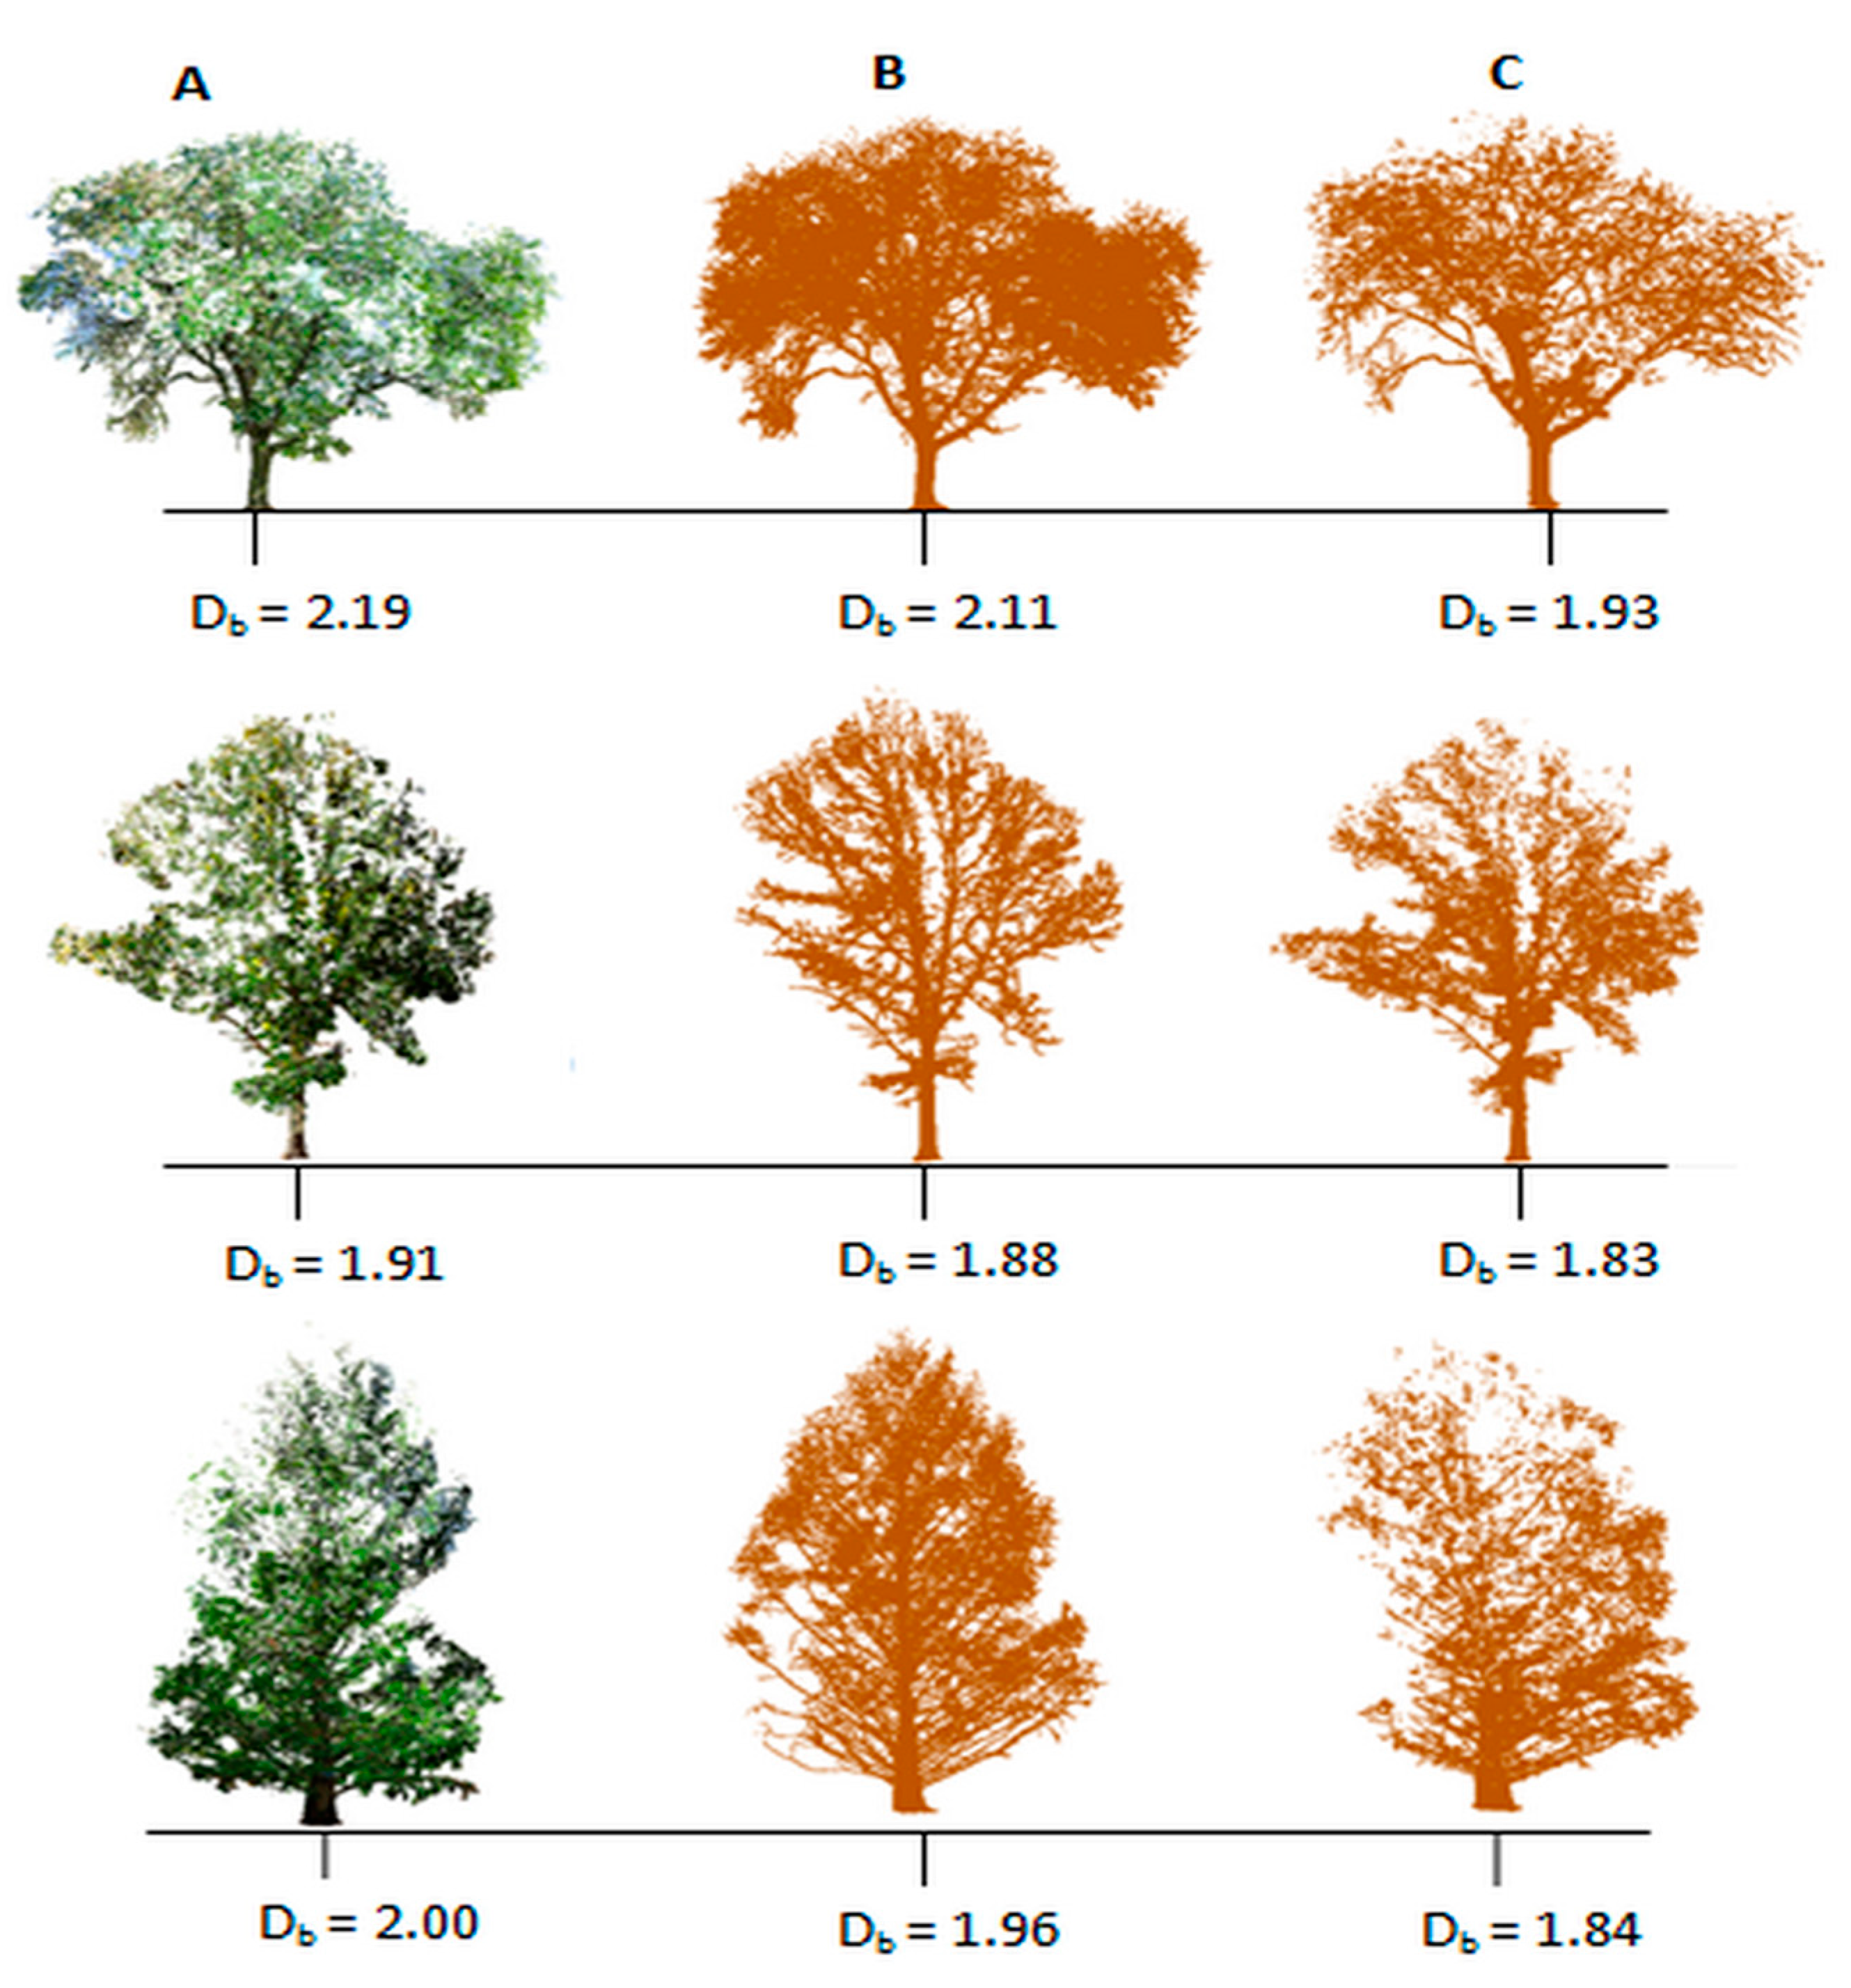
3.1. Structural Complexity of Leaf-On versus Leaf-Off Tree Point Clouds

The data show that the study trees varied widely in size (DBH and height) and structural complexity (Table 1). There was significant difference between the mean Db of the leaf-on tree point clouds of the G. triacanthos (GLTR) and Q. macrocarpa (QUMA) species (p = 0.0194). However, no significant difference was found between the mean Db of the leaf-on tree point clouds of the G. triacanthos (GLTR) and M. glyptostroboides (MEGL) trees (p > 5%), or for the MEGL and QUMA trees (p > 5%). Significant differences were found between the mean Db values of the leaf-off tree point clouds of QUMA and MEGL trees (p = 0.0335), GLTR and QUMA trees (p < 0.001), and MEGL and GLTR trees (p = 0.041).
T-tests showed that the mean Db of the leaf-on tree point clouds was significantly greater than the mean Db of the leaf-off tree point clouds (Figure 3) across all study tree species combined (p < 0.001), and for each species separately (GLTR: p = 0.0145; QUMA: p < 0.001; MEGL: p = 0.003). Positive relationships were found between the leaf-on and the leaf-off Db values of the trees across all species combined (Pearson’s r = 0.72, p < 0.001) and for the GLTR (Pearson’s r = 0.91, p < 0.001) and QUMA species (Pearson’s r = 0.6, p = 0.019) (Figure 4). The relationship between the leaf-on and the leaf-off Db values for the MEGL trees was not significant (Pearson’s r = 0.52, p = 0.055); however, all data points were above the 1:1 line indicating that the Db of the MEGL leaf-on point clouds was clearly greater than the Db of the MEGL leaf-off point clouds, except one tree with an LCC index close to zero (LCC = 0.00064) (Figure 4D).
The LCC index ranged between 0.00064 and 0.16394 across all trees combined (see Table 1), indicating a significant reduction in the structural complexity of deciduous tree crowns when leaves are shed. The mean LCC index value was significantly different between GLTR (mean LCCGLTR = 0.03273) and QUMA (mean LCCQUMA = 0.05867) trees (p = 0.0261). However, the mean LCC index value was not significantly different between QUMA and MEGL (mean LCCMEGL = 0.04864) trees (p = 0.4559), or between GLTR and MEGL trees (p = 0.181).
The LCC index was negatively correlated with the branch woody surface area of the study trees (Pearson’s r = −0.4, p = 0.0061), but it was not correlated with their stem woody surface area (p = 0.16) (Figure 5). The “outlier” MEGL data point in Figure 5 (point with LCC > 0.15) did not drive the observed relationship because the pattern did not change after the removal of this data point.
Finally, the LCC index was negatively correlated with different path length variables, i.e., mean path length (Pearson’s r = −0.4, p = 0.0068), maximum path length (Pearson’s r = −0.44, p = 0.0025), and the 25th percentile of path lengths (Pearson’s r = −0.41, p = 0.0051) (Figure 6). The “outlier” MEGL data point in Figure 6 (point with LCC > 0.15 in each graph) did not drive the observed relationships because the patterns did not change after the removal of this data point.

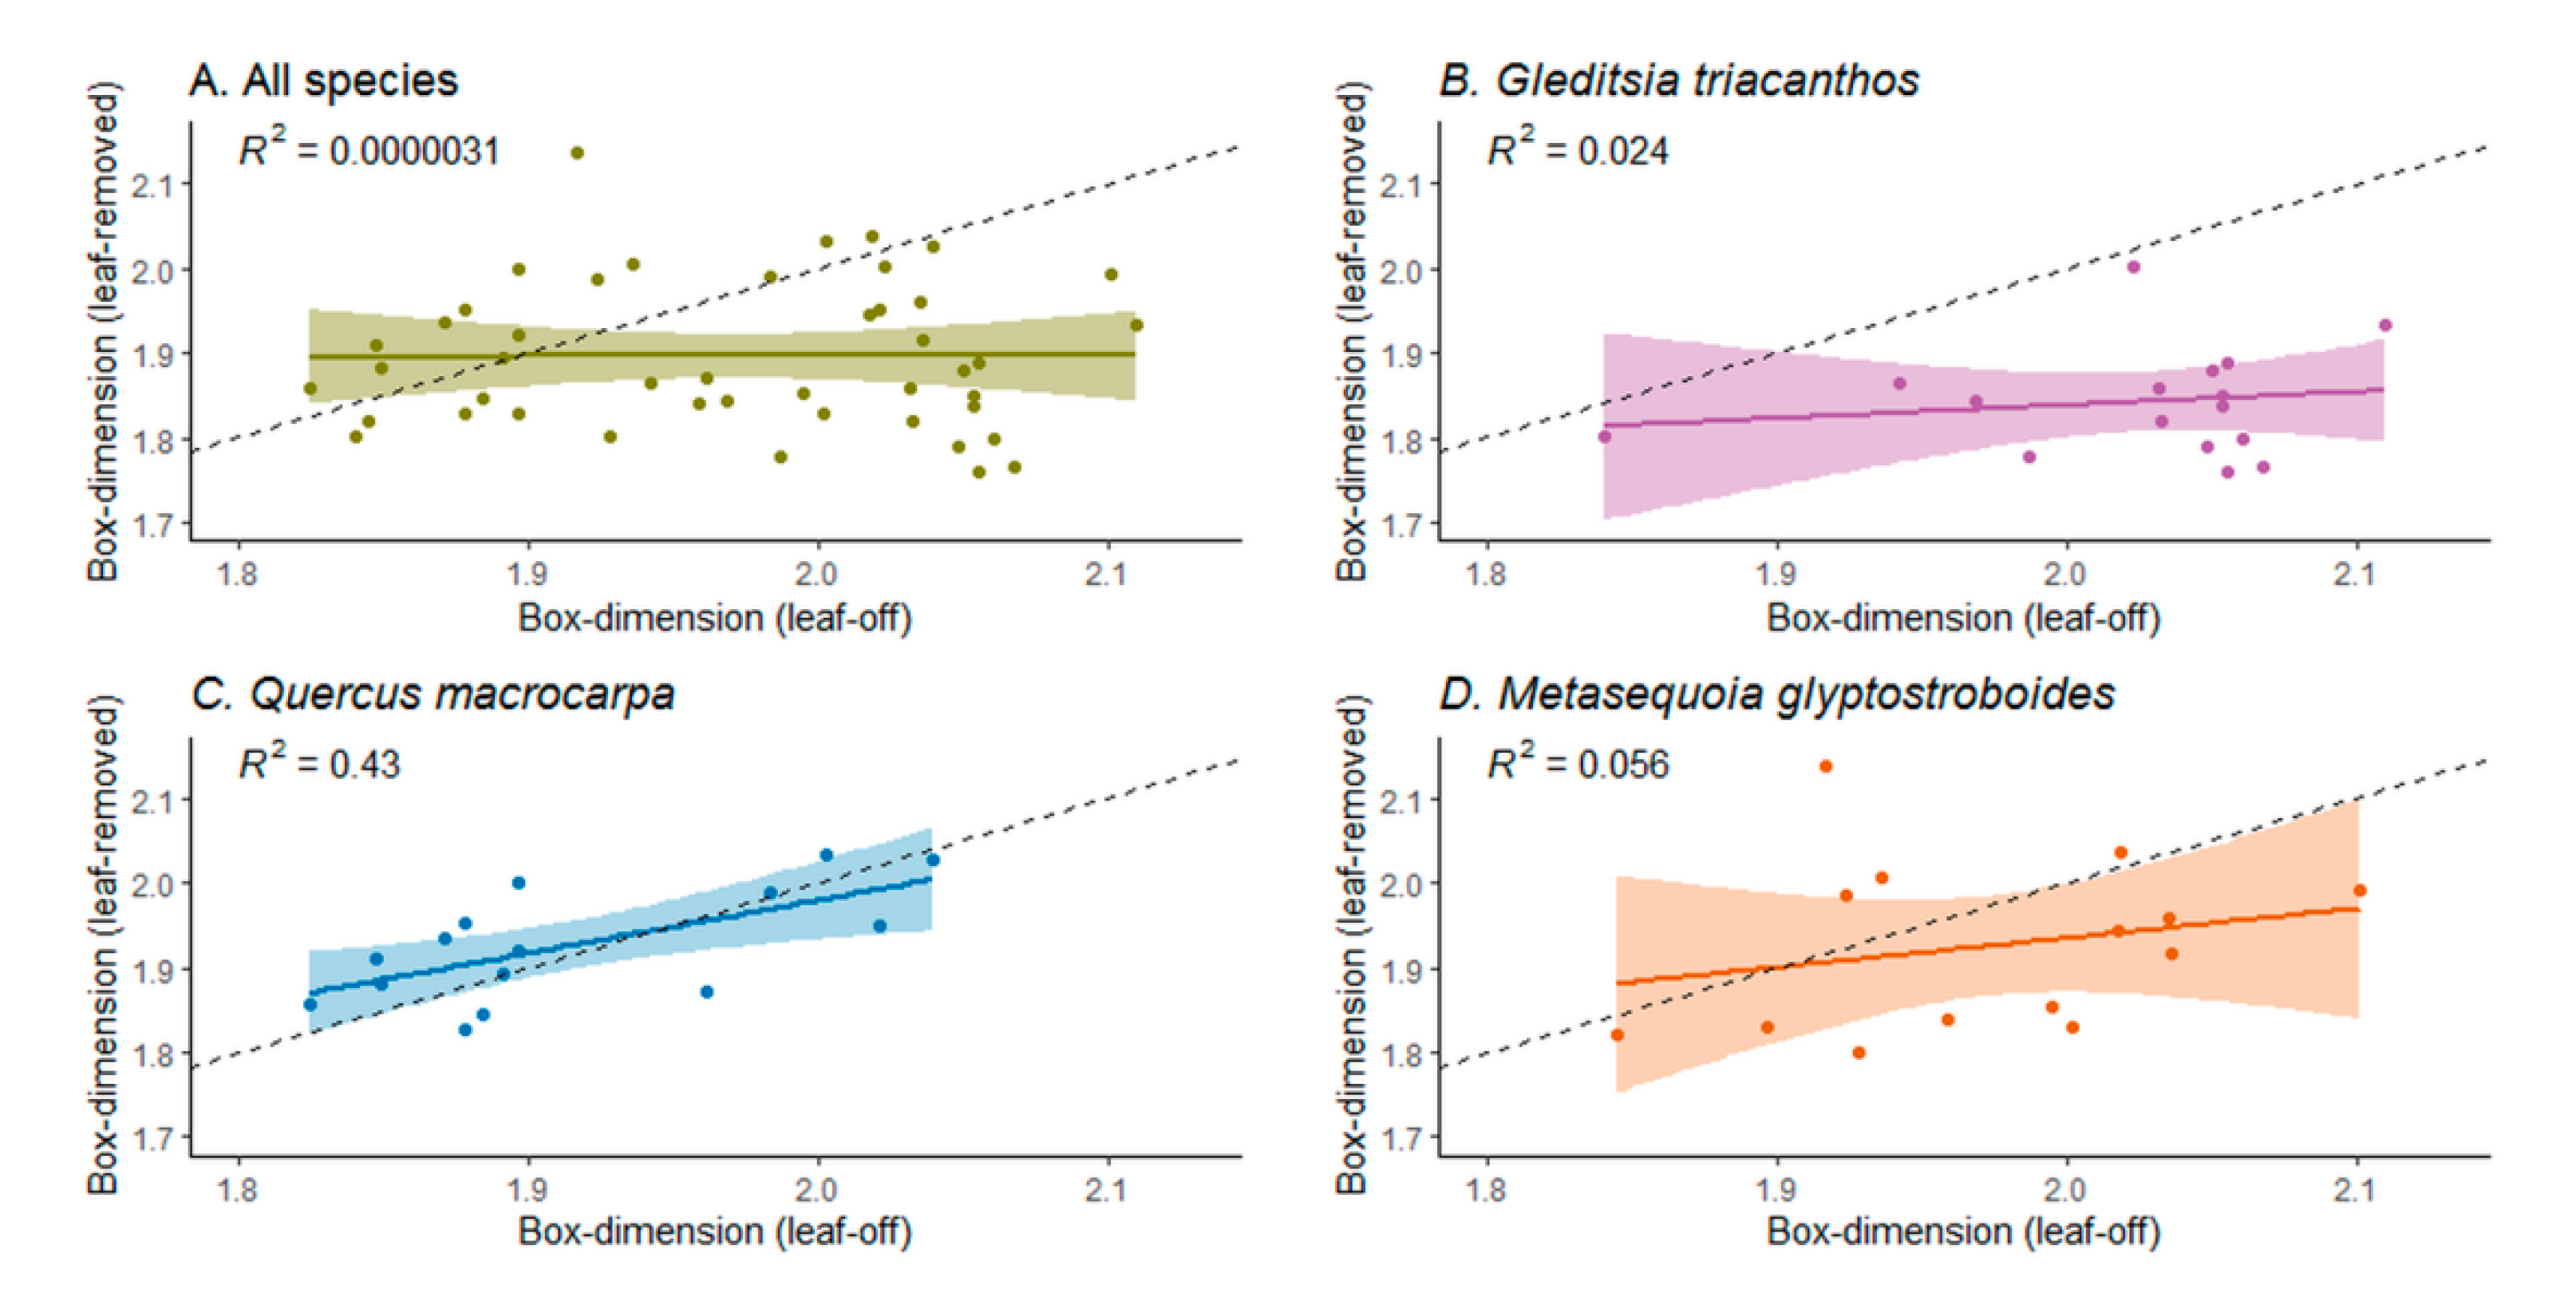
3.2. Box-Dimension of Leaf-Off versus Leaf-Removed Tree Point Clouds

Significant differences were found between the mean Db values of the tree point clouds after the artificial leaf removal for QUMA and GLTR trees (p = 0.001), and GLTR and MEGL trees (p = 0.0105), but no significant difference was found between the mean Db of the MEGL and QUMA trees after the artificial leaf removal (p = 0.9662).
T-tests showed that the mean Db of the leaf-off tree point clouds was significantly greater than the mean Db of the leaf-removed tree point clouds across all study tree species combined (p < 0.001), and for the GLTR trees (p < 0.001). No significant difference was found between the mean Db of the leaf-off and leaf-removed point clouds for the QUMA trees (p = 0.6382), or the MEGL trees (p = 0.1622). Furthermore, the leaf-removed and the leaf-off Db values of the QUMA trees were positively correlated (Pearson’s r = 0.65, p = 0.0082), but no significant relationship was found between the leaf-removed and the leaf-off Db values across all study tree species combined (p > 5%), or for the GLTR and MEGL trees (p > 5%) (Figure 7). The standardized major axis tests showed that the intercept and the slope of the regression line of the QUMA trees was not statistically different from the 0 and 1 values, respectively.
The mean Db of the leaf-on tree point clouds was significantly greater than the mean Db of the leaf-removed tree point clouds (Figure 3) across all study tree species combined (p < 0.001), and for each species separately (GLTR, QUMA, MEGL: p < 0.001).
The mean %RE value was significantly different between GLTR (mean %REGLTR = 8.91%) and MEGL (mean %REMEGL = 5.06%) trees (p = 0.0057), and between GLTR and QUMA (mean %REQUMA = 2.43%) trees (p < 0.001), and also between MEGL and QUMA trees (p = 0.0064).
The %RE was positively correlated with the maximum branch order of the GLTR trees (Pearson’s r = 0.53, p = 0.033), but it was not correlated with the maximum branch order of the QUMA and MEGL trees (p > 5%) (Figure 8).

4. Discussion

4.1. Structural Complexity of Urban Trees

This study measured the Db of the above-ground components of tree architecture (i.e., main stem, branching network, and leaves) from TLS point clouds, to determine the above-ground structural complexity of trees growing in urban areas. Db can help to understand how trees maximize resources uptake for their growth while maintaining their mechanical stability [13,90,93]. From an evolutionary perspective, trees have had to develop an “adaptive” geometry [104] to optimize light capture and minimize self-shading [18,91,92], while balancing with other competing functions, such as maintaining mechanical stability [77] and resisting drought [36]. Open-grown trees are relatively free from light competition due to having fewer tree neighbors [77], so they are more likely to be able to maximize their structural complexity and express their inherent fractal-like architecture than trees growing in forests or plantations [17]. The urban open-grown trees in this study were not directly influenced by shading from neighboring trees or from the relatively short buildings that were near to some of the trees. Db is sensitive to the external shape and the internal structure of trees [90,93], so differences in Db can capture meaningful differences in tree architecture and physiological function. Therefore, it is important to consider what the maximum structural complexity could be.
Seidel et al. [90] hypothesized that trees should have Db values significantly lower than 2.72, which is the Db of the Menger sponge (a mathematical object with the greatest surface to volume ratio, [105]), assuming a tree would maximize its surface area for light capture and gas exchange, while minimizing building costs, in the absence of competition with other plants. In previous studies that quantified the above-ground complexity of trees growing in dense rural forest stands, leaf-on Db values were consistently lower than 2 [13,19,89,90,93,106]. In this study, the mean Db of the leaf-on tree point clouds was greater than 2 across all study tree species (see Table 1), indicating a possible structural difference between trees in rural versus urban areas. However, rural forest trees growing in more open conditions and facing less competition for light (e.g., in forest gaps and in thinned forest stands), also had larger Db values [13,19,106], in some cases exceeding 2 [107]. This suggests a benefit to having an increased Db with more light and fewer neighbors, but at some level the energy benefits from increased photosynthesis would be minimized due to a high level of self-shading [90]. This supports MacFarlane et al.’s [17] assumption that trees growing in the open, without competition, can more closely approach the theoretical maximum Db (as characterized in Seidel et al. [90]). In this study, the maximum Db value observed was 2.23, for a large specimen of M. glyptostroboides in the leaf-on condition (Table 1). So, even the largest, open-grown, urban trees in this study were well below the theoretical maximum of 2.72.

4.2. The Role of Leaves in the Structural Complexity of Deciduous Trees

The urban trees studied here were deciduous species, characterized by distinct leaf phenological changes (i.e., leaf-on and leaf-off periods), which are typically affected by sharp photoperiodic and temperature changes [108,109]. In general, the outline shape and the texture of leaves can have fractal-like patterns [86,87,88,110,111,112,113,114,115,116], and thus, we expected that the presence of leaves would increase the total structural complexity of trees. Indeed, the study trees were shown to have statistically different structural complexity in the leaf-on and leaf-off periods (Figure 4) because the presence of leaves implies greater dispersion of laser points in the leaf-on point clouds compared to the leaf-off point clouds and more boxes are required to capture them, which results in greater value for the Db metric and greater structural complexity [13,89,90]. In a previous study, the difference between the Db of the leaf-on and leaf-off point clouds of forest-grown trees was not significant [89]. However, that study followed a mixed approach to generate leaf-off point clouds. More specifically, from the 76 leaf-off point clouds, only 15 point clouds were captured during the leaf-off period and the remaining leaf-off point clouds were created after manual segmentation of leaves from the leaf-on point clouds [89].
The magnitude of change in Db observed in this study was relatively small; the LCC index ranged from 0.00064 to 0.16394 across all species combined, indicating that the largest portion of the total above-ground structural complexity of a tree comes from woody components, e.g., branches. However, Db is constrained to have values between one and three, so a small change in its value can have significant physiological implications. Seidel et al. [90] found that the crown surface area divided by the woody volume of trees increased as a power function of leaf-on Db, so that, for example, an increase of 0.2 units in leaf-on Db resulted in approximately 40 units of increase in crown surface area relative to the woody volume of trees. Similarly, the results here in this study show that a small change in the structural complexity has important implications for urban trees. An increase of approximately 0.05 units in the LCC index was associated with approximately 400 m2 reduction in the branch woody surface area of the study trees (Figure 5). Such a change could have important implications for the mechanical stability of trees, i.e., the branch woody surface area affects the bending moments due to wind drag [30,79,117], for the maintenance respiration of trees that relates to their woody surface area [118,119,120,121,122], and for solar radiation and rainfall interception [123].
Differences in the LCC index were related to other structural metrics of the trees, showing different changes in the Db value, with and without leaves, for different types of trees. The negative relationships between the LCC index and the branch surface area and the path length metrics indicate that larger trees, with larger and more “branchy” crowns, have a relatively smaller contribution of leaves to structural complexity (Figure 5 and Figure 6). These results can be interpreted within the framework of the pipe model theory [7] and the West–Brown–Enquist or WBE model [11,124], which explain the fractal-like architecture of trees by assuming a vascular tree structure consisting of pipes [11]. According to these theories, as the size (i.e., woody surface area or length) of the pipes of the vascular system of a tree increases, the structural complexity of the woody skeleton of the tree also increases.
Differences in species branching architecture and leaf structure could also explain some of the observed differences in leaf-on versus leaf-off Db values because the fractal architecture of urban tree crowns is influenced by both crown and leaf shape [36]. G. triacanthos trees had the smallest contribution of the leaves to the structural complexity (smallest LCC). According to Niinemets and Valladares [125], G. triacanthos is the least shade tolerant of the three species studied (shade tolerance index for G. triacanthos = 1.61, Q. macrocarpa = 2.71, and M. glyptostroboides = 3). Species which are very shade tolerant distribute their leaves more evenly within their crown volume [36], whereas species that are less shade tolerant, e.g., G. triacanthos, have their leaves widely spaced mainly in the crown periphery, in order to increase crown porosity and reduce local self-shading [91]. Furthermore, it has been suggested that inter-canopy variation of leaf traits is predominantly affected by the exposure of leaves to light, which makes the sun leaves that are distributed in the crown periphery smaller, with greater leaf mass per unit area compared to the crown-interior leaves, in order to reduce water loss through transpiration [91,92]. Therefore, the uneven distribution of leaves in the crown volume of the G. triacanthos trees, most of which are small sun leaves in the crown top, could explain why the contribution of leaves in the overall structural complexity was the smallest when compared to Q. macrocarpa and M. glyptostroboides trees.

4.3. The Effect of the Leaf Separation Algorithm on the Structural Complexity of the Trees

Very often, one is unable to laser-scan trees during the leaf-off conditions, either because they are evergreen or due to logistical constraints. Therefore, one of the goals of this study was to explore the effect of artificial leaf removal from leaf-on point clouds. Separating the woody component from the foliage of tree point clouds using classification algorithms is a challenging task. Zhu et al. [126], for example, found a significant overestimation in the leaf area index of trees because of the woody material in tree point clouds.
There are different algorithms and approaches to separate leaves from the woody structure of tree point clouds [80,81,82,83], but there is no single best solution that fits for all point classification cases in forests [80]. Some of the factors that influence the classification results are the following: heterogeneity of point cloud density, varying scanner configurations, and scanning protocols [80]. The TLSeparation algorithm, which was used here, does not depend on a specific scanner [81], and we tried to minimize the occlusion effects in the point clouds in this study by scanning each tree from multiple directions and distances at high scanning resolution, following the field scanning protocols suggested by Wilkes et al. [69]. The performance of leaf separation algorithms is significantly decreased by occlusion [81], but explicit accounting of this error source is challenging because we don’t have complete control over it, and different types of error can be correlated [95].
Errors in characterization of crown architecture should relate to leaf morphology [80]. Wang et al. [83] suggest that leaves are typically detected as simple, flat structures and, therefore, the oblong leaf shape or the modular structure of compound leaves might confuse the classification algorithms. Indeed, our results indicate that the TLSeparation algorithm can be more accurate in identifying simple flat leaves, but had more difficulty separating twigs and fine branches from compound leaves. The Q. macrocarpa trees showed no statistical difference in mean Db of the leaf-off and leaf-removed point clouds and this species has simple leaves with a single flat and lobbed blade (or lamina) [127], which is associated with important leaf physiological functions, e.g., convection heat dissipation, efficient light interception, and reduced leaf hydraulic resistance [91,111]. The TLSeparation algorithm [85] appears to have miss-classified many points of the woody structure as leaves for the G. triacanthos trees, which have compound leaves with a modular architecture, because the leaf blade consists of several leaflets stemming from the leaf rachis [128,129]. The TLSeparation algorithm added significant noise into characterizations of Db in M. glyptostroboides trees, which are deciduous gymnosperms and have oblong-shaped needles and branches that are either horizontal or curved upward [130]. We might expect the accuracy of the TLSeparation algorithm for needle-leaved trees to be lower compared with the classification accuracy of broad-leaved trees because needles are linear and it is difficult to resolve an individual needle due to its small size and the dense foliage of conifers [81,83]. In a previous study, it was found that artificial leaf removal using a different leaf separation algorithm (i.e., LeWoS algorithm) resulted in the underestimation of the total woody volume of trees in the generated QSMs, while only the stems and some large branches were detected in coniferous trees [83].
As was originally hypothesized, the percent relative error in the estimated structural complexity of the G. triacanthos trees, after artificial leaf removal, was related to the branching architecture of the trees. More specifically, trees of this species with higher maximum branch order had greater %RE values, indicating that the presence of more bifurcations (branching nodes) and smaller branches of higher order can reduce the accuracy of the TLSeparation algorithm to classify the leaves and the woody parts. Indeed, increased branch bifurcation and angulation result in increased occlusion in the point clouds of trees that reduces the accuracy of the leaf-classification algorithm [82]; in a previous study the point density of woody structures decreased for higher branch orders and, therefore, many points were miss-classified as leaves [83]. The %RE values of the M. glyptostroboides and Q. macrocarpa trees were not related to their maximum branch order, presumably because the leaf removal algorithm did not significantly affect the accuracy of the Db of the Q. macrocarpa and M. glyptostroboides trees on average according to the t-tests, although the Db of the M. glyptostroboides trees after the artificial leaf removal was imprecise.

5. Conclusions

This study used terrestrial laser scanning (TLS) to further refine our understanding of the above-ground structural complexity of urban trees by separating the effect of leaves from the effect of the woody skeleton. Differences in leaf-on versus leaf-off structural complexity likely relate to different functional traits of trees for light capture optimization, reduction of self-shading, and mechanical stability. As such, this study provides evidence that differences in the contribution of leaves to tree structural complexity could be an important indicator of where the plant lies on a “structural economics spectrum (SES)”, which explains species structural diversity in terms of tree architectural traits along a spectrum balancing light interception, carbon allocation, and mechanical stability [131]. However, more species belonging to different functional groups must be included in future studies in order to further examine differences in the LCC, or a similar index, as part of the SES. This study provided evidence, along with previous studies [80,83], that the accuracy of leaf separation algorithms is affected by the leaf shape and type, but also that bias in the estimation of the above-ground structural complexity of trees after the artificial leaf removal depends on the branching architecture.

Supplementary Materials

Available online at https://www.mdpi.com/article/10.3390/rs13142773/s1 can be found the aim and purpose, applicability, theory and background, and the full code of the box-dimension algorithm for one or multiple data files.

Author Contributions

G.A. and D.W.M. conceived the ideas and designed the methodology for the study; G.A., D.W.M. and D.S. analyzed the data; G.A., D.W.M. and D.S. led the writing of the manuscript. D.S. wrote the description of the algorithm that computes tree box dimension. All authors have read and agreed to the published version of the manuscript.

Funding

This work was partially supported with funds from a joint venture agreement between Michigan State University and the United States Department of Agriculture Forest Service, Forest Inventory and Analysis Program, Northern Research Station. Part of D.W. MacFarlane’s time was paid for with funds from Michigan AgBioResearch, the USDA National Institute of Food and Agriculture. Part of G. Arseniou’s time was supported by a Bouyoukos Fellowship. Part of D. Seidel’s time was supported by the German Research Foundation (DFG) through the grant SE2383/7-1.

Data Availability Statement

The data presented in this study are available on request from the corresponding author.

Acknowledgments

We want to acknowledge the Michigan State University Campus Arboretum (Frank W. Telewski, and Jeffrey Wilson) and the Michigan State University Department of Infrastructure, Planning and Facilities (Jerry Wahl) who permitted and assisted with the data collection.

Conflicts of Interest

The authors declare no conflict of interest.

References

  1. Mäkelä, A.; Valentine, H.T. Crown ratio influences allometric scaling in trees. Ecology 2006, 87, 2967–2972. [Google Scholar] [CrossRef]
  2. Mäkelä, A. Implications of the pipe model theory on dry matter partitioning and height growth in trees. J. Theor. Biol. 1986, 123, 103–120. [Google Scholar] [CrossRef]
  3. Noordwijk, V.M.; Mulia, R. Functional branch analysis as tool for fractal scaling above- and belowground trees for their additive and non-additive properties. Ecol. Model. 2002, 149, 41–51. [Google Scholar] [CrossRef]
  4. Mandelbrot, B.B. The Fractal Geometry of Nature; W. H. Freeman: New York, NY, USA, 1977. [Google Scholar]
  5. Halley, J.M.; Hartley, S.; Kallimanis, A.S.; Kunin, W.E.; Lennon, J.J.; Sgardelis, S.P. Uses and abuses of fractal methodology in ecology. Ecol. Lett. 2004, 7, 254–271. [Google Scholar] [CrossRef]
  6. Malhi, Y.; Jackson, T.; Bentley, L.P.; Lau, A.; Shenkin, A.; Herold, M.; Calders, K.; Bartholomeus, H.; Disney, M.I. New perspectives on the ecology of tree structure and tree communities through terrestrial laser scanning. Interface Focus 2018, 8, 20170052. [Google Scholar] [CrossRef] [Green Version]
  7. Shinozaki, K.; Yoda, K.; Hozumi, K.; Kira, T. A quantitative analysis of plant form-the pipe model theory. I & II. Jpn. J. Ecol. 1964, 14, 133–139. [Google Scholar]
  8. Chiba, Y. Architectural analysis of relationship between biomass and basal area based on pipe model theory. Ecol. Model. 1998, 108, 219–225. [Google Scholar] [CrossRef]
  9. Lehnebach, R.; Beyer, R.; Letort, V.; Heuret, P. The pipe model theory half a century on: A review. Ann. Bot. 2018, 121, 773–795. [Google Scholar] [CrossRef] [PubMed]
  10. Valentine, H.T. Tree-growth models: Derivations employing the pipe-model theory. J. Theor. Biol. 1985, 117, 579–585. [Google Scholar] [CrossRef]
  11. West, G.B.; Brown, J.H.; Enquist, B. A General Model for the Origin of Allometric Scaling Laws in Biology. Science 1997, 276, 122–126. [Google Scholar] [CrossRef]
  12. Eloy, C. Leonardo’s Rule, Self-Similarity, and Wind-Induced Stresses in Trees. Phys. Rev. Lett. 2011, 107, 258101. [Google Scholar] [CrossRef] [PubMed] [Green Version]
  13. Seidel, D. A holistic approach to determine tree structural complexity based on laser scanning data and fractal analysis. Ecol. Evol. 2018, 8, 128–134. [Google Scholar] [CrossRef] [PubMed]
  14. Jonckheere, I.; Nackaerts, K.; Muys, B.; van Aardt, J.; Coppin, P. A fractal dimension-based modelling approach for studying the effect of leaf distribution on LAI retrieval in forest canopies. Ecol. Model. 2006, 197, 179–195. [Google Scholar] [CrossRef]
  15. Da Silva, D.; Boudon, F.; Godin, C.; Puech, O.; Smith, C.; Sinoquet, H. A Critical Appraisal of the Box Counting Method to Assess the Fractal Dimension of Tree Crowns. In Advances in Visual Computing. ISVC 2006; Lecture Notes in Computer Sciences; Springer Science and Business Media LLC: Berlin, Germany, 2006; Volume 4291, pp. 751–760. [Google Scholar]
  16. Metz, J.; Seidel, D.; Schall, P.; Scheffer, D.; Schulze, E.-D.; Ammer, C. Crown modeling by terrestrial laser scanning as an approach to assess the effect of aboveground intra- and interspecific competition on tree growth. For. Ecol. Manag. 2013, 310, 275–288. [Google Scholar] [CrossRef]
  17. MacFarlane, D.W.; Kuyah, S.; Mulia, R.; Dietz, J.; Muthuri, C.; Noordwijk, M.V. Evaluating a non-destructive method for calibrating tree biomass equations derived from tree branching architecture. Trees 2014, 28, 807–817. [Google Scholar] [CrossRef]
  18. Eloy, C.; Fournier, M.; Lacointe, A.; Moulia, B. Wind loads and competition for light sculpt trees into self-similar structures. Nat. Commun. 2017, 8, 1–12. [Google Scholar] [CrossRef]
  19. Dorji, Y.; Annighöfer, P.; Ammer, C.; Seidel, D. Response of beech (Fagus sylvatica L.) trees to competition—New insights from using fractal analysis. Remote Sens. 2019, 11, 2656. [Google Scholar] [CrossRef] [Green Version]
  20. Ferrini, F.; Bussotti, F.; Tattini, M.; Fini, A. Trees in the urban environment: Response mechanisms and benefits for the ecosystem should guide plant selection for future plantings. Agrochimica 2014, 58, 234–246. [Google Scholar] [CrossRef]
  21. Iakovoglou, V.; Thompson, J.R.; Burras, L. Characteristics of Trees According to Community Population Level and by Land use in the U.S. Midwest. J. Arboric. 2002, 28, 59. [Google Scholar]
  22. Kjelgren, R.K.; Clark, J.R. Microclimates and Tree Growth in Three Urban Spaces. J. Environ. Hortic. 1992, 10, 139–145. [Google Scholar] [CrossRef]
  23. Jensen, R.R.; Hardln, J.P. Hardln, A.J. Estimating Urban Leaf Area Index (LAI) of Individual Trees with Hyperspectral Data. Photogramm. Eng. Remote Sens. 2012, 78, 495–504. [Google Scholar] [CrossRef]
  24. Kostić, S.; Čukanović, J.; Orlović, S.; Ljubojević, M.; MladenoviĆ, E. Allometric Relations of Sycamore Maple (Acer pseudoplatanus) and its Red Leaf Cultivar (A. pseudoplatanus“Atropurpureum”) in Street and Park Habitats of Novi Sad (Serbia, Europe). J. For. 2019, 117, 114–127. [Google Scholar] [CrossRef]
  25. Lu, J.W.; Svenden, E.S.; Campbell, L.K.; Greenfeld, J.; Braden, J.; King, K.L.; Flaxa-Raymound, N. Biological, Social, and Urban Design Factors Affecting Young Street Tree Mortality in New York City. Cities Environ. 2010, 3, 1–16. [Google Scholar] [CrossRef]
  26. Moran, M.A. Influence of Adjacent Land Use on Understory Vegetation of New York Forests. Urban Ecol. 1984, 8, 329–340. [Google Scholar] [CrossRef]
  27. Krizek, D.T.; Dubik, S.P. Influence of Water Stress and Restricted Root Volume on Growth and Development of Urban Trees. J. Arboric. 1987, 13, 47–55. [Google Scholar]
  28. Rhoades, R.W.; Stipes, R.J. Growth of trees on the Virginia Tech campus in response to various factors. J. Arboric. 1999, 25, 211–215. [Google Scholar]
  29. Vogt, J.M.; Watkins, S.L.; Mincey, S.K.; Patterson, M.S.; Fischer, B.C. Explaining planted-tree survival and growth in urban neighborhoods: A social–ecological approach to studying recently-planted trees in Indianapolis. Landsc. Urban Plan. 2015, 136, 130–143. [Google Scholar] [CrossRef] [Green Version]
  30. Pavlis, M.; Kane, B.; Harris, J.R.; Seiler, J.R. The Effects of Pruning on Drag and Bending Moment of Shade Trees. Arboric. Urban For. 2008, 34, 207–215. [Google Scholar]
  31. Bourbia, F.; Boucheriba, F. Impact of street design on urban microclimate for semi arid climate (Constantine). Renew. Energy 2010, 35, 343–347. [Google Scholar] [CrossRef]
  32. Nowak, D.J.; Greenfield, E.J. The increase of impervious cover and decrease of tree cover within urban areas globally (2012–2017). Urban For. Urban Green. 2020, 49, 126638. [Google Scholar] [CrossRef]
  33. Gregg, J.W.; Jones, C.; Dawson, T.E. Urbanization effects on tree growth in the vicinity of New York City. Nat. Cell Biol. 2003, 424, 183–187. [Google Scholar] [CrossRef]
  34. Iakovoglou, V.; Thompson, J.; Burras, L.; Kipper, R. Factors related to tree growth across urban-rural gradients in the Midwest, USA. Urban Ecosyst. 2001, 5, 71–85. [Google Scholar] [CrossRef]
  35. McHale, M.R.; Burke, I.C.; Lefsky, M.A.; Peper, P.J.; McPherson, E.G. Urban Forest biomass estimates: Is it important to use allometric relationships developed specifically for urban trees? Urban Ecosyst. 2009, 12, 95–113. [Google Scholar] [CrossRef]
  36. Arseniou, G.; MacFarlane, D.W. Fractal dimension of tree crowns explains species functional-trait responses to urban environments at different scales. Ecol. Appl. 2021, 31, e2297. [Google Scholar] [CrossRef] [PubMed]
  37. Tigges, J.; Tobia Lakes, T. High resolution remote sensing for reducing uncertainties in urban forest carbon offset life cycle assessments. Carbon Balance Manag. 2017, 12, 1–18. [Google Scholar] [CrossRef] [Green Version]
  38. MacFarlane, D.W. Potential availability of urban wood biomass in Michigan: Implications for energy production, carbon sequestration and sustainable forest management in the USA. Biomass Bioenergy 2009, 33, 628–634. [Google Scholar] [CrossRef]
  39. McPherson, E.G. Atmospheric carbon dioxide reduction by Sacramento’s urban forest. J. Arboric. 1998, 24, 215–223. [Google Scholar]
  40. Nowak, D.J.; Crane, D.E. Carbon storage and sequestration by urban trees in the USA. Environ. Pollut. 2002, 116, 381–389. [Google Scholar] [CrossRef]
  41. Casalegno, S.; Anderson, K.; Hancock, S.; Gaston, K.J. Improving models of urban greenspace: From vegetation surface cover to volumetric survey, using waveform laser scanning. Methods Ecol. Evol. 2017, 8, 1443–1452. [Google Scholar] [CrossRef] [Green Version]
  42. McPherson, E.G.; Nowak, J.D.; Rowan, A.R. (Eds.) Chicago’s Urban Forest Ecosystem: Results of the Chicago Urban Forest Climate Project; Gen. Tech. Rep. NE-186; U.S. Department of Agriculture, Forest Service, Northeastern Forest Experiment Station: Radnor, PA, USA, 1994; p. 201. [Google Scholar]
  43. Nowak, D.J. Estimating leaf area and leaf biomass of open-grown deciduous urban trees. For. Sci. 1996, 42, 504–507. [Google Scholar]
  44. Heisler, G.M. Energy Savings with Trees. J. Arboric. 1986, 12, 113–125. [Google Scholar]
  45. Zeide, B.; Gresham, C.A. Fractal dimensions of tree crowns in three loblolly pine plantations of coastal South Carolina. Can. J. For. Res. 1991, 21, 1208–1212. [Google Scholar] [CrossRef]
  46. Zeide, B.; Pfeifer, P. A Method for Estimation of Fractal Dimension of Tree Crowns. For. Sci. 1991, 37, 1253–1265. [Google Scholar]
  47. Calders, K.; Adams, J.; Armston, J.; Bartholomeus, H.; Bauwens, S.; Bentley, L.P.; Chave, J.; Danson, F.M.; Demol, M.; Disney, M.; et al. Terrestrial Laser Scanning in forest ecology: Expanding the horizon. Remote Sens. Environ. 2020, 251, 112102. [Google Scholar] [CrossRef]
  48. Hopkinson, C.; Chasmer, L.; Young-Pow, C.; Treitz, P. Assessing Forest metrics with a ground-based scanning lidar. Can. J. For. Res. 2004, 34, 573–583. [Google Scholar] [CrossRef] [Green Version]
  49. Maas, H.; Bienert, A.; Scheller, S.; Keane, E. Automatic forest inventory parameter determination from terrestrial laser scanner data. Int. J. Remote Sens. 2008, 29, 1579–1593. [Google Scholar] [CrossRef]
  50. Moskal, L.M.; Zheng, G. Retrieving Forest Inventory Variables with Terrestrial Laser Scanning (TLS) in Urban Heterogeneous Forest. Remote Sens. 2012, 4, 1–20. [Google Scholar] [CrossRef] [Green Version]
  51. Olschofsky, K.; Mues, V.; Köhl, M. Operational assessment of aboveground tree volume and biomass by terrestrial laser scanning. Comput. Electron. Agric. 2016, 127, 699–707. [Google Scholar] [CrossRef] [Green Version]
  52. Vonderach, C.; Vogtle, T.; Adler, P.; Norra, S. Terrestrial laser scanning for estimating urban tree volume and carbon content. Int. J. Remote Sens. 2012, 33, 6652–6667. [Google Scholar] [CrossRef]
  53. Béland, M.; Widlowski, J.L.; Fournier, R.A. A model for deriving voxel-level tree leaf area density estimates from ground-based LiDAR. Environ. Model. Softw. 2014, 51, 184–189. [Google Scholar] [CrossRef]
  54. Jung, S.-E.; Kwak, D.-A.; Park, T.; Lee, W.-K.; Yoo, S. Estimating Crown Variables of Individual Trees Using Airborne and Terrestrial Laser Scanners. Remote Sens. 2011, 3, 2346–2363. [Google Scholar] [CrossRef] [Green Version]
  55. Moorthy, I.; Millera, J.R.; Antonio Jimenez Bernic, J.; Zarco-Tejadac, P.; Hub, B.; Chend, J. Field characterization of olive (Olea europaea L.) tree crown architecture using terrestrial laser scanning data. Agric. For. Meteorol. 2011, 151, 204–214. [Google Scholar] [CrossRef]
  56. Calders, K.; Newnham, G.; Burt, A.; Murphy, S.; Raumonen, P.; Herold, M.; Culvenor, D.S.; Avitabile, V.; Disney, M.; Armston, J.D.; et al. Nondestructive estimates of above-ground biomass using terrestrial laser scanning. Methods Ecol. Evol. 2015, 6, 198–208. [Google Scholar] [CrossRef]
  57. Kankare, V.; Holocaine, M.; Vastaranta, M.; Puttonen, E.; Yu, X.; Hyyppä, J.; Vaaja, M.; Hyyppä, H.; Alho, P. Individual tree biomass estimation using terrestrial laser scanning. ISPRS J. Photogramm. Remote Sens. 2013, 75, 64–75. [Google Scholar] [CrossRef]
  58. Olagoke, A.; Proisy, C.; Féret, J.B.; Blanchard, E.; Fromard, F.; Mehling, U.; Menezes, M.M.D.; Santos, V.F.D.; Berger, U. Extended biomass allometric equations for large mangrove trees from terrestrial LiDAR data. Trees 2016, 30, 935–947. [Google Scholar] [CrossRef] [Green Version]
  59. Stovall, A.E.; Vorster, A.G.; Anderson, R.S.; Evangelista, P.H.; Shugart, H.H. Non-destructive aboveground biomass estimation of coniferous trees using terrestrial LiDAR. Remote Sens. Environ. 2017, 200, 31–42. [Google Scholar] [CrossRef]
  60. Tanhuanpää, T.; Kankare, V.; Setälä, H.; Yli-Pelkonen, V.; Vastaranta, M.; Niemi, M.T.; Raisio, J.; Holopainen, M. Assessing above-ground biomass of open-grown urban trees: A comparison between existing models and a volume-based approach. Urban For. Urban Green. 2017, 21, 239–246. [Google Scholar] [CrossRef] [Green Version]
  61. Zheng, Y.; Jia, W.; Wang, Q.; Huang, X. Deriving Individual -Tree Biomass from Effective Crown Data Generated by Terrestrial Laser Scanning. Remote Sens. 2019, 11, 2793. [Google Scholar] [CrossRef] [Green Version]
  62. Liang, X.; Kankare, V.; Hyyppä, J.; Wang, Y.; Kukko, A.; Haggrén, H.; Yu, X.; Kaartinen, H.; Jaakkola, A.; Guan, F.; et al. Terrestrial laser scanning in forest inventories. ISPRS J. Photogramm. Remote Sens. 2016, 115, 63–77. [Google Scholar] [CrossRef]
  63. Bournez, E.; Landes, T.; Saudreau, M.; Kastendeuch, P.; Najjar, G.; Bournez, E.; Landes, T.; Saudreau, M.; Kastendeuch, P.; Najjar, G. From TLS Point Clouds to 3D Models of Trees: A Comparison of Existing Algorithms for 3D Tree Reconstruction. ISPRS Int. Arch. Photogramm. Remote Sens. Spat. Inf. Sci. 2017, XLII-2/W3, 113–120. [Google Scholar] [CrossRef] [Green Version]
  64. Disney, M.I.; Vicari, M.B.; Burt, A.; Calders, K.; Lewis, S.L.; Raumonen, P.; Wilkes, P. Weighing trees with lasers: Advances, challenges and opportunities. Interface Focus 2018, 8, 20170048. [Google Scholar] [CrossRef] [PubMed] [Green Version]
  65. Hackenberg, J.; Spiecker, H.; Calders, K.; Disney, M.; Raumonen, P. SimpleTree—An Efficient Open Source Tool to Build Tree Models from TLS Clouds. Forests 2015, 6, 4245–4294. [Google Scholar] [CrossRef]
  66. Kaasalainen, S.; Krooks, A.; Liski, J.; Raumonen, P.; Kaartinen, H.; Kaasalainen, M.; Puttonen, E.; Anttila, K.; Mäkipää, R. Change Detection of Tree Biomass with Terrestrial Laser Scanning and Quantitative Structure Modelling. Remote Sens. 2014, 6, 3906–3922. [Google Scholar] [CrossRef] [Green Version]
  67. Raumonen, P.; Kaasalainen, M.; Åkerblom, M.; Kaasalainen, S.; Kaartinen, H.; Vastaranta, M.; Holopainen, M.; Disney, M.; Lewis, P. Fast automatic precision tree models from terrestrial laser scanner data. Remote Sens. 2013, 5, 491–520. [Google Scholar] [CrossRef] [Green Version]
  68. Lau, A.; Martius, C.; Bartholumeus, H.; Shenkin, A.; Jackson, T.; Malhi, Y.; Herold, M.; Bentley, L.P. Estimating architecture-based metabolic scaling exponents of tropical trees using terrestrial LiDAR and 3D modelling. For. Ecol. Manag. 2019, 439, 132–145. [Google Scholar] [CrossRef]
  69. Wilkes, P.; Lau, A.; Disney, M.; Calders, K.; Burt, A.; Tanago, J.G.; Bartholomeus, H.; Brede, B.; Herold, M. Data acquisition considerations for Terrestrial Laser Scanning of forest plots. Remote Sens. Environ. 2017, 196, 140–153. [Google Scholar] [CrossRef]
  70. Davison, S.; Donoghue, D.N.; Galiatsatos, N. The effect of leaf-on and leaf-off forest canopy conditions on LiDAR derived estimations of forest structural diversity. Int. J. Appl. Earth Obs. Geoinf. 2020, 92, 102160. [Google Scholar] [CrossRef]
  71. Anderson, R.S.; Bolstad, P.V. Estimating aboveground biomass and average annual wood biomass increment with airborne leaf-on and leaf-off LiDAR in Great Lakes forest types. North. J. Appl. For. 2013, 30, 16–22. [Google Scholar] [CrossRef]
  72. Bouvier, M.; Durrieu, S.; Fournier, R.A.; Renaud, J.-P. Generalizing predictive models of forest inventory attributes using an area-based approach with airborne LiDAR data. Remote Sens. Environ. 2015, 156, 322–334. [Google Scholar] [CrossRef]
  73. Hawbaker, T.J.; Gobakken, T.; Lesak, A.; Trømborg, E.; Contrucci, K.; Radeloff, V. Light detection and ranging-based measures of mixed hardwood forest structure. For. Sci. 2010, 56, 313–326. [Google Scholar]
  74. Villikka, M.; Packalén, P.; Maltamo, M. The suitability of leaf-off airborne laser scanning data in an area-based forest inventory of coniferous and deciduous trees. Silva Fenn. 2012, 46, 99–110. [Google Scholar] [CrossRef] [Green Version]
  75. Zeide, B. Fractal analysis of foliage distribution in loblolly pine crowns. Can. J. For. Res. 1998, 28, 114. [Google Scholar] [CrossRef]
  76. Jackson, T.; Shenkin, A.; Wellpott, A.; Calders, K.; Origo, N.; Disney, M.; Burt, A.; Raumonen, P.; Gardiner, B.; Herold, M.; et al. Finite element analysis of trees in the wind based on terrestrial laser scanning data. Agric. For. Meteorol. 2019, 265, 137–144. [Google Scholar] [CrossRef]
  77. MacFarlane, D.W.; Kane, B. Neighbour effects on tree architecture: Functional trade-offs balancing crown competitiveness with wind resistance. Funct. Ecol. 2017, 31, 1624–1636. [Google Scholar] [CrossRef] [Green Version]
  78. Antonarakis, A.; Richards, K.S.; Brasington, J.; Müller, E. Determining leaf area index and leafy tree roughness using terrestrial laser scanning. Water Resour. Res. 2010, 46. [Google Scholar] [CrossRef] [Green Version]
  79. Vollsinger, S.; Mitchell, S.J.; Byrne, K.E.; Novak, M.D.; Rudnicki, M. Wind tunnel measurements of crown streamlining and drag relationships for several hardwood species. Can. J. For. Res. 2005, 35, 1238–1249. [Google Scholar] [CrossRef]
  80. Moorthy, S.M.K.; Calders, K.; Vicari, M.B.; Verbeeck, H. Improved Supervised Learning-Based Approach for Leaf and Wood Classification from LiDAR Point Clouds of Forests. IEEE Trans. Geosci. Remote Sens. 2020, 58, 3057–3070. [Google Scholar] [CrossRef] [Green Version]
  81. Vicari, M.B.; Disney, M.; Wilkes, P.; Burt, A.; Calders, K.; Woodgate, W. Leaf and wood classification framework for terrestrial LiDAR point clouds. Methods Ecol. Evol. 2019, 10, 680–694. [Google Scholar] [CrossRef] [Green Version]
  82. Wang, D.; Brunner, J.; Ma, Z.; Lu, H.; Hollaus, M.; Pang, Y.; Pfeifer, N. Separating Tree Photosynthetic and Non-Photosynthetic Components from Point Cloud Data Using Dynamic Segment Merging. Forests 2018, 9, 252. [Google Scholar] [CrossRef] [Green Version]
  83. Wang, D.; Takoudjou, S.M.; Casella, E. LeWoS: A universal leaf-wood classification method to facilitate the 3D modelling of large tropical trees using terrestrial LiDAR. Methods Ecol. Evol. 2019, 11, 376–389. [Google Scholar] [CrossRef]
  84. Wang, D.; Hollaus, M.; Pfeifer, N. Feasibility of machine learning methods for separating wood and leaf points from terrestrial laser scanning data. ISPRS Ann. Photogramm. Remote Sens. Spat. Inf. Sci. 2017, IV-2/W4, 157–164. [Google Scholar] [CrossRef] [Green Version]
  85. Vicari, M.B. TLSeparation—A Python Library for Material Separation from Tree/Forest 3D Point Clouds. Available online: https://zenodo.org/record/1147706#.YOYIEJhKjIU (accessed on 7 July 2021). [CrossRef]
  86. Backes, A.R.; Bruno, O. Plant Leaf Identification Using Multi-scale Fractal Dimension. In Image Analysis and Processing. ICIAP 2009; Lecture Notes in Computer Science; Springer: Berlin/Heidelberg, Germany, 2009; Volume 5716, pp. 143–150. [Google Scholar]
  87. Borkowski, W. Fractal dimension based features are useful descriptors of leaf complexity and shape. Can. J. For. Res. 1999, 29, 1301–1310. [Google Scholar] [CrossRef]
  88. Hartvigsen, G. The analysis of leaf shape using fractal geometry. Am. Biol. Teach. 2000, 62, 664–669. [Google Scholar] [CrossRef]
  89. Guzmán, J.A.Q.; Sharp, I.; Alecanstro, F.; Sánchez-Azofeifa, G.A. On the relationship of fractal geometry and tree–stand metrics on point clouds derived from terrestrial laser scanning. Methods Ecol. Evol. 2020, 11, 1309–1318. [Google Scholar] [CrossRef]
  90. Seidel, D.; Annighöfer, P.; Stiers, M.; Zemp, C.D.; Burkardt, K.; Ehbrecht, M.; Willim, K.; Kreft, H.; Hölscher, D.; Ammer, C. How a measure of tree structural complexity relates to architectural benefit-to-cost ratio, light availability, and growth of trees. Ecol. Evol. 2019, 9, 7134–7142. [Google Scholar] [CrossRef] [PubMed] [Green Version]
  91. Sack, L.; Melcher, P.; Liu, W.H.; Middleton, E.; Pardee, T. How strong is intracanopy leaf plasticity in temperate deciduous trees? Am. J. Bot. 2006, 93, 829–839. [Google Scholar] [CrossRef] [Green Version]
  92. Abrams, M.D.; Kubiske, M.E. Leaf structural characteristics of 31 hardwood and conifer tree species in central Wisconsin: Influence of light regime and shade-tolerance rank. For. Ecol. Manag. 1990, 31, 245–253. [Google Scholar] [CrossRef]
  93. Seidel, D.; Ehbrecht, M.; Dorji, Y.; Jambay, J.; Ammer, C.; Annighöfer, P. Identifying architectural characteristics that determine tree structural complexity. Trees 2019, 33, 911–919. [Google Scholar] [CrossRef]
  94. Wolfram Research, Inc. Mathematica; Version 12.2; Wolfram Research, Inc.: Champaign, IL, USA, 2020. [Google Scholar]
  95. Burt, A.; Vicari, M.B.; da Costa, A.C.L.; Coughlin, I.; Meir, P.; Rowland, L.; Disney, M. New insights into large tropical tree mass and structure from direct harvest and terrestrial lidar. R. Soc. Open Sci. 2021, 8, 201458. [Google Scholar] [CrossRef]
  96. Sileshi, G.W. A critical review of forest biomass estimation models, common mistakes and corrective measures. For. Ecol. Manag. 2014, 329, 237–254. [Google Scholar] [CrossRef]
  97. Enquist, B.J. Universal scaling in tree and vascular plant allometry: Toward a general quantitative theory linking plant form and function from cells to ecosystems. Tree Physiol. 2002, 22, 1045–1064. [Google Scholar] [CrossRef] [PubMed] [Green Version]
  98. Price, C.A.; Enquist, B.J. Scaling of mass and morphology in plants with minimal branching: An extension of the WBE model. Funct. Ecol. 2006, 20, 11–20. [Google Scholar] [CrossRef]
  99. Smith, D.D.; Sperry, J.S.; Enquist, B.; Savage, V.M.; McCulloh, K.A.; Bentley, L.P. Deviation from symmetrically self-similar branching in trees predicts altered hydraulics, mechanics, light interception and metabolic scaling. New Phytol. 2014, 201, 217–229. [Google Scholar] [CrossRef] [PubMed]
  100. TreeQSM. Quantitative Structure Models of Single Trees from Laser Scanner Data. Version 2.3.0. Copyright (C) 2013-2017 Pasi Raumonen. Available online: https://zenodo.org/record/844626#.Xvz_nW1KjIU (accessed on 7 July 2021).
  101. Raumonen, P.; Casella, E.; Calders, K.; Murphy, S.; Åkerblom, M.; Kaasalainen, M. Massive-scale tree modelling from TLS data. ISPRS Ann. Photogramm. Remote Sens. Spat. Inf. Sci. 2015, II-3/W4, 189–196. [Google Scholar] [CrossRef] [Green Version]
  102. R Core Team. R: A Language and Environment for Statistical Computing; R Foundation for Statistical Computing: Vienna, Austria, 2015; Available online: https://www.R-project.org/ (accessed on 7 July 2021).
  103. Warton, D.I.; Duursma, R.; Falster, D.S.; Taskinen, S. smatr 3—An R package for estimation and inference about allometric lines. Methods Ecol. Evol. 2012, 3, 257–259. [Google Scholar] [CrossRef]
  104. Borchert, R.; Slade, N.A. Bifurcation Ratios and the Adaptive Geometry of Trees. Int. J. Plant Sci. 1981, 142, 394–401. [Google Scholar] [CrossRef]
  105. Menger, K. Über die Dimensionalität von Punktmengen (Zweiter Teil). Mon. Math. Und Phys. 1926, 34, 137–161. [Google Scholar] [CrossRef]
  106. Saarinen, N.; Calders, K.; Kankare, V.; Yrttimaa, T.; Junttila, S.; Luoma, V.; Huuskonen, S.; Hynynen, J.; Verbeeck, H. Understanding 3D structural complexity of individual Scots pine trees with different management history. Ecol. Evol. 2021, 11, 2561–2572. [Google Scholar] [CrossRef]
  107. Dorji, Y.; Schuldt, B.; Neudam, L.; Dorji, R.; Middleby, K.; Isasa, E.; Körber, K.; Ammer, C.; Annighöfer, P.; Seidel, D. Three-dimensional quantification of tree architecture from mobile laser scanning and geometry analysis. Trees 2021, 1–14. [Google Scholar] [CrossRef]
  108. Fridley, J.D. Extended leaf phenology and the autumn niche in deciduous forest invasions. Nat. Cell Biol. 2012, 485, 359–362. [Google Scholar] [CrossRef]
  109. Lechowicz, M.J. Why do temperate deciduous trees leaf out at different times? Adaptation and ecology of forest communities. Am. Nat. 1984, 124, 821–842. [Google Scholar] [CrossRef]
  110. Bayirli, M.; Selvi, S. Cakilcioglu, U. Determining different plant leaves’ fractal dimensions: A new approach to taxonomical study of plants. Bangladesh J. Bot. 2014, 43, 267–275. [Google Scholar] [CrossRef]
  111. Camarero, J.J.; Sisó, S.; Gil-Pelegrin, E. Fractal dimension does not adequately describe the complexity of leaf margin in seedlings of Quercus species. An. Jardín Botánico Madr. 2002, 60, 63–71. [Google Scholar] [CrossRef]
  112. Gazda, A. Fractal analysis of leaves: Are all leaves self-similar along the cane? Ekológia 2013, 32, 104–110. [Google Scholar] [CrossRef] [Green Version]
  113. Ianovici, N.; Veres, M.; Catrina, R.G.; Pirvulescu, A.M.; Tanase, R.M.; Datcu, D.A. Methods of biomonitoring in urban environment: Leaf area and fractal dimension. Ann. West Univ. Timişoara Ser. Biol. 2015, 18, 169–178. [Google Scholar]
  114. Jobin, A.; Nair, M.S.; Tatavarti, R. Plant Identification based on Fractal Refinement Technique (FRT). Procedia Technol. 2012, 6, 171–179. [Google Scholar] [CrossRef] [Green Version]
  115. Moraczewski, I.R.; Borkowski, W. Analyzing leaf shapes with the use of fractal measures and a shape feature description language. In Proceedings of the 3th National Conference on Applications of Mathematics in Biology and Medicine, Madralin, Poland, 16–19 September 1997. [Google Scholar]
  116. Vlcek, J.; Cheung, E. Fractal analysis of leaf shapes. Can. J. For. Res. 1986, 16, 124–127. [Google Scholar] [CrossRef]
  117. Gardiner, B.; Berry, P.; Moulia, B. Review: Wind impacts on plant growth, mechanics and damage. Plant Sci. 2016, 245, 94–118. [Google Scholar] [CrossRef] [PubMed]
  118. Bosc, A.; De Grandcourt, A.; Loustau, D. Variability of stem and branch maintenance respiration in a Pinus pinaster tree. Tree Physiol. 2003, 23, 227–236. [Google Scholar] [CrossRef] [Green Version]
  119. Kim, M.H.; Nakane, K.; Lee, J.T.; Bang, H.S.; Na, Y.E. Stem/branch maintenance respiration of Japanese red pine stand. For. Ecol. Manag. 2007, 243, 283–290. [Google Scholar] [CrossRef] [Green Version]
  120. Kinerson, R.S. Relationships between Plant Surface Area and Respiration in Loblolly Pine. J. Appl. Ecol. 1975, 12, 965. [Google Scholar] [CrossRef]
  121. Kramer, P.J.; Kozlowski, T.T. Physiology of Woody Plants; Academic Press: New York, NY, USA, 1979. [Google Scholar]
  122. Yoneda, T. Surface area of woody organs of an evergreen broadleaf forest tree in Japan and Southeast Asia. J. Plant Res. 1993, 106, 229–237. [Google Scholar] [CrossRef]
  123. Weiskittel, A.R.; Maguire, D.A. Branch surface area and its vertical distribution in coastal Douglas-fir. Trees 2006, 20, 657–667. [Google Scholar] [CrossRef]
  124. West, G.B.; Brown, J.H.; Enquist, B.J. The fourth dimension of life: Fractal geometry and allometric scaling of organisms. Science 1999, 284, 1677–1679. [Google Scholar] [CrossRef] [PubMed] [Green Version]
  125. Niinemets, Ü.; Valladares, F. Tolerance to Shade, Drought, and Waterlogging of Temperate Northern Hemisphere Trees and Shrubs. Ecol. Monogr. 2006, 76, 521–547. [Google Scholar] [CrossRef]
  126. Zhu, X.; Skidmore, A.K.; Wang, T.; Liu, J.; Darvishzadeh, R.; Shi, Y.; Premier, J.; Heurich, M. Improving leaf area index (LAI) estimation by correcting for clumping and woody effects using terrestrial laser scanning. Agric. For. Meteorol. 2018, 263, 276–286. [Google Scholar] [CrossRef]
  127. Efroni, I.; Eshed, Y.; Lifschitz, E. Morphogenesis of Simple and Compound Leaves: A Critical Review. Plant Cell 2010, 22, 1019–1032. [Google Scholar] [CrossRef] [PubMed] [Green Version]
  128. Champagne, C.; Sinha, N. Compound leaves: Equal to the sum of their parts? Development 2004, 131, 4401–4412. [Google Scholar] [CrossRef] [PubMed] [Green Version]
  129. Klingenberg, C.; Duttke, S.; Whelan, S.; Kim, M.; Klingenberg, C.; Duttke, S.; Whelan, S.; Kim, M. Developmental plasticity, morphological variation and evolvability: A multilevel analysis of morphometric integration in the shape of compound leaves. J. Evol. Biol. 2011, 25, 115–129. [Google Scholar] [CrossRef]
  130. Ng, M.; Smith, S.Y. Evaluating stasis in Metasequoia (Cupressaceae): Testing the relationship between leaf traits and climate. Int. J. Plant Sci. 2020, 181, 157–174. [Google Scholar] [CrossRef]
  131. Verbeeck, H.; Bauters, M.; Jackson, T.; Shenkin, A.; Disney, M.; Calders, K. Time for a Plant Structural Economics Spectrum. Front. For. Glob. Chang. 2019, 2. [Google Scholar] [CrossRef] [Green Version]
Figure 1. Sample of leaves of the species (A) G. triacanthos (B) Q. macrocarpa (C) M. glyptostroboides.
Remotesensing 13 02773 g001
Figure 2. (A) Illustration of the virtual boxes of different sizes that capture the leaf-on point cloud of a M. glyptostroboides tree. (B) Exemplary log–log plot for the computation of the box-dimension metric for the same tree. The slope of the regression line equals the box-dimension of the tree, i.e., Db = 2.05. The 95% confidence interval has been plotted around the regression line. The number of boxes required to capture all points of the tree point cloud is denoted as N, the size of the length of each box is denoted as s, and the size of the length of the initial box that encapsulates the whole tree is denoted as s_initial.
Remotesensing 13 02773 g002
Figure 3. Structural complexity quantified with the box-dimension (Db) metric of the (A) leaf-on, (B) leaf-off, and (C) leaf-removed point clouds of a G. triacanthos tree (first row), a Q. macrocarpa tree (second row), and a M. glyptostroboides tree (third row). The leaf-off and leaf-removed tree point clouds have been artificially colored with brown color.
Remotesensing 13 02773 g003
Figure 4. Relationship between the leaf-on and leaf-off box-dimension values across all study tree species combined, and for each species separately with 95% confidence interval around the regression lines. The black dashed line is the 1:1 line.
Remotesensing 13 02773 g004
Figure 5. Relationship between the LCC index and the branch woody surface area of the trees with 95% confidence interval around the regression line. The three species M. glyptostroboides (MEGL), G. triacanthos (GLTR), and Q. macrocarpa (QUMA) have been plotted with different colors and symbols.
Remotesensing 13 02773 g005
Figure 6. Relationships between the LCC index and different path length variables with 95% confidence interval around the regression lines. The three species M. glyptostroboides (MEGL), G. triacanthos (GLTR), and Q. macrocarpa (QUMA) have been plotted with different colors and symbols.
Remotesensing 13 02773 g006
Figure 7. Relationship between the leaf-removed and leaf-off box-dimension values across all study tree species combined, and for each species separately with 95% confidence interval around the regression lines. The black dashed line is the 1:1 line.
Remotesensing 13 02773 g007
Figure 8. Relationship between the % Relative Error (RE) and the maximum branch order of the trees with 95% confidence interval around the regression lines. The species M. glyptostroboides (MEGL), G. triacanthos (GLTR), and Q. macrocarpa (QUMA) have been plotted with different colors and symbols.
Remotesensing 13 02773 g008
Table 1. Summary statistics resulting from different measurements of tree size and structural complexity.
Summary StatisticsAll TreesGleditsia triacanthosQuercus macrocarpaMetasequoia glyptostroboides
no. trees45161514
DBH (cm) *
(mean [min, max])
54.1 [15, 122.2]52.9 [18.4, 72.8]58.8 [29, 83.8]50.5 [15, 122.2]
Height (m)
(mean [min, max])
13.8 [4.4, 24.1]12.5 [10.4, 18.4]15.8 [9.1, 21.3]13.1 [4.4, 24.1]
WSA (m2) **
(mean [min, max])
204.2 [29.9, 467.0]265.4 [65.2, 408.6]225.4 [60.4, 467.0]111.5 [29.9, 250.2]
Stem WSA (m2)
(mean [min, max])
13 [2.1, 44.6]11.4 [4.1, 20.1]16.2 [4.7, 30.3]11.4 [2.1, 44.6]
Branch WSA (m2)
(mean [min, max])
191.2 [27.7, 436.7]253.9 [61.2, 395.5]209.2 [55.7, 436.7]100.1 [27.7, 231.8]
Db-leaf.on
(mean [min, max])
2.06 [1.89, 2.23]2.09 [1.89, 2.20]2.03 [1.91, 2.11]2.07 [1.94, 2.23]
Db-leaf.off
(mean [min, max])
1.97 [1.82, 2.11]2.02 [1.84, 2.11]1.92 [1.82, 2.04]1.97 [1.84, 2.1]
Db-leaf.rm
(mean [min, max])
1.9 [1.76, 2.14]1.84 [1.76, 2.0]1.93 [1.83, 2.03]1.93 [1.8, 2.14]
LCC index
(mean [min, max])
0.04633 [0.00064, 0.16394]0.03273 [0.01371, 0.0762]0.05867 [0.00667, 0.10883]0.04864 [0.00064, 0.16394]
%RE
(mean [min, max])
5.55 [0.17, 14.64]8.91 [1.07, 14.64]2.43 [0.17, 5.46]5.06 [0.92, 11.53]
Mean Path length (m) (mean [min, max])12.9 [3.7, 23.9]14.8 [9.5, 22.0]14 [6.9, 23.9]9.5 [3.7, 18.6]
Max. Path length (m) (mean [min, max])22.8 [6.5, 42.7]24.8 [17.3, 37.5]24.9 [12.3, 42.7]18.3 [6.5, 35.8]
25th % Path length (mean [min, max])10.9 [3, 20.6]13.2 [7.7, 18.1]11.7 [5.4, 20.6]7.4 [3, 14.9]
# of branch orders
(median [min, max])
5 [1, 11]5 [1, 11]5 [1, 10]4 [1, 9]
* DBH = Diameter at Breast Height, ** WSA = Woody Surface Area.
Publisher’s Note: MDPI stays neutral with regard to jurisdictional claims in published maps and institutional affiliations.

