Article

Distinguishing Original and Non-Original Stands at the Zhanjiang Mangrove National Nature Reserve (P.R. China): Remote Sensing and GIS for Conservation and Ecological Research

by
Juan Durango-Cordero
1,2,3,*,
Behara Satyanarayana
4,5,
Jonathan Cheung-Wai Chan
6,
Jan Bogaert
7 and
Farid Dahdouh-Guebas
3,5
1
Research Center for the Territory and Sustainable Habitat, Universidad Tecnológica Indoamérica, Machalay Sabanilla, Quito 170301, Ecuador
2
Facultad de Arquitectura, Artes y Diseño, Universidad Tecnológica Indoamérica, Av. Manuela Sáenz y Agramonte, Ambato 180212, Ecuador
3
Ecology & Biodiversity, Laboratory of Plant Biology and Nature Management, Vrije Universiteit Brussel—VUB, Pleinlaan 2, B-1050 Brussels, Belgium
4
Mangrove Research Unit (MARU), Institute of Oceanography and Environment (INOS), Universiti Malaysia Terengganu—UMT, Kuala Terengganu 21030, Terengganu, Malaysia
5
Laboratory of Systems Ecology and Resource Management, Université Libre de Bruxelles-ULB, Avenue Franklin Roosevelt 50, CPi 264/1, B-1050 Brussels, Belgium
6
Department of Electronics and Informatics, Vrije Universiteit Brussel—VUB, Pleinlaan 2, B-1050 Brussels, Belgium
7
Biodiversity and Landscape Unit, Université de Liège, Gembloux Agro Bio Tech, Passage des Déportés 2, B-5030 Gembloux, Belgium
*
Author to whom correspondence should be addressed.
Remote Sens. 2021, 13(14), 2781; https://doi.org/10.3390/rs13142781
Submission received: 2 May 2021 / Revised: 28 June 2021 / Accepted: 10 July 2021 / Published: 15 July 2021
(This article belongs to the Special Issue Monitoring and Modelling of Dynamics in Tropical Coastal Systems)

Abstract

:
The present research developed a novel methodological framework to differentiate natural mangrove stands (i.e., original), from stands which were planted and stands naturally established after interaction between planted and non-planted stands (e.g., through pollination, i.e., non-original). Ground-truth and remote sensing data were collected for Zhanjiang Mangrove National Nature Reserve (ZMNNR) in P.R. China. First, satellite images of Corona (1967) and GeoEye-1 (2009) were overlaid to identify original (1967) and non-original (2009) mangrove stands. Second, in both stands a total of 75 in situ plots (25 m2) were measured for ground-truthing of tree structural parameters including height, density, basal area and Complexity Index (CI). From temporal satellite data, we identify 236.12 ha of original mangrove and 567.88 ha of non-original mangrove in the reserve. Averaged measurements of the original mangrove stands, i.e., stem density (1164 nos. 0.1 ha−1), basal area (90.3 m2 0.1 ha−1) and CI (100.59), indicated that they were in a state of maturity and less disturbed compared to the non-original mangroves (density, 1241 nos. 0.1 ha−1; basal area, 4.92 m2 0.1 ha−1 and CI, 55.65). The Kruskal–Wallis test showed significant differentiation between the original and non-original mangrove tree structural parameters: Kandelia obovata’s density, X2 = 34.78, d.f. = 1, p = 0.001; basal area, X2 = 108.15, d.f. = 1, p = 0.001; Rizhopora stylosa’s density, X2 = 64.03, d.f. = 1, p = 0.001; basal area, X2 = 117.96, d.f. = 1, p = 0.001. The latter is also evident from the clustering plots generated from the Principal Component Analysis (PCA). Vegetation dynamics at the ZMNNR also enabled us to compare the species composition and distribution patterns with other Indo-West Pacific regions. Overall, the present study not only highlights the advantage of >50 years old satellite data but also provide a benchmark for future ecological research, conservation and management of the ZMNNR.

Graphical Abstract

1. Introduction

The significance and conservation of mangrove forests rely on their economic, social and ecological service values [1,2,3]. Mangroves are among the most carbon-rich forests in the tropics [4,5,6] and can function as phytoremediators [7,8,9]. In fact, such mangrove benefits are often highlighted by scientists as well as government and non-governmental agencies [10,11,12]. Although the rate of global mangrove cover loss has been decreasing in recent years [13], efficient mangrove management through improved/sustainable practices still remains as a concern for many countries [12,14,15]. As mangrove areas are smaller or fragmented at several locations, the long-term survival of these forests is at risk and their essential ecosystem services might be lost [16,17,18]. For instance, 45% of carbon accumulated during the last century is lost due to mangrove clearing and soil exposure over 10 years which is equivalent to about 20% of the upper meter soil carbon stock [19]. The success of restoration efforts focuses upon its genetic diversity conservation (assessment before, during and after) in the face of multiple disturbance and habitat destruction scenarios, e.g., climate change and sea-level rise, aquaculture, pollution, etc. [20,21,22]. The term “original forest” has been previously used for describing mangroves that pre-date human intervention [23]. Original mangrove forests may have greater ecosystem service benefits than disturbed mangroves, e.g., a better carbon sink [24]. While it is a challenge to accurately map the original mangroves due to scarce available data [25], promising new initiatives are in development [26]. It is estimated that 35–84% (depending on the locality) of the original mangrove has been lost to anthropogenic activities [27] and regional and global trends are worrying [28,29]. Therefore, conservation of the remaining original mangrove forests needs our utmost attention [30,31].
In addition to the natural and anthropogenic impacts on mangrove covers, inbreeding might reduce reproductive potentials (along with loss of genetic diversity) and its resilience towards environmental change [32,33]. Since long-term survival of a species depends on its genetic conservation, molecular marker methods have been used to evaluate genetic characteristics, such as structure, flows, barriers, past sea-level changes [34,35,36,37]. However, these gene-tests are still limited due to lack of reliable historical data (e.g., forest age) from many mangrove locations. This is just one example for which the distinction between original and non-original stands proved to be helpful, but throughout ecology sensu lato multiple studies can be identified [38,39,40,41,42,43,44,45,46,47,48,49,50,51,52,53] (Table 1).
Continued monitoring and thorough assessments are the prerequisites to understand mangrove vegetation dynamics [54,55]. This can be achieved through various methods comprised of field-based investigations and remote sensing data [56,57]. Field-based monitoring is useful for mangrove studies, but remote sensing data with repeated temporal resolution is indispensable nowadays [55,58]. The use of Corona images enables us to study past dynamics before 1960 s, e.g., forest cover change [49] periglacial geomorphology in forests [59], deforestation [60]; but in the Web of Science® only 32 records of its use are indexed and in mangrove forest remains very rare [61,62]. In the case of Zhanjiang Mangrove National Nature Reserve (ZMNNR) in China, local authorities have carried out several mangrove plantations schemes during 1990s, but without holding a record on its geographical (i.e., latitude and longitude) coordinates. Hence, after two decades of forest development there is a great uncertainty about the original mangrove stands (here defined as community of trees naturally present before planting schemes) and the non-original ones (here defined as planted stands or stands that have naturally established after interaction between planted and original stands, for instance through pollination and reproduction).
The present study was primarily aimed at setting up a methodological framework to distinguish original and non-original mangrove stands at the ZMNNR for subsequent ecological research (conservation genetics, silviculture, etc.). The objectives were to find older and newer mangrove canopy patches using remote sensing data (i.e., Corona of 1967 and GeoEye-1 of 2009), and to estimate as well as compare the stand structural attributes (density, basal area, height) between these two patches. Recommendations on suitable sites for a wide range of mangrove ecological researches along with its conservation and management at the ZMNNR were formulated.

2. Materials and Methods
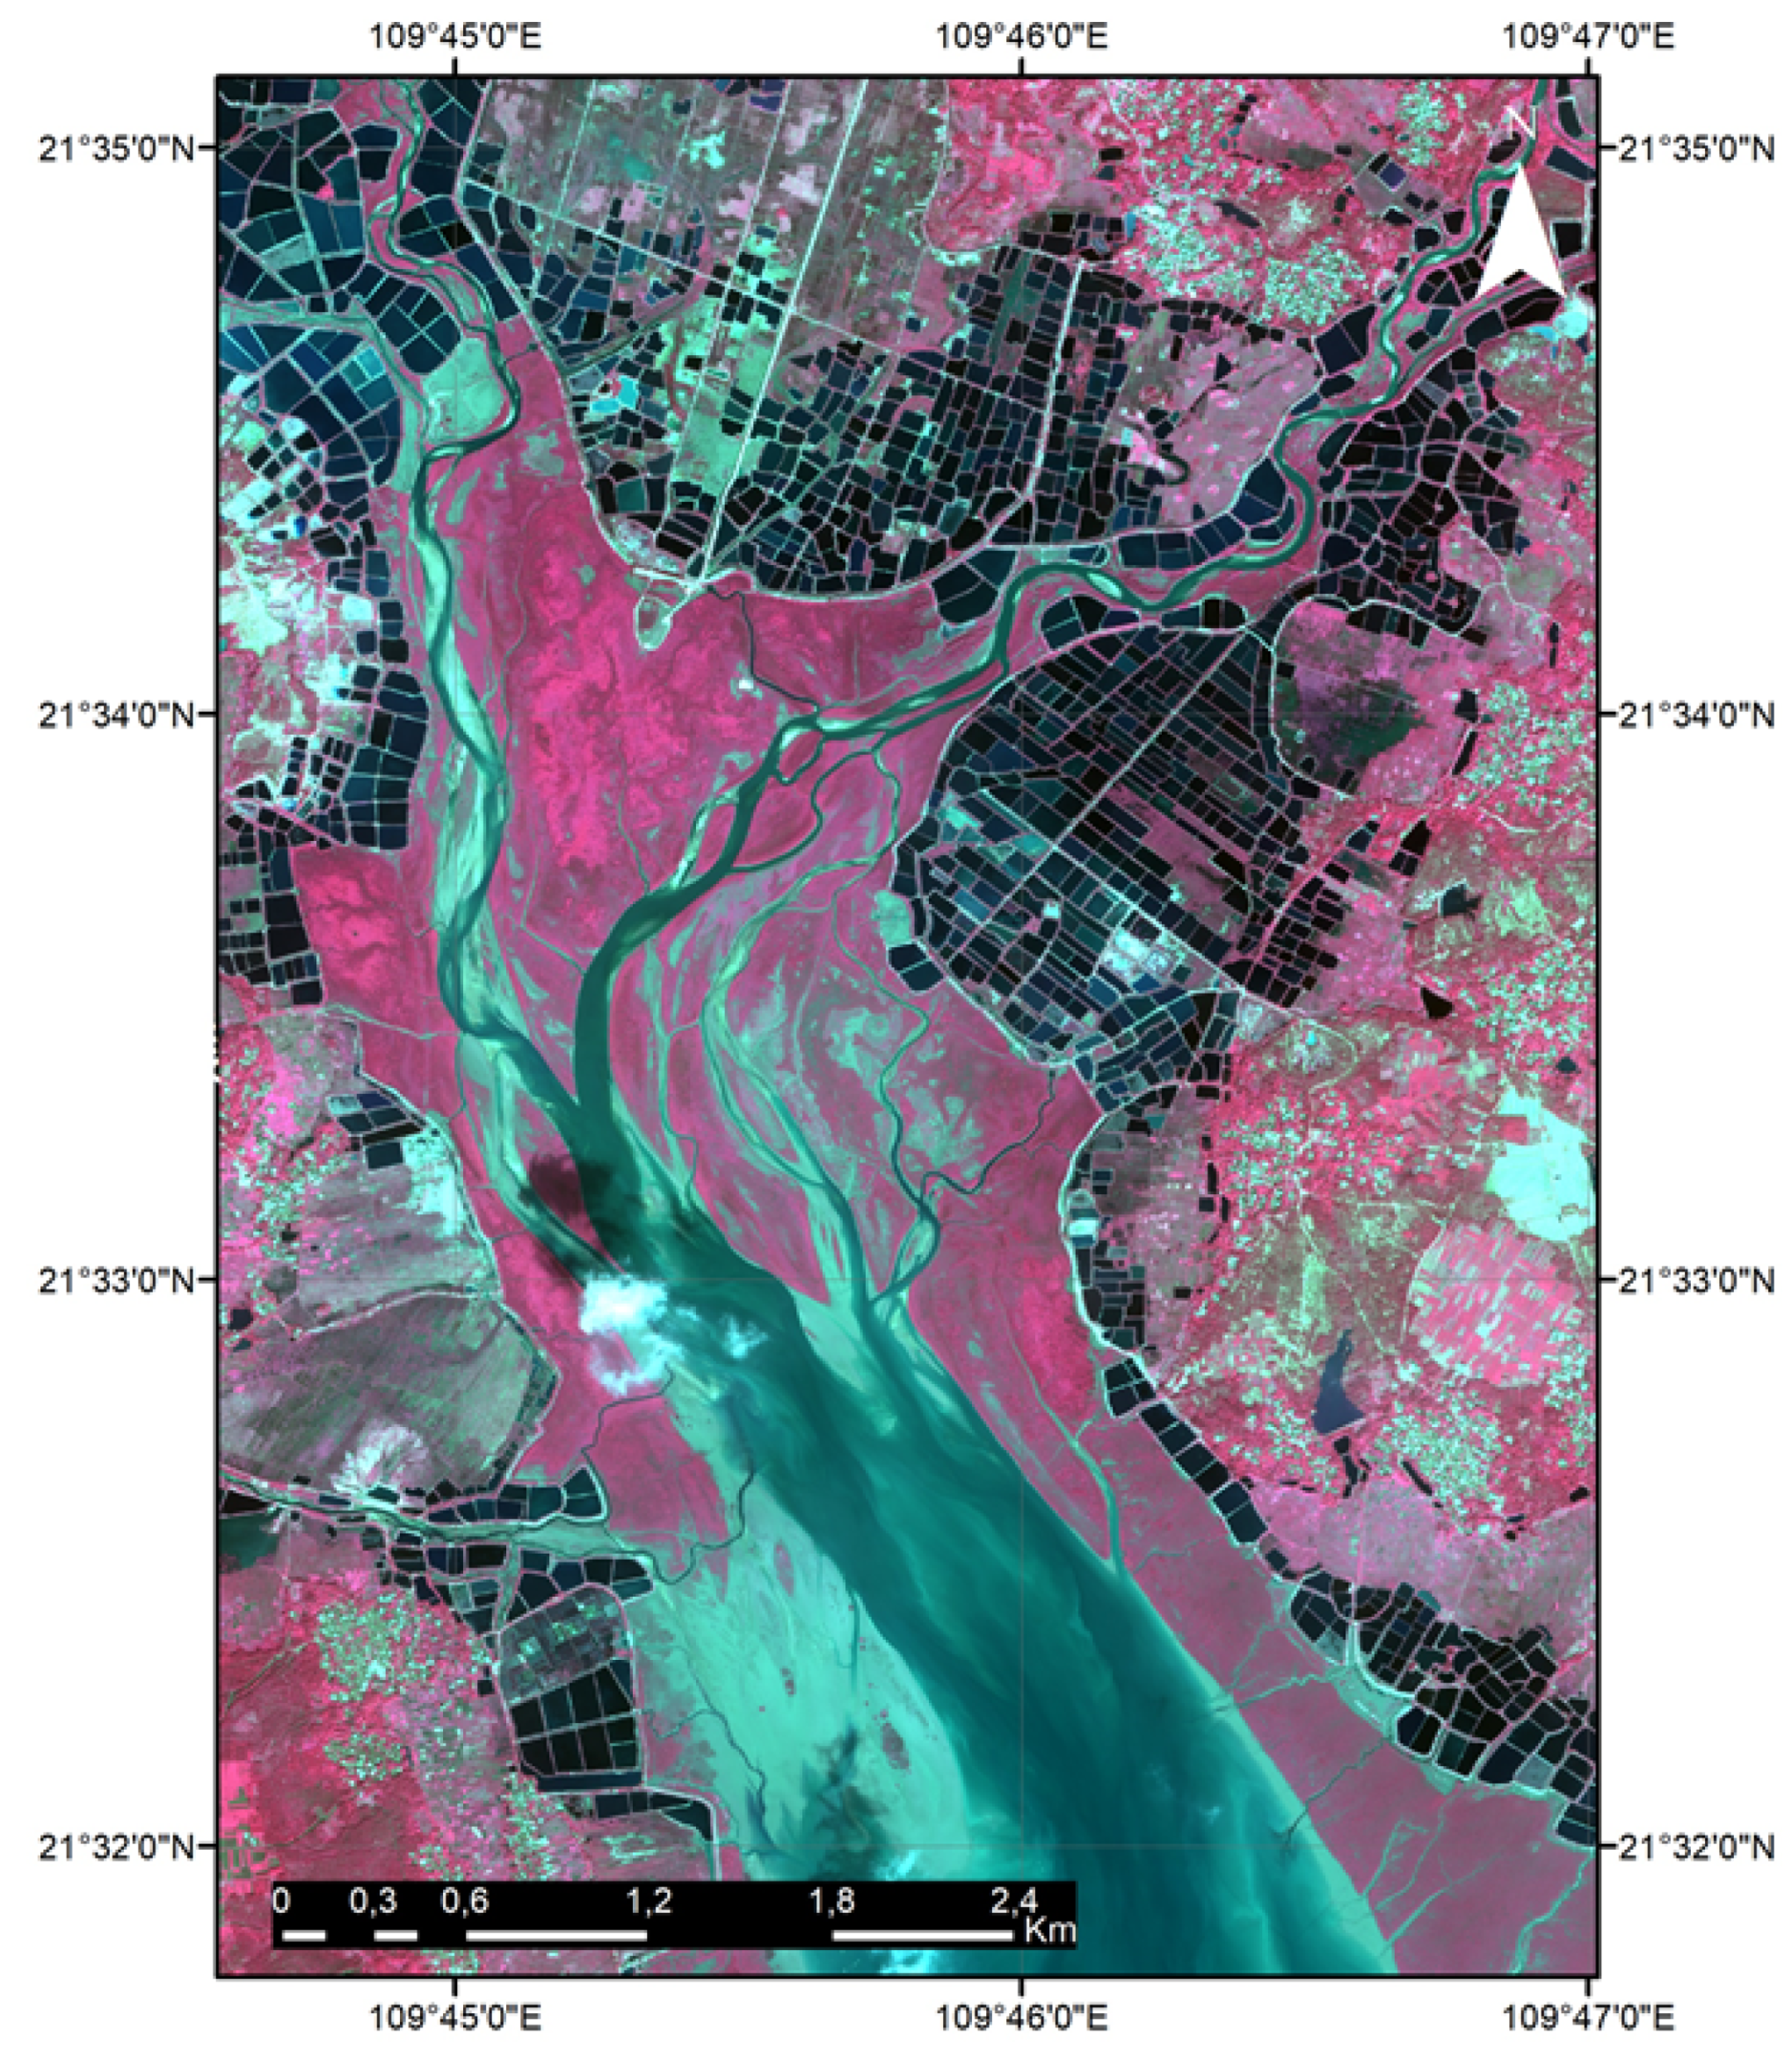
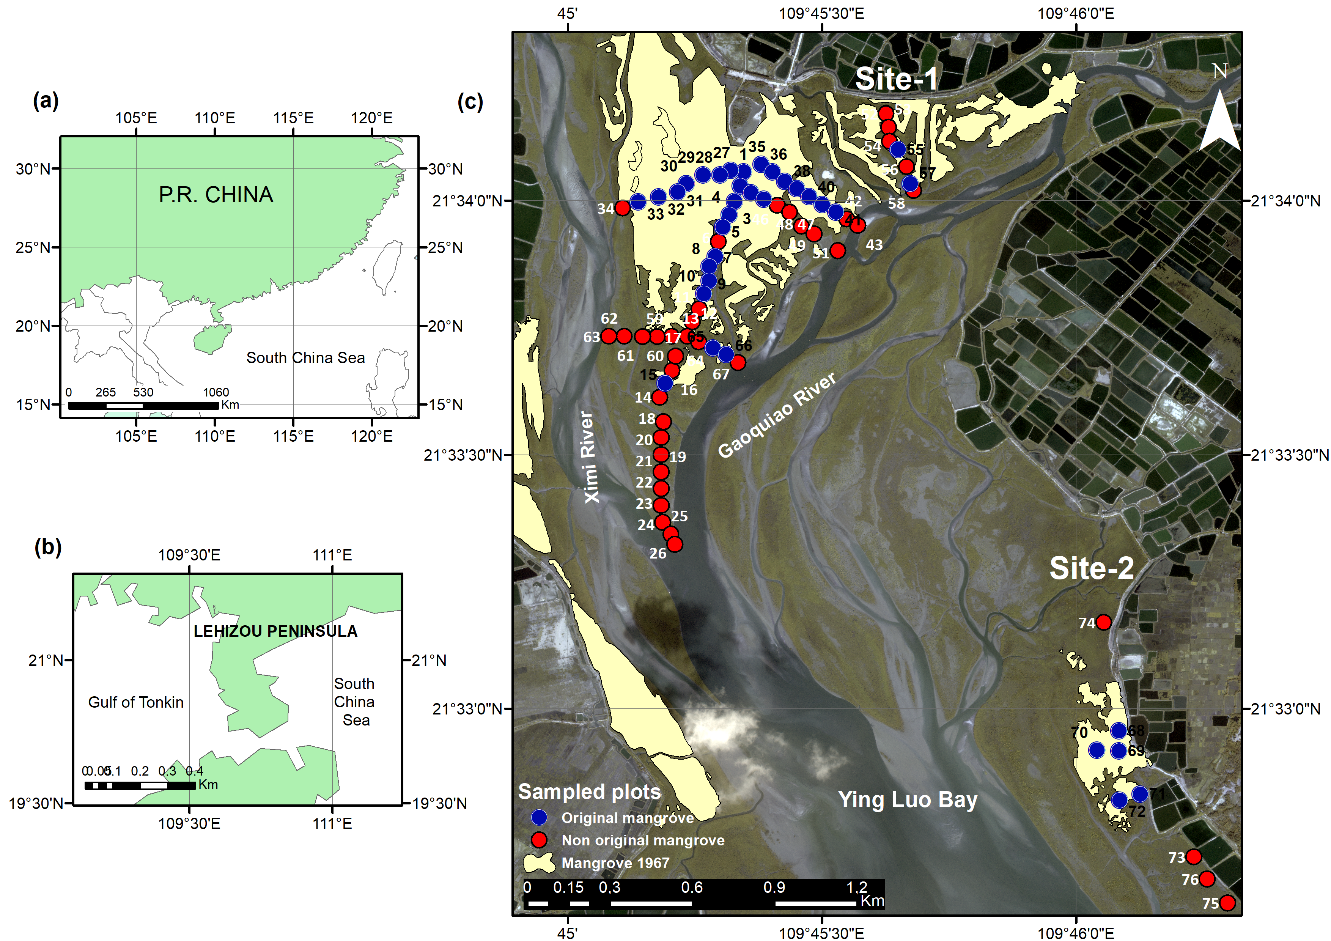
2.1. Study Area

The Guangdong province in China hosts nearly 50% of the country’s mangrove cover of which 12,375 ha (80%) is found in Leizhou Peninsula [63]. The ZMNNR is located along the coastline facing South China Sea’s Ying Luo Bay (Figure 1). The mangrove vegetation is composed of five dominant species namely, Aegiceras corniculatum (L.) Blanco, Avicennia marina (Forsk.) Vierh., Bruguiera gymnorrhiza (L.) Lamk., Kandelia obovata (L.) Druce, Rhizophora stylosa Griff., and two non-dominant species namely, Sonneratia apetala Buch. –Ham, and Excoecaria agallocha (L.) [63]. Besides the loss of mangrove forests to coastal erosion, both rice cultivation and aquaculture were the major anthropogenic threats to the ZMNNR [62]. Yet, the ZMNNR has acquired the status of Ramsar Wetland of International Importance (no. 1157) in 2002 for its ecological significance as a waterfowl habitat [64]. The local authorities have carried out several mangrove plantations in the vicinity during 1990s, especially S. apetala (a non-native and invasive species). We were informed by ZMMNR officials that it was a planted species thus we excluded studied plots within these areas in the present study. E. agallocha was also planted, but it had very few individuals [62]. The study area is characterized by northern tropical climate with a mean annual temperature of 25 °C (min = 15 °C, max = 32 °C) and precipitation of 1480 mm [65]. The tides are diurnal in nature with an average salinity of 4.17 ± 1.17 ppt and pH 5.14 ± 0.41 [66].

2.2. Forest Stands Identification Methodological Framework

The summarized steps of methodology were shown in Figure 2, while complete details are provided in the Section 2.3, Section 2.4 and Section 2.5 below.

2.3. Remote Sensing Data

For mangrove spatio-temporal change detection, the Corona KH-4B panchromatic satellite imagery dated 17 December 1967 (declassified US military programs) (spatial resolution: 1.8 m) and GeoEye-1 multispectral satellite imagery dated 16 October 2009 (spatial resolution: 1.65 m for the multispectral bands and 0.5 m for the panchromatic band) were used. At first the mangrove extent in both images was thoroughly checked through visual interpretation in raw imagery (Figure A1) as well as in several false color composites. The combination of red = 4; green = 3; blue = 2 enabled us to visually identify presumed original and non-original forest (Figure A2). The black areas in the Corona imagery were decisive in guided us through the process. Second, the Corona image was georeferenced (ground control points = 34; total root mean square error = 11.59; transformation = 1st order polynomial) using features initially identified from the GeoEye-1 (after pan-sharpening with the Gram–Schmidt algorithm [67], which implemented band weights in the enhancement procedure for red = 0.6, green = 0.85, blue = 0.75, and infrared = 0.3 [68]), and the mangrove stands in both images were digitized (ArcMap 10.5). Third, the digitized polygons were overlaid to identify original/non-original mangrove stands and to calculate the area statistics. The polygons of 1967 that overlapped with visible putative older-grown mangrove cover on 2009 imagery represents original mangrove. Non-intersected areas (between 1967 and 2009 images) with extended putative novel and young-growing mangrove cover from 1967 imagery represents non-original mangrove stand at the ZMNNR (Figure 1c and Figure A1).

2.4. Ground-Truth Data

Ground inventory was carried out from Sites 1 and 2 covering original and non-original mangrove stands in August–September 2009 and April–May 2011 (Figure 1c). These two sites were chosen based on the conspicuous vegetation patches (thick black tone areas) that indicate mangrove in 1967. Altogether, 76 sampling points were chosen. Altogether, 76 sampling points were chosen using the belt transect method [69], of which 65 points are located in Site 1 and 9 in Site 2. Among those 65 points at Site 1, 37 represent the original mangrove and 29 non-original mangroves. At Site 2, five sampling points represented the original and four the non-original mangrove stands. At each sample point, a 5 × 5 m plot was established to record the species available by following the detailed taxonomic descriptions of Tomlinson [70], height (using a Sunnto clinometer PM-5/360, Finland), no. of stems and its diameter (D130) [71], except for smaller species (Dh/2, where h = the height of the tree), after which we estimated different vegetation parameters including density (nos. ha−1), basal area (m2 ha−1), relative density (%), relative dominance (%), relative frequency (%), Importance Value (IV), and Holdridge et al. (Complexity Index (CI) (1971) following the standard protocols [72,73,74].
IV and CI are defined as:
I . V . = D e r + D o r + F r
C . I . = D e × B a × H × N 1000
where Der is the relative density, Dor the relative dominance, Fr the relative frequency, De the absolute density, Ba the (absolute) basal area, H the mean height, and N the number of species. These vegetation metrics were calculated using Excel® software (V16.0).

2.5. Mangrove Community Structural Analysis

Tree density and basal area have been suggested to differentiate young from late successional and grown-up forest [55]. We have investigated whether the sampled means of tree density, basal area and height can be used to separate original and non-original mangrove stands, through statistical analysis in R software [75]. Statistical variation among the vegetation parameters was checked through Kruskal–Wallis test (H) with post hoc Wilcoxon rank-sum test (T) or Analysis of Variance (ANOVA) with Student’s t-test as per its applicability (root-transformed data to reduce heteroscedasticity). Significance levels (p < α) for successive pair-wise multiple comparison of sampled plots were adjusted using Bonferroni correction [76]. Principal Component Analyses (PCA) with an ordihull function was run to indicate the original mangrove stands (i.e., sampled plots) for future ecological research, conservation and management purposes. An ordihull function is normally used to display groups or factor levels in ordination diagrams [75]. All mapping treatments from Section 2.3 and Section 2.4 were performed in ArcMap v.10.5.

3. Results

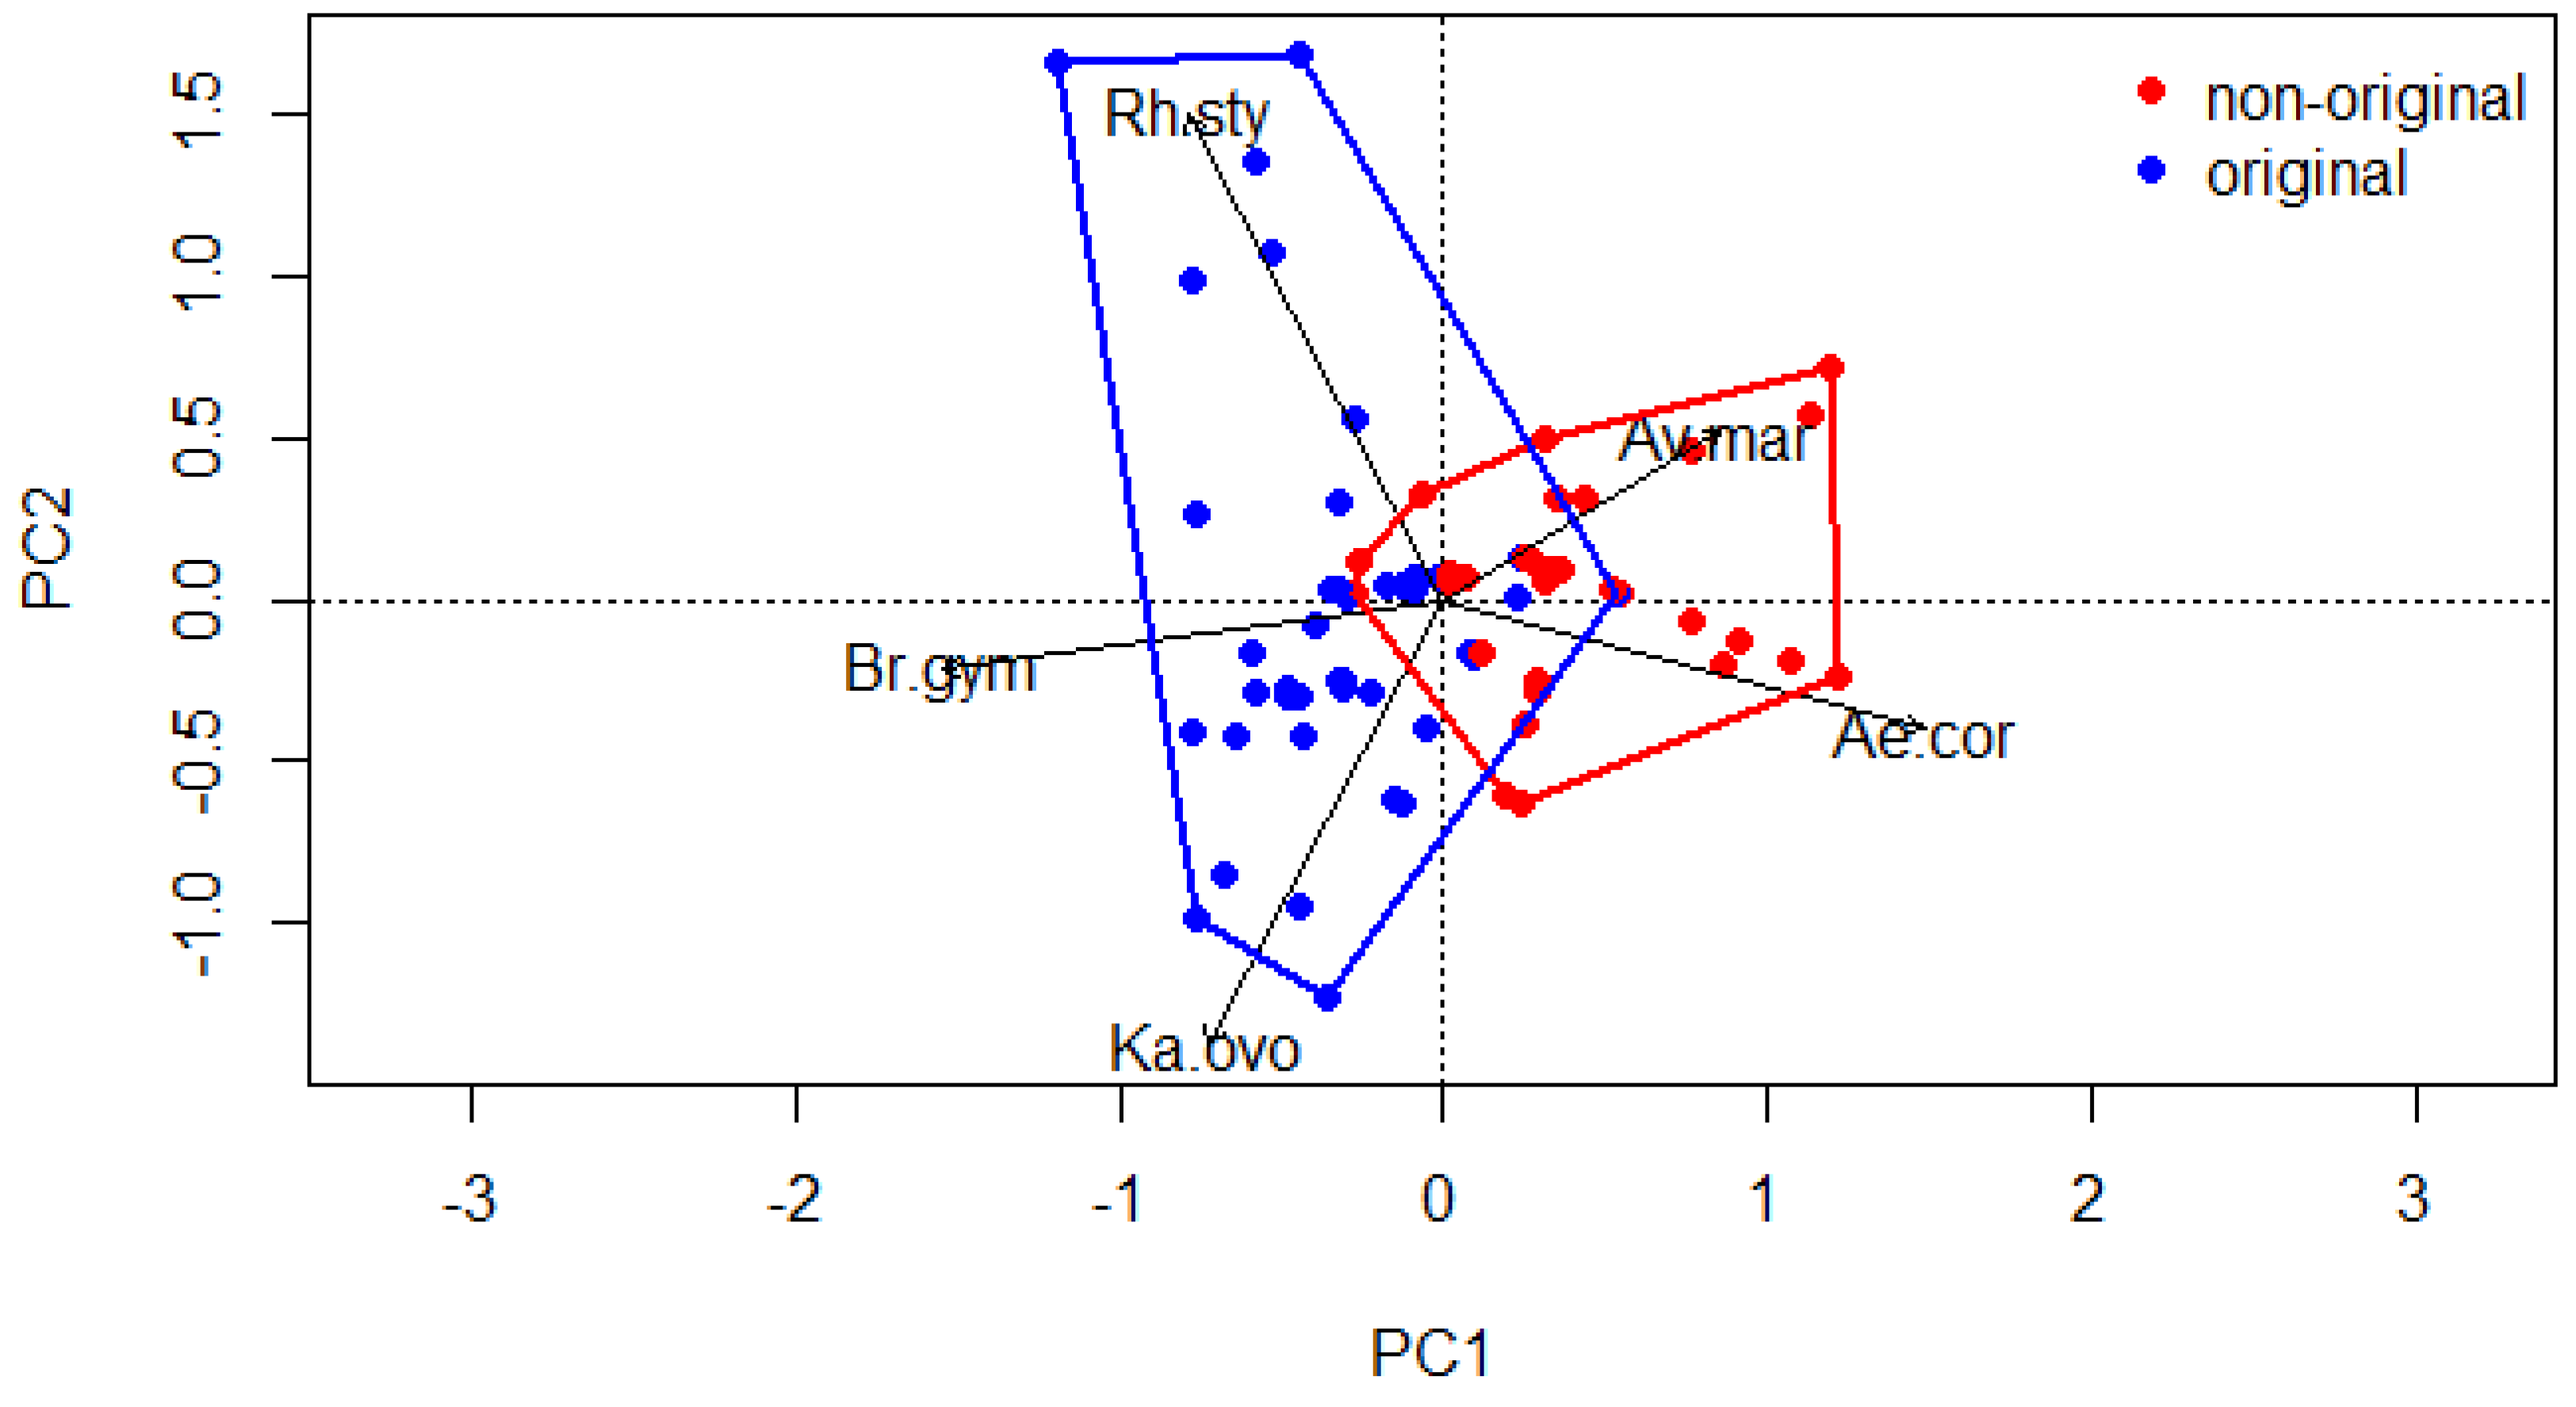
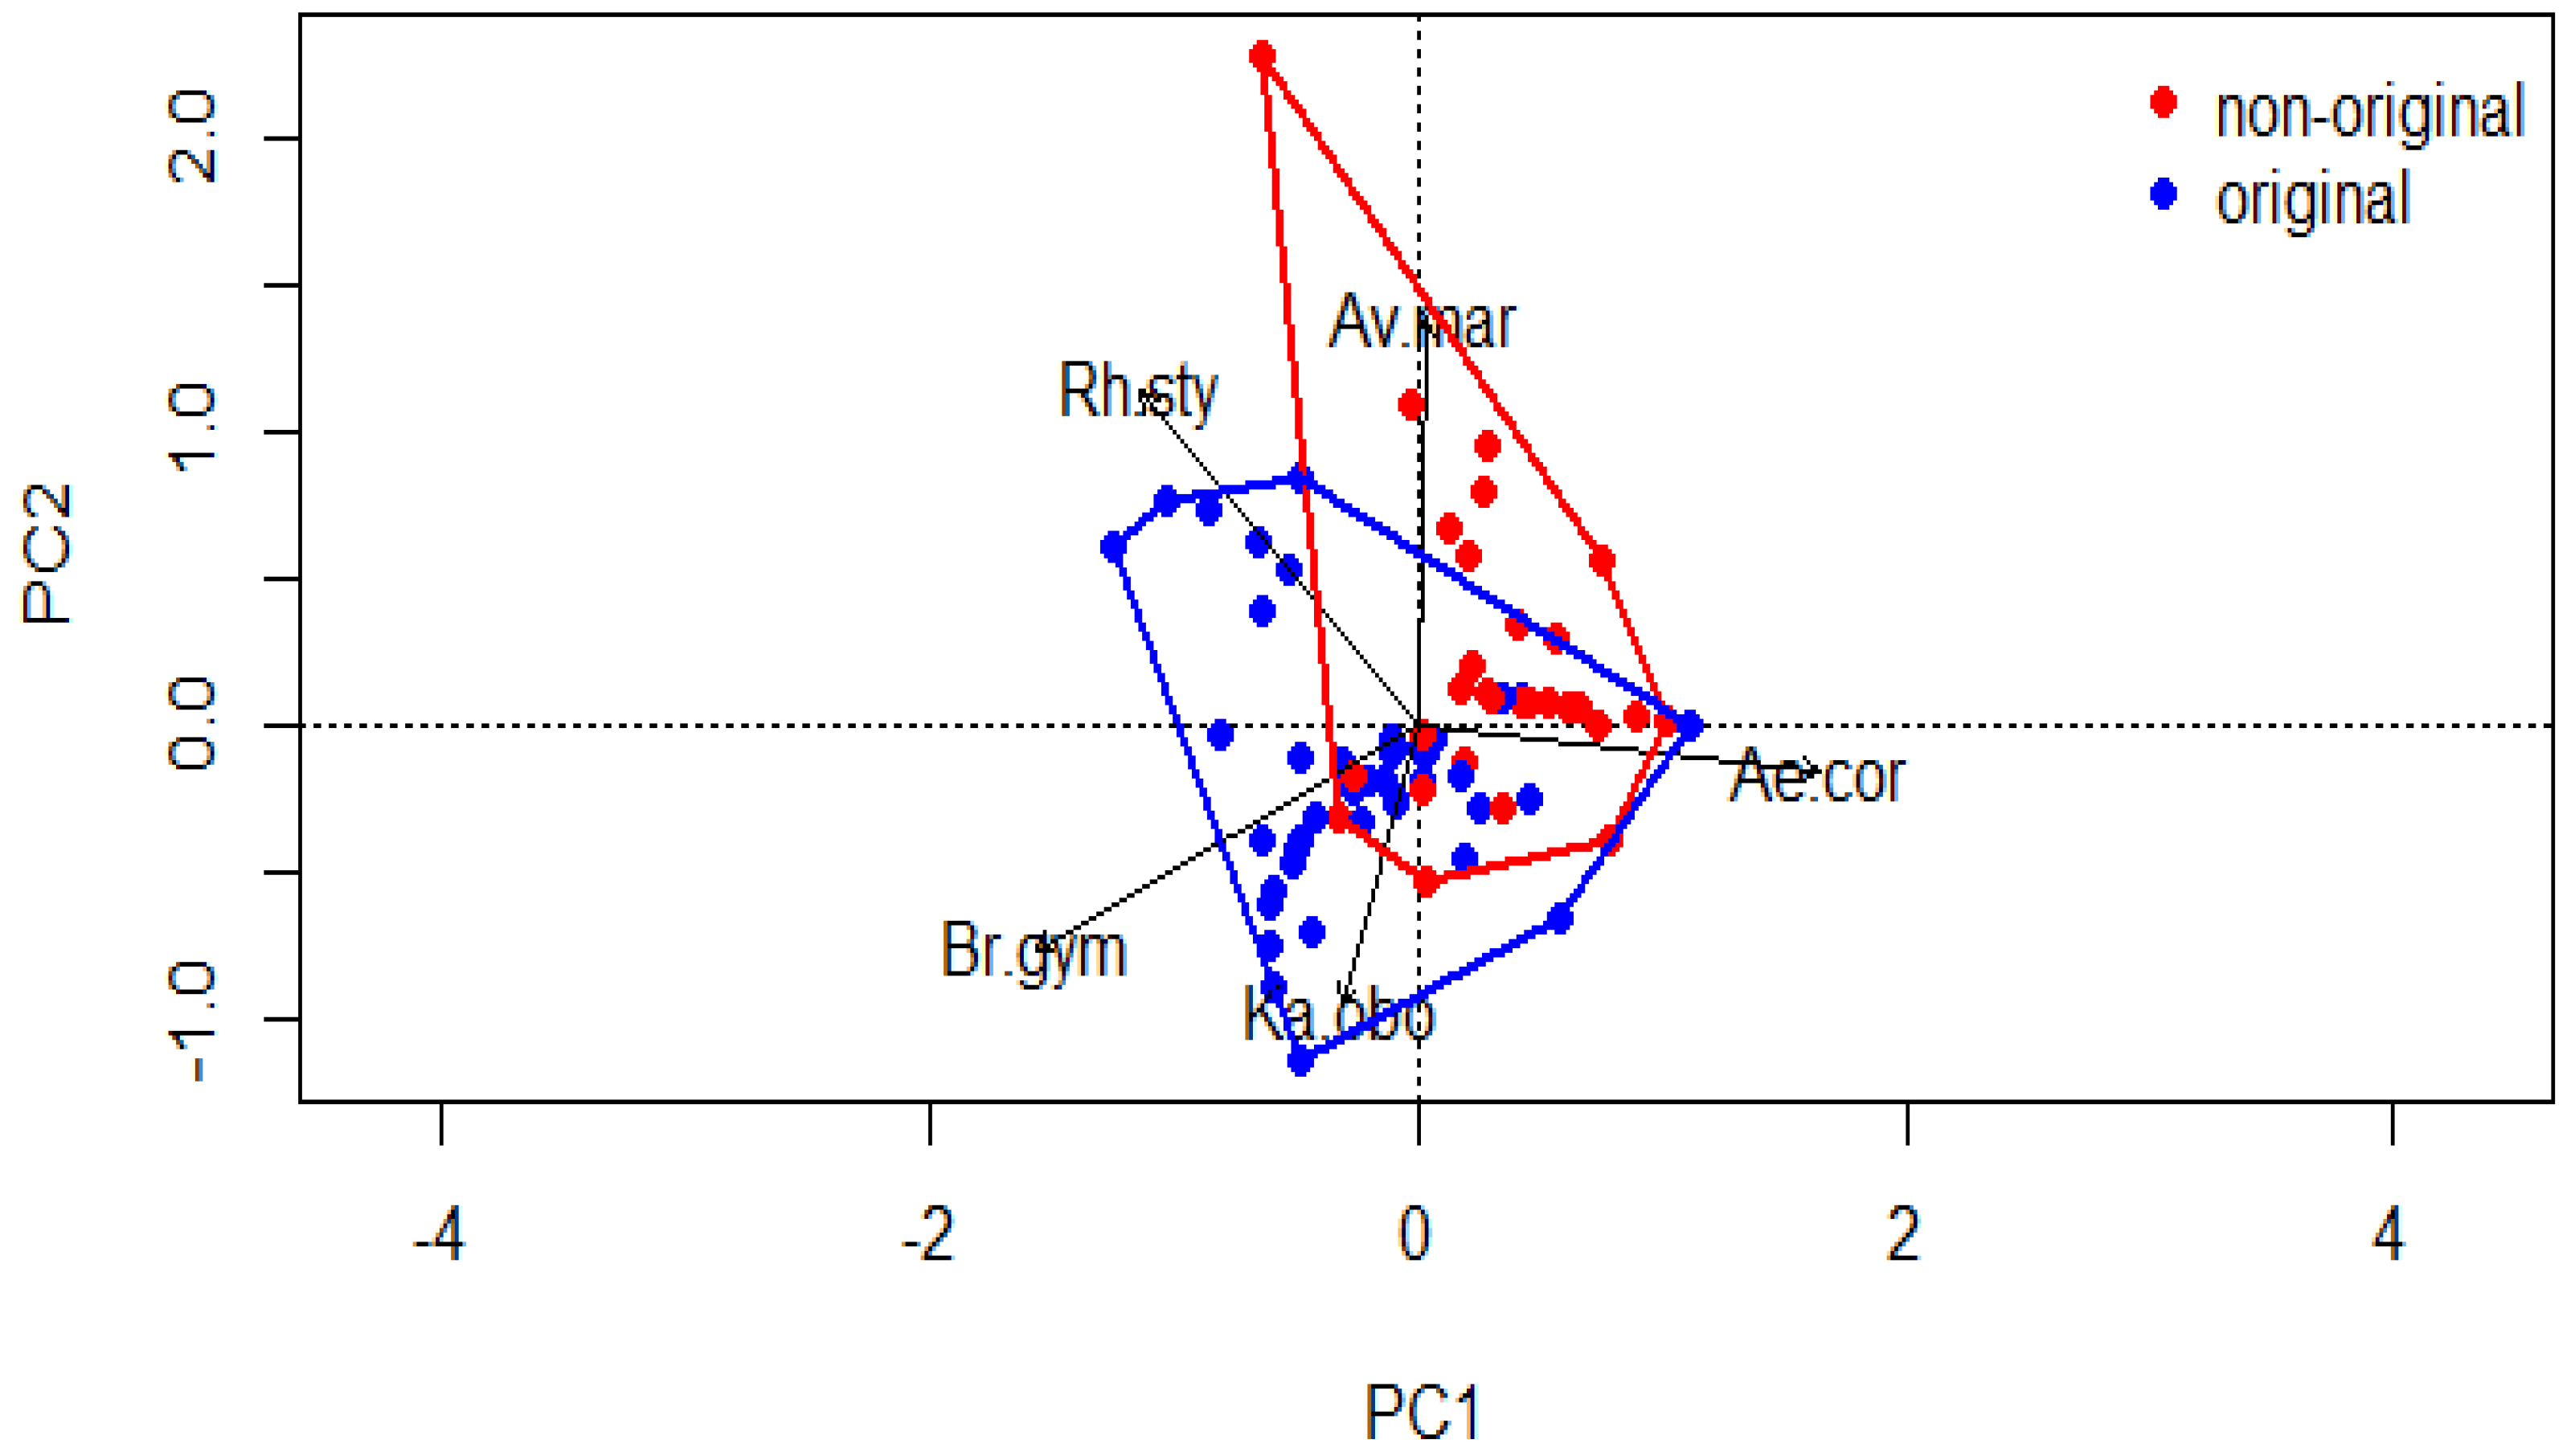
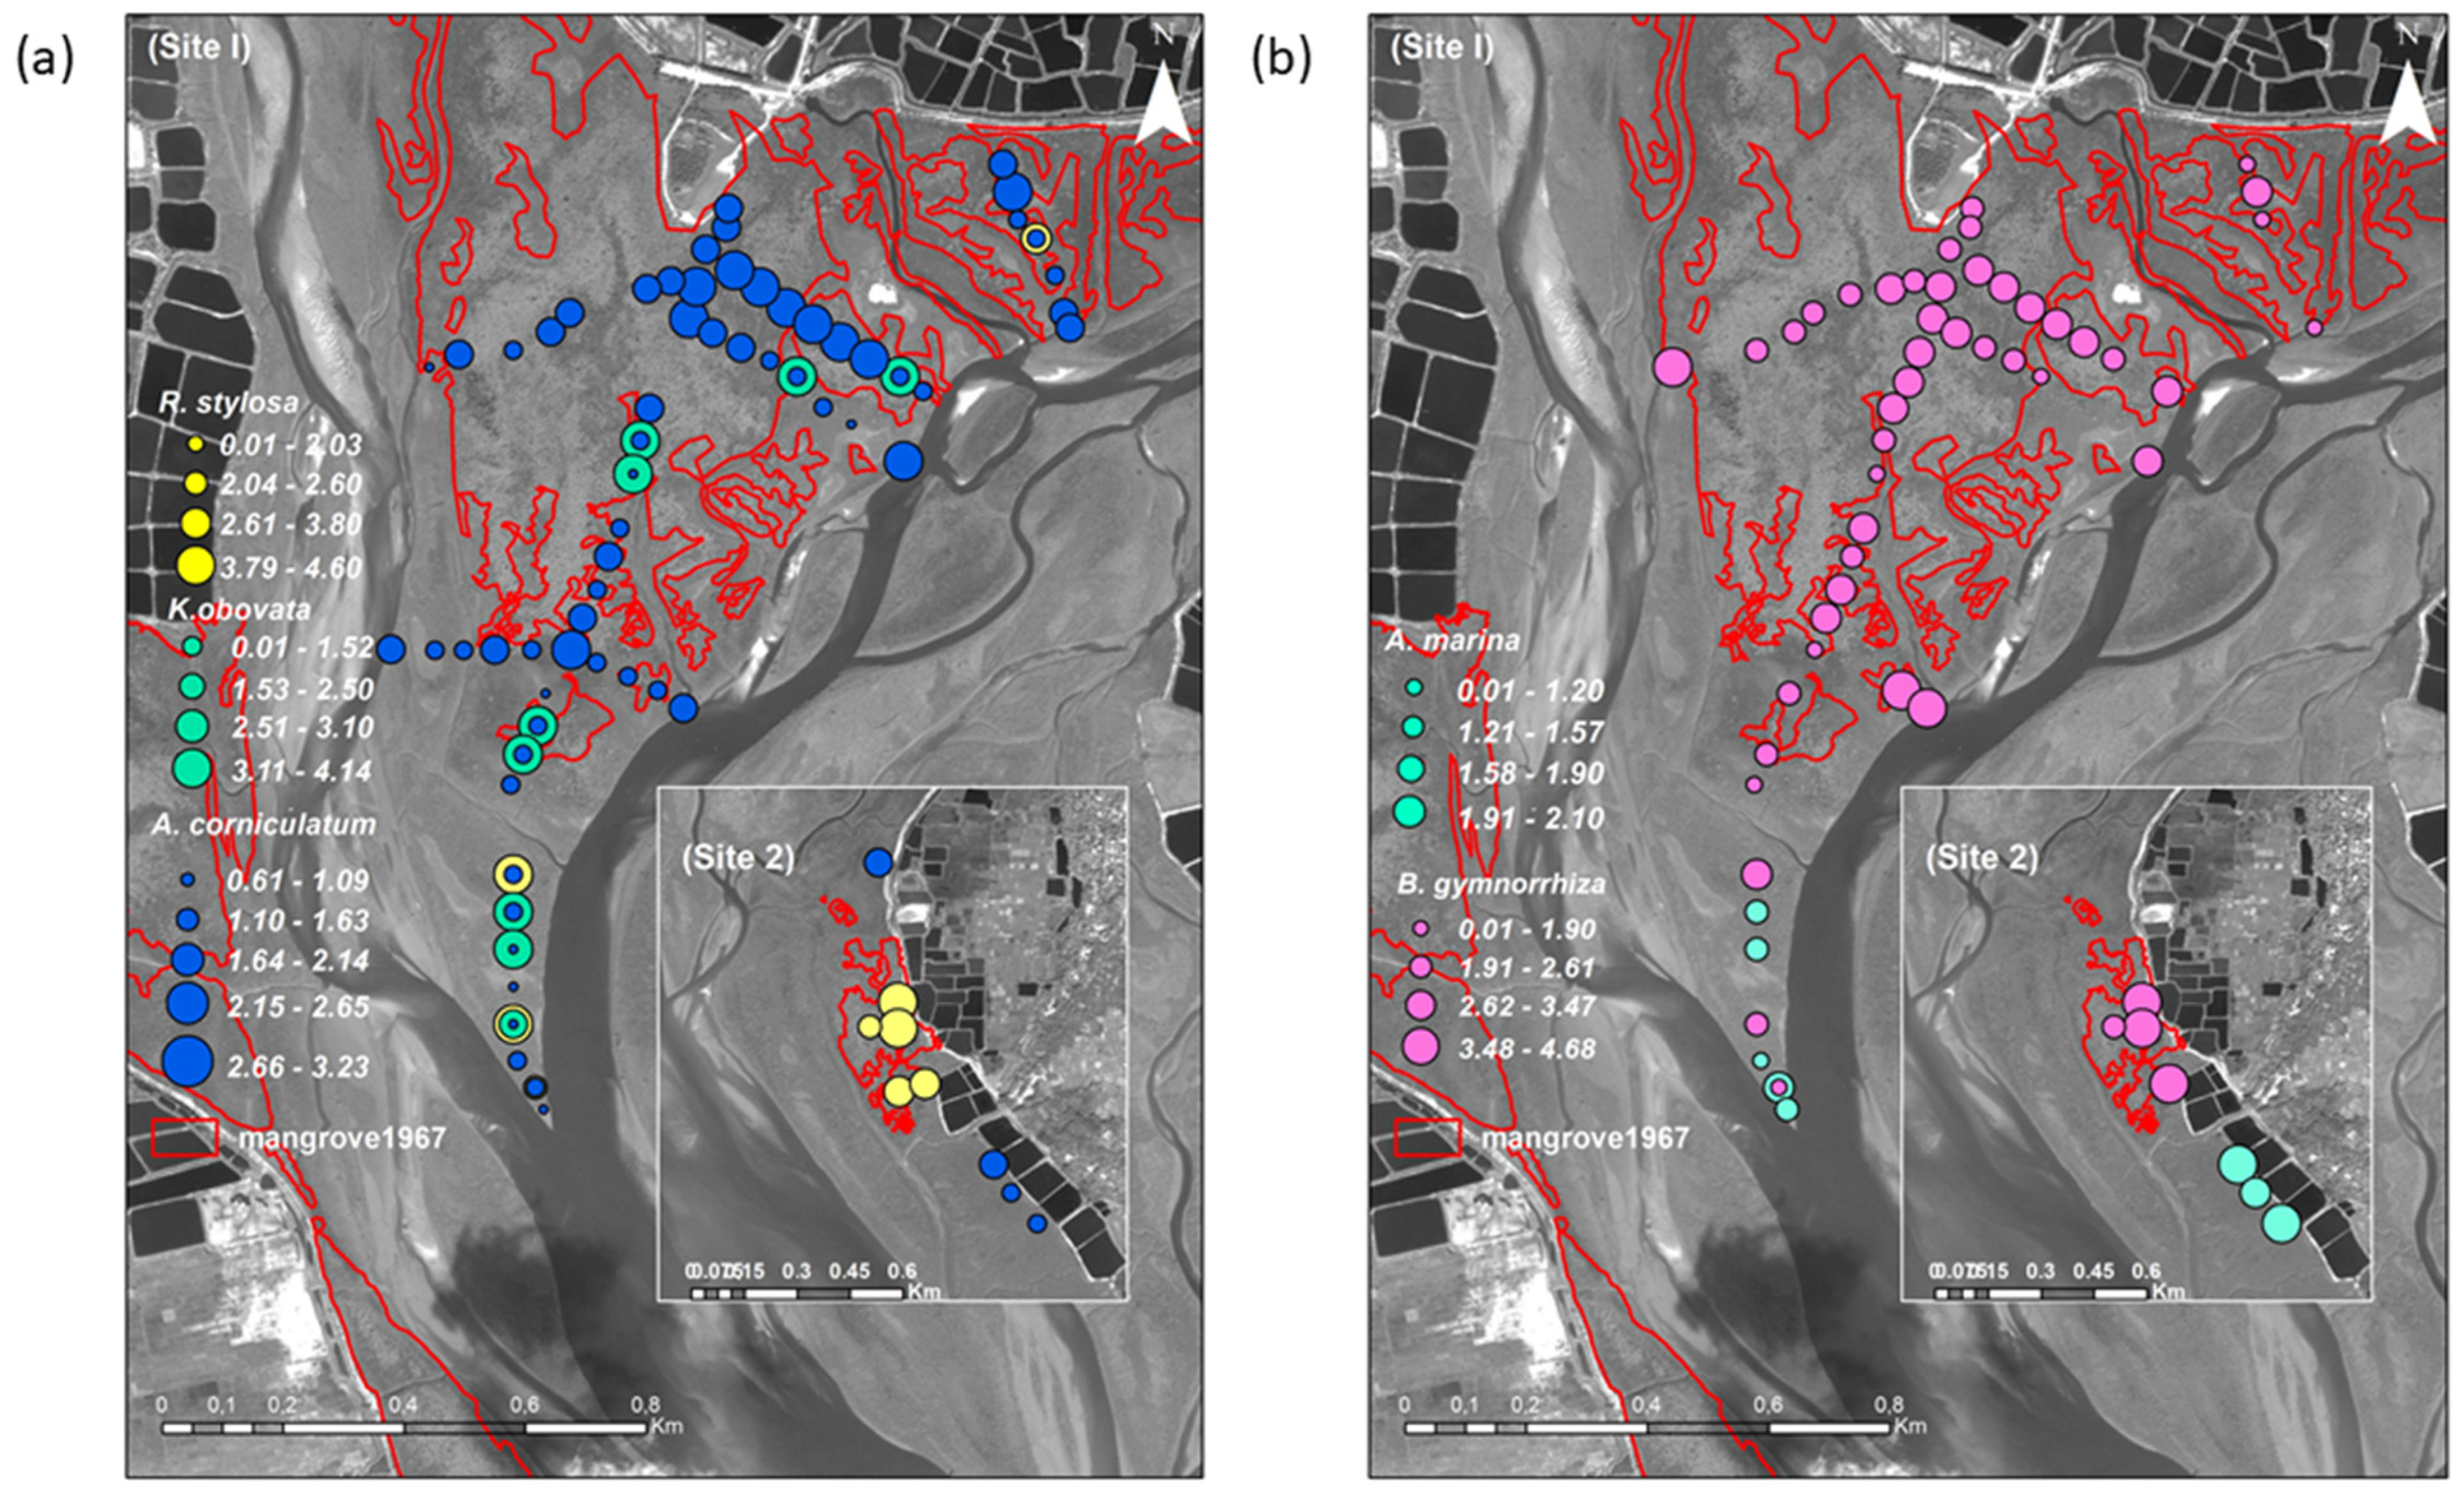
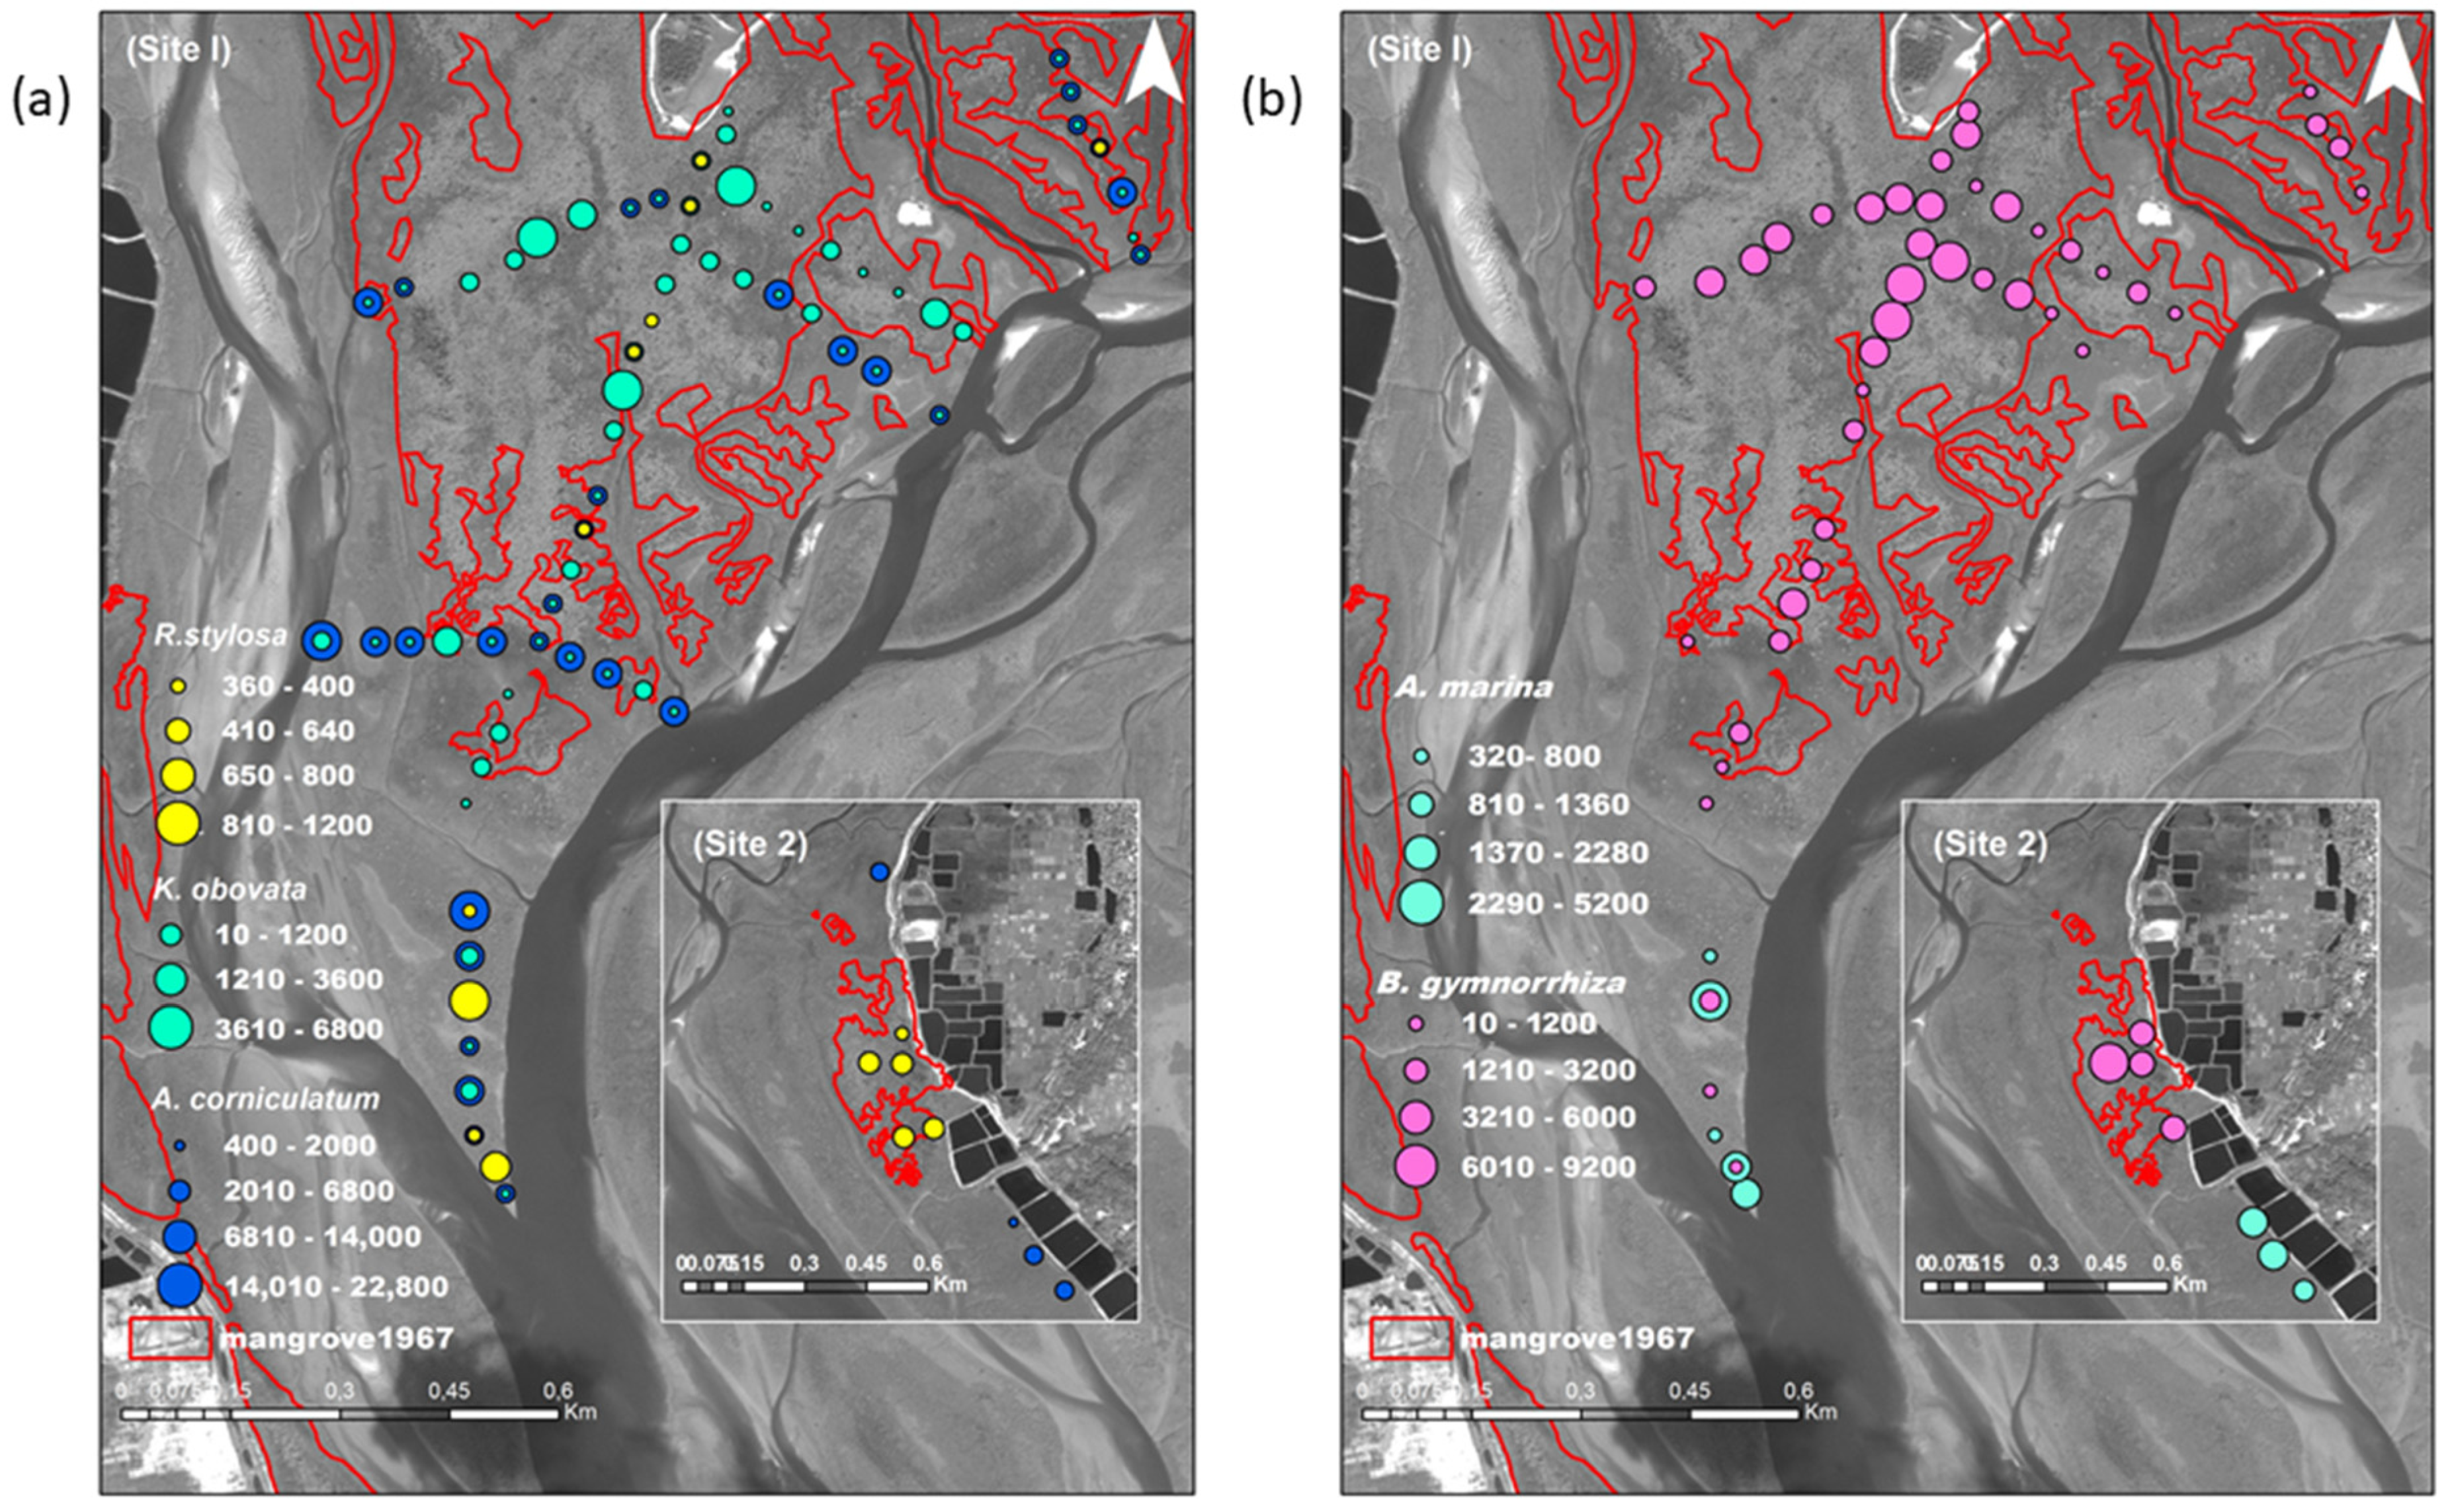
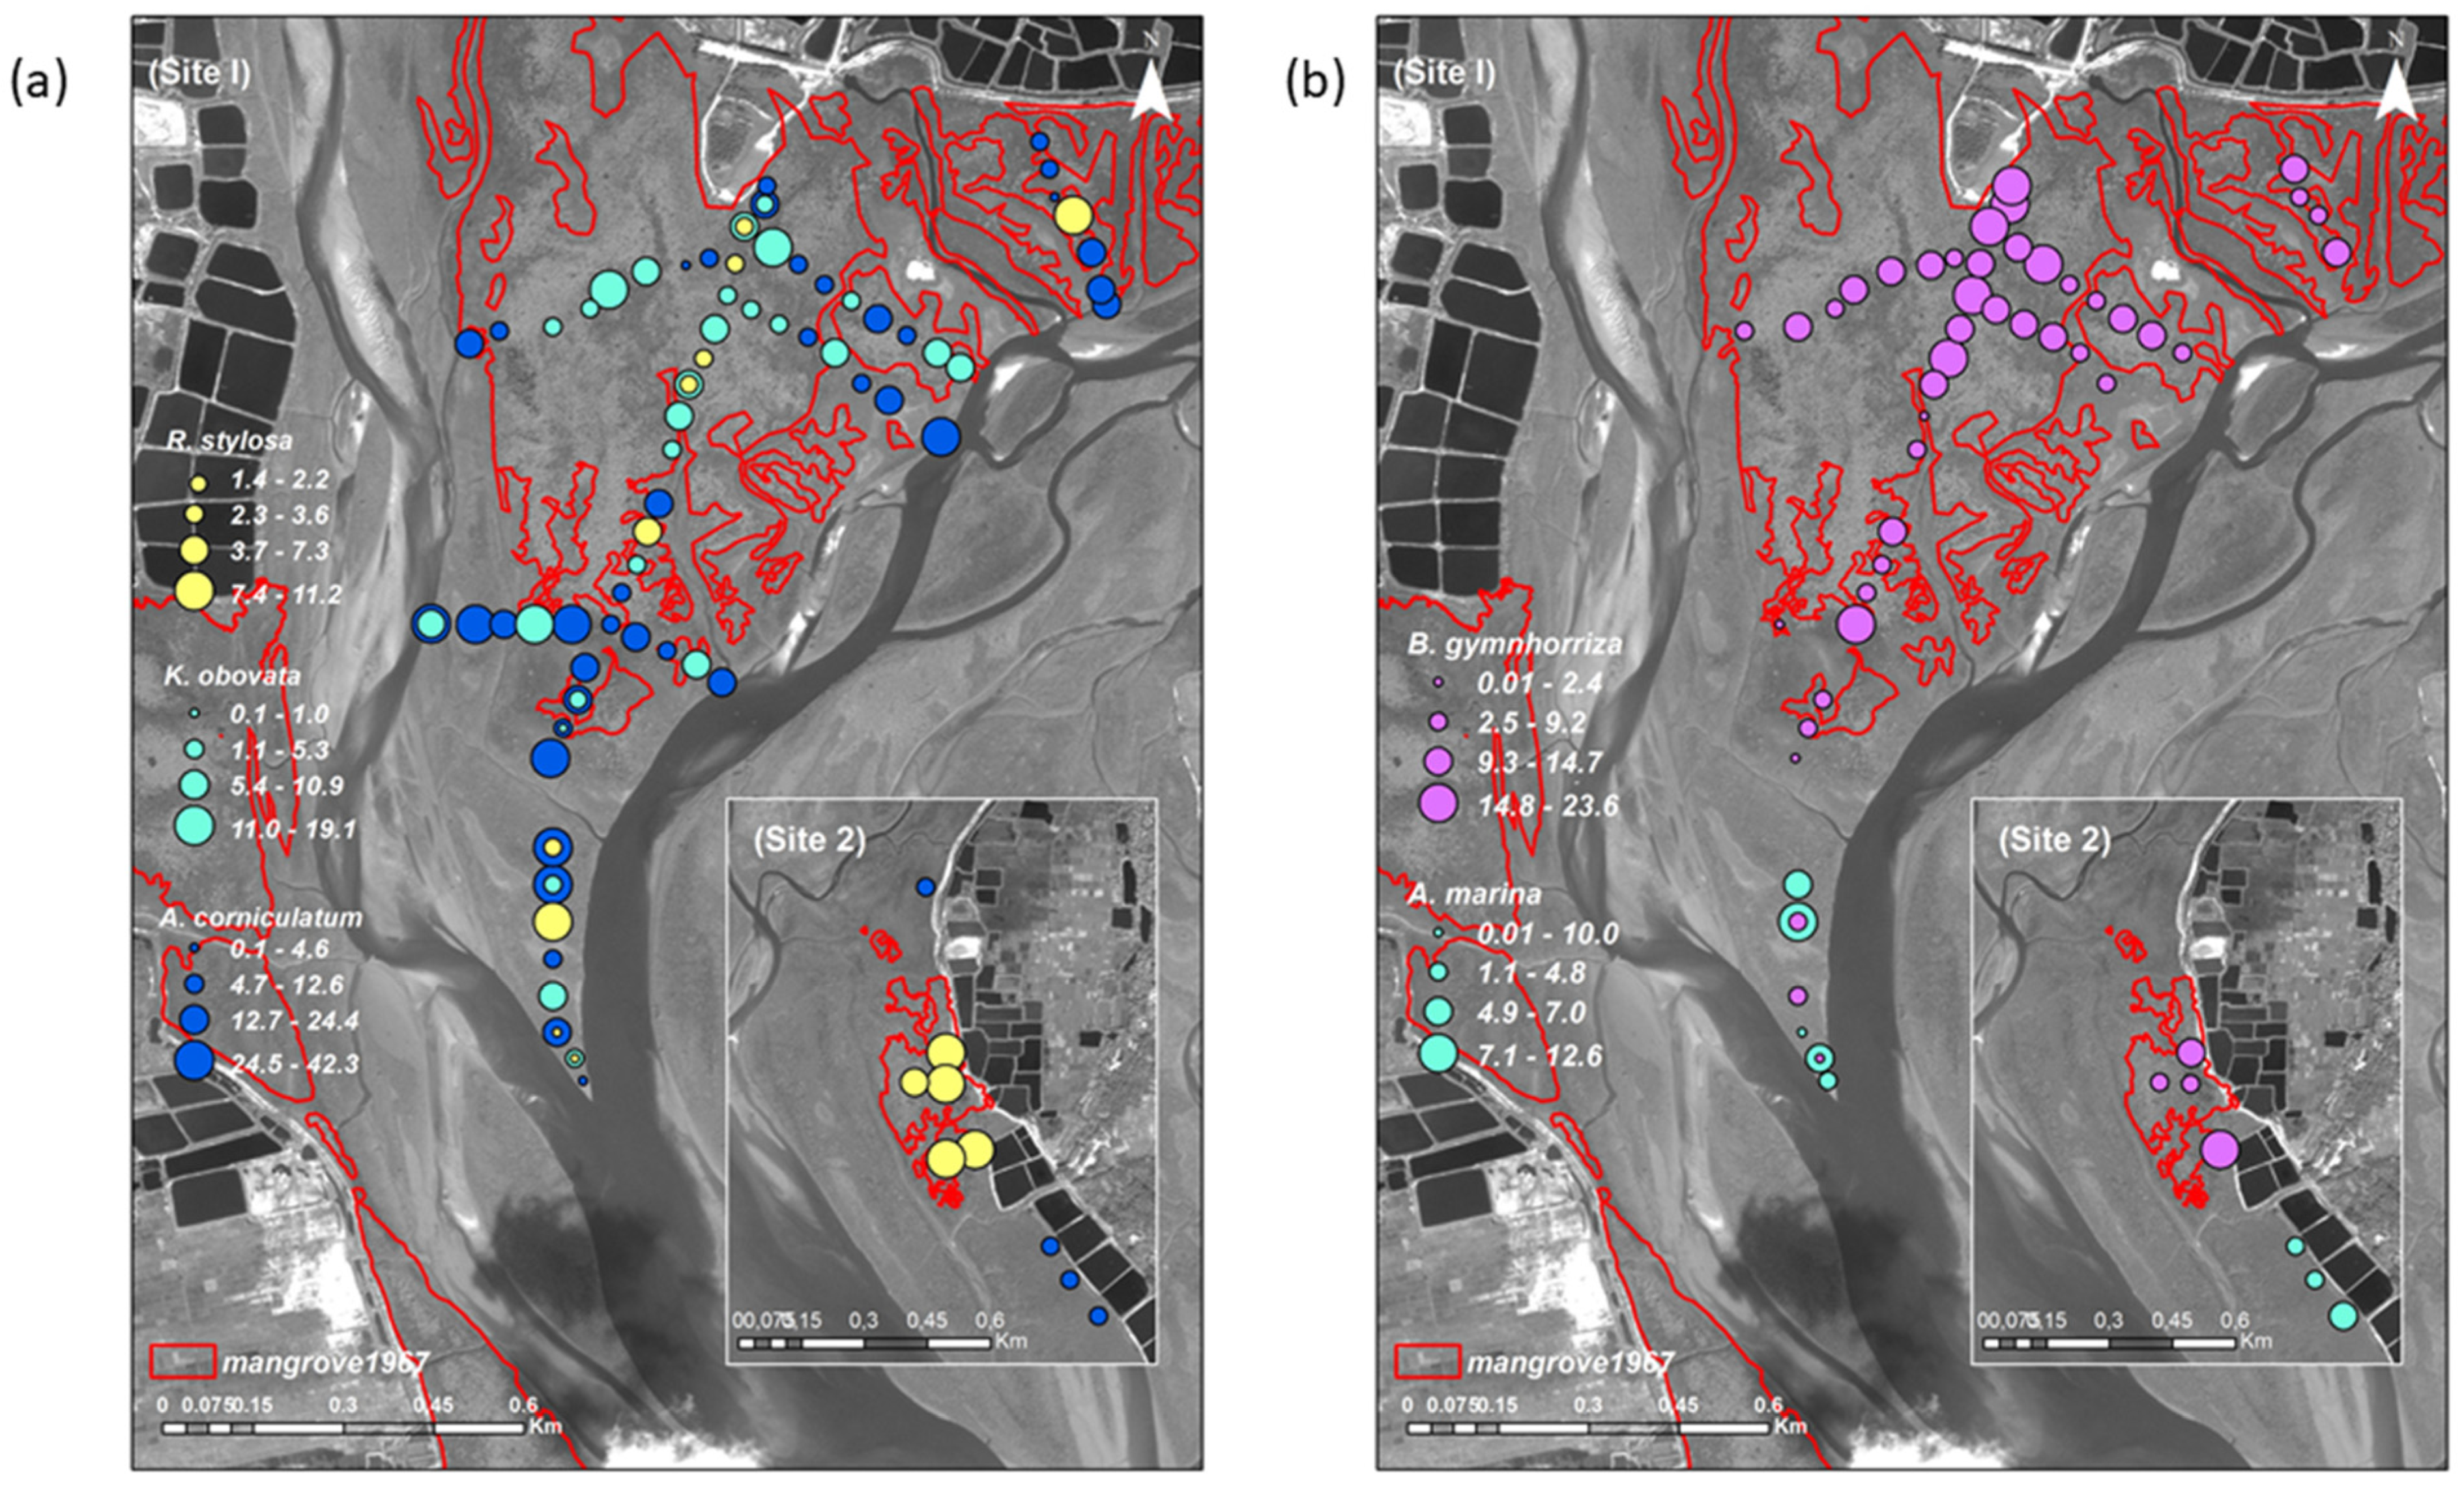
3.1. Mangrove Vegetation Structure and Distinction of Original and Non-Original Stands

Satellite data indicated that the mangrove extent in ZMNNR increased from 236.12 ha in 1967 to 567.88 ha in 2009. Among others, Aegiceras corniculatum was found to be an important species with a wide range of distribution in both original and non-original stands whereas Avicennia marina is confined to non-original stands (Table 2). Complexity index was higher in the original stands (100.59) as opposed to the non-original ones (55.65) in Site 1, and lower in original stands (5.59) as opposed to the non-original ones (9.73) in Site 2 (Table 2). The tree structural parameters were represented by significant differences among species (Table 3) except for height of A. corniculatum and Bruguiera gymnorrhiza.
The PCA showed two distinct clusters of sampling points for original and non-original, with some overlapping in the intersection, in relation to (mean) tree height measurements (cumulative variation: 63%) (Table 3, Figure 3). Whereas the cluster in blue represents the points exclusive to original mangrove (height, 3.25 m), the red shows non-original mangrove (height, 1.79 m) (Figure 3). The intersection area of these two clusters contained the sampling points of both original and non-original mangrove stands (height, 2.29 m).
The total stem density and basal area measurements also show similar trend of separation between original and non-original sampling points (Figure 4 and Figure 5). All plots were categorized according to the PCA to original, non-original and those at the intersection. Positive eigenvalues on axes 1 and 2 were associated with A. marina (Table 4), species only encountered in non-original stands (Table 1). Negative eigenvalues were associated with B. gymnorrhiza and Kandelia ovobata, which had higher values for all parameters for original stands and these species present also within non-original stands in Site 1 (Table 2). Every single plot identified within the PCA ordinations (Figure 3, Figure 4 and Figure 5) was classified as original or non-original. Then, the ordihull function distinctly delineated original and non-original plots as well as an intersecting area comprising both original and non-original plots (Figure 3, Figure 4 and Figure 5). The overlapping of all three structural parameters is highlighted in bold (Table A1). The intersection for stem density (Figure 4), A. corniculatum and Rhizophora stylosa are not separable as they presented positive and negative eigenvalues representing indistinct clustering (Table 3), but the overlapping cluster shows higher density values in original stands compared to non-original stands.

3.2. Differences of Mangrove Spatial Distribution at the Species and Sites Level

Mangrove species showed different distributional patterns between Site 1 and Site 2 at the ZMNNR (Table 2). Except K. obovata, all dominant species were available in both Sites, but not necessarily matched the same original or non-original stands. In the original and non-original stands of Site 1, both A. corniculatum and R. stylosa were observed. In Site 2, A. corniculatum was absent from original stands and present only in non-original stands, whereas R. stylosa was detected only in the original stands. K. obovata was restricted to both original and non-original stands of Site 1. Bruguiera gymnorrhiza can be found in the original stands of both Sites but only in the non-original stands of Site 1. Finally, A. marina was found in the non-original stands of both Sites but not the original stands (Table 2, Figure 6, Figure 7 and Figure 8).
The average stem diameter for all species in the original mangrove stands (⌀: 0.14 cm) was not significantly higher than that in the non-original stands (⌀: 0.11 cm) (ANOVA, F = 0.09, p = 0.76). However, the difference in average stem diameter was significant at the species level for B. gymnorrhiza (ANOVA, F = 5.52, p = 0.02), R. stylosa (ANOVA, F = 4.10, p = 0.04) and A. marina (ANOVA, F = 11.68, p = 0.04). Similarly, the mean tree height variations of different species in original and non-original mangrove stands are significant (Figure 6, and Table 2 and Table 3). Whereas R. stylosa and K. obovata showed to be significantly taller in the original stands, A. corniculatum and B. gymnorrhiza showed non-significant height differences between stands (Table 3). In terms of stem density (Figure 7), the highest estimates were found along creeks and channels regardless of the original or non-original vegetation and regardless of species. The basal area was significantly higher in the original (largely contributed by B. gymnorrhiza) as opposed to non-original (contributed by A. marina) mangrove stands (Figure 8, Table 3).

4. Discussion

4.1. Distinction of Original and Non-Original Stands

The relevance of having original mangrove conservation is to foster greater genetic diversity compared to plantations [77], along with preserving faunal communities [78,79], which need to be considered as an essential element for functionality of the mangrove forest, along with tree parameters [80,81]. Continued monitoring of original and non-original mangrove stands is important for future restoration schemes. In this context, the declassified Corona satellite image proved highly advantageous to identify original stands, particularly where open-source image datasets (e.g., Landsat) are only available from the 1970s onwards and have lower spatial resolution, which are less or not effective on longer-term (≥45 years) ecological and restoration research (Table 1). Restoration schemes will not change the disturbed forests back to their original state, the original forests remain a good reference and possible target for regeneration efforts [82,83], given that the environmental conditions do not change significantly.
The proposed non-intrusive method in the present study revealed significant tree structural differences between original and non-original mangrove stands. However, depending on the measured vegetation parameters, there are some exceptions from multi-comparison tests (post hoc Wilcoxon rank sum test). For instance, Aegiceras corniculatum and Rhizophora stylosa were highly variable and abundant, regardless of their confinement to original or non-original stands, which might explain both their positive and negative eigenvalues along both axes of the PCA (Table 4, Figure 3, Figure 4 and Figure 5). Similarly, the higher value of the Complexity Index in non-original stands in Site 2 contributed by highest density (507 stems ha−1) of A. corniculatum and A. marina (Table 2) may explain plots clustering at the intersection (Figure 3, Figure 4 and Figure 5). In general, there were lower values for tree height, density and basal area estimates in original stands as opposed to non-original stands. Clustering analysis (through PCA, etc.) has previously been used to detect genetic variance, original forest and vegetation characteristics [82,84,85], environmental parameters or faunal communities [86,87]. Further advantages and limitations of the present methodological approach with respect to GIS, remote sensing and statistical analyses were provided in Table 5.

4.2. Characteristics Affecting Mangrove Zonation

Mangrove species distribution at the ZMNNR generally coincides with the zonation patterns in the larger context of Yingluo Bay of South China [66], of which ZMNNR is part. Just like in Yingluo Bay, A. corniculatum and Avicennia marina were also found in the lower intertidal areas while Bruguiera gymnorrhiza and R. stylosa occupied the mid-intertidal landward areas (cf. Chen et al., 2018a; Zhang et al., 2006) [90,92]. The dominant species also showed specific assemblages such as A. corniculatum + A. marina and R. stylosa + B. gymnorrhiza [90]. Such consistent zonation within a single mangrove bay is, however, not universal, as it has been shown to vary significantly depending on the exact location of the transect [93]. The observed population dynamics (Figure 6, Figure 7 and Figure 8) suggest physical factors, e.g., floating properties, light availability or physical barriers, may influence mangrove species distribution [94]. In the ZMNNR, the dense pneumatophores of A. marina are likely to prevent Kandelia obovata propagules from its rooting on the ground and are thus carried away by the tidal waters [92]. This may force K. obovata to disperse to other locations as evident from its absence in Site 2. Bruguiera gymnorrhiza in original stands may have obstructed light availability to new seedling growth, and its dense canopy could have prevented itself from colonizing farther located areas [94].
The tall stands of B. gymnorrhiza and R. stylosa within original stands could exemplify their position as mature species typical of late successional stages [90]. Climax vegetations composed of these species have been reported throughout the Indo West Pacific and Atlantic East Pacific regions [80,95]. In contrast, K. obovata is suggested as transitional species in the mangrove forest succession [96,97]. The higher abundance of A. corniculatum (with its importance value = 1) in both original and non-original stands suggest a ubiquitous occurrence of this species in the ZMNNR, i.e., it is present in both original and non-original stands. Additionally, R. stylosa was observed to coexist with A. marina in the non-original stands, specifically in Site 1. The possibility to observe differential stem densities in A. marina is corroborated by its tolerance to a wide range of salinities and its response to sedimentation [98,99,100], which in ZMNNR is influenced by the freshwater discharge from Ximi and Qaoqiao rivers into Yingluo Bay [62]. Besides the absence of A. marina in original mangrove stands, its higher density in non-original stands illustrates its pioneering role [101,102]. Stem density was reported to increase during the early stages of forest development and drops over time [103,104]. This is particularly true for K. obovata, B. gymnorrhiza and R. stylosa in the original stands [90], without any natural recruitment of the former two species (pers. obs.). This personal observation is important, since distinguishing original older-growth trees depends on the proper visualization and identification of past images, i.e., Corona images show thick black areas (spots) where older-growth stands/canopies are, and saplings which may be present in original stands could not be easily observed/distinguished. This observation suggests species located in original stands may not continue to populate those areas in the mid-term future (next 45 years, i.e., the same as our study interval but projected in to the future).
The present study confirms the stands in the original mangrove stands as being in a late successional stage and better preserved than the non-original mangrove stands (Table 2 and Table 5). Higher sedimentation among the original stands must have been facilitating the growth of R. stylosa, and B. gymnorrhiza. The present observations are in line with the report of Chen et al. (2018) suggesting mangroves in the ZMNNR are in different successional stages. Long-term analysis on the forest structure would be able to reveal more changes, especially in terms of species composition and distribution [90], but this is not possible with two remote sensing datasets 42 years apart, and is beyond the scope of this paper. Meanwhile, land conversion activities (to agriculture and aquaculture practices), parasites (barnacle infestation), herbivorous crabs [105], etc., might have affected the prevalence of some mangrove species [62]. In this context, specific barriers affecting hydrodynamics and mangrove propagule dispersal should be identified [94].

4.3. Restoration Activities and Future Research

To mitigate the effects of mangrove loss, several management schemes and restoration projects have already been initiated [106], especially in South and Southeast Asia, by both government and non-government organizations [107,108,109]. Most of these restoration projects endorse silviculture as the principal practice, with coastal stabilization and environmental remediation as the main objectives [110]. However, many rehabilitation projects failed because of inappropriate planting protocols [111,112]. In the case of ZMNNR, the mangrove cover decreased by 51.8% during 1970s and then increased 15% with the plantation schemes from 1990 to 2009 [15,62]. It is worth recalling that these plantation schemes with non-native and invasive mangrove species are known to go at the expense of ecosystem functionality and have no guarantee for success [98,113,114]. In addition, temporal and spatial details of the plantations can be obtained from remote sensing data, which is useful to determine the age of forests accurately [41,46,115]. However, even with thorough mangrove management plans, it is difficult to guarantee field activities are carried out effectively. In Matang Mangrove Forest Reserve (Malaysia), for instance, supervised clearcutting is often done a few years after the tentative years indicated in the management plan [41] and the activity of clear-cutting a forest concession of 2.2 ha may take up to 2 years [46]. Unfortunately, the local authorities at the ZMNNR do not even have such documented forestry records to compare between present and past studies, and future studies for that matter.
The original mangrove stands in the ZMNNR should be at center of future conservation projects, as the core mangrove area identification benefits the conservational planning at various protection levels [48,49]. Mangrove restoration projects are to be carried out by understanding the current spatial distribution of original/non-original stands, species composition and distribution patterns. The present remote-sensing-based and fieldwork driven methodological framework can be applied to conservation and management of the ZMNNR and can be beneficial to various mangrove ecological research works (including conservation genetics) (Table 1 and Table A2). Regarding the remote sensing aspect, an integrated diachronic and up-to-date (high-resolution) image analyses would be able to reveal distinct spectral characteristics of the mangrove species in both original and non-original stands (cf. Otero et al., 2019). Further research using time-series satellite datasets, machine learning and deep learning algorithms, dendrochronological studies (e.g., cambial growth, annual ring growth and vessel densities), can provide more scientific insights in relation to the forest age, etc. [116,117]. The presented methodology may be applied in other locations and further developed to benefit benchmarking ecological research realm and serves as supportive information to the decision-making process in conservation and restoration.

5. Conclusions

The present methodological framework enabled us to distinguish original from non-original mangrove stands with significant differences found in the structural parameters. In general, tall stands with a higher density and basal area were characteristic of the original mangrove as opposed to non-original stands at the ZMNNR. Due to the lack of historical records, it is not possible to provide more insights on the changes in terms of local species composition/distribution and the planted areas of 1990. The described non-intrusive methodology has shed light on further ecological research opportunities (including conservation genetics), along with baseline data for appropriate conservation and management in the ZMNNR.

Author Contributions

Conceptualization, B.S. and F.D.-G.; methodology, B.S. and F.D.-G.; software, J.D.-C.; validation, J.D.-C., B.S. and F.D.-G.; formal analysis, J.D.-C.; investigation, J.D.-C.; data curation, J.D.-C., B.S. and F.D.-G.; writing—original draft preparation, J.D.-C., B.S. and F.D.-G.; writing—review and editing, J.D.-C., B.S., J.C.-W.C., J.B. and F.D.-G.; visualization, J.D.-C., B.S. and F.D.-G.; supervision, J.C.-W.C., B.S. and F.D.-G.; project administration, F.D.-G.; funding acquisition, J.D.-C. and F.D.-G. All authors have read and agreed to the published version of the manuscript.

Funding

J.D.-C. was supported by the VLIR scholarship. This research was funded by the F.R.S.-F.N.R.S. Fonds de la Recherche Scientifique, Brussels, Belgium (Contract N° 2.4532.09, and F.4508.11).

Data Availability Statement

Data may be available upon request to authors.

Acknowledgments

We thank X. Fanghong, L. Kangying, J. Zhang and M. Chen from the Zhanjiang Mangrove National Nature Reserve (ZMNNR) and J. Wang from the Guangdong Ocean University (GOU) for their administrative, logistic and scientific resources (Investigation, Resources). They all merit co-authorship but unfortunately have been totally disconnected since a few years making it impossible for them to contribute to the writing of this paper or, as the journal policy dictates, to approve the final version. In this light we regret to be obliged to move them to this acknowledgements section. Our special thanks are due to the volunteers who came from the GOU and helped us in the fieldwork.

Conflicts of Interest

The authors declare no conflict of interest.

Appendix A

Table A1. Classification of sampled plots according to their grouping by the PCA. Coincidental plots for the three vegetation parameters were highlighted in bold.
Vegetation ParameterOriginalIntersectionNon-Original
Height2, 4, 6, 8, 13, 22, ---25, 28, 31, 32, 33, --36, 37, 41, ---, 46, ---,55, −57, −59, 67, 68, 69, 70, 71,1, −3, 7, 10, ---, 13, 14, 15, 16, 17, ---, 20, 21, 26, 34, 35, ---,38, 39, 40, ---, 44, --, 47, --−53, -, 55, ---, 61, --−65, 679, 11, 12, ---,18, 19, 23, 24, -−27, −29, 30 31, --−42, 43, -,45, ---, 48, 49, 50, 51, 52, --−54, 55, 56,---,60, 62, 63, −64, −66, --−72, -, 73, 74, 75, 76
Density1, 2, 3, 4, 5, 6, -, 8, 9, 10, -, 12, ---, 17, ---, 27, 28, 29, 30, 31, ---, 35, 36, 37, 38, 39, ---, 46, ---, 67, 68, 69, 70, 71.7, ---, 13, -, 15, 16, 18, ---, 32, 33, 34, ---, 40, ---, 44, 45, -,47, 48, 49, -, 51, ---, 56, -, 58, 59, ---, 64, 65.11, --, 14, --,16, -, 18, 19, 20, 21, 22, 23, 24, 25, 26, ---, 36, 37, 39, -, 41, 42, 43, ---, 50, -, 52, 53, 54, 55, -, 57, -----, 60, 61, 62, 63, -−66, ----- 72, 73, 74, 75, 76.
Basal area1, 2, 3, 4, 5, 6, 7, 8, 12, ---, 22, 23, 25, 28, 36, 46, 58, 59, 67, 68, 69, 70, 71,9, 10, 11, −13, 14, 15, 16, 17, 18, 19, 20, 21, -−24, 26, 27, 29, 30, 31, 32, 33, 34, 35, 37, 38, 39, 40, 41, 42, 43, 44, 45, 47, 48, 49, 51, 52, 53, 54, 56, 62, 63, 64, 65, 66,50, 55, 57, 60, 61, 72, 73, 74, 75, 76
Table A2. Specific recommendations for genetic sampling.
  • Genetic differentiation varies between original vs. non-original stands. Studies on genetics and epigenetics based on tree height and stem diameter showed significant differences regarding forest nature [87].
  • Geographic gradients of genetic diversity could be highly important in maintaining genetic diversity through gene flow [118]. For example, genetic differences between original stands may be analyzed for climax B. gymnorrhiza and K. obovata in Sites 1 and 2 which have Gaoqiao river as a natural barrier. Is the Gaoqiao River a barrier against gene flow for climax species B. gymnorrhiza or R. stylosa? If so, R. stylosa and B. gymnorrhiza colonize Site 2 starting from Site 1, hypothesizing genetic material spreads from Site 1 to Site 2. On a wider scale, it would be useful to check if the propagules and seedlings from original stands disperse to other ZMNNR locations or neighboring provinces.
  • Studies of the vegetation structure on seaward location are suggested as plant density is an important demographic factor affecting mating systems. Mangrove species have correlated with density negatively as well as positively [119]. For instance, outcrossing species combine high rates of sexual reproduction with high amounts of propagule dispersal [120], which might explain B. gymnorrhiza presence in both original and non-original stands. Research should check what type of correlation between density and out-crossing rate exists in the ZMNNR and the Leizhou Peninsula.
  • Sampling should be accompanied with collection of environmental data (i.e., salinity, soil type, etc.). The restoration success is eventually measured by parameters, others than mangrove cover increase, i.e., vegetation structure (i.e., height, basal area and density), arthropods diversity (e.g., crabs) with a comparable reference site with no degradation on the ecological processes [50,112]
  • Studies could be focused on other nearby locations, e.g., Techeng, Beitan and Lindong because some areas may have even lost all original mangroves. Triest (2008) reported the clearance of mangrove to threaten sufficient gene diversity in out-crossing or mixed mating species. Investigations should be done across patches of stands on the Lehizou peninsula, to identify any connection between eastern and western genetic flows.
Figure A1. Raw satellite images used for this study; (a) The extent of ZMNNR mangrove as observed from Corona KH-4B satellite imagery dated 17 Dec 1967; (b) The extent of ZMNNR mangrove cover observed on GeoEye-1 satellite image dated 16 Oct 2009; (c) The on-screen digitized blue polygon on original late community mangrove observed on Corona KH-4B satellite imagery; (d) The on-screen digitized red polygons on mangrove forest observed on GeoEye-1 satellite image; (e) Overlaid on-screen digitized polygons of mangrove as observed in 1967 (blue) and 2009 (blue) satellite datasets.
Remotesensing 13 02781 g0a1
Figure A2. False colour composite using bands R = 4; G = 3; B = 2 on the pansharpened GeoEye-1 image.
Remotesensing 13 02781 g0a2

References

  1. Dahdouh-Guebas, F.; Ajonina, G.N.; Amir, A.A.; Andradi-Brown, D.A.; Aziz, I.; Balke, T.; Barbier, E.B.; Cannicci, S.; Cragg, S.M.; Cunha-Lignon, M.; et al. Public Perceptions of Mangrove Forests Matter for Their Conservation. Front. Mar. Sci. 2020, 7, 901. [Google Scholar] [CrossRef]
  2. Del Valle, A.; Eriksson, M.; Ishizawa, O.A.; Miranda, J.J. Mangroves protect coastal economic activity from hurricanes. Proc. Natl. Acad. Sci. USA 2020, 117, 265–270. [Google Scholar] [CrossRef]
  3. Lee, S.Y.; Primavera, J.H.; Dahdouh-Guebas, F.; Mckee, K.; Bosire, J.O.; Cannicci, S.; Diele, K.; Fromard, F.; Koedam, N.; Marchand, C.; et al. Ecological role and services of tropical mangrove ecosystems: A reassessment. Glob. Ecol. Biogeogr. 2014, 23, 726–743. [Google Scholar] [CrossRef]
  4. Cohen, R.; Kaino, J.; Okello, J.A.; Bosire, J.O.; Kairo, J.G.; Huxham, M.; Mencuccini, M. Propagating uncertainty to estimates of above-ground biomass for Kenyan mangroves: A scaling procedure from tree to landscape level. For. Ecol. Manag. 2013, 310, 968–982. [Google Scholar] [CrossRef]
  5. Osland, M.J.; Feher, L.C.; Spivak, A.C.; Nestlerode, J.A.; Almario, A.E.; Cormier, N.; From, A.S.; Krauss, K.W.; Russell3, M.J.; Alvarez, F.; et al. Rapid peat development beneath created, maturing mangrove forests: Ecosystem changes across 25-year chronosequence. Ecol. Appl. 2020, 30, 1–12. [Google Scholar] [CrossRef]
  6. Sasmito, S.D.; Kuzyakov, Y.; Lubis, A.A.; Murdiyarso, D.; Hutley, L.B.; Bachri, S.; Friess, D.A.; Martius, C.; Borchard, N. Organic carbon burial and sources in soils of coastal mudflat and mangrove ecosystems. Catena 2020, 187, 104414. [Google Scholar] [CrossRef]
  7. Ashton, E.C.; Macintosh, D.J. Preliminary assessment of the plant diversity and community ecology of the Sematan mangrove forest, Sarawak, Malaysia. For. Ecol. Manag. 2002, 166, 111–129. [Google Scholar] [CrossRef]
  8. Bell, A.M.; Duke, N.C. Effects of Photosystem II inhibiting herbicides on mangroves—Preliminary toxicology trials. Mar. Pollut. Bull. 2005, 51, 297–307. [Google Scholar] [CrossRef]
  9. Wolswijk, G.; Satyanarayana, B.; Dung, L.Q.; Siau, Y.F.; Ali, A.N.B.; Saliu, I.S.; Fisol, M.A.B.; Gonnelli, C.; Dahdouh-Guebas, F. Distribution of mercury in sediments, plant and animal tissues in Matang Mangrove Forest Reserve, Malaysia. J. Hazard. Mater. 2020, 387, 121665. [Google Scholar] [CrossRef] [Green Version]
  10. FAO Mangrove Ecosystem Restoration and Management. Available online: http://www.fao.org/sustainable-forest-management/toolbox/modules/mangroves-restoration-and-management/basic-knowledge/en/#:~:text=Mangrove ecosystems provide habitat for,for birds and other wildlife (accessed on 6 March 2020).
  11. GNF Mangrove Rehabilitation in Asia—Local Action and Cross-Border Transfer of Knowledge for the Conservation of Climate, Forests and Biodiversity. Available online: https://www.globalnature.org/Mangroves (accessed on 6 March 2020).
  12. Martínez-Espinosa, C.; Wolfs, P.; Vande Velde, K.; Satyanarayana, B.; Dahdouh-Guebas, F.; Hugé, J. Call for a collaborative management at Matang Mangrove Forest Reserve, Malaysia: An assessment from local stakeholders’ view point. For. Ecol. Manag. 2020, 458, 117741. [Google Scholar] [CrossRef]
  13. Friess, D.A.; Yando, E.S.; Abuchahla, G.M.O.; Adams, J.B.; Cannicci, S.; Canty, S.W.J.; Cavanaugh, K.C.; Connolly, R.M.; Cormier, N.; Dahdouh-Guebas, F.; et al. Mangroves give cause for conservation optimism, for now. Curr. Biol. 2020, 30, R153–R154. [Google Scholar] [CrossRef] [Green Version]
  14. Hamilton, S.E.; Casey, D. Creation of a high spatio-temporal resolution global database of continuous mangrove forest cover for the 21st century (CGMFC-21). Glob. Ecol. Biogeogr. 2016, 25, 729–738. [Google Scholar] [CrossRef]
  15. Satyanarayana, B.; Mulder, S.; Jayatissa, L.P.; Dahdouh-Guebas, F. Are the mangroves in the Galle-Unawatuna area (Sri Lanka) at risk? A social-ecological approach involving local stakeholders for a better conservation policy. Ocean Coast. Manag. 2013, 71, 225–237. [Google Scholar] [CrossRef] [Green Version]
  16. Curnick, D.J.; Pettorelli, N.; Amir, A.A.; Balke, T.; Barbier, E.B.; Crooks, S.; Dahdouh-Guebas, F.; Duncan, C.; Endsor, C.; Friess, D.A.; et al. The value of small mangrove patches. Science (80-) 2019, 363, 239. [Google Scholar] [CrossRef] [Green Version]
  17. Jacobson, A.P.; Riggio, J.; Tait, A.M.; Baillie, J.E.M. Global areas of low human impact (‘Low Impact Areas’) and fragmentation of the natural world. Sci. Rep. 2019, 9, 14179. [Google Scholar] [CrossRef]
  18. Li, M.S.; Mao, L.J.; Shen, W.J.; Liu, S.Q.; Wei, A.S. Change and fragmentation trends of Zhanjiang mangrove forests in southern China using multi-temporal Landsat imagery (1977–2010). Estuar. Coast. Shelf Sci. 2013, 130, 111–120. [Google Scholar] [CrossRef]
  19. Arias-Ortiz, A.; Masqué, P.; Glass, L.; Benson, L.; Kennedy, H.; Duarte, C.M.; Garcia-Orellana, J.; Benitez-Nelson, C.R.; Humphries, M.S.; Ratefinjanahary, I.; et al. Losses of Soil Organic Carbon with Deforestation in Mangroves of Madagascar. Ecosystems 2021, 24, 1–19. [Google Scholar] [CrossRef]
  20. Kennedy, J.P.; Craig, H.; Jara-Cavieres, A.; Lundy, A.; Preziosi, R.F.; Rowntree, J.K. Multiplex microsatellite PCR panels for the neotropical red mangrove, Rhizophora mangle: Combining efforts towards a cost-effective and modifiable tool to better inform conservation and management. Conserv. Genet. Resour. 2020, 12, 503–513. [Google Scholar] [CrossRef] [Green Version]
  21. Lovelock, C.E.; Feller, I.C.; Reef, R.; Hickey, S.; Ball, M.C. Mangrove dieback during fluctuating sea levels. Sci. Rep. 2017, 7, 1680. [Google Scholar] [CrossRef] [PubMed]
  22. Sippo, J.Z.; Lovelock, C.E.; Santos, I.R.; Sanders, C.J.; Maher, D.T. Mangrove mortality in a changing climate: An overview. Estuar. Coast. Shelf Sci. 2018, 215, 241–249. [Google Scholar] [CrossRef]
  23. Adeel, Z.; Pomeroy, R. Assessment and management of mangrove ecosystems in developing countries. Trees Struct. Funct. 2002, 16, 235–238. [Google Scholar] [CrossRef]
  24. Marchio, D.A.; Savarese, M.; Bovard, B.; Mitsch, W.J. Carbon sequestration and sedimentation in mangrove swamps influenced by hydrogeomorphic conditions and urbanization in Southwest Florida. Forests 2016, 7, 116. [Google Scholar] [CrossRef] [Green Version]
  25. Sanderman, J.; Hengl, T.; Fiske, G.; Solvik, K.; Adame, M.F.; Benson, L.; Bukoski, J.J.; Carnell, P.; Cifuentes-Jara, M.; Donato, D.; et al. A global map of mangrove forest soil carbon at 30 m spatial resolution. Environ. Res. Lett. 2018, 13, 055002. [Google Scholar] [CrossRef]
  26. Bunting, P.; Rosenqvist, A.; Lucas, R.M.; Rebelo, L.M.; Hilarides, L.; Thomas, N.; Hardy, A.; Itoh, T.; Shimada, M.; Finlayson, C.M. The global mangrove watch—A new 2010 global baseline of mangrove extent. Remote Sens. 2018, 10, 1669. [Google Scholar] [CrossRef] [Green Version]
  27. Spalding, M. World Atlas of Mangroves; Routledge: London, UK, 2010. [Google Scholar]
  28. Goldberg, L.; Lagomasino, D.; Thomas, N.; Fatoyinbo, T. Global declines in human-driven mangrove loss. Glob. Chang. Biol. 2020, 26, 5844–5855. [Google Scholar] [CrossRef] [PubMed]
  29. Richards, D.R.; Friess, D.A. Rates and drivers of mangrove deforestation in Southeast Asia, 2000–2012. Proc. Natl. Acad. Sci. USA 2016, 113, 344–349. [Google Scholar] [CrossRef] [PubMed] [Green Version]
  30. Granado, R.; Pinto Neta, L.; Nunes-Freitas, A.; Voloch, C.; Lira, C. Assessing Genetic Diversity after Mangrove Restoration in Brazil: Why Is It So Important? Diversity 2018, 10, 27. [Google Scholar] [CrossRef] [Green Version]
  31. Schaeffer-Novelli, Y.; Cintrón-Molero, G.; Reis-Neto, A.S.; Abuchahla, G.M.O.; Neta, L.C.P.; Lira-Medeiros, C.F. The mangroves of Araçá Bay through time: An interdisciplinary approach for conservation of spatial diversity at large scale. Ocean Coast. Manag. 2018, 164, 60–67. [Google Scholar] [CrossRef]
  32. Alongi, D.M. Mangrove forests: Resilience, protection from tsunamis, and responses to global climate change. Estuar. Coast. Shelf Sci. 2008, 76, 1–13. [Google Scholar] [CrossRef]
  33. Nehemia, A.; Kochzius, M. Reduced genetic diversity and alteration of gene flow in a fiddler crab due to mangrove degradation. PLoS ONE 2017, 12, e0182987. [Google Scholar] [CrossRef] [Green Version]
  34. Do, B.T.N.; Koedam, N.; Triest, L. Avicennia marina maintains genetic structure whereas Rhizophora stylosa connects mangroves in a flooded, former inner sea (Vietnam). Estuar. Coast. Shelf Sci. 2019, 222, 195–204. [Google Scholar] [CrossRef]
  35. Fairuz-Fozi, N.; Triest, L.; Mat Zauki, N.A.; Kaben, A.M.; Nelson, B.R.; Chatterji, A.; Akhir, M.F.; Satyanarayana, B.; Dahdouh-Guebas, F. Mangrove horseshoe crab (Carcinoscorpius rotundicauda Latreille, 1802) populations show genetic break in Strait of Malacca with a connectivity along southern coasts of Peninsular Malaysia. Aquat. Conserv. Mar. Freshw. Ecosyst. 2021. [Google Scholar] [CrossRef]
  36. Guo, Z.; Li, X.; He, Z.; Yang, Y.; Wang, W.; Zhong, C.; Greenberg, A.J.; Wu, C.I.; Duke, N.C.; Shi, S. Extremely low genetic diversity across mangrove taxa reflects past sea level changes and hints at poor future responses. Glob. Chang. Biol. 2018, 24, 1741–1748. [Google Scholar] [CrossRef]
  37. Ngeve, M.N.; Van der Stocken, T.; Menemenlis, D.; Koedam, N.; Triest, L. Hidden founders? Strong bottlenecks and fine-scale genetic structure in mangrove populations of the Cameroon Estuary complex. Hydrobiologia 2017, 803, 189–207. [Google Scholar] [CrossRef]
  38. Binks, R.M.; Byrne, M.; McMahon, K.; Pitt, G.; Murray, K.; Evans, R.D. Habitat discontinuities form strong barriers to gene flow among mangrove populations, despite the capacity for long-distance dispersal. Divers. Distrib. 2019, 25, 298–309. [Google Scholar] [CrossRef] [Green Version]
  39. Ragavan, P.; Zhou, R.; Ng, W.L.; Rana, T.S.; Mageswaran, T.; Mohan, P.M.; Saxena, A. Natural hybridization in mangroves—An overview. Bot. J. Linn. Soc. 2017, 185, 208–224. [Google Scholar] [CrossRef]
  40. Andersen, G.L. How to detect desert trees using corona images: Discovering historical ecological data. J. Arid Environ. 2006, 65, 491–511. [Google Scholar] [CrossRef] [Green Version]
  41. Otero, V.; Van De Kerchove, R.; Satyanarayana, B.; Mohd-Lokman, H.; Lucas, R.; Dahdouh-Guebas, F. An analysis of the early regeneration of mangrove forests using Landsat time series in the matang mangrove forest reserve, Peninsular Malaysia. Remote Sens. 2019, 11, 774. [Google Scholar] [CrossRef] [Green Version]
  42. Luo, S.; Chui, T.F.M. Annual variations in regional mangrove cover in southern China and potential macro- climatic and hydrological indicators. Ecol. Indic. 2020, 110, 105927. [Google Scholar] [CrossRef]
  43. Nikinmaa, L.; Lindner, M.; Cantarello, E.; Jump, A.S.; Seidl, R.; Winkel, G.; Muys, B. Reviewing the Use of Resilience Concepts in Forest Sciences. Curr. For. Rep. 2020, 6, 61–80. [Google Scholar] [CrossRef]
  44. Swales, A.; Reeve, G.; Cahoon, D.R.; Lovelock, C.E. Landscape Evolution of a Fluvial Sediment-Rich Avicennia marina Mangrove Forest: Insights from Seasonal and Inter-annual Surface-Elevation Dynamics. Ecosystems 2019, 22, 1232–1255. [Google Scholar] [CrossRef] [Green Version]
  45. Swales, A.; Lovelock, C.E. Comparison of sediment-plate methods to measure accretion rates in an estuarine mangrove forest (New Zealand). Estuar. Coast. Shelf Sci. 2020, 236, 106642. [Google Scholar] [CrossRef]
  46. Lucas, R.; Van De Kerchove, R.; Otero, V.; Lagomasino, D.; Fatoyinbo, L.; Omar, H.; Satyanarayana, B.; Dahdouh-Guebas, F. Structural characterisation of mangrove forests achieved through combining multiple sources of remote sensing data. Remote Sens. Environ. 2020, 237, 111543. [Google Scholar] [CrossRef]
  47. Dangremond, E.M.; Feller, I.C. Precocious reproduction increases at the leading edge of a mangrove range expansion. Ecol. Evol. 2016, 6, 5087–5092. [Google Scholar] [CrossRef] [PubMed] [Green Version]
  48. Borges, R.; Ferreira, A.C.; Lacerda, L.D. Systematic planning and ecosystem-based management as strategies to reconcile mangrove conservation with resource use. Front. Mar. Sci. 2017, 4, 353. [Google Scholar] [CrossRef] [Green Version]
  49. Song, D.X.; Huang, C.; Sexton, J.O.; Channan, S.; Feng, M.; Townshend, J.R. Use of landsat and corona data for mapping forest cover change from the mid-1960s to 2000s: Case studies from the eastern united states and central brazil. ISPRS J. Photogramm. Remote Sens. 2015, 103, 81–92. [Google Scholar] [CrossRef] [Green Version]
  50. Bosire, J.O.; Dahdouh-Guebas, F.; Walton, M.; Crona, B.I.; Lewis, R.R.; Field, C.; Kairo, J.G.; Koedam, N. Functionality of restored mangroves: A review. Aquat. Bot. 2008, 89, 251–259. [Google Scholar] [CrossRef] [Green Version]
  51. Salmo, S.G.; Lovelock, C.; Duke, N.C. Vegetation and soil characteristics as indicators of restoration trajectories in restored mangroves. Hydrobiologia 2013, 720, 1–18. [Google Scholar] [CrossRef]
  52. Lee, R.Y.; Porubsky, W.P.; Feller, I.C.; McKee, K.L.; Joye, S.B. Porewater biogeochemistry and soil metabolism in dwarf red mangrove habitats (Twin Cays, Belize). Biogeochemistry 2008, 87, 181–198. [Google Scholar] [CrossRef]
  53. Pupin, B.; Nahas, E. Microbial populations and activities of mangrove, restinga and Atlantic forest soils from Cardoso Island, Brazil. J. Appl. Microbiol. 2014, 116, 851–864. [Google Scholar] [CrossRef]
  54. Ren, H.; Jian, S.; Lu, H.; Zhang, Q.; Shen, W.; Han, W.; Yin, Z.; Guo, Q. Restoration of mangrove plantations and colonisation by native species in Leizhou bay, South China. Ecol. Res. 2008, 23, 401–407. [Google Scholar] [CrossRef] [Green Version]
  55. Satyanarayana, B.; Mohamad, K.A.; Idris, I.F.; Husain, M.L.; Dahdouh-Guebas, F. Assessment of mangrove vegetation based on remote sensing and ground-truth measurements at Tumpat, Kelantan Delta, East Coast of Peninsular Malaysia. Int. J. Remote Sens. 2011, 32, 1635–1650. [Google Scholar] [CrossRef]
  56. Hamilton, S.E.; Castellanos-Galindo, G.A.; Millones-Mayer, M.; Chen, M. Remote sensing of mangrove forests: Current techniques and existing databases. Coast. Res. Libr. 2018, 25, 497–520. [Google Scholar] [CrossRef]
  57. Kuenzer, C.; Bluemel, A.; Gebhardt, S.; Quoc, T.V.; Dech, S. Remote sensing of mangrove ecosystems: A review. Remote Sens. 2011, 3, 878–928. [Google Scholar] [CrossRef] [Green Version]
  58. Ruwaimana, M.; Satyanarayana, B.; Otero, V.; Muslim, A.M.; Muhammad Syafiq, A.; Ibrahim, S.; Raymaekers, D.; Koedam, N.; Dahdouh-Guebas, F. The advantages of using drones over space-borne imagery in the mapping of mangrove forests. PLoS ONE 2018, 13, e0200288. [Google Scholar] [CrossRef] [Green Version]
  59. Grosse, G.; Schirrmeister, L.; Kunitsky, V.V.; Hubberten, H.W. The use of CORONA images in remote sensing of periglacial geomorphology: An illustration from the NE Siberian coast. Permafr. Periglac. Process. 2005, 16, 163–172. [Google Scholar] [CrossRef] [Green Version]
  60. Nita, M.D.; Munteanu, C.; Gutman, G.; Abrudan, I.V.; Radeloff, V.C. Widespread forest cutting in the aftermath of World War II captured by broad-scale historical Corona spy satellite photography. Remote Sens. Environ. 2018, 204, 322–332. [Google Scholar] [CrossRef]
  61. Ghosh, A.; Schmidt, S.; Fickert, T.; Nüsser, M. The Indian Sundarban mangrove forests: History, utilization, conservation strategies and local perception. Diversity 2015, 7, 149–169. [Google Scholar] [CrossRef]
  62. Leempoel, K.; Satyaranayana, B.; Bourgeois, C.; Zhang, J.; Chen, M.; Wang, J.; Bogaert, J.; Dahdouh-Guebas, F. Dynamics in mangroves assessed by high-resolution and multi-temporal satellite data: A case study in Zhanjiang Mangrove National Nature Reserve (ZMNNR), P. R. China. Biogeosciences 2013, 10, 5681–5689. [Google Scholar] [CrossRef]
  63. Gao, X.M.; Han, W.D.; Liu, S.Q. The mangrove and its conservation in Leizhou Peninsula, China. J. For. Res. 2009, 20, 174–178. [Google Scholar] [CrossRef]
  64. Ramsar Convention Bureau. List of Wetlands of International Importance; Ramsar Convention Bureau: Gland, Switzerland, 2002. [Google Scholar]
  65. World Weather Online Zhanjiang Monthly Climate Averages. Available online: https://www.worldweatheronline.com/zhanjiang-weather-averages/guangdong/cn.aspx (accessed on 21 September 2020).
  66. Wang, G.; Guan, D.; Xiao, L.; Peart, M.R.; Zhang, H.; Singh, M. Changes in mangrove community structures affecting sediment carbon content in Yingluo Bay of South China. Mar. Pollut. Bull. 2019, 149, 110581. [Google Scholar] [CrossRef]
  67. Laben, C.A.; Brower, B. Process for Enhancing the Spatial Resolution of Multispectral Imagery Using Pan-Sharpening of Multispectral Imagery Using Pan-Sharpening. U.S. Patent No. 6,011,875, 1 January 2000. [Google Scholar]
  68. ESRI Fundamentals of Panchromatic Sharpening. Available online: https://desktop.arcgis.com/en/arcmap/10.3/manage-data/raster-and-images/fundamentals-of-panchromatic-sharpening.htm (accessed on 1 June 2021).
  69. U.S. EPA. Methods for Evaluating Wetland Condition: Using Algae To Assess Environ- mental Conditions in Wetlands; U.S. EPA: Washington, DC, USA, 2002; Volume 11, pp. 246–259.
  70. Tomlinson, P.B. The Botany of Mangroves, 1st ed.; Cambridge University Press: Cambridge, UK, 1986; ISBN 0521255678. [Google Scholar]
  71. Brokaw, N.; Thompson, J. The H for DBH. For. Ecol. Manag. 2000, 129, 89–91. [Google Scholar] [CrossRef]
  72. Cintrón, G.; Schaeffer-Novelli, Y. Methods for studying mangrove structure. In The Mangrove Ecosystem: Research Methods; UNESCO: Paris, France, 1984; pp. 91–113. ISBN 9231021818. [Google Scholar]
  73. Ellison, A.M.; Mukherjee, B.B.; Karim, A. Testing patterns of zonation in mangroves: Scale dependence and environmental correlates in the Sundarbans of Bangladesh. J. Ecol. 2000, 88, 813–824. [Google Scholar] [CrossRef]
  74. Piotrowska, M.; Stepien, P.P.; Bartnik, E.; Zakrzewska, E. Basic and neutral amino acid transport in Aspergillus nidulans. J. Gen. Microbiol. 1976, 92, 89–96. [Google Scholar] [CrossRef] [Green Version]
  75. R Core Team. R: A Language and Environment for Statistical Computing; R Foundation for Statistical Computing: Vienna, Austria; Available online: https://www.r-project.org/ (accessed on 1 February 2020).
  76. Lee, S.; Lee, D.K. What is the proper way to apply the multiple comparison test? Korean J. Anesthesiol. 2018, 71, 353–360. [Google Scholar] [CrossRef] [Green Version]
  77. Triest, L. Molecular ecology and biogeography of mangrove trees towards conceptual insights on gene flow and barriers: A review. Aquat. Bot. 2008, 89, 138–154. [Google Scholar] [CrossRef]
  78. Bosire, J.O.; Dahdouh-Guebas, F.; Kairo, J.G.; Cannicci, S.; Koedam, N. Spatial variations in macrobenthic fauna recolonisation in a tropical mangrove bay. Biodivers. Conserv. 2004, 13, 1059–1074. [Google Scholar] [CrossRef] [Green Version]
  79. De Oliveira Côrtes, L.H.; Zappes, C.A.; Di Beneditto, A.P.M. The crab harvest in a mangrove forest in south-eastern Brazil: Insights about its maintenance in the long-term. Perspect. Ecol. Conserv. 2018, 16, 113–118. [Google Scholar] [CrossRef]
  80. Dahdouh-Guebas, F.; Hugé, J.; Abuchahla, G.M.O.; Cannicci, S.; Jayatissa, L.P.; Kairo, J.G.; Kodikara Arachchilage, S.; Koedam, N.; Mafaziya Nijamdeen, T.W.G.F.; Mukherjee, N.; et al. Reconciling nature, people and policy in the mangrove social-ecological system through the adaptive cycle heuristic. Estuar. Coast. Shelf Sci. 2021, 248, 106942. [Google Scholar] [CrossRef]
  81. Mukherjee, N.; Sutherland, W.J.; Dicks, L.; Hugé, J.; Koedam, N.; Dahdouh-Guebas, F. Ecosystem service valuations of mangrove ecosystems to inform decision making and future valuation exercises. PLoS ONE 2014, 9, e107706. [Google Scholar] [CrossRef] [Green Version]
  82. Souza, A.F.; Cortez, L.S.R.; Longhi, S.J. Native forest management in subtropical South America: Long-term effects of logging and multiple-use on forest structure and diversity. Biodivers. Conserv. 2012, 21, 1953–1969. [Google Scholar] [CrossRef]
  83. Floyd Sabins, F.; Ellis, J.M. Remote Sensing: Principles, Interpretation, and Applications, Fourth Edition; Waveland: Long Grove, IL, USA, 2020. [Google Scholar]
  84. Alfaro, A.C. Benthic macro-invertebrate community composition within a mangrove/seagrass estuary in northern New Zealand. Estuar. Coast. Shelf Sci. 2006, 66, 97–110. [Google Scholar] [CrossRef]
  85. Jayakody, J.; Amarasinghe, M.; Pahalawattaarachchi, V.; De Silva, K. Vegetation structure and potential gross primary productivity of mangroves at Kadolkele in Meegamuwa (Negombo) estuary, Sri Lanka. Sri Lanka J. Aquat. Sci. 2010, 13, 95. [Google Scholar] [CrossRef] [Green Version]
  86. Barrett, J.E.; Virginia, R.A.; Wall, D.H.; Parsons, A.N.; Powers, L.E.; Burkins, M.B. Variation in biogeochemistry and soil biodiversity across spatial scales in a polar desert ecosystem. Ecology 2004, 85, 3105–3118. [Google Scholar] [CrossRef]
  87. Lira-Medeiros, C.F.; Parisod, C.; Fernandes, R.A.; Mata, C.S.; Cardoso, M.A.; Ferreira, P.C.G. Epigenetic variation in mangrove plants occurring in contrasting natural environment. PLoS ONE 2010, 5, e10326. [Google Scholar] [CrossRef]
  88. Dittmann, S.; Thiessen, E.; Hartung, E. Applicability of different non-invasive methods for tree mass estimation: A review. For. Ecol. Manag. 2017, 398, 208–215. [Google Scholar] [CrossRef]
  89. Jenerowicz, A.; Siok, K.; Schismak, A.; Ewiak, I. Improvement of interpretability of archival aerial photographs using remote sensing tools. SPIE Proc. 2018, 10789, 82. [Google Scholar]
  90. Chen, Q.; Zhao, Q.; Chen, P.; Lu, H.; Jian, S. Eco-exergy based self-organization of the macrobenthic faunal assemblage during mangrove succession in Zhanjiang, China. Ecol. Indic. 2018, 95, 887–894. [Google Scholar] [CrossRef]
  91. Dahdouh-Guebas, F.; Koedam, N. Coastal vegetation and the Asian tsunami. Science (80-) 2006, 311, 37. [Google Scholar] [CrossRef] [PubMed] [Green Version]
  92. Zhang, Y.; Wang, W.; Wu, Q.; Fang, B.; Lin, P. The growth of Kandelia candel seedlings in mangrove habitats of the Zhangjiang estuary in Fujian, China. Acta Ecol. Sin. 2006, 26, 1648–1655. [Google Scholar] [CrossRef]
  93. Dahdouh-Guebas, F.; Verneirt, M.; Cannicci, S.; Kairo, J.G.; Tack, J.F.; Koedam, N. An exploratory study on grapsid crab zonation in Kenyan mangroves. Wetl. Ecol. Manag. 2002, 10, 179–187. [Google Scholar] [CrossRef]
  94. Van der Stocken, T.; Wee, A.K.S.; De Ryck, D.J.R.; Vanschoenwinkel, B.; Friess, D.A.; Dahdouh-Guebas, F.; Simard, M.; Koedam, N.; Webb, E.L. A general framework for propagule dispersal in mangroves. Biol. Rev. 2019, 94, 1547–1575. [Google Scholar] [CrossRef] [PubMed] [Green Version]
  95. Fromard, F.; Vega, C.; Proisy, C. Half a century of dynamic coastal change affecting mangrove shorelines of French Guiana. A case study based on remote sensing data analyses and field surveys. Mar. Geol. 2004, 208, 265–280. [Google Scholar] [CrossRef]
  96. Putz, F.E.; Chan, H.T. Tree growth, dynamics, and productivity in a mature mangrove forest in Malaysia. For. Ecol. Manag. 1986, 17, 211–230. [Google Scholar] [CrossRef]
  97. Smith, T.J. Forest structure. In Tropical Mangrove Ecosystems; Robertson, A.I., Alongi, D.M., Eds.; Wiley & Sons: Hoboken, NJ, USA, 1992; pp. 101–136. [Google Scholar]
  98. Dahdouh-Guebas, F.; De Bondt, R.; Abeysinghe, P.D.; Kairo, J.G.; Cannicci, S.; Triest, L.; Koedam, N. Comparative study of the disjunct zonation pattern of the grey mangrove Avicennia marina (Forsk.) Vierh. in Gazi Bay (Kenya). Bull. Mar. Sci. 2004, 74, 237–252. [Google Scholar]
  99. Gardner, T.A.; Hernández, M.I.M.; Barlow, J.; Peres, C.A. Understanding the biodiversity consequences of habitat change: The value of secondary and plantation forests for neotropical dung beetles. J. Appl. Ecol. 2008, 45, 883–893. [Google Scholar] [CrossRef]
  100. Okello, J.A.; Robert, E.M.R.; Beeckman, H.; Kairo, J.G.; Dahdouh-Guebas, F.; Koedam, N. Effects of experimental sedimentation on the phenological dynamics and leaf traits of replanted mangroves at Gazi bay, Kenya. Ecol. Evol. 2014, 4, 3187–3200. [Google Scholar] [CrossRef]
  101. He, B.; Lai, T.; Fan, H.; Wang, W.; Zheng, H. Comparison of flooding-tolerance in four mangrove species in a diurnal tidal zone in the Beibu Gulf. Estuar. Coast. Shelf Sci. 2007, 74, 254–262. [Google Scholar] [CrossRef]
  102. Osborne, D.J.; Berjak, P. The making of mangroves: The remarkable pioneering role played by seeds of Avicennia marina. Endeavour 1997, 21, 143–147. [Google Scholar] [CrossRef]
  103. Muoghalu, J.I. Tree species population dynamics in a secondary forest at Ile-Ife, Nigeria after a ground fire. Afr. J. Ecol. 2007, 45, 62–71. [Google Scholar] [CrossRef]
  104. Satyanarayana, B.; Koedam, N.; De Smet, K.; Di Nitto, D.; Bauwens, M.; Jayatissa, L.P.; Cannicci, S.; Dahdouh-Guebas, F. Long-term mangrove forest development in Sri Lanka: Early predictions evaluated against outcomes using VHR remote sensing and VHR ground-truth data. Mar. Ecol. Prog. Ser. 2011, 443, 51–63. [Google Scholar] [CrossRef] [Green Version]
  105. Cannicci, S.; Burrows, D.; Fratini, S.; Smith, T.J.; Offenberg, J.; Dahdouh-Guebas, F. Faunal impact on vegetation structure and ecosystem function in mangrove forests: A review. Aquat. Bot. 2008, 89, 186–200. [Google Scholar] [CrossRef]
  106. López-Portillo, J.; Lewis, R.R.; Saenger, P.; Rovai, A.; Koedam, N.; Dahdouh-Guebas, F.; Agraz-Hernández, C.; Rivera-Monroy, V.H. Mangrove forest restoration and rehabilitation. In Mangrove Ecosystems: A Global Biogeographic Perspective: Structure, Function, and Services; Springer International Publishing: Cham, Switzerland, 2017; pp. 301–345. ISBN 9783319622064. [Google Scholar]
  107. Ellison, A.M. Mangrove restoration: Do we know enough? Restor. Ecol. 2000, 8, 219–229. [Google Scholar] [CrossRef]
  108. Kairo, J.G.; Dahdouh-Guebas, F.; Bosire, J.; Koedam, N. Restoration and management of mangrove systems—A lesson for and from the East African region. S. Afr. J. Bot. 2001, 67, 383–389. [Google Scholar] [CrossRef] [Green Version]
  109. Vannucci, M. Indo-West Pacific Mangroves. In Mangrove Ecosystems; Springer: Berlin/Heidelberg, Germany, 2002; pp. 123–215. [Google Scholar]
  110. Islam, S.N.; Yahya, U.A.A. Bin Impacts of coastal land use changes on mangrove wetlands at sungai mangsalut basin in Brunei Darussalam. In Coastal Research Library; Springer: New York, NY, USA, 2017; Volume 21, pp. 133–157. [Google Scholar]
  111. Feagin, R.A.; Mukherjee, N.; Shanker, K.; Baird, A.H.; Cinner, J.; Kerr, A.M.; Koedam, N.; Sridhar, A.; Arthur, R.; Jayatissa, L.P.; et al. Shelter from the storm? Use and misuse of coastal vegetation bioshields for managing natural disasters. Conserv. Lett. 2010, 3, 1–11. [Google Scholar] [CrossRef] [Green Version]
  112. Kodikara, K.A.S.; Mukherjee, N.; Jayatissa, L.P.; Dahdouh-Guebas, F.; Koedam, N. Have mangrove restoration projects worked? An in-depth study in Sri Lanka. Restor. Ecol. 2017, 25, 705–716. [Google Scholar] [CrossRef]
  113. Dahdouh-Guebas, F.; Hettiarachchi, S.; Lo Seen, D.; Batelaan, O.; Sooriyarachchi, S.; Jayatissa, L.P.; Koedam, N. Transitions in ancient inland freshwater resource management in Sri Lanka affect biota and human populations in and around coastal lagoons. Curr. Biol. 2005, 15, 579–586. [Google Scholar] [CrossRef] [Green Version]
  114. Dahdouh-Guebas, F.; Jayatissa, L.P.; Di Nitto, D.; Bosire, J.O.; Lo Seen, D.; Koedam, N. How effective were mangroves as a defence against the recent tsunami? Curr. Biol. 2005, 15, R443–R447. [Google Scholar] [CrossRef] [Green Version]
  115. Gourlay, I.D. The Definition of Seasonal Growth Zones in Some African Acacia Species—A Review. IAWA J. 2014, 16, 353–359. [Google Scholar] [CrossRef] [Green Version]
  116. Robert, E.M.R.; Schmitz, N.; Okello, J.A.; Boeren, I.; Beeckman, H.; Koedam, N. Mangrove growth rings: Fact or fiction? Trees Struct. Funct. 2011, 25, 49–58. [Google Scholar] [CrossRef] [Green Version]
  117. Schmitz, N.; Verheyden, A.; Kairo, J.G.; Beeckman, H.; Koedam, N. Successive cambia development in Avicennia marina (Forssk.) Vierh. is not climatically driven in the seasonal climate at Gazi Bay, Kenya. Dendrochronologia 2007, 25, 87–96. [Google Scholar] [CrossRef] [Green Version]
  118. Melville, F.; Burchett, M.; Pulkownik, A. Genetic variation among age-classes of the mangrove Avicennia marina in clean and contaminated sediments. Mar. Pollut. Bull. 2004, 49, 695–703. [Google Scholar] [CrossRef] [PubMed]
  119. Chen, X.Y. Effects of plant density and age on the mating system of Kandelia candel Druce (Rhizophoraceae), a viviparous mangrove species. Hydrobiologia 2000, 432, 189–193. [Google Scholar] [CrossRef]
  120. Ge, J.P.; Cai, B.; Ping, W.; Song, G.; Ling, H.; Lin, P. Mating system and population genetic structure of Bruguiera gymnorrhiza (Rhizophoraceae), a viviparous mangrove species in China. J. Exp. Mar. Bio. Ecol. 2005, 326, 48–55. [Google Scholar] [CrossRef]
Figure 1. (a,b) The location of Zhanjiang Mangrove National Nature Reserve (ZMNNR) in southern China, under the jurisdiction of Lehizou Peninsula in Guangdong Province; (c) the extent of ZMNNR mangrove cover observed on GeoEye-1 satellite image dated 16 October 2009. The mangrove extent of 1967 (cream-colored polygons) was observed from Corona KH-4B satellite imagery dated 17 December 1967. Sites (1) and (2) were the areas investigated for present study. Sampling points (blue dots) in the original mangrove stands: 1–5, 7–10, 12, 13, 28–33, 35–38, 45, 46, 48, 58, 59, 64, 67–72 plot numbers. Sampling points (red dots) in the non-original mangrove stands: 6, 11, 14–18, 19, 20–26, 27, 34, 39–44, 47, 49–57, 60–63, 65, 66, 73–76 plot numbers.
Remotesensing 13 02781 g001
Figure 2. Methodological approach for identifying original and non-original mangrove stands at the Zhanjiang Mangrove National Nature Reserve (ZMNNR), China.
Remotesensing 13 02781 g002
Figure 3. Principal component analysis showing the separability of sampling points in relation to tree height measurements of different species at original and non–original mangrove stands in the Zhanjiang Mangrove National Nature Reserve (ZMNNR), China. PC1 higher and negative eigenvalues showed taller trees, comprised by original trees, while PC1 high and positive eigenvalues showed A. marina and R. stylosa. PC2 higher and positive eigenvalues with A. corniculatum, A. marina for the non–original trees and PC2 higher and negative eigenvalues showed original trees (For better readability, sampling points to read from Table A1). Ae.cor = Aegiceras corniculatum, Br.gym = Bruguiera gymnorrhiza, Ka.obo = Kandelia obovata, Rh.sty = Rhizophora stylosa, Av.mar = Avicennia marina.
Remotesensing 13 02781 g003
Figure 4. Principal component analysis showing the separability of sampling points in relation to stem density of different species at original and non–original mangrove stands in the Zhanjiang Mangrove National Nature Reserve (ZMNNR), China. PC1 higher negative eigenvalues pointed out species with lower densities represented by original trees while PC1 positive higher eigenvalues pointed out species with higher densities represented by non–original trees. PC2 higher positive eigenvalues showed an unclear pattern while PC2 higher negative eigenvalues showed original trees (for better readability, the sampling points to read are in Table A1). Species abbreviations to follow Figure 2.
Remotesensing 13 02781 g004
Figure 5. Principal component analysis showing the separability of sampling points in relation to basal area of different species at original and non–original mangrove stands in the Zhanjiang Mangrove National Nature Reserve (ZMNNR), China. PC1 higher negative eigenvalues showed original trees (higher basal area), PC1 positive eigenvectors correspond to A. corniculatum (lower basal area). PC2 higher positive eigenvectors showed A. marina and R. stylosa, both which are highly present as non–original mangrove (For better readability, sampling points to read from Table A1). Species abbreviations to follow Figure 2.
Remotesensing 13 02781 g005
Figure 6. Mean tree height (m) variation of different mangrove species at the Zhanjiang Mangrove National Nature Reserve (ZMNNR), China; (a) Rhizophora stylosa, Kandelia obovata and Aegiceras corniculatum; (b) Avicennia marina and Bruguiera gymnorrhiza. Species selection for each figure is to avoid bubbles overlapping.
Remotesensing 13 02781 g006
Figure 7. Total stem density (nos. ha−1) of different mangrove species at the Zhanjiang Mangrove National Nature Reserve (ZMNNR), China; (a) Rhizophora stylosa, Kandelia obovata and Aegiceras corniculatum; (b) Avicennia marina and Bruguiera gymnorrhiza. Species selection for each figure is to avoid bubbles overlapping.
Remotesensing 13 02781 g007
Figure 8. Total basal area (m2 ha−1) of different mangrove species at the Zhanjiang Mangrove National Nature Reserve (ZMNNR), China; (a) Rhizophora stylosa, Kandelia obovata and Aegiceras corniculatum; (b) Avicennia marina and Bruguiera gymnorrhiza. Species selection for each figure is to avoid bubbles overlapping.
Remotesensing 13 02781 g008
Table 1. Ecological studies for which the distinction between original and non-original stands may be required. The example references are indicative of the relevance of the field, but did not distinguish between original and non-original stands.
Hypothetical Ecological Study ObjectivesFieldExample Reference(s)
to execute sampling for conservation geneticsConservation geneticsBinks et al., 2019; Ragavan et al., 2017
to estimate tree ageSilvicultureLucas et al., 2020
to identify late successional stands (e.g., capable of mass seeding)Reproductive botanyDangremond and Feller, 2016
to outline core conservation areas to monitor gain/loss of pristine forestEnvironmental planningBorges et al., 2017; Song et al., 2015
to sample species indicative of floristic or faunistic recruitmentRestoration ecologyBosire et al., 2008; Salmo et al., 2013
to monitor soil biogeochemical processes in interior standsBiogeochemistryLee et al., 2008
to compare microbial activity in outer and interior standsEnvironmental microbiologyPupin and Nahas, 2014
to detect/validate older mangrove presence using spectral analysis in up-to-date high-resolution imagesEarth observation scienceAndersen, 2006; Otero et al., 2019; Song et al., 2015
to monitor hydrological process in interior standsForest hydrologyLuo and Chui, 2020
to test forest resilience in interior stands after disturbanceForestry scienceNikinmaa et al., 2020
to compare sediment and geological formations in interior standsSedimentologySwales et al., 2019; Swales and Lovelock, 2020
Table 2. Mangrove vegetation structural parameters representing original and non-original stands at Sites 1 and 2 (mean and min–max values in parentheses). Importance values (actual index value in parentheses) were denoted by rank numbers.
SpeciesSite 1Site 2
OriginalNon-OriginalOriginalNon-Original
Density (stems ha−1)
Aegiceras corniculatum6480
(400–2800)
7093.3
(3200–19,600)
3750
(2000–5500)
Avicennia marina1800
(400–5200)
1320
(320–2280)
Bruguiera gymnorrhiza3186.7
(400–9200)
2114.3
(400–5600)
290
(80–720)
Kandelia obovata1580
(400–6800)
711.1
(400–1200)
Rhizophora stylosa400
(340–460)
700
(390–1200)
5360
(340–640)
Height (m)
Aegiceras corniculatum2.27
(0.96–3.23)
1.63
(0.61–3.08)
2.00
(1.80–2.30)
Avicennia marina1.08
(0.30–1.57)
1.93
(1.80–2.10)
Bruguiera gymnorrhiza2.69
(1.57–3.85)
2.03
(0.98–3.04)
3.87
(2.50–4.68)
Kandelia obovata2.74
(1.50–4.14)
2.16
(1.38–3.10)
Rhizophora stylosa1.87
(1.87–1.87)
2.21
(1.70–2.88)
3.82
(2.50–4.60)
Basal area (m2 ha−1)
Aegiceras corniculatum10.8
(1.4–42.3)
17.9
(3.6–38.6)
8.8
(6.3–10.8)
Avicennia marina5.6
(1.0–12.6)
4.6
(3.2–5.9)
Bruguiera gymnorrhiza11.2
(2.0–23.6)
7.6
(1.7–16.5)
10.0
(4.7–13.6)
Kandelia obovata6.4
(1.0–19.1)
5.5
(1.7–8.2)
Rhizophora stylosa5.1
(3.3–9.3)
4.2
(1.4–9.9)
9.5
(6.4–1.2)
IV (rank numbers)
Aegiceras corniculatum2
(76.56)
1
(224.79)
1
(146.51)
Avicennia marina4
(10.08)
2
(53.49)
Bruguiera gymnorrhiza1
(170.78)
2
(41.90)
2
(67.07)
Kandelia obovata3
(46.39)
3
(13.48)
Rhizophora stylosa4
(5.14)
5
(7.89)
1
(232.93)
CI100.5955.655.599.73
Table 3. Statistical metrics among species in original and non-original stands in relation to different tree structural parameters at the Zhanjiang Mangrove National Nature Reserve (ZMNNR), China. F and t indicate those metrics follow normality: thus, Welch ANOVA and Student t-test were applied instead H and T tests.
Kruskal–Wallis Test
(H)
Wilcoxon Sum Rank Test with Bonferroni Correction (T)
HeightX2p-ValueWeightp-Value
Aegiceras corniculatum2.31640.08835.50.1294
Avicennia marina103.270.001 *5040.001 *
Bruguiera gymnorrhiza2.57320.108711920.001 *
Kandelia obovata10.8110.001 *915.50.001 *
Rhizophora stylosa70.9270.001*6970.9516
Density
Aegiceras corniculatum61.6030.001 *2380.001 *
Avicennia marina82.0450.001 *5040.001 *
Bruguiera gymnorrhizaf = 45.60.001 *t = −7.0170.001 *
Kandelia obovata34.7800.001 *874.50.02
Rhizophora stylosa64.0310.001 *7930.1285
Basal area
Aegiceras corniculatumf = 45.60.001 *t = −6.0500.001 *
Avicennia marina123.710.001 *5040.001 *
Bruguiera gymnorrhiza26.0050.001 *1159.50.001 *
Kandelia obovata108.150.001 *875.50.0267
Rhizophora stylosa117.960.001 *804.50.0898
* Confidence level at the 95%. Original and non-original mangrove separation (df = 1), species pairwise comparison (df = 72.75).
Table 4. Species eigenvalues and their cumulative proportion determined via Principal Component Analysis (PCA) for Zhanjiang Mangrove National Nature Reserve (ZMNNR), China.
Tree HeightPC1PC2PC3
Aegiceras corniculatum−1.5360.652−0.193
Avicennia marina0.7580.9791.361
Bruguiera gymnorrhiza−0.791−1.5060.206
Kandelia obovata−1.171−0.5371.228
Rhizophora stylosa1.314−1.1870.201
Variation explained (%)352818
Cumulative proportion (%)356381
Density
Aegiceras corniculatum1.484−0.3990.676
Avicennia marina0.8550.516−1.608
Bruguiera gymnorrhiza−1.549−0.2140.094
Kandelia obovata−0.731−1.371−0.763
Rhizophora stylosa−0.7931.4930.049
Variation explained (%)392718
Cumulative proportion (%)396677
Basal area
Aegiceras corniculatum1.643−0.154−0.146
Avicennia marina0.0371.391−1.194
Bruguiera gymnorrhiza−1.565−0.7620.037
Kandelia obovata−0.312−0.959−1.582
Rhizophora stylosa−1.1391.1330.133
Variation explained (%)352520
Cumulative proportion (%)356080
Table 5. Advantages and limitations of the present methodological protocol identifying original and non-original mangrove stands at the Zhanjiang Mangrove National Nature Reserve (ZMNNR).
TechniqueAdvantageLimitation
GIS
  • On-screen digitization: higher reliability to delineate contours for longer time gaps since they may be wider separated e.g., +42 years.
  • Mutual geo-referencing of images is not highly accurate for natural areas if there are no clearly recognizable landmarks.
Remote sensing
  • Local knowledge on the position of original vegetation highly unreliable.
  • Very high spatial resolution images like GeoEye-1, IKONOS, etc., have been found to be more appropriate for visual interpretation [83].
  • Non-intrusive [88].
  • Less input in fieldwork expenses e.g., cost and time saving.
  • Most suitable for distinction of putative visible original and older growth forest.
  • Satellite images are unavailable for some areas.
  • High technical skills required to improve low spatial and spectral resolution images [89].
  • Not suitable to study forest succession that started before the first air-borne/space-borne imagery [90].
  • Low and sparse vegetation over sandy areas may render plants visible or not visible at all [91].
Kruskal–Wallis-PCA-ordination
  • Data transformation corrects for heteroscedasticity which improves clustering capabilities.
  • Useful at separating sites for areas with diverse characteristics in forests structure (Souza et al., 2012).
  • Ordination methods are relatively easy to implement.
  • Vegetation homogeneity decreases similarity among plots.
  • Axis-1 and 2 do not account 100% variation.
  • Limitations of ordination methods could be overcome with machine learning methods with higher clustering capabilities.
Publisher’s Note: MDPI stays neutral with regard to jurisdictional claims in published maps and institutional affiliations.

