1. Introduction
The existence of forests is crucial for the well-being of people and the planet as a whole. Given the role of forests in the global carbon cycle and providing a wide range of ecosystem services, the ongoing assessment of forests’ quantitative and qualitative state is critical [
1]. Therefore, mapping and collecting precise and up-to-date data related to forest structure, biomass, species composition, and corresponding changes have become a mandatory part of forest management, inventories, and monitoring [
2].
In Latvia, calculations of forest carbon stock changes and greenhouse gas (GHG) emissions are based on data provided by the National Forest Inventory (NFI) [
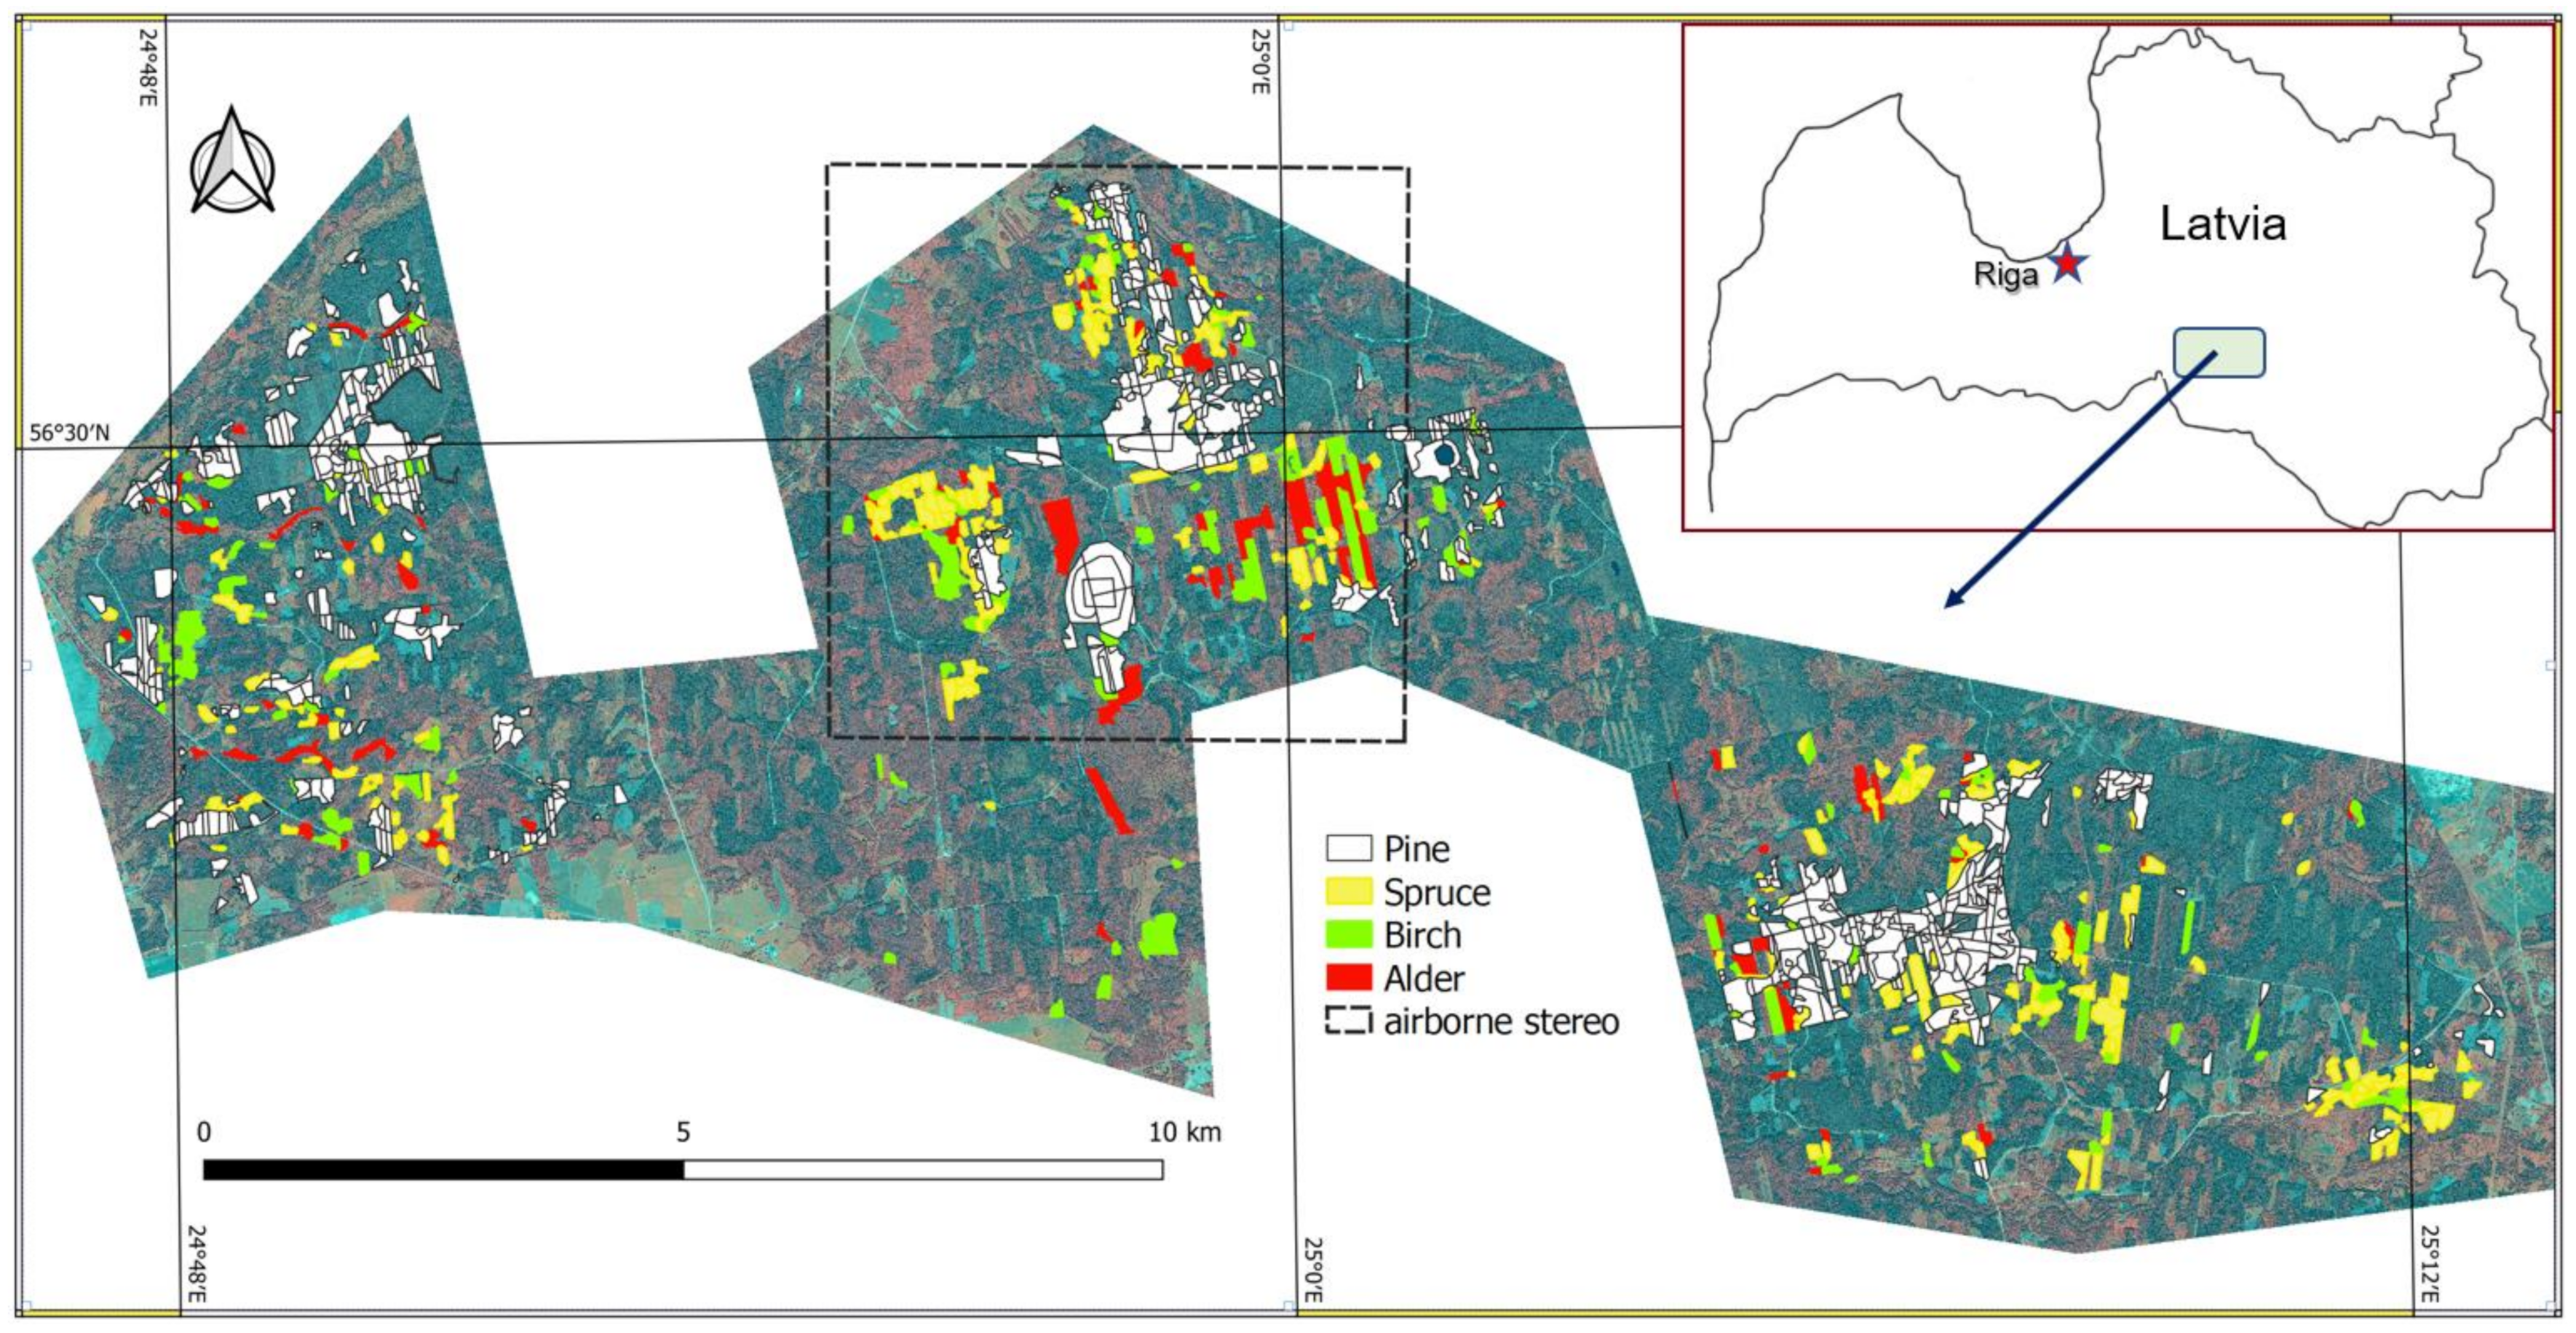
3]. According to NFI data, forest covers 3.403 million hectares of land in Latvia, or 55% of the country’s territory, the fourth-highest forest cover among all European Union (EU) countries. Since 2004, the Latvian NFI database, maintained by the Latvian State Forest Research Institute (LSFRI ) “Silava”, includes complete information related to Latvian forest stand parameters such as tree species, density, stock, forest stand height, biomass, etc., carried out at the plot level. However, traditional practices used for collecting this vegetation information are costly and time-consuming, providing low spatial coverage and requiring destructive fieldwork. Remote sensing complements traditional field methods through data analysis, enabling precise estimation of various forest inventory attributes across the high spatial range and different scales by avoiding destructive sampling and reducing time and cost from data acquisition to final output [
4].
It is well known that canopy height, which correlated with other vegetation attributes, is an essential parameter for predicting regional forest biomass [
5]. Thus, carbon accounting programs and research efforts on climate-vegetation interactions have increased the demand for canopy height information. Worldwide, LiDAR (Light Detection And Ranging) data, combined with up-to-date advanced data processing methods, have proven to be efficient and precise tools for indirect fine-scale estimation of forest 3D structure parameters (primarily tree height) derived from high-density 3D point clouds [
6]. Furthermore, by computing the difference between the canopy surface and the underlying ground, the calculated canopy height model (CHM) accurately reflects the spatial variations of the height of the canopy surface [
7]. However, relatively high acquisition costs prevent airborne LiDAR from regularly mapping forest structural state and dynamics. Therefore, considering alternatives to airborne laser scanning (ALS) for continuous wide-area surveys, it is necessary to examine cost-effective approaches that use satellite data.
Higher temporal resolution, lower cost with broader area coverage, and spatially more homogeneous image content with multispectral information are the main advantages of satellite data over airborne remote sensing [
8]. In the last decade, there has been growing interest in using very high resolution (ground sample distance (GSD) < 0.5 m) satellite-derived stereo imagery (VHRSI) to generate dense digital surface models (DSM) analogous to LiDAR data to support forest inventory and monitoring [
9]. Structure from motion (SfM) and photogrammetric matching techniques [
10,
11] reconstruct the 3D object geometry and detect 3D coordinates by simultaneous matching of the same 2D object points located in overlapped stereo airborne and VHRSI imagery. However, while the ALS can penetrate the forest canopy and characterise the vertical distribution of vegetation, the VHRSI image-based point clouds only represent the non-transparent outer “canopy envelope” [
9] or “canopy blanket” cover of dominant trees.
Most of the earlier studies regarding VHRSI image-based DSM performance used the plot-based approaches by deriving the main forest metrics such as the mean, maximum canopy heights, and height percentiles. Then, after performing regression with reference data (mostly LiDAR) and obtained estimation accuracy, the metrics are used as explanatory variables for predictive modelling of forest inventory attributes over certain areas. As an example, Grant D. Pearse et al. (2018) [
12] compared point clouds obtained from Pleiades tri-stereo imagery to LiDAR data to predict
Pinus radiata forest plot inventory attributes, such as mean height (R
2 = 0.81; RMSE = 2.1 m) and total stem volume (R
2 = 0.70; RMSE = 112.6 m
3 ha
−1). Additionally, L. Piermattei et al. (2019) [
13] used Pleiades tri-stereo image-based CHMs to derive forest metrics in the Alpine region, compared to airborne image matching. Based on the applied pixel-wise approach, the forest metrics median errors −0.25 m (H
max), 0.33 m (H
p 95), −0.03m (H
Std) showed that satellite-based Pléiades CHMs could be an alternative to airborne images-derived CHMs in mountain forests. Based on calculated height metrics in 5-pixel samples, Neigh et al. (2014) [
14] found IKONOS stereo imagery to be a useful LiDAR alternative for DSM calculation (R
2 = 0.84; RMSE = 2.7 to 4.1 m) in dense coniferous and mixed hardwood US forests. St-Onge et al. (2019) [
15] successfully manually (RMSE = 0.9 m) measured individual tree heights in stereo mode using WorldView-3 imagery to predict basal area at tree and plot levels in sparse
Lichen woodlands.
Several recent studies showed successful VHRSI image-based CHM performance connected to European boreal and hemiboreal forest tree species (
Scots pine,
spruce and
birch). Persson and Perko (2016) [
16] reported high correlations between WorldView-2 image-derived height metrics and reference LiDAR, with the estimation of Lorey’s mean height with RMSE of 1.5 m (8.3%). The study identified the tendency to canopy height underestimation of dominant trees by using image-based CHMs. S.Ullah et al. (2020) [
17] performed a plot-wise comparison of airborne, WorldView-2, and TanDEM-X image-based CHMs against field-based Lorey’s mean and maximum height in a forest with pure, mixed pines and broadleaf tree species. This research confirmed that airborne stereo is the most accurate option (RMSE = 1.71 m, Lorey’s mean height) compared to satellite-based models (RMSE = 2.04 m WorldView-2; RMSE = 2.13 m TanDEM-X).
Despite the large offer of VHRSI sensors on the market, image-derived DSM performance for retrieving the forest inventory data of different vegetation species in various geographical regions is still not fully understood. Therefore, referring to the results of the remote sensing expert opinion survey performed by Fassnacht et al. (2017), the potential of VHRSI use for estimation forest attributes such as stand height is still unclear [
18]. According to this survey, the mentioned reasons are a few studies and existing uncertainties associated with canopy height estimation accuracy.
Plot-wise approaches based on forest metrics have some limitations that sometimes restrict the comprehensive quantitative and qualitative performance evaluation of image-derived CHM models. First, most studies lack information related to image-based CHM completeness (percentage of detected canopy). Secondly, the height metrics do not directly estimate the outer “canopy envelope” DSM surface, which in most cases follows dominant treetops. It is also essential to recognise the differences in the DSM height estimates associated with different vegetation species. Thirdly, the accurate terrain layer (DTM) is needed to perform CHM creation.
Thus, the main objective of this study was to perform the direct comparison of calculated image-based DSM models with canopy peaks heights extracted from reference LiDAR data without canopy height model (CHM) generation. The present study assessed the airborne and satellite image-based DSM performance for canopy height estimation in predominantly mature, dense, closed-canopy Latvian hemiboreal forestland using forest inventory data.
To achieve this objective, the research: (1) evaluated and compared the vertical accuracy and completeness DSMs derived from stereo imagery of GeoEye1 and Pleiades1B satellites and large-format aerial UltraCam to reference LiDAR data; (2) analysed the differences in the DSM height estimates associated with different tree species; (3) examined the effect of sensor-to-target geometry (specifically base-to-height ratio) on matching performance and canopy height estimation accuracy; (4) investigated the satellite-based different spectral band DSMs performance on canopy height accuracy estimation.
3. Methods
3.1. Data Processing Overwiew
The study performed the direct comparison of calculated image-based DSM models with canopy peaks heights extracted from reference LiDAR data, without canopy height model (CHM) generation (
Figure 3). It was conducted in order to isolate one source of error uncertainty related to the accuracy of LiDAR DTM, generally used for CHM model calculation. The co-registration of the satellite imagery sets with LiDAR was performed during sensor orientation by GCPs measured and transferred from the LiDAR data. The main reason for the bias-compensated bundle adjustment using LiDAR GCPs was to minimise the image-based DSMs and LiDAR co-registration and geo-location discrepancies. Finally, we performed accuracy assessments related to image-derived DSMs performance in canopy height detection and estimation in open terrain and forest areas.
The software package
Photomod v7.0 (Racurs, Moscow, Russia) was used for all photogrammetric image data processing steps, including imagery bundle adjustment and image matching DSM generation. All works related to LiDAR point cloud handling, such as DSM/DTM calculations and watershed segmentation routines, were carried out using freeware
FUSION/LDV v4.20 [
19]. Grid DSMs comparison, corresponding grid statistics collection, and GIS-based analysis were performed using freeware SAGA GIS [
20] and QGIS [
21].
3.2. Sensor Orientation and Data Co-Registration
Image pre-processing started with pan-sharpening, applied to the GE1 imagery. The most robust enhanced principal component analysis pan-sharpening method was used, as it does not require radiometric correction.
External sensor orientation was performed with an empirical model based on rational functions with rapid positioning capability (RPC) data, refined by a zero-order polynomial adjustment. In general, it required just one ground control point (GCP) [
22], and 4–5 well-distributed points would be recommended for a stereo pair to achieve the one-pixel accuracy [
23,
24] by using least-squares bundle adjustment. To achieve the best co-registration of the imagery with LiDAR, the eighteen (18) well-identified artificial GCPs (poles, concrete slab corners, road intersections) and well-identified natural (e.g., tree stumps) objects were transferred from the LiDAR data. The GCPs’ height coordinates were extracted from the LiDAR, whereas their planar locations were manually identified in an existing orthophoto (0.25 m GSD) provided by LGIA.
All GCPs were well-distributed across the study area and manually measured by using stereo mode in Photomod. Fewer GCPs were used for geo-registration of the airborne UltraCam stereo imagery due to its partial coverage of the study area. The image geo-referencing accuracy and epipolar geometry of all imagery sets were improved by automatically measured tie points. The point measurements and bundle adjustment were performed once for every sensor (GE1, Pleiades, and UltraCam).
3.3. DSM Extraction from VHR Stereo Satellite Imagery and LiDAR Point Cloud
Five GE1 models (PAN, NIR, R, G, B) and five Pleiades1B models (NIR, R, G, B, NIR-G-B) were chosen for 0.5 m resolution grid DSM generation by using an SGM matching algorithm [
10]. Additionally, two UltraCAM airborne imagery grid DSMs (NIR-G-B, 0.25 m resolution) with original in-strip overlap 80% and reduced overlap 60% were extracted. The two UltraCam models with different overlap settings were selected to investigate the effect of the base-to-height ratio on generated DSM accuracy. Altogether, twelve grid DSM models were used in the further analysis.
After testing various SGM settings, the following slightly modified Photomod SGM default settings were used for image-based DSM calculations: census transform (CT) matching cost function with pixel cost calculation radius 3 and eight calculation paths; decreased penalty value 4 for parallax changes by one pixel and a reduced penalty value 80 for parallax change by more than one pixel. No filters were applied on generated DSM models, except median filter with mask aperture (7 pixels) and threshold (1 m) to recalculate low-correlated “noisy” pixels along feature edges (e.g., forest borders), keeping rest values unchangeable. To fill the gaps (null cells) that appeared on DSMs due to occlusions and bad imagery textures, the SAGA GIS “stepwise resampling” tool was applied using a B-spline interpolation algorithm with grow factor 2.
3.4. Accuracy Assessment of the Image-Based DSMs in Open Ground Areas
Although imagery was vertically co-registered with LiDAR during sensor orientation, the extracted DSMs got a unique vertical bias. Thus, the vertical DSM offset from one to another and LiDAR surface must be calculated before their elevation comparison and final accuracy assessment. Firstly, the 1 m resolution grid DTM from LiDAR dense point cloud was created by assigning the mean elevation of ground classified returns within each grid cell. The created grid LiDAR DTM played as ground truth for further vertical accuracy assessment of the image-based DSMs in selected open ground areas. The corresponding open ground areas were chosen manually using a visual examination of LiDAR, satellite imagery and orthophoto maps to avoid altered and overgrown grass and shrubs. Altogether, the 134 open ground polygons (plots) were manually digitised with a mean of 0.9 ha and a total area of 120 ha, well-distributed across the study area. Within this created open ground mask, the image-based DSM ground surfaces were aligned to those of the reference LiDAR-based DTM. As image-based DSMs had higher resolution than 1 m LiDAR DTM, the mean height values of the pixels that are in the cell of LiDAR DTM were chosen. After the pixel-wise ground surfaces comparison, the obtained vertical offsets were applied to all image-based DSMs values for further accuracy assessment in forest areas.
3.5. Accuracy Assessment of Image-Based DSMs in Forest Areas
To perform the quality and efficiency assessment of image-based DSM in selected forest areas, the reference heights of individual canopy peaks were extracted from LiDAR data. To do this, the local maxima approach by using watershed segmentation was used for individual canopy peaks detection and extraction from the LiDAR grid DSM. First, the DSM was interpolated from the LiDAR dense point cloud using the “CanopyModel” routine in Fusion. Based on LiDAR point cloud density quantity, the optimal grid DSM with 0.8 m pixel resolution was generated by assigning the highest return of the LiDAR point cloud within each grid cell. A median convolution smoothing filter with a 3 × 3 window was applied on the generated DSM. The Fusion ‘peaks’ switch was used to preserve the localised elevation peak (local maxima) values from the filtering. Secondly, the Fusion “TreeSeg” watershed segmentation algorithm was applied to a LiDAR-based DSM to produce segments representing individual canopy peaks. As a result, the calculated high point list, including the heights and locations of individual canopy peaks, was created in shapefile format.
The obtained canopy peaks list was filtered using selected forest inventory study plots polygons (
Table 2) and separated into four main dominant tree species. To compensate for the changes in canopy heights due to trees growing in time between LiDAR data (2017) and satellite imagery (2020) acquisitions, the extracted LiDAR canopy peaks heights were adjusted based on each tree species annual growth rate. The trees annual growth rates values were obtained from the Latvian State Forest Service and published by LSFRI “Silava’ [
25]. The canopy peaks list was finalised by excluding all height values less than <6 m above ground by performing GIS analysis after assigning ground height attribute from earlier generated LiDAR grid DTM.
The quality and accuracy assessment of the image-based DSMs in selected forest areas was assessed in two ways: vertical accuracy and completeness. The vertical accuracy assessment was performed by comparing the image-based DSM grid height values with corresponding individual canopy peaks (height maxima) extracted from reference LiDAR data. It was conducted by collecting height metrics statistics of image-based DSM pixel values within a 1 m radius surrounding every appropriate LiDAR-based canopy peak (
Figure 4). The highest DSM grid height value of the surrounding 13 pixels (within 1 m radius) per canopy LiDAR height peak was selected and compared.
To perform the canopy completeness (detection) and vertical accuracy assessments, all heights of image-based DSM grid cells assigned to LiDAR individual canopy peaks were filtered. First, all image-based DSM heights less than <2 m above ground, were marked as non-detected canopies and excluded from the final assessments. This GIS-based filtering of image-based DSM heights was performed by canopy height calculation using ground height values extracted from corresponding LiDAR grid DTM. Secondly, all measurements with height differences more than >20 m between corresponding image-based DSM heights and LiDAR peaks were marked as outliers and excluded from the final assessments. Thus, the final completeness of the image-based DSMs was assessed as the proportion of the number of LiDAR local canopy peaks with assigned image-based DSM heights (Hcanopy > 2 m) with removed outliers to the total number of extracted LiDAR canopy peaks. Finally, the descriptive statistics and linear regression were calculated for all compared DSM and LiDAR heights in every model for each tree species.
For all statistics measurements, the normalised median absolute deviation (NMAD) was used, Equation (1), where: Δ
hj denotes differences between reference (LiDAR) and extracted DSM cell (j) values, and
m—median quantile of the differences:
The NMAD is an accuracy measure more suited for photogrammetry-derived and cloud-based DEMs as it is more resilient to outliers than standard deviation [
26].
5. Discussion
In total, the vertical accuracy and completeness of image-based DSMs are affected by the base-to-height ratio parameter, the canopy vegetation vertical structure, species composition, image band radiometry, sensor-to-target and sun-to-sensor geometry, wind, and other minor factors [
28]. The ability to identify or distinguish canopy or its parts based on light scattering and reflection differences is the key to the success of image matching techniques. Sufficient image contrast and brightness between neighbour objects surfaces (e.g., between two crowns; crown and ground) can improve the matching performance and, therefore, crown/canopy detection rate and height accuracy. The current study found that the base-to-height ratio of stereo imagery geometry was the critical factor influencing image-based DSM performance. In our research, the sun-to-sensor viewing geometry was similar for GE1 and Pleiades1B satellite sensors. Therefore, the discussion is mainly focused on sensor-to-target geometry and does not provide a detailed understanding of how the changes in sun-to-sensor geometry (e.g., sun elevation and azimuth angles) influence canopy surface estimates by image-based DSMs.
5.1. Vertical Accuracy of Image-Based DSMs in Open Ground Areas
This study results confirmed the previous findings [
27,
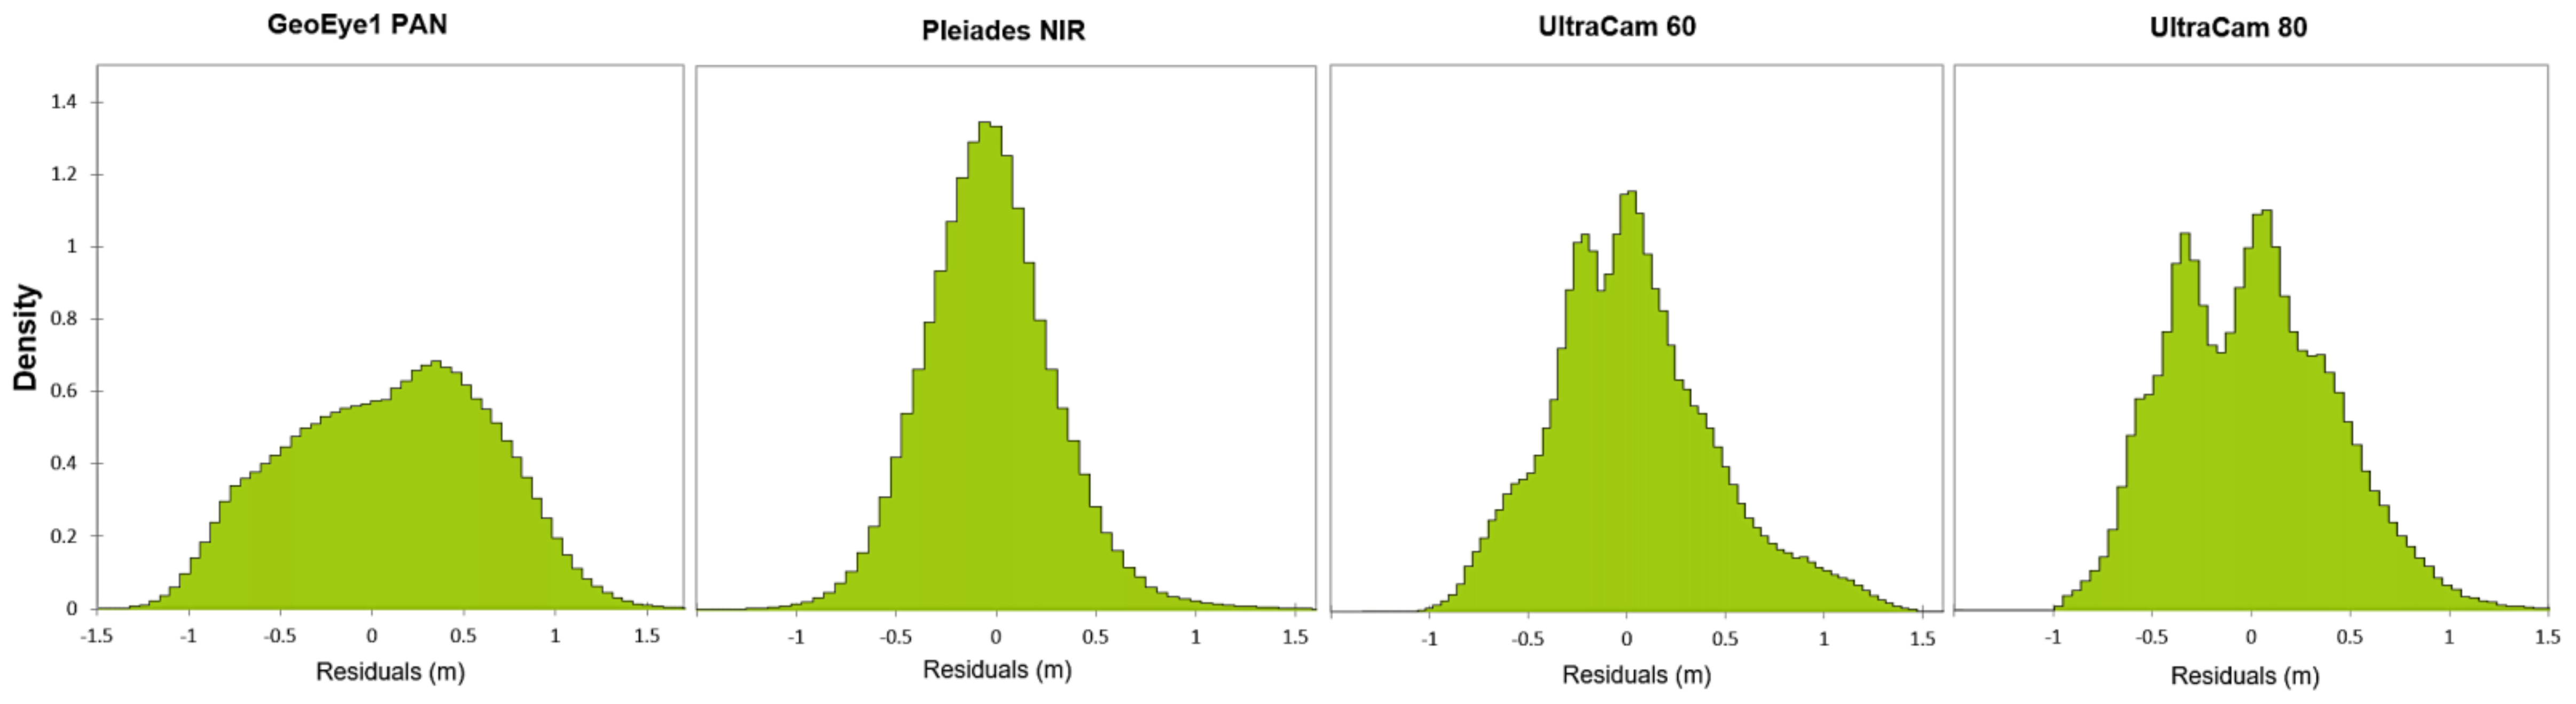
29] that satellite imaging geometry, particularly the base-to-height (B/H) ratio related to stereo-pair convergence angle, plays a substantial role in the completeness and vertical accuracy of image-derived DSMs. In our study, the Pleiades-based DSMs, with the highest B/H ratio of 0.61, showed the highest performance and accuracy in height estimation of open ground areas. It is somewhat surprising that Pleiades pan-sharpened imagery (0.5 m GSD) was more efficient in open terrain detection than airborne UltraCam images with a 0.25 m resolution. Only Pleiades models achieved the sub-pixel vertical accuracy with RMSE 0.33 m and NMAD 0.31 m, showed a Gaussian error distribution pattern (
Figure 5). Another proof of
Pleiades imagery high performance in open ground detection is the sensor’s orientation results (
Table 3). Despite worse
Pleiades planimetry accuracy than GE1 and UltraCam, the achieved vertical accuracy based on GCP measurements was 1.5 higher than GE1 and almost the same as UltraCam. Since GCP measurements for sensor bundle adjustment were carried out manually in stereo mode, this also allows me to recommend using imagery with a high B/H ratio for manual stereo restitution of open terrain areas and artificial objects with continuous and solid surfaces. There was an insignificant discrepancy in performance between different spectral band-based DSM models of the same corresponding sensor. Taken together, the findings from this study suggest that stereo imagery with B/H ratio > 0.5 (or convergence angles > 30°) preferably have to be used for DSM creation in open ground areas with flat terrain patterns. This conclusion agrees with the findings of other studies [
27,
29,
30], in which the per-point vertical accuracy of image-based DSMs in open-ground areas directly correlates with increasing B/H ratio or convergence angle.
5.2. Completeness and Vertical Accuracy of Image-Based DSMs in Forest Areas
Opposite results were achieved in forest areas related to tree height estimation and completeness, where all Pleiades-based DSM models were worse than GE1 and even more so than UltraCam (
Table 5,
Figure 6). The completeness of pine (
Pinus sylvestris) of Pleiades NIR-based DSM was 25% less (73%) than GE1 DSM performance (98%) and almost half-meter more in canopy height underestimation. In addition, all Pleiades DSM models showed a higher error variance (RMSE, NMAD) than other sensor-based DSMs, noticeably below the first quartile (25%) of the errors. The main reason for this outcome is directly related to the stereo imagery geometry, namely the B/H ratio or stereo-pair convergence angle.
The dense closed-canopy forest areas with near-continuous tree cover are characterised by the high surface roughness of different tree shapes. Therefore, the detection efficiency of every part of the canopy depends on the viewing directions of the stereo pair, namely, on how accurately and correctly the same part of the rough canopy surface will be displayed on the images. In forest areas, crown shape and tree structure that strongly influence the sun’s reflection come out in the first place [
31]. For trees with a conical crown shape, a large convergence angle may lead to a situation where the same part of the canopy may be wrongly displayed on one image due to poor reflection towards the sensor or invisibility (occlusion). The high B/H image ratio creates large parallax for high-rise crowns (canopies), increasing areas that cannot be matched correctly due to occlusions. Furthermore, during image matching, the mismatch of the same feature often leads to wrong height calculations and incomplete DSM [
32]. As a result, for trees with conical (tapering) crown shapes, canopy height underestimation is expected and exists. Depending on tree species, the canopy height underestimation in dense closed-canopy forests can reach up to several meters, or 8% of mean canopy height (e.g.,
pine in the Pleiades case).
Broadleaf deciduous tree species increase the sun reflectance by reducing tree crown transparency, smoothing the top of the canopy shape’s roughness, and increasing the reflection area. As a result, the image-based DSMs of forests with dominated broadleaf species (e.g.,
birch and
black alder) show higher efficiency and accuracy in canopy height estimation and completeness (
Figure 7).
Based on the results of this study, it can be concluded that the presence and variability of the types of canopy surfaces negate the advantage of a large convergence angle use, leading to a decrease in SGM matching performance (Pleiades case). This finding corroborates the recent research of Rongjun Qin (2019) [
33], which suggested that a smaller convergence angle (can be as small as around 7°) yields better results for dense surface reconstruction and complete DSM in urban areas.
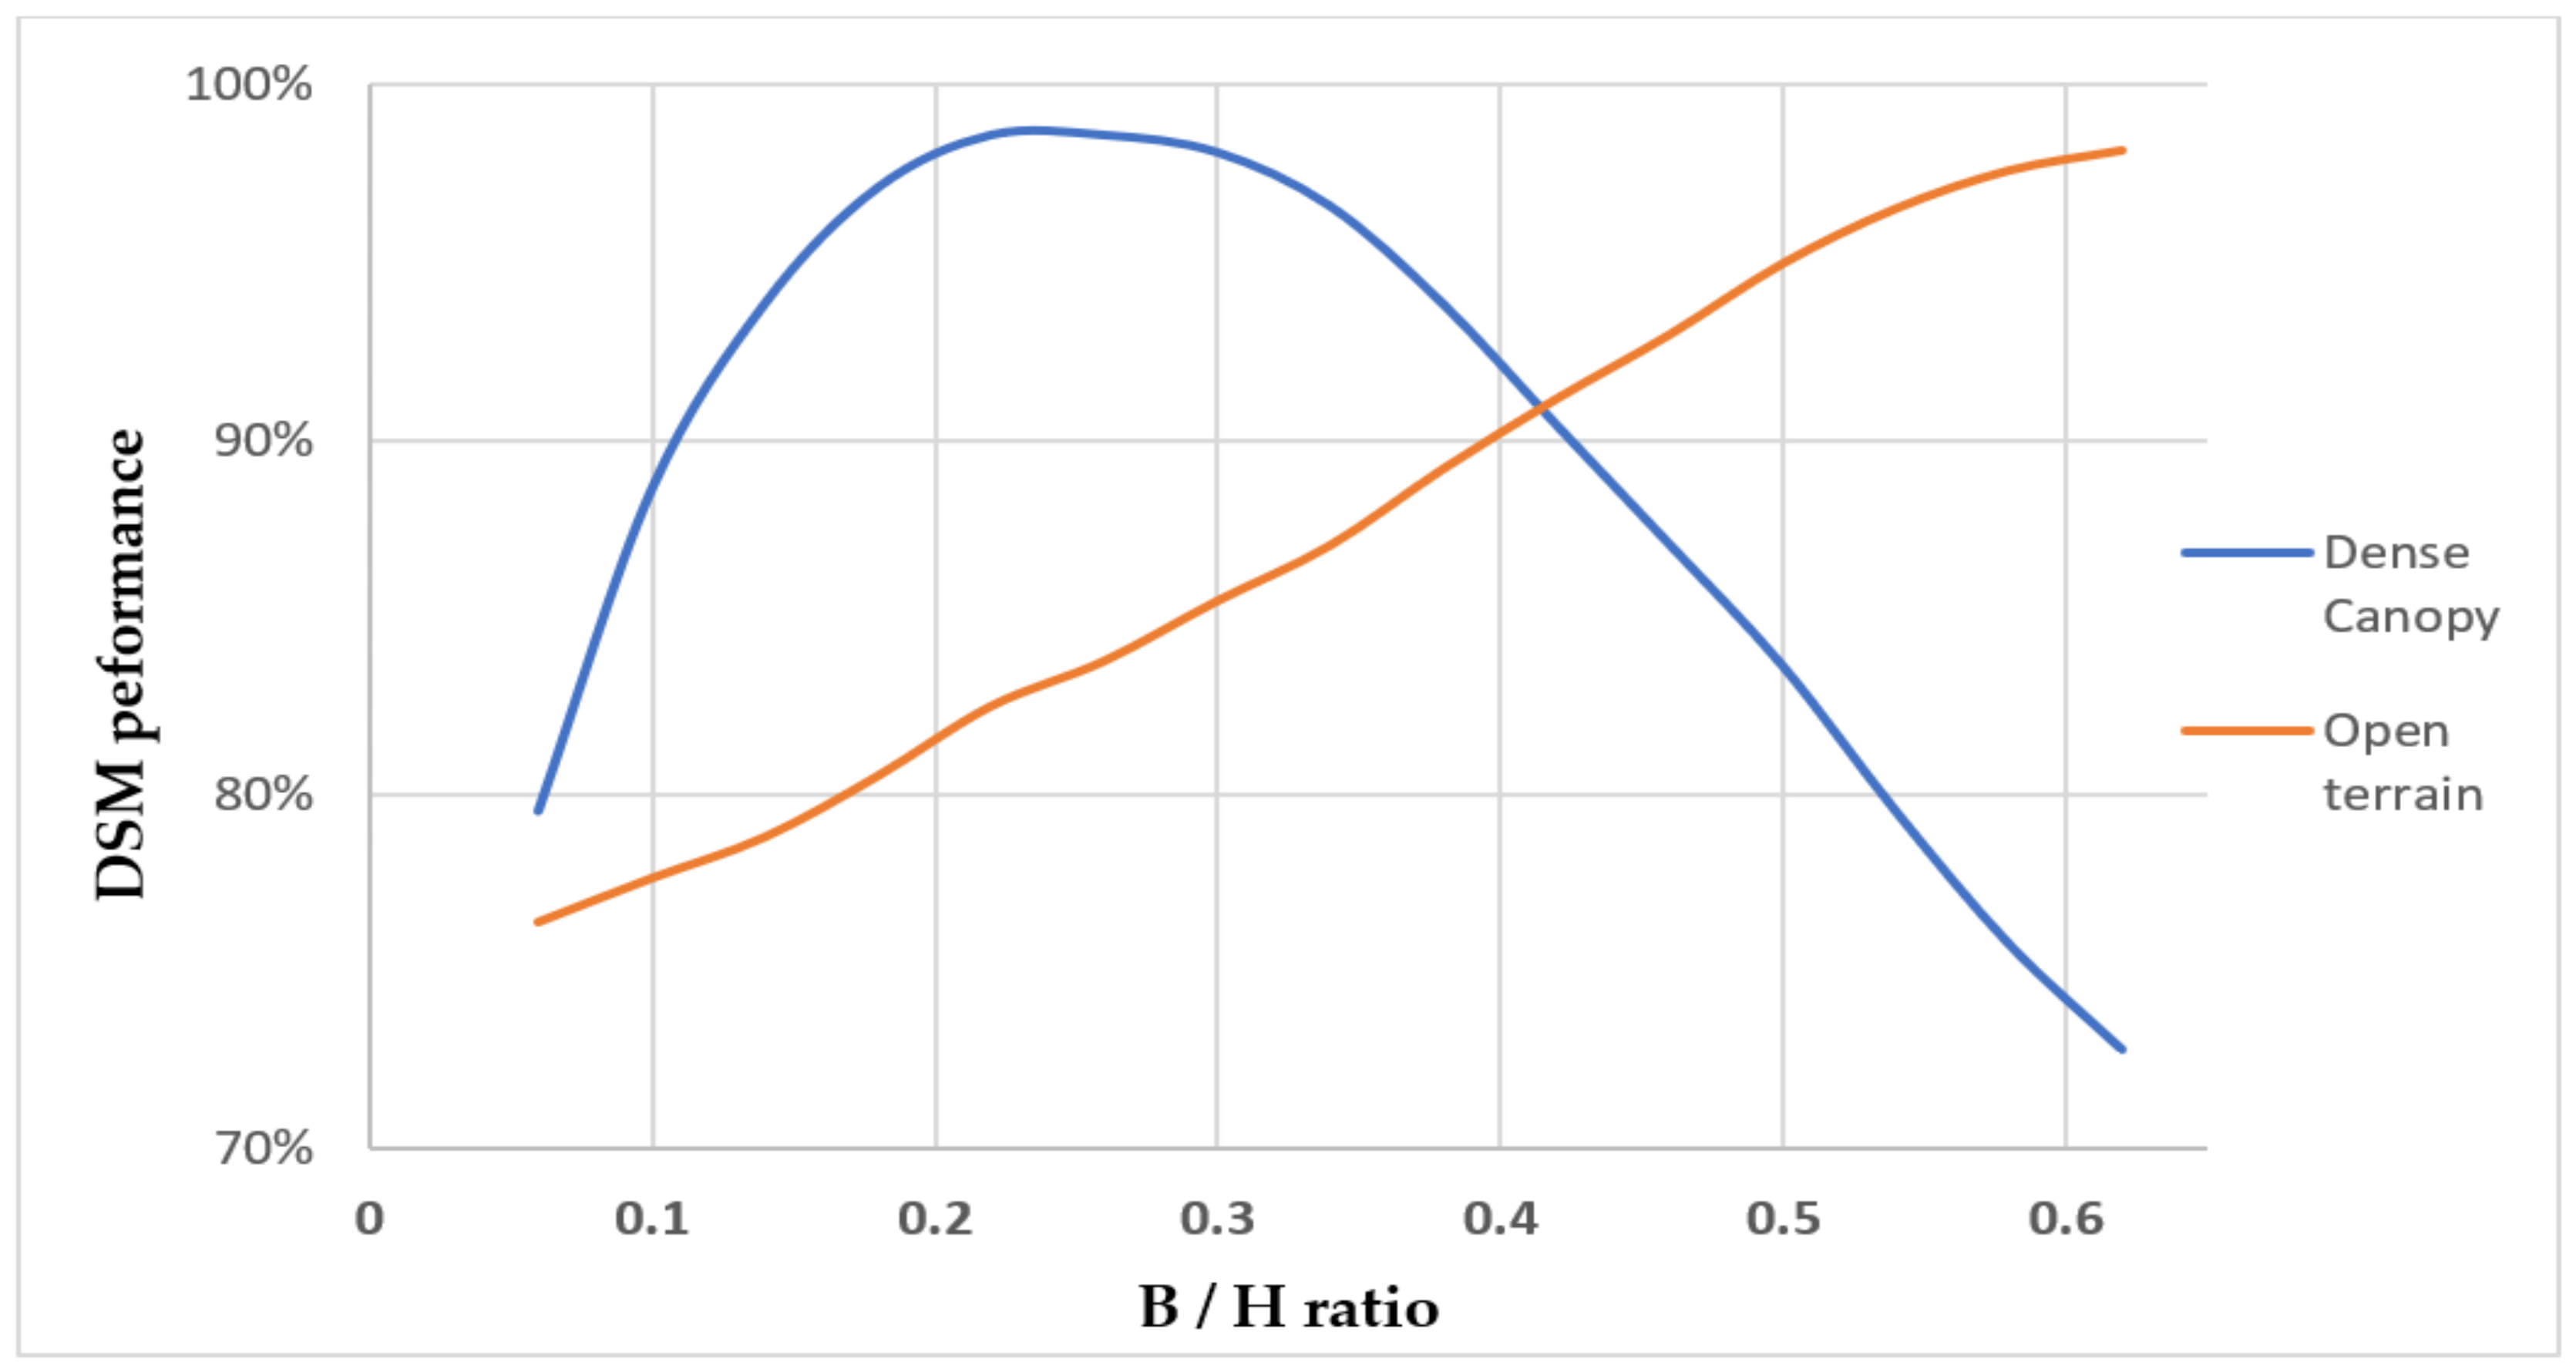
Summarizing the results of this study, it is possible to construct a relationship between the obtained efficiency (vertical accuracy and completeness) of image-based DSMs and the base-to-height (B/H) ratio of corresponding imagery in
hemiboreal predominantly mature, dense, closed-canopy forestland (
Figure 8). However, this graph must be interpreted with caution because we omitted the effect of sun-to-image geometry, which was almost the same for satellite-based sensors in this study, and resolution differences between satellite and airborne imagery. It should also be borne in mind that the convergence angle in the case of frame aerial imagery is variable over the entire overlap of each stereo model. In most cases depend on the location on a stereo model, the convergence angle is less than the nominal values calculated based on the B/H ratio,
Table 1. Based on airborne imagery performance, further research should be conducted in order to investigate the efficiency of satellite stereo imagery with the B/H ratio range between 0.15 and 0.25 (e.g., Pleiades tri-stereo approach) in similar forest areas. Overall, this study suggests that stereo imagery with a B/H ratio range of 0.2–0.3 (or convergence angle range 10–15°) is optimal for image-based DSMs in closed-canopy
hemiboreal forest areas.
To improve the performance of semi-global matching, the research also checked the efficiency of SGM matching settings by aggregating the cost along 16 paths instead of 8 (used in given research). The results showed a variable difference in accuracy with no significant improvements and a substantial calculation time increase. Moreover, the gains by using 16 paths were only noticeable for dominant stand-alone trees or groups of trees, which were out of the given study objectives.
5.3. Vegetation Reflectance and Image-Based DSM Performance
Besides the base-to-height ratio, the canopy detection performance also depends on how a vegetation surface interacts with light (reflectance and scattering) described by sun-sensor viewing geometry and accounted by the bidirectional reflectance distribution function (BRDF) [
31]. In this study, it is affected by a complex mixture of variables, including crown/canopy shape/structure, species composition, partial crown transparency, leaf orientation, and shadows. Consequently, the tree species used in this study were arranged in the following order according to the obtained canopy height accuracy (from worst to high): pine, spruce, birch, and black alder (
Figure 7).
A tapering ovoid shape characterises the pine with an average crown diameter of around four meters, branchless for most of the trunk length. Furthermore, it does not have dense foliage (relatively transparent) with upward-pointing branches at the top of the crown, influencing light scattering
(Figure 9a). Consequently, the matching could not detect the top of the trees, provided median −1.5 m canopy height underestimation with satellite (GE1) and even −1.2 m with airborne UltraCAM (
Figure 7), which makes up about 6–7% of average canopy height. Moreover, due to the
pines’ scattered reflectance and non-uniformity at the tops of the crowns, altogether with a high B/H ratio, the Pleiades-based models have shown unsatisfactory results in pine canopy detection (73%) and height underestimation (~−2 m).
In turn, the
Norway spruce (
Figure 9b), with the classic conic shape and needle-like leaves that grow around the upward-pointing branches, is non-transparent for sunlight. As a result, spruce has a very high (>99.5%) detection rate, but due to the sharp and narrow treetop, the canopy height underestimation is still high~−1 m for satellite (GE1) sensors. Interestingly, in the
spruce canopy height estimation, the highest difference between satellite and airborne DSM results was obtained among the rest tree species. UltraCam showed twice better results than the best GE1 image-based model (−0.5 m against −1 m GE1). According to Liang and Matikainen (2007) [
34], it can be inferred that for a cone-shaped spruce crown, the lower and upper crown parts can fall into the same raster cell. Thus, thanks to the better imagery resolution (0.25 vs 0.5m in GE1), the UltraCAM model has shown significant improvement in
spruce canopy height estimation.
Deciduous birch (
Betula pendula) trees (
Figure 9c) have main branches upward, with pendulous thin branches forming a “loose” crown, often with multiple peaks and changeful crown width and shape. The
birch canopy height estimation is much better than coniferous
pine and
spruce tree species but still negative~−0.25 m for all image-based DSM models (except Pleiades −0.50 m). Matured broadleaf
black alder (
Figure 9d) trees with one or more trunks develop an arched, dense, and gently sloping crown shape opaque to light. It provides the best results in canopy height estimation, close to zero with the highest (99.9%) canopy detection rate. The structure of the crown of
black alder also contributes to acceptable performance for satellite imagery obtained with a high base-to-ratio parameter (Pleiades case).
5.4. Spectral Band Performance of Satellite Image-Based DSMs
Overall, the current study found minor differences in image-based DSM performance related to spectral band imagery selection among the four tree species used (
Figure 6). In the GE1 case, the highest canopy height accuracy was achieved using PAN and BLUE bands, and the worst when using NIR or RED ones. In all cases, the spread of median error between the best and worst model did not exceed 10%, at the same time showing almost identical results in error distribution and completeness. No significant differences were found between Pleiades and GE1 image-based DSMs, except the
pine case. The discrepancy between the NIR and RED Pleiades image-based DSMs achieved 12% in
pine detection (completeness) and showed the 0.5 m shift of mean error.
One significant and unanticipated finding was that GeoEye1 BLUE-based DSMs showed the best performance in canopy height estimation for all tree species, including deciduous. At the same time, the NIR and RED band-based DSMs were the worst, regardless of tree species. This finding was unexpected because vegetation spectra dominated by chlorophyll have the highest reflection in the NIR/RED [
35]. The author’s recent research [
28] in Australian savannas showed that near-infrared BRDF, which is sensitive to canopy cover with higher contrast between canopy and the bare ground surface, provides the best efficiency in sparse
Eucalypt vegetation detection. It seems that in cases where the ground surface is fully covered by dense closed-canopy forest, the NIR/RED resulted in insufficient local image contrast between the sunlit top of the crowns and surrounding shadows for improved canopy detection.
These results agree with other studies’ findings [
36] that outlined the importance of the BLUE channel for forest species pixel-based classification and coniferous tree species discrimination. Immitzer et al. (2016) demonstrated the importance of the blue band for vegetation mapping using the Random Forest model, emphasising the weakness of near-infrared spectral information. Unfortunately, the conformation to study findings related to high BLUE band performance for canopy height detection using stereo-satellite imagery has not been found in literature. Thus, this could be an essential issue for future research.
The discrepancy between the best-performed BLUE (GeoEye1) and GREEN (Pleiades) image-based DSM models could be attributed to the pre-defined spectral ranges of a BLUE band in given satellites: GeoEye1 450–510, Pleiades 430–550 nm. Therefore, based on its spectrum, the Pleiades BLUE channel corresponds more to the BLUE-GREEN range. In summary, considering that the difference in canopy height estimation between the PAN and pan-sharpened spectral models was minimal (GeoEye), this study recommends using a high-resolution stereo PAN band for DSM calculations in closed-canopy hemiboreal forest areas.
5.5. Aspects, Limitations and Recommendations for Data Processing by Stereo Satellites
This research has shown that determining the optimum B/H ratio is critical for the efficiency of image-based DSM in dense, closed-canopy forests. As the B/H ratio increases, the number of pixels comprising the canopy surface decreases due to insufficient reflation and occlusions, with the likelihood that neighbouring pixel similarity also decreases. Due to the conical crown structure of coniferous tree species and relative transparency (pine case) affecting the BRDF, a high satellite sensor B/H ratio can lead to relatively poor image-matching results (Pleiades case). In its turn, decreasing the number of potential pixel matches reduces the ability to estimate the object surface or canopy height correctly. The study results should be interpreted cautiously, as the current research has only examined the hemiboreal dense, close-canopy forest areas. The canopy height underestimation of satellite image-based DSMs has to be considered when derived information will be used for further calculations of the forest inventory parameters. Thus, further research needs to be conducted to validate a B/H ratio performance for other vegetation types with varied canopy densities and located in different geographical regions.
This research has several practical applications to be applied in dense Latvian forests. Although LiDAR data provide higher tree detection rates and more accurate canopy height estimates, the spatial coverage and temporal resolution are limited due to the cost and time needed for data acquisition. Thereby, this increases the need for a regular flow of optical data acquired by national mapping agencies to support AGB mapping, forest inventory, and monitoring. In Latvia, a three-year cycle of collecting airborne imagery (0.25 m GSD) is used to perform complete territory mapping (orthophoto). This study showed that large-format aerial photography (e.g., UltraCam) is the optimal solution for creating the most accurate image-based DSM in vast and dense forestland. However, even such a short aerial photography cycle is not enough to quickly register and respond to all changes in vegetation. This study confirmed that satellite-based image matching (with optimal B/H ratio) is an adequate low-cost alternative for detecting canopies in hemiboreal forest areas with over 98% canopy detection rate and sufficient canopy height estimation accuracy (NMAD < 2 m). However, compared to LiDAR, optical sensors are strongly influenced by solar illumination, sun-to-sensor and sensor-to-target geometry (i.e., BRDF). In Latvian conditions, it is vital to remember that the insufficient sunlight during the winter season, and summer season clouds, sometimes restrict the use of satellite sensors, making image-based vegetation monitoring problematic.
One surprising finding was related to the indirect link between the human eyes performance of manual stereo data restitution and the computer vision matching technique. In most cases, the better and more accurately the human eyes can identify/detect a canopy by using stereo vision, the higher performance of image matching will be attained. This rule is correct for both sensor-to-target and sun-to-sensor geometry differences. It was especially noticeable during manual stereo comparison of different spectral GE1 and Pleiades imagery pairs. Thus, most likely that an experienced operator using a manual visual stereo check can filter and select the proper stereo imagery pairs for further use in image matching.
6. Conclusions
In this investigation, the main aim was to assess airborne and VHRSI satellite image-based DSM performance for canopy height estimation in predominantly mature, dense, closed-canopy Latvian hemiboreal forestland. Although airborne-based DSMs showed the highest efficiency, this study confirmed that commercially available VHRSI imagery could be a suitable and accurate alternative for detection and estimating canopy height in dense, closed-canopy forests. The canopy detection rates (completeness) by using GeoEye1 stereo imagery varied from 98% (pine) to >99% for spruce and deciduous tree species.
After performing a direct comparison of calculated image-based DSM models with reference LiDAR, the study confirmed the tendency for canopy height underestimation for all satellite-based models. The obtained accuracy of the canopy height estimation GE1-based models varied as follows: for a pine (−1.49 median, 1.52 m NMAD), spruce (−0.94 median, 1.97 m NMAD), birch (−0.26 median, 1.96 m NMAD), and black alder (−0.31 median, 1.52 m NMAD).
The significant finding was that the base-to-height ratio (convergence angle), a part of sensor-to-target geometry, is critical for canopy height estimation efficiency and completeness using image-based DSMs. Thus, this study suggests that stereo imagery with a B/H ratio range of 0.2–0.3 (or convergence angle range 10–15°) is optimal for image-based DSMs in closed-canopy forest areas. Furthermore, besides the B/H ratio, the study confirmed that the canopy height estimation efficiency is affected by a complex mixture of variables, including crown/canopy shape/structure, species composition, partial crown transparency, leaf orientation, and shadows. Finally, this study has found that, generally, the spectral bands of VHRSI imagery have a minor impact on canopy detection rates and canopy height estimation accuracy in dense, closed-canopy hemiboreal forestland. Therefore, in most cases, the study recommends using a satellite high-resolution stereo PAN band for DSM generation.


