Article

Lightning Activity Observed by the FengYun-4A Lightning Mapping Imager

1
Key Laboratory of Radiometric Calibration and Validation for Environmental Satellites, China Meteorological Administration (LRCVES/CMA), National Satellite Meteorological Center, Beijing 100081, China
2
National Satellite Meteorological Center, Chinese Meteorological Administration, Beijing 100081, China
3
Key Laboratory of Middle Atmosphere and Global Environment Observation, Institute of Atmospheric Physics, Chinese Academy of Sciences, Beijing 100029, China
*
Author to whom correspondence should be addressed.
Remote Sens. 2021, 13(15), 3013; https://doi.org/10.3390/rs13153013
Submission received: 11 May 2021 / Revised: 1 July 2021 / Accepted: 12 July 2021 / Published: 31 July 2021
(This article belongs to the Section Atmospheric Remote Sensing)

Abstract

:
The Lightning Mapping Imager (LMI) onboard the geostationary meteorological satelliteFengYun-4A (FY-4A) detects both intra-cloud (IC) and cloud-to-ground (CG) lightning continuously during daytime and nighttime. This study examined, for the first time, the optical characteristics and distribution of the “Event,” “Group,” and “Flash” observed by the LMI in the whole LMI observation domain. The optical properties and spatial distribution of the LMI lightning were compared with those of the Lightning Imaging Sensor on the International Space Station (ISS-LIS) based on the dataset during 2018–2020. Due to the different spatial resolutions and detection efficiencies of these two lightning imagers, the number of ISS-LIS lightning was more than that of LMI lightning. The ISS-LIS Flash duration was also larger than that of the LMI Flash. The duration, radiance, and footprint of LMI lightning in different regions were analyzed in detail based on the LMI lightning dataset in 2019. The duration and radiance of the Flash were generally less than 50–500 ms and 200 Jm−2ster−1μm1, respectively. The footprint of Flashes was distributed from 200 to 600 km2. The number of Groups per Flash was mostly less than five. Considering the spatial distribution and temporal variations in the LMI lightning compared with the ground-based Lightning Location Network in China (LLNC), it was found that the LMI Group number was close to the LLNC CG (Cloud-to-Ground) Event number. The maximum Flash density was found in the middle and lower south of the Yangtze River and Pearl River Delta region, respectively, while the lower values were in western China, where the mean radiance per Flash was greater. There was more LMI lightning during the nighttime than that during the daytime, indicating the higher detection efficiency of the LMI in the nighttime than in the daytime.

1. Introduction

There are two optical lightning imagers onboard satellites in geostationary orbits that can monitor lightning and thunderstorms on a continual basis so far. The Geostationary Operational Environmental Satellite R-series (GOES-R, GOES-16), which carries the Geostationary Lightning Mapper (GLM), was launched on 19 November 2016 [1,2]. The FengYun-4A series (FY-4A) geostationary meteorological satellite with the Lightning Mapping Imager (LMI) was launched on 11 December 2016 [3]. In addition, the Lightning Imaging Sensor (LIS) on the International Space Station (ISS) was launched on 19 February 2017 [4,5]. The GLM, LMI, and ISS-LIS are all in operation at present. The capability to continually track and monitor changes in total lightning activity within individual storms has great potential to improve the forecasting of oncoming severe weather.
The space-based optical lightning imager locates lightning by capturing cloud top optical emission events due to lightning discharge. The optical lightning imager characterizes the duration, size, and radiance of a flash. However, the optical emission from a flash detected by a space-based lightning imager is usually scattered by the cloud hydrometeor and attenuated as it propagates in the cloud [6,7,8,9]. As a result, the flash rate detected by a space-based optical lightning imager is associated with the optical properties of lightning at different scales and the organization of thunderstorms [10,11,12]. Thunderstorm organization affects how the light produced from lightning is scattered, reflected, and observed. Dense clouds block light escaping from the cloud top with sufficient energy for detection by lightning imagers in space. Light also reflects off lower cloud layers causing the flash energy to appear larger than it is in reality. In the most severe storms, such as super cell thunderstorms and multi-cell thunderstorms, the flash rate is usually high, with many flashes of shorter duration and lower radiance, while in most isolated small thunderstorms, the flash rate is always low, with some flashes of longer duration and higher energy [12].The flash rate detected by an optical lightning imager is also associated with the optical response of the charge-coupled device (CCD) and resolution of the optical lightning imager [13]. Furthermore, the background threshold used for removing the background optical signals and the detection threshold used for discriminating the events from non-lightning artifacts (also called “false” events) also influence the detection efficiency and false alarm rate of lightning imagers.
The FY-4A LMI detects total lightning, including both intra-cloud (IC) and cloud-to-ground (CG) lightning over China and its adjacent oceans during daytime and nighttime [14,15]. The FY-4A LMI datasets are useful for investigating the lightning activity in China and adjacent regions. In this paper, we used a LMI dataset to investigate the optical properties of lightning and lightning activity by comparing the LMI with the ISS-LIS and ground-based lightning locating system. The characteristics of the LMI lightning were also studied, and the LMI performance were examined over its whole detection domain. It should be noted that when the specific LMI “Flash,” “Group,” or “Event” parameters are mentioned, the nouns are capitalized in this paper. “LMI lightning” indicates all three parameters [16,17].

2. Data and Methodology

The datasets from the LMI, ground-based lightning locating system in China, and ISS-LIS were used in this study to investigate the optical characteristics of LMI lightning and LMI lightning activity.

2.1. The FY-4A LMI

The FY-4A geostationary meteorological satellite is a second-generation Chinese geostationary meteorological satellite. It carries a new instrument of the LMI for total lightning (IC and CG flashes) detection, although it cannot distinguish lightning type. Three other payloads that reside on the FY-4A satellite are the Geostationary Interferometric Infrared Sounder (GIIRS), Advanced Geostationary Radiation Imager (AGRI), and Space Environment Package (SEP).
The LMI consists of a 400 pixel × 600 pixel CCD that operates with a narrowband (1 nm width) interference filter in the solar reflective region of the spectrum at a wavelength of 777.4 nm, a wide field-of-view (FOV) lens system, and a Real-Time Event Processor (RTEP). If incident light is focused onto the CCD array, each pixel of the CCD array accumulates the received energy. The integrated time over each frame of the CCD array is approximately 2 ms. The LMI has a continuous monitoring capability across a coverage of 9000 km2 diagonal FOV with a near-uniform round sample 8–24 km-pixel-footprint resolution. The LMI observes lightning activity continuously during the day and night with a spatial resolution of 7.8 km (at nadir). As the FY-4A satellite platform shifts in March and October each year, the FOV coverage is China and its adjacent ocean (LMI-North, LMI-N) from March to October and the west of Australia (LMI-South, LMI-S) from October to March of the next year, annually. The minimum detection efficiency of the LMI is expected to be approximately 70% and the maximum false alarm rate is 10% [17].
The “false” signal filtering and cluster-analysis algorithm are used in the Level 1 to Level 2 product algorithm of the LMI [17]. At the beginning, the Level 0 data with the background filtered on RTEP are transmitted to the ground data receiving system from the LMI onboard FY-4A. Then, the level 0 data are calibrated and navigated on the ground data processing system to become Level 1 data. The Level 1 data are then filtered and clustered to become a Level 2 product. First, most of the non-lightning optical events (“false” signals) recorded by the CCD array are identified and filtered using different methods according to the different types of noise sources. Secondly, the Events are clustered into Groups and Flashes using a specified time and space threshold, and the other non-lightning optical events are filtered further. The instrument characteristics, including pixel integration time, pixel spatial resolution, and signal-to-noise ratio, can all affect flash clustering [16]. The adjacent Events in an isolated frame are clustered as a Group. Formula (1) is used to compute the optical amplitude-weighted centroid (ΦCentroid) to obtain the location of a Group.
Φ Centroid = i = 1 N A i Φ i i = 1 N A i
where Ai indicates the radiance of each Event that has been clustered to the same Group. Φi indicates the location of each Event that has been clustered to the same Group. Once the Groups are identified, the weighted Eula distance (WED) between two Groups is computed to obtain a Flash according to Formula (2).
WED = ( Δ X 16.5 ) 2 + ( Δ Y 16.5 ) 2 + ( Δ T 330 ) 2 1.0
where △X is the distance between the two Groups in longitude, △Y is the distance between the two Groups in latitude, and △T is the time difference between the two Groups. Once a Flash is identified, Formula (1) is used again to compute the optical amplitude-weighted centroid (ΦCentroid) to obtain the location of the Flash, and Ai then indicates the energy density of each Group that is clustered to the same Flash. Φi indicates the centroid of each Group that is clustered to the same Flash.
The main LMI Level 2 products include “Flash,” “Group,” and “Event.” These products describe the time of occurrence, radiant energy, and location of the lightning flash. They refresh in less than 1 min. Similar to the LIS and GLM, an “Event” means a single pixel of the LMI CCD array exceeding the background threshold during a single frame. In other words, Events are used to define the time of occurrence and spatial extent of each “Group.” A “Group” means two or more adjacent Events in the same time frame. The “Group” is physically interpreted as the optical pattern associated with either a return stroke of CG lightning or a cloud pulse, or as the entire region of the cloud top simultaneously illuminated by lightning. In other words, Groups are used to define the beginning, end, and spatial extent of each “Flash.” A “Flash” means a set of groups sequentially separated in time and in space by a certain threshold. The accuracy of the “Event” location is 1 pixel (the pixel size under a sub-satellite point is approximately 7.8 km on the earth). The “Flash” is characterized by duration, radiance, and footprint. The “Group” and “Event” are characterized by radiance and footprint.

2.2. The Lighting Locating Network in China (LLNC)

The CG lightning data from ground-based LLNC were used for comparison in this study. The LLNC locates only CG lightning, similar to the National Lighting Detection Network (NLDN) in the United States [18]. The LLNC consists of more than 200 stations in China. To locate return strokes of CG lightning, the LLNC requires at least four stations to detect the same lightning signal. The flash detection efficiency and stroke detection efficiency are 93% and 42%, respectively, based on rocket-triggered lightning, and the normalized horizontal error of return strokes is less than 760 m [19].

2.3. ISS_LIS

The ISS-LIS lightning data were also referred to for comparison. The ISS-LIS is flown as a hosted payload on the Defense Space Test Program-Houston 5 (STP-H5) mission for a nominal two-year mission [4,5]. Similar to the GLM and LMI, optical lightning detection is performed at a wavelength of 777.4 nm, which is the atomic oxygen line. The ISS-LIS orbits at an altitude of 425 km, at an orbital inclination of 54°. The view time of the ISS-LIS at a fixed point is only 90 s, and it covers the whole Earth in approximately 16 laps per day. The LIS focal plane consists of a128 pixel × 128 pixel CCD that is read-out every 2 ms. The pixel FOV ranges between 4.5 km (nadir) and 6.2 km at the edges. The ISS-LIS optically detects total lightning that occurs within its approximately 655 × 655 km2 FOV during the day and night.

3. Results

The LMI, ISS-LIS, and LLNC datasets are compared first to investigate their similarities and differences. Second, the optical characteristics and lightning distribution in China detected by the LMI are discussed.

3.1. Comparison between LMI, ISS-LIS, and LLNC

Figure 1 shows the Events density detected by LMI and ISS-LIS during 2018–2020. To investigate the performance of the LMI both in the FOV of LMI-N and LMI-S, LMI lightning in both of these regions are discussed. It could be found that the geographical distribution of the maximum LMI Event density is generally in qualitative agreement with the ISS-LIS Event, although a significantly larger Event density is obtained by ISS-LIS, suggesting the advantages of high resolution in the CCD array. High Event density values over land are observed for the southeast of China and northwest of Australia. There are also many Events distributed in the south of the Himalayas and Bay of Bengal. The lowest continental values are found in western China and in the southwest of Australia. The phenomenon might be due to the weak convective system, where as the lightning discharge usually occurs in the lower clouds in western China. Sparse Events with weak discharge or optical emission blocked by the upper cloud might be classified as noise and filtered in these regions, whereas only Events with strong radiation (higher than the detection threshold) could be determined as a lightning Event in the LMI algorithm.
Table 1 shows the optical properties of the LMI and the ISS-LIS lightning during 2018–2020. The ISS-LIS Event number is approximately11 times (12 times) higher than that of the LMI Event in LMI-N (LMI-S). The large difference between the number of the ISS-LIS lightning and the LMI lightning is mostly due to the different spatial resolution of these two lightning imagers (7.8 km at nadir of the LMI, 4.5 km at nadir of the ISS-LIS). It can be seen that the proportion of the LMI Flash number, Group number, and Event number is approximately 1:4:11 both in the LMI-N and LMI-S. The proportion of the ISS-LIS Flash number, Group number, and Event number is approximately 1:10:38 in the LMI-N and 1:10:41 in the LMI-S. The different proportion of the LMI and the ISS-LIS indicates that the ISS-LIS Flash includes more Groups and Events than the LMI Flash does. This is also due to the different spatial resolution and the difference in clustering analysis used in the product algorithms of these two lightning imagers. The average ISS-LIS Flash duration is about 306 ms in LIS-N (320 ms in LIS-S) and is approximately 1.4 times higher than the LMI Flash duration. The proportions of Flash radiance and Group radiance are approximately 4 (LMI) and 12 (ISS-LIS), respectively, which are almost in accordance with the proportions of Flash number and Group number.
Figure 2 shows the spatial distribution of LMI lightning and LLNC CG lightning return stroke events (LLNC CG Event) in July 2019. Clearly, to a certain extent, the distribution of the LMI Group is in accordance with the LLNC CG Event, especially in the high-lightning-density region and the lower-density region. All the distributions in terms of the Flash, Group, and Event are in a similar pattern to the CG Event.
Table 2 shows a comparison of the LMI and LLNC lightning. It can be seen that the proportion of the number of Flashes, Groups, and CG lightning return stroke events is approximately 1:4:3. The number of LLNC CG Events is numerically close to the number of LMI Groups, which is mostly associated with the K-change in IC lightning discharge or return stroke of CG lightning. However, these parameters still differ in some regions. Considering that the LLNC detects only the return stroke of CG lightning, but the LMI detects both CG and IC lightning, although it could not distinguish the CG lightning from IC lightning, the proportion of the LMI Group number and LLCN CG Event number could reflect the ratio of IC and CG lightning to a certain extent.
Figure 3 shows the spatial distribution of the radiance of the LMI lightning and the current intensity of the LLNC CG Event. Lower values of the radiance of the LMI lightning are found in the northwest of Qinghai and northeast of the Tibetan Plateau. The distribution of the radiance of the LMI Group radiance is not in accordance with the current intensity of the LLNC CG Event in most regions of China, because these two systems detect preferentially different types of lightning discharge. The LMI lightning radiance is mostly associated with the properties of clouds but could not always indicate the actual intensity of lightning. The detection capability of the LMI was likely to be affected by cloud properties, cloud depth, and cloud shielding effects that affect the LMI detection capability [20].

3.2. Optical Characteristics of the LMI Lightning

The optical properties of the LMI Flash, Group, and Event were the focus of this study based on the LMI Level 2 product dataset in 2019.

3.2.1. Optical Characteristics of the LMI Flash

Figure 4 shows the statistical results of the duration, radiance, and footprint of Flashes in the LMI-N and LMI-S during daytime and nighttime in 2019.The duration of the LMI Flash is obviously 50–500 ms at all times of the day. The peak in Figure 4b around 330 ms is mostly associated with the time threshold (330 nm) used in Group-Flash clustering analysis. The radiance of a Flash is 50–300 Jm−2ster−1μm−1 during the daytime and nighttime. The footprint of the Flashes is concentrated in the range of 200–600 km2 during both daytime and nighttime. The number of Groups per LMI Flash (Flash-Group number) is mostly less than five.
It was found that the optical characteristics of Flash in the LMI-N are consistent with those in the LMI-S during both daytime and nighttime. It is suggested that the optical response of the LMI instrument is stable. In general, the radiance of a Flash is less than 200 Jm−2ster−1μm−1. It should be noted that there are few Flashes with a radiance less than 200 Jm−2ster−1μm−1 during daytime in LMI-N. Specifically, the contribution rate of Flash radiance increases quickly from approximately 20–30 to 50 Jm−2ster−1μm−1 to approximately 7% and then decreases quickly from approximately 50 to 200 Jm−2ster−1μm−1 in both the LMI-N and the LMI-S during nighttime. The percentages of duration and footprint (and Flash-Groups number) during daytime are obviously larger than those during nighttime. Conversely, the percentage of radiance during nighttime is larger than that during daytime. We suppose that the radiance of a Flash during daytime is a subtraction of the real cloud top radiance and the background optical radiance. The real footprint of a Flash during daytime should be larger than what is detected.

3.2.2. Optical Characteristics of the LMI Groups and Events

Figure 5 shows a comparison of the Group and Event in the LMI-N and the LMI-S. The optical characteristics of the Group in LMI-N are consistent with those in the LMI-S. In general, the radiance of the Group is less than 100 Jm−2ster−1μm−1. The footprint of the Group ranges from100 to 300 km2. The number of Events per Group (Group-Events number) is mostly less than five. Specifically, the contribution rate of Group radiance increases quickly from approximately 10–20 to 50 Jm−2ster−1μm−1 to approximately 20% in both LMI-N and LMI-S during nighttime. The radiance of an Event ranges from 5 to 20 Jm−2ster−1μm−1 throughout the daytime. The Event radiance contribution rate decreases quickly from 10 to 50 Jm−2ster−1μm−1 all day. The Event radiance contribution rate decreases quickly from 10 to 50 Jm−2ster−1μm−1 to approximately 25% (during nighttime) and 5% (during daytime) in both LMI-N and LMI-S. It should be noted that the radiance of an Event is mostly concentrated during approximately 1–20 Jm−2ster−1μm−1.

3.3. Spatial Distribution of the LMI Lightning in China

The spatial distribution of the LMI lightning in terms of LMI Flash, Group, and Event is discussed in this section based on the LMI dataset in 2019.

3.3.1. Spatial Distribution of the LMI Flash

Figure 6 shows the spatial distribution of the Flash density, duration, radiance, footprint, and Flash-Groups number during daytime and nighttime. The Flash density is dominated by the middle and the lower south of the Yangtze River in China. The characteristics of the LMI Flash radiance density have opposite appearances relative to that of the LMI Flash density, dominating over western China and the southwest and northeast of China. Lower values of Flash density are found over western China and the northeast of China, where the mean radiance per Flash is greater than in other regions of China. It should be noted that the Flashes over western China are characterized by a shorter duration and larger radiance. The characteristics of LMI Flash are the expected according to the previous research of thunderstorms climatology in the regions of China and Australia by TRMM-LIS [21].
Previous studies have suggested that the optical energy of flash appearance changes according to the scale and organization of thunderstorms that are related to geographical features and climate conditions [9,10,22]. Clouds near the storm edge are frequently illuminated by large optical Flashes, because their emission can reflect off the exposed surfaces of nearby clouds to reach the satellite. The discrepancy could be associated with the small scale [23] and unique charge structure of thunderstorms in western China [24,25]. The height of the cloud base and cloud hydrometeor are both lower on the Tibetan Plateau and in desert regions [9,26,27]. Lightning is more likely to be IC lightning, which occurs in the lower part of the thunderstorm [24,25]. The optical emission from these weak IC lightning events could be blocked by the cloud body in these areas, with only the most intense lightning flashes being detected.
The duration of Flashes is typically 200 ms with various large extents that are associated with lightning diversity. It is suggested that a Flash with longer duration and larger radiance is related to the lightning that occurs in weak thunderstorms [12]. Energetic thunderstorms always present Flashes of shorter duration and lower radiance. The Flashes footprint is highest in the east of the Tibetan Plateau and the southwest and southeast of China. The Flash-Group number shows a similar distribution to that of the Flashes footprint. It should be noted that very few Flashes were detected in the northwest of Qinghai Province and the northeast of the Tibetan Plateau where the Qaidam Basin is located.

3.3.2. Spatial Distribution of LMI Group

Figure 7 shows the distribution of the LMI Group density, radiance, footprint, and Group-Event number. Similar to the distribution of Flashes, the Group density is dominated by the middle and lower south of the Yangtze River. The lowest values of the Group density are also found over western China and the northeast of China, where the mean radiance per Group is higher than those of other regions. The Groups footprint is highest in the east of the Tibetan Plateau and in the southwest and southeast of China. The Group-Event number has a similar distribution to the Groups footprint. It should be noted that there are no Groups in the Qaidam Basin.

3.3.3. Spatial Distribution of LMI Events

The Event density in China is dominated by the middle and lower south of the Yangtze River, as shown in Figure 8. The lowest values of the LMI Event density are found over western China and the northeast of China where the mean radiance per Event is greater than those in other regions.

3.4. Temporal Variation of the LMI Lightning

We examined the temporal variation in the LMI lightning in terms of monthly, daily, and hourly in 2019.The elevation is lower in the east of China and higher in the west of China in general. Coastal areas have a tropical monsoon climate and inlands have a temperate continental climate. To investigate the influences of geographical features on the characteristics of the LMI lightning, four typical regions—the Tibetan Plateau (TP), Beijing-Tianjin-Hebei region (BTH), Yangtze River Delta region (YRD), and Pearl River Delta region (PRD)—are considered.

3.4.1. Monthly and Daily Variations in LMI Flash

Figure 9 shows the monthly and daily variation in the LMI Flash density, radiance, duration, footprint, and Flash-Group number from April to September. The Flash density in the PRD is significantly greater than those in the other three regions. The peak Flash density is 379 Flash month−1 in April in the PRD, while it is75 Flash month−1 (YRD), 63 Flash month−1 (BTH), and 18 Flash month−1 (TP) in the other three regions in July, respectively. The Flash density decreases from July to September in all four regions. The comparison shows that the convective systems are always more active over the PRD than over the other three regions, while the Flash density on the TP is always less than those in the other three regions. This phenomenon is significant quite possibly due to the distinct electrical structure of the thunderclouds developed on the TP, which have a larger-than-usual lower positive charge region, resulting in a dominant polarity-inverted IC discharge at the lower part of the cloud [23]. The mean Flash radiance increases in the PRD and decreases on the TP from April to September. In contrast, the mean Flash radiance in the YRD and BTH fluctuates from April to September. The mean Flash duration is approximately 150 ms for most of this period and then suddenly increases to approximately 400 ms in September in all four regions. The mean Flash footprint remains at approximately 800 km2 for most of this period and then rapidly increases to approximately 1300 km2 when the mean Flash duration increases in September. The mean Flash footprint is greater in the YRD and PRD than in the other two regions. Typically, the monthly variation in Flashes in the YRD and BJT are similar, while those in the PRD and on the TP are quite different.

3.4.2. Monthly and Daily Variations in the LMI Group

Figure 10 shows the monthly and daily variations in the LMI Group density, radiance, and footprint. It is obvious that the Group density in the PRD is significantly greater than those in the other three regions from April to September. The peak Group density is 1684 Group month−1 in the PRD in April. In the other three regions, typically, the peak Group density values are 293 Group month−1 (YRD), 220 Group month−1 (BTH), and 61 Group month−1 (TP) in July. Similar to the monthly variation in the Flash density, the Group density decreases from July to September in all four regions. The Group density on the TP is always less than those in the other three regions. The monthly variation in the mean Group radiance is similar to that of the Flashes. The mean Group footprint remains approximately 250 km2 and fluctuates only slightly.
From the monthly variation in the LLNC CG Event density and peak current intensity, it was found that the peak values of the LLNC CG Event density are 2790 strokes month−1 (PRD), 1670 strokes month−1 (YRD), 349 strokes month−1 (BTH), and 60 strokes month−1 (TP) in July. The mean peak current of the peak current of the LLNCCG Event is approximately 50 kA and fluctuates only slightly. There is a low correlation between the mean LMI Group radiance and peak current of the LLNC CG Event because of the lightning imager onboard the satellite capturing the optical emission events that propagate through the cloud medium and escape from the cloud top. In fact, the detected optical emissions of the LMI Event tend to be more closely related to lightning discharge in the cloud. However, the peak current of the LLNC CG is mainly related to the discharge of return strokes, which originate in the lower part of the cloud and propagate to the ground. We suppose that if the intra-cloud lightning and cloud-to-ground lightning could be detected by the LMI, the correlation would be good between LMI Groups and LLNC CG Events.

3.4.3. Monthly and Daily Variations in the LMI Event

Figure 11 shows the monthly and daily variations in the LMI Event density and radiance. It is clear that the Event density in the PRD is significantly greater than those in the other three regions from April to September. The peak Event density is approximately 6000 Event month−1 in the PRD in April. In the other three regions, the peak Event density values are 1100 Event month−1 (YRD), 700 Event month−1 (BTH), and 200 Event month−1 (TP) in July. Similar to the monthly variation in the Flash density and Group density, as discussed above, the Event density decreases from July to September. The Event density on the TP is always less than those in the other three regions.

3.4.4. Hourly Variation in the LMI Flash

The lightning imager onboard the satellite captures optical emission events on the tops of thunderclouds when illuminated by the lightning discharge and uses these captures to locate lightning. This type of observation is affected by the optical background, which is greater in the daytime than the nighttime. As a result, the radiance threshold value used in the non-lightning artifacts filtering must be adjusted dynamically. A Flash observed by a satellite-based lightning imager at nighttime with a low background radiance would appear to have a greater radiance than the same flash observed during the daytime [8]. Lightning activity shows a clear diurnal variation because of solar heating. Thus, it is necessary to investigate the hourly variation in the LMI products to understand the imager’s performance.
Figure 12 shows the hourly variation in the LMI Flash and the LLNC CG Event in the regions of China. The LMI Flash density (as well as Group density and Event density) shows a significant increase from 00:00 to 11:00. The peak Flash density (Group density and Event density) is approximately 10 Flashes hour−1grid−1 (9 Group hour−1 and 9 Event hour−1grid−1) at 11:00. Meanwhile, the Flash density declines, reaching 4 Flash hour−1 at 17:00 and then increasing between 17:00 and 19:00. The Flash density then declines until 00:00 the next day. The hourly variations in the Group density and Event density are in accordance with those of the Flash density. It should be noted that more LMI Flashes are selected during the nighttime (11:00–21:00) than during the daytime. The hourly variation in the radiance density of the Flash is opposite that of the Flash density. It should be noted that because of the different optical background scenarios during the daytime and nighttime, many Events and Flashes with low radiance during the daytime might be classified as background during LMI product processing. From the hourly variation in the LLNC CG Event, it was found that the LLNC CG Event density shows a significant increase from 00:00 to 07:00. The peak LLNC CG Event density is approximately 7 stroke hour−1 at 07:00. Meanwhile, the LLNC CG Event density declines, reaching 2 stroke hour−1 at 23:00. The hourly variation in the current intensity of LLNC CG Events fluctuates slightly during both daytime and nighttime.

4. Discussions

Based on this study, it is suggested that the LMI datasets are generally reliable and can reveal some characteristics of lightning activity. However, for an event detected by the LMI after background subtraction on RTEP, the radiant energy in the CCD pixel with the event illuminated must be above a detection threshold value as that pixel is constantly being illuminated by the bright optical emissions (“false” events) that are not from the lightning, just as with the GEO radiation environment (energetic particles that strike the focal plane and generate spurious streaks of light), the sun glinting off the surface of the ocean, lakes, or rivers, “lollypop”, and various instrumental effects. The detection threshold value increases along with the background. At present, we suppose that the background and detection threshold value of the LMI for each pixel were estimated too high to increase the detection efficiency. The nominal detection threshold value for increasing the LMI sensitivity will be investigated in the further research.

5. Conclusions

In this study, the optical characteristics, spatial distribution, and temporal variation in LMI lightning (including the Flash, Group, and Event parameters) were examined to understand the performance of the LMI. The conclusions are as follows:
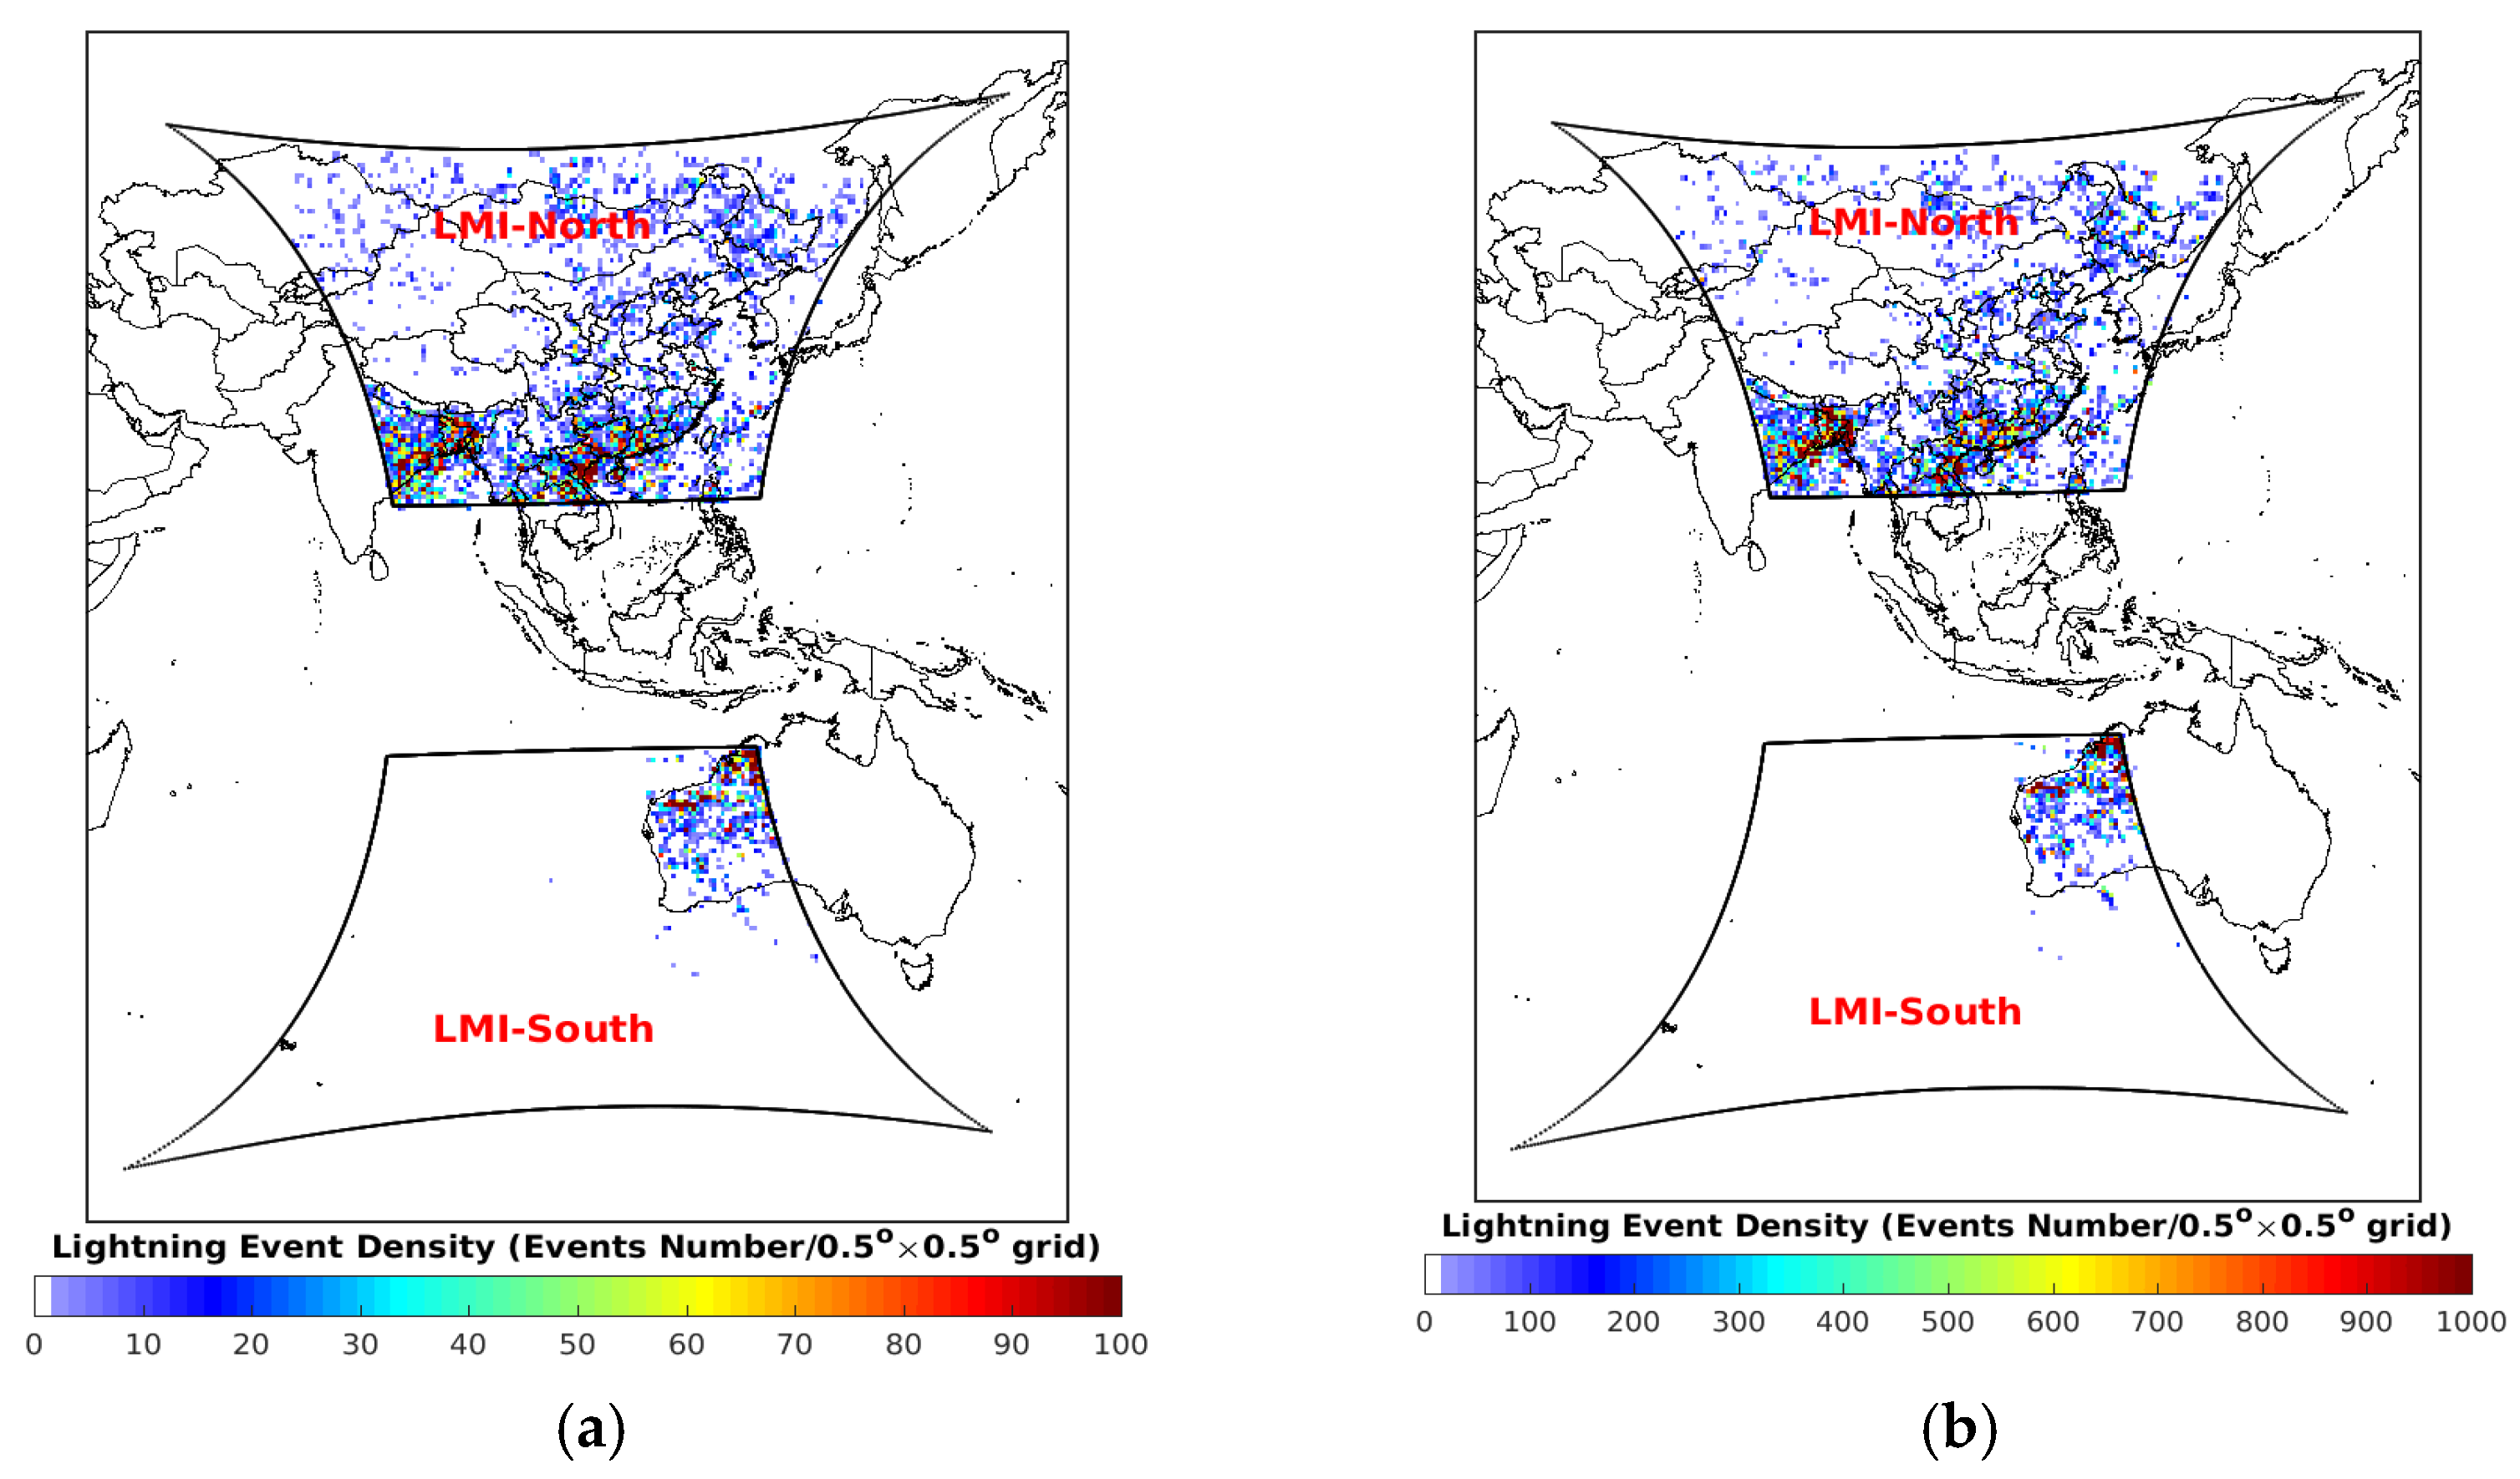
  • From the analysis of the optical characteristics of the LMI lightning, it could be found that the geographical distribution of the maximum LMI Event density is generally in qualitative agreement with the ISS-LIS Event. The ISS-LIS Event number is approximately 11 times (12 times) higher than that of the LMI Event in LMI-N (LMI-S). The different proportion of the LMI and the ISS-LIS indicates that the ISS-LIS Flash includes more Groups and Events than the LMI Flash does. The average of ISS-LIS Flash duration is about 306 ms in LIS-N (320 ms in LIS-S) and is approximately 1.4 times higher than the LMI Flash duration. The proportions of Flash radiance and Group radiance are approximately 4 (LMI) and 12 (ISS-LIS), respectively, which are almost in accordance with the proportions of Flash number and Group number.
  • The optical characteristics of the LMI Flash in the LMI-N are consistent with that in the LMI-S. The duration of the LMI Flashes is generally 50–500 ms. The radiance of the contribution rate of the Flashes increases quickly from approximately 20–30 to 50 Jm−2ster−1μm−1 in both the LMI-N and LMI-S during nighttime. The footprint of the LMI Flashes is concentrated within 200–600 km2. The Flash-Group number is mostly less than five. The optical characteristics of the Groups and Events are similar to those of the Flashes. It is suggested that the performance of the LMI instrument is stable both in the LMI-N and LMI-S for the similar optical characteristics of LMI lightning in these FOV regions.
  • From the analysis of the spatial distribution of the LMI lightning, it was found that the Flash density is dominated by the middle and lower south of the Yangtze River, followed by the Pearl River Delta region. Lower values of the Flash density are found over western China and the northeast of China where the mean radiance per flash is higher than those in the other regions. The mean footprint of Flash and Group are greatest in the east of the TP and in the southwest and southeast of China. The Flash-Group number (and Group-Event number) shows a homologous distribution to the Flash footprint (and Group footprint).
  • From the analysis of the temporal variation features of the Flash, it was found that the Flash (as well as Group and Event) density in the PRD is significantly greater than those in the other three regions (TP, BTH, and YRD) from April to September. The peak Flash (as well as Group and Event) density in the PRD occurs in April. However, in the other three regions, the peak Flash density (as well as Group and Event) density occurs in July. The peak Flash (as well as Group and Event) density shows a significant decline from July to September. The mean radiance of the LMI Flash in the YRD and BJT fluctuates from April to September, while it increases in the PRD and decreases on the TP from April to September. The monthly variation characteristics are similar to those of the LLNC CG Event density. There was more LMI lightning during the nighttime than that during the daytime, indicating the higher detection efficiency of the LMI in the nighttime than in the daytime.
From this research, we can be confident that the LMI Level 2 products reflect the lightning activity in the LMI observation domain. The LMI Level 2 products are meaningful for monitoring lightning activity. In the following works, detailed evaluation of the LMI datasets will be further conducted by using the ground-based lightning location system with a highly accurate locating ability for both CG and IC lightning.

Author Contributions

Conceptualization, data curation, funding acquisition, methodology, resources, and software, D.C.; formal analysis, F.L.; investigation, X.Z.; funding acquisition and supervision, J.Y. All authors have read and agreed to the published version of the manuscript.

Funding

This work was funded by the “Key Program for International Science and Technology Innovation Cooperation Projects of China (2018YFE0101200)”, National Key Research and Development Program of China (2017YFB0502800), and Basic Research Fund of Key Laboratory of Middle Atmosphere and Global environment Observation (LAGEO) Institute of Atmospheric Physics, Chinese Academy of Sciences, (LAGEO-2018-03).

Acknowledgments

The authors wish to thank the NASA’s Global Hydrology Resource Center (GHRC) Distributed Active Archive Center (DAAC) for providing the ISS-LIS data. The data of ground-based LLNC are provided by the Meteorological Observation Centre, China Meteorological Administration. The FY-4A LMI data were provided by the National Satellite Meteorological Center, China Meteorological Administration.

Conflicts of Interest

The authors declare no conflict of interest.

References

  1. Goodman, S.J.; Blakeslee, R.J.; Koshak, W.J.; Mach, D.; Bailey, J.; Buechle, R.D.; Carey, L.; Schultz, C.; Bateman, E.M.M., Jr.; Stano, G. The GOES-R Geostationary Lightning Mapper (GLM). Atmos. Res. 2013, 125–126, 34–39. [Google Scholar] [CrossRef] [Green Version]
  2. Rudlosky, S.D.; Goodman, S.J.; Virts, K.S.; Bruning, E.C. Initial geostationary lightning mapper observations. Geophys. Res. Lett. 2019, 46, 1097–1104. [Google Scholar] [CrossRef]
  3. Yang, J.; Zhang, Z.Q.; Wei, C.Y.; Lu, F.; Guo, Q. Introducing the new generation of chinese geostationary weather satellites, Fengyun-4. Bull. Am. Meteorol. Soc. 2017, 90, 1637–1658. [Google Scholar] [CrossRef]
  4. Blakeslee, R.J. NRT Lightning Imaging Sensor (LIS) on International Space Station (ISS) Provisional Science Data; NASA Global Hydrology Resource Center DAAC: Huntsville, AL, USA, 2017.
  5. Blakeslee, R.; Koshak, W. LIS on ISS: Expanded global coverage and enhanced applications. Earth Obs. 2016, 28, 4–14. [Google Scholar]
  6. Peterson, M.; Liu, C. Characteristics of lightning flashes with exceptional illuminated areas, durations, and optical powers and surrounding storm properties in the tropics and inner subtropics. J. Geophys. Res. Atmos. 2013, 118, 11.727–11.740. [Google Scholar] [CrossRef]
  7. Beirle, S.; Koshak, W.; Blakeslee, R.; Wagner, T. Global patterns of lightning properties derived by OTD and LIS. Nat. Hazards Earth Syst. Sci. 2014, 14, 2715–2726. [Google Scholar] [CrossRef] [Green Version]
  8. Peterson, M.; Deierling, W.; Liu, C.; Mach, D.; Kalb, C. The properties of optical lightning flashes and the clouds they illuminate. J. Geophys. Res. Atmos. 2016, 122, 423–442. [Google Scholar] [CrossRef]
  9. Peterson, M.; Rudlosky, S.; Deierling, W. The evolution and structure of extreme optical lightning flashes. J. Geophys. Res. Atmos. 2017, 122, 13370–13386. [Google Scholar] [CrossRef]
  10. Chronis, T.; Koshak, W.J. Diurnal variation of TRMM/LIS lightning flash radiances. Am. Meteorol. Soc. 2017, 98, 1453–1470. [Google Scholar] [CrossRef]
  11. Peterson, M.; Rudlosky, S.; Zhang, D. Changes to the appearance of optical lightning flashes observed from space according to thunderstorm organization and structure. J. Geophys. Res. Atmos. 2020, 125, 4. [Google Scholar] [CrossRef]
  12. Zhang, D.; Cummins, K.L. Time evolution of satellite-based optical properties in lightning flashes, and its impact on GLM flash detection. J. Geophys. Res. Atmos. 2020, 125, 6. [Google Scholar] [CrossRef] [Green Version]
  13. Zhang, D.; Cummins, K.L.; Bitzer, P.M.; Koshak, W.J. Evaluation of the performance characteristics of the lightning imaging sensor. J. Atmos. Ocean. Technol. 2019, 36, 1015–1031. [Google Scholar] [CrossRef] [Green Version]
  14. Hui, W.; Zhang, W.; Lyu, W.; Li, P. Preliminary observations from the China Fengyun-4A lightning mapping imager and its optical radiation characteristics. Remote Sens. 2020, 12, 2622. [Google Scholar] [CrossRef]
  15. Chen, Z.; Qie, X.; Sun, J.; Xiao, X.; Zhang, Y.; Cao, D.; Yang, J. Evaluation of Fengyun-4A lightning mapping imager (LMI) performance during multiple convective episodes over Beijing. Remote Sens. 2021, 13, 1746. [Google Scholar] [CrossRef]
  16. Mach, D.M.; Christian, H.J.; Blakeslee, R.J.; Boccipio, D.J.; Goodman, S.J.; Boeck, W. Performance assessment of the optical transient detector and lightning imaging sensor. J. Geophys. Res. 2007, 112, D09210. [Google Scholar] [CrossRef]
  17. Cao, D.J.; Huang, F.X.; Qie, X.S. Development and Evaluation of Detection Algorithm for FY-4 Geostationary Lightning Imager (GLI) Measurement. In Proceedings of the XV Conference on Atmospheric Electricity, Norman, OK, USA, 15–20 June 2014. [Google Scholar]
  18. Cummins, K.L.; Murphy, M.J.; Bardo, E.A.; Hiscox, W.L.; Pyle, R.B.; Pifer, A.E. A combined TOA/MDF technology upgrade of the U.S. national lightning detection network. J. Geophys. Res. 1998, 103, 9035–9044. [Google Scholar] [CrossRef]
  19. Chen, L.; Zhang, Y.; Lu, W.; Zheng, D.; Zhang, Y.; Chen, S.; Huang, Z. Performance evaluation for lightning location system based on observation of artificially-triggered lightning and natural lightning flashes. J. Atmos. Ocean. Technol. 2012, 29, 1835–1844. [Google Scholar] [CrossRef]
  20. Chen, Z.; Sun, J.; Qie, X.; Zhang, Y.; Ying, Z.; Xiao, X.; Cao, D. A method to update model kinematic states by assimilating satellite-observed total lightning data to improve convective analysis and forecasting. J. Geophys. Res. Atmos. 2020, 125, e2020JD033330. [Google Scholar] [CrossRef]
  21. Cecil, D.J.; Buechler, D.E.; Blakeslee, R.J. TRMM LIS climatology of thunderstorm occurrence and conditional lightning flash rates. J. Clim. 2015, 28, 6536–6547. [Google Scholar] [CrossRef]
  22. Peterson, M.; Rudlosky, S. The time evolution of optical lightning flashes. J. Geophys. Res. Atmos. 2019, 124, 333–349. [Google Scholar] [CrossRef] [PubMed] [Green Version]
  23. Qie, X.; Wu, X.; Yuan, T.; Bian, J.; Lu, D. Comprehensive pattern of deep convective systems over the Tibetan Plateau–South Asian monsoon region based on TRMM Data. J. Clim. 2014, 27, 6612–6626. [Google Scholar] [CrossRef]
  24. Qie, X.; Zhang, T.; Chen, C.; Zhang, G.; Zhang, T.; Wei, W. The lower positive charge center and its effect on lightning discharges on the Tibetan Plateau. Geophys. Res. Lett. 2005, 32, L05814. [Google Scholar] [CrossRef] [Green Version]
  25. Li, Y.; Zhang, G.; Wang, Y.; Wu, B.; Li, J. Observation and analysis of electrical structure change and diversity in thunderstorms on the Qinghai-Tibet Plateau. Atmos. Res. 2017, 194, 130–141. [Google Scholar] [CrossRef]
  26. Qie, K.; Qix, X.; Yuan, T. Increasing trend of lightning activity in the South Asia region. Sci. Bull. 2021, 66, 78–84. [Google Scholar] [CrossRef]
  27. Qie, X.; Toumi, R.; Yuan, T. Lightning activities on the Tibetan Plateau as observed by the lightning imaging sensor. J. Geophys. Res. 2003, 108, 4551. [Google Scholar] [CrossRef]
Figure 1. The expected FOV coverage (the black solid line) of LMI together with the annual Event density (in units of number of flashes grid−1year−1) distribution based on the FY-4A LMI dataset and ISS-LIS dataset during 2018–2020. (a) FY-4A LMI and (b) ISS-LIS. The LMI data have been selected by using similar time frames limited by the temporal coverage of the ISS data in order to assess the differences in the performance of both sensors. The FOV of LMI in Australia is from January to March and October to December during 2018–2020 (LMI-South, LMI-S). The FOV of LMI in China is from April to September during 2018–2020 (LMI-North, LMI-N).
Remotesensing 13 03013 g001
Figure 2. Spatial distribution of lightning density observed by FY-4A LMI and LLN Cin July 2019. (a) LMI Flash, (b) LMI Group, (c) LMI Event, and (d) LLNC CG Event.
Remotesensing 13 03013 g002
Figure 3. Spatial distribution of lightning radiance observed by the FY-4A LMI and peak current of LLNC CG Event in July 2019. (a) LMI Flash, (b) LMI Group, (c) LMI Event, and (d) LLNC CG Event. The current polarity is not taken into consideration.
Remotesensing 13 03013 g003
Figure 4. Optical characteristics of the LMI Flash during daytime and nighttime. (a) Radiance, (b) Duration, (c) Footprint, and (d) Flash-Group number.
Remotesensing 13 03013 g004
Figure 5. Optical characteristics of the LMI Group and Event in the LMI-N and the LMI-S during daytime and nighttime. (a) Group Radiance, (b) Group Footprint, (c) Group-Event (each Group consists of Event) number, and (d) Event Radiance.
Remotesensing 13 03013 g005
Figure 6. Spatial distribution features of LMI Flash during daytime and nighttime. (a,b) LMI Flash density, (c,d) Radiance, (e,f) Duration, (g,h) Footprint, and (i,j) Flash-Group number. Four regions are compared: (1) TibetanPlateau (26–35°N, 78–100°E); (2) Beijing-Tianjin-Hebei region (36–42°N, 113–119°E); (3) Yangtze River Delta region (26–35°N, 117–122°E); and (4) Pearl River Delta region (21–28°N, 113–11°E). Figures (a,c,e,g,i) show the LMI Flash during daytime, while figures (b,d,f,h,j) show the LMI Flash during nighttime.
Remotesensing 13 03013 g006aRemotesensing 13 03013 g006b
Figure 7. Spatial distribution features of LMI Group. (a) LMI Group density, (b) Group Radiance, (c) Footprint, and (d) Event number.
Remotesensing 13 03013 g007aRemotesensing 13 03013 g007b
Figure 8. Spatial distribution features of the LMI Event. (a) The LMI Event density and (b) the LMI Event Radiance.
Remotesensing 13 03013 g008
Figure 9. Temporal variation in the LMI Flashes in four typical regions in China. (a) Flash density, (b) Radiance, (c) Duration, (d) Footprint, and (e) Flash-Groups number. The bar chart indicates daily variation, and the line chart indicates monthly variation.
Remotesensing 13 03013 g009aRemotesensing 13 03013 g009b
Figure 10. Temporal variation in the LMI Group and the LLNC lightning in China. (a) LMI Group density, (b) Radiance, (c) Footprint, (d) Group-Event number, (e) LLNC CG Event density, and (f) LLNC lightning current. The bar chart indicates the daily variation, while the line chart indicates the monthly variation.
Remotesensing 13 03013 g010aRemotesensing 13 03013 g010b
Figure 11. Daily and monthly variations in the LMI Event in China. (a) LMI Event density and (b) LMI Event radiance.
Remotesensing 13 03013 g011
Figure 12. Hourly variation in the LMI Flashes, Groups, and Events, and the LLNC flashes in China. (a) Flash, (b) Group, (c) Event, and (d) LLNC CG Event. The time is UTC (Coordinated Universal Time).
Remotesensing 13 03013 g012
Table 1. Mean LMI lightning properties during 2018–2020.
Region
(Sensor)
Flash
Number
Groups
Per
Flash
Events
Per
Flash
Duration Per FlashRadiances
Per
Flash
Radiances
Per
Group
Group NumberEvent Number
LMI-N6539310219 (ms)875
(Jm−2ster−1μm−1)
220
(Jm−2ster−1μm−1)
24,73869,289
LMI-S1660310224 (ms)692
(Jm−2ster−1μm−1)
169
(Jm−2ster−1μm−1)
653817,570
LIS-N199571038306 (ms)574,230
(Jm−2ster−1μm−1)
47,520
(Jm−2ster−1μm−1)
203,131759,145
LIS-S50961141320 (ms)611,790
(Jm−2ster−1μm−1)
49,217
(Jm−2ster−1μm−1)
56,493209,149
Note: The LMI data have been selected by using similar time frames limited by the temporal coverage of the ISS data.
Table 2. The LMI and LLNC dataset used in this test.
DateLMI Event NumberLMI Group
Number
LMI Flash
Number
LLNCCG Event
Number
1 July–30 July 20192,993,988952,951240,214765,935
Publisher’s Note: MDPI stays neutral with regard to jurisdictional claims in published maps and institutional affiliations.

