Abstract
Apple (Malus domestica Borkh. cv. “Fuji”), an important cash crop, is widely consumed around the world. Accurately predicting preharvest apple fruit yields is critical for planting policy making and agricultural management. This study attempted to explore an effective approach for predicting apple fruit yields based on time-series remote sensing data. In this study, time-series vegetation indices (VIs) were derived from Planet images and analyzed to further construct an accumulated VI ()-based random forest () model and a Carnegie–Ames–Stanford approach (CASA) model for predicting apple fruit yields. The results showed that (1) was the optimal predictor to construct an RF model for apple fruit yield, and the R2, RMSE, and RPD values of the model reached 0.71, 16.40 kg/tree, and 1.83, respectively. (2) The maximum light use efficiency was determined to be 0.499 g C/MJ, and the CASASR model (R2 = 0.57, RMSE = 19.61 kg/tree, and RPD = 1.53) performed better than the CASANDVI model and the CASAAverage model (R2, RMSE, and RPD = 0.56, 24.47 kg/tree, 1.22 and 0.57, 20.82 kg/tree, 1.44, respectively). (3) This study compared the yield prediction accuracies obtained by the models using the same dataset, and the model (RPD = 1.83) showed a better performance in predicting apple fruit yields than the CASASR model (RPD = 1.53). The results obtained from this study indicated the potential of the model based on time-series Planet images to accurately predict apple fruit yields. The models could provide spatial and quantitative information of apple fruit yield, which would be valuable for agronomists to predict regional apple production to inform and develop national planting policies, agricultural management, and export strategies.
Keywords:
apple fruit; yield prediction; remote sensing; planet; time series; ∑NDVI; random forest; CASA 1. Introduction
Apple (Malus domestica Borkh.), an important cash crop, is widely consumed around the world [1]. As the leading apple-producing area, China has taken a supervisory position in the world apple industry [2]. By 2018, China controlled 46% of the apple production and 42% of the apple planting area worldwide, with annual production and planting areas of approximately 39.24 million tons and 2.07 million ha, respectively [3]. Given the importance of apple fruit production to the economy of China, predicting apple yields before harvest is essential to inform and develop national planting policies, agricultural management, and export strategies.
At present, apple fruit yield predictions mainly rely on fruit or flower counting by machine vision technology [4,5,6,7]. The image data are obtained from ground platforms, such as smartphones [8] and robots [9], and are difficult to apply at the regional scale. Furthermore, the occlusion of flowers or fruits by branches and leaves and variations in illumination conditions have been identified as sources of error in the current techniques [10]. Satellite and aerial remote sensing (RS) platforms present a rapid and large-scale alternative to the regional apple fruit yield predict [11].
Yield predictions performed using remotely sensed data are mainly divided into statistical and mechanistic models [12,13,14,15]. Many studies have developed statistical models by using vegetation indices to make fruit tree yield predictions, such as for avocado, mango, peach, and citrus trees [16,17,18,19,20]. However, these studies were mainly carried out at single phenology stages, and the relationships between vegetation indices (VIs) and fruit yield vary throughout the growing season, so we cannot obtain comprehensive information on crop growth using these methods [21]. Recently, an increasing number of studies have predicted the yield of field crops using time-series RS data collected from a moderate-resolution imaging spectroradiometer (MODIS) and HuanJing (HJ) [13,15,22,23,24] because of the high temporal resolution of these data. Furthermore, some studies have demonstrated that the correlations between the feature values of VI time series and yields vary strongly, especially the accumulated VI values () [24,25,26]. Wang et al. [26] proposed that the accumulated values of VIs from the jointing stage to the initial filling stage performed better than the VIs recorded at a single period did. Son et al. [15] used the accumulated values of the normalized difference vegetation index () to construct a rice yield prediction model. However, the spatial resolutions of MODIS (250 m) and HJ (30 m) data are relatively low [27]. Fruit trees are different from field crops, and fruit yields are extremely variable among trees; thus, RS data with a higher spatial resolution are required to reflect the yield differences among apple trees [18]. Previous research predicted the fruit yield using multispectral image data with about 2 m spatial resolution, such as ASTER (2 m) and Worldview (1.2–1.84 m) [16,28]. Planet images with both a relatively high spatial resolution (3 m) and short repeat period (1 day) have great potential for predicting apple fruit yield [29]. Regarding the usage of modeling methods, various machine-learning (ML) methods have been applied in developing remote sensing-based yield prediction models, such as random forest (RF) models, support-vector machines (SVM), and artificial neural networks (ANNs) [15,18]. Many studies have reported that machine-learning approaches (MLs) can provide reasonable predictions faster and with higher flexibility than conventional modeling approaches [30,31,32]. Therefore, using accumulated VI values derived from time-series Planet imagery to construct a machine-learning model could improve the accuracy of apple fruit yield predictions.
A mechanistic model was developed to simulate crop growth on the basis of underlying processes, such as phenological development, light use, carbon dioxide assimilation, transpiration, and respiration, and to further predict crop yield [33,34]. Bai et al. used the Subplex algorithm to assimilate RS data into the improved World Food Studies (WOFOST) model to improve the prediction accuracy for jujube yield at the field scale [12]. However, because of numerous complicated parameters in conventional mechanistic models, these models are difficult to use in practice. As a mechanistic model, the Carnegie–Ames–Stanford approach (CASA) model was originally developed to estimate global net primary production (NPP) with the advantages of a simple structure, few complicated parameters, easy access, and strong applicability [35]. In recent years, the CASA model was also used to predict crop yields on regional scales. Du et al. [36] established the CASA model using time-series VIs to estimate the biomass of winter wheat in different growth stages. Wang et al. [13] optimized the maximum light use efficiency and calculated FPAR to predict wheat yield. However, previous research has focused on wheat yield predictions. For apple fruit yield predictions, the parameters and calculations of the CASA model need to be optimized. Therefore, this study aimed to optimize the CASA model parameters and calculations to predict apple fruit yield.
To address these issues, this study derives and analyses time-series VIs from Planet images and further develops an accumulated VI-based model and an improved CASA model to explore an effective approach for predicting apple fruit yields based on time-series RS data. The objectives of this study were to (1) identify the optimal VI with which to construct an apple yield prediction model based on accumulated VI values and phenological information; (2) optimize the parameters of the CASA model for apple fruit yield predictions to improve the prediction accuracy; (3) compare the yield prediction performances of the accumulated VI-based model and the improved CASA model.
2. Materials and Methods
2.1. Study Region Experimental Design
As the main apple production area in China, Shandong Province was selected as the study region. The study was conducted in six apple orchards in Guanli town, Qixia city, Shandong Province (120.62°E–120.76°E, 37.14°N–37.27°N) in the 2019 and 2020 apple growing seasons. As the main planting variety, “Red Fuji” apple trees (Malus domestica Borkh. cv. “Fuji”) were used as the experimental material. Four apple orchards (O1–O4) in 2019 and orchards O1 and O2 as well as two additional orchards (O5 and O6) in 2020 were selected for experiments and the sampling validation (Figure 1).
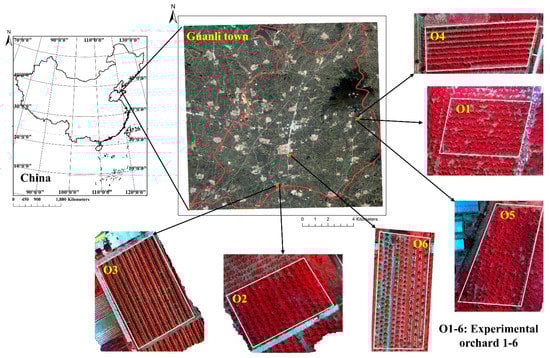
Figure 1.
Study region and experimental orchards. The images of experimental orchard 1–6 were captured by an unmanned aerial vehicle in late May and displayed in false color.
The first flowering occurrences of the studied apple trees were observed on April 17 and April 12 in 2019 and 2020, respectively. In Guanli town, harvest commences in early October depending on the fruit maturity and continues until November. Field practices included postharvest pruning in winter or early spring, three fertilizer applications (nitrogen fertilizer in April, phosphate fertilizer in June, potash fertilizer in August), monthly irrigation, and weeding (Figure 2).
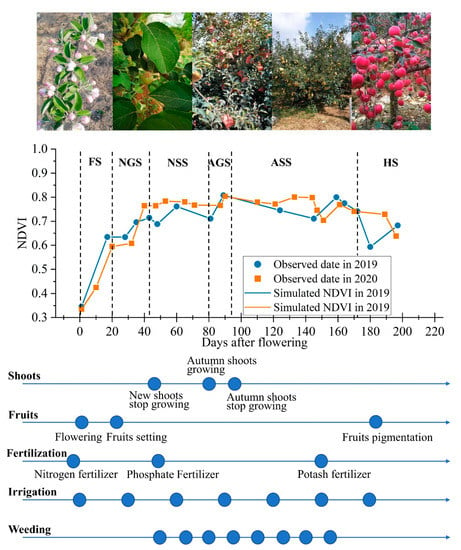
Figure 2.
Time-series NDVI curves and corresponding features of apple growth and development, the main apple management measures. The blue dots represent the key features of apple growth and the main site practices. The FS, NGS, NSS, AGS, ASS, and HS represent the flowering stage, the new-shoot-growing stage, the new-shoot-stop-growing stage, the autumn shoot-growing stage, the autumn shoot-stop-growing stage, and the harvest stage, respectively.
2.2. Data Acquisition
2.2.1. Field Measurements
Forty-seven and 57 apple trees in the full fruit period were randomly selected in 2019 and 2020, respectively. Among them, nineteen selected apple trees were the same for both 2019 and 2020. The geographical coordinates of the sampled trees were collected using a Qianxun positioning SR2 satellite-based RTK receiver mobile device with a centimeter-level positioning accuracy (Qianxun Spatial Intelligence Inc., Hangzhou, China). All fruits were counted on each sampled tree to calculate the total number of fruits per tree. In the apple harvest season, 8 healthy and regularly shaped fruits were collected and weighed from each sampled tree to calculate the mean fruit weight for each sampled tree. The apple yield (kg/tree) was calculated using the total number of fruits per tree and the mean fruit weight (kg).
2.2.2. Planet Imagery Data
For this work, two years (2019 and 2020) of multispectral data from the Planet Labs constellation (www.planet.com, accessed on 15 November 2020) were used. The PlanetScope constellation has approximately 170 small satellites intended to image the Earth’s land surface daily. The sensor-corrected, radiation-corrected, and orthorectified data product (PS Analytic Ortho Scene Level 3B) was used in this study. The PS imagery was captured as continuous strips for 4 bands: blue (455–515 nm), green (500–590 nm), red (590–670 nm), and NIR (780–860 nm) bands at a ground spatial resolution of 3 m. For the 2019 apple growing season, 17 PS images were acquired, while an additional 21 PS images were acquired at corresponding times during the 2020 apple growing seasons. The top-of-atmosphere reflectance was converted to surface reflectance using a quick atmospheric correction model in ENVI 5.3.
2.2.3. Meteorological Data
The meteorological data used in this study included daily mean temperature and downwards surface solar radiation data; these data were downloaded from the “Daily statistics calculated from ERA5 single levels hourly data” dataset obtained from the European Centre for Medium-Range Weather Forecasts (ECMWF) (www.ecmwf.int, accessed on 15 November 2020). In this study, 172 days of data were collected from the first flowering stage to the harvest stage (Figure 3).
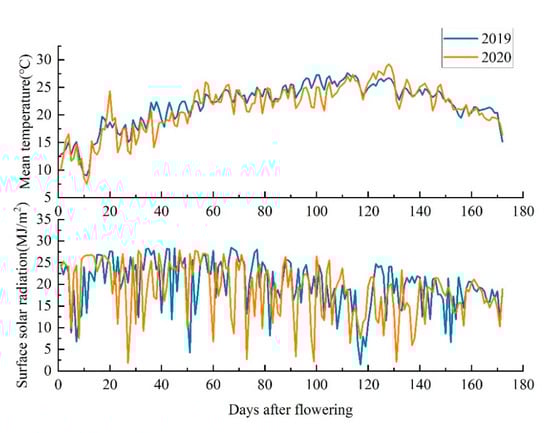
Figure 3.
Daily mean temperature and surface solar radiation.
2.3. Time Series Vegetation Indices
From the time-series Planet imagery data, 6 VIs specific to fruit tree biomass and yield parameters were selected to predict apple yields (Table 1). The vegetation indices were derived from the pixel on the center of the tree crown, and when the center of the tree crown located at the edge of the pixel, the mean value of adjacent pixels was taken as the vegetation indices of selected apple trees. Simulated daily ratio vegetation index (SR), differential vegetation index (DVI), normalized difference vegetation index (NDVI), soil-adjusted vegetation index (SAVI), renormalized difference vegetation index (RDVI), and enhanced vegetation index (EVI) values were calculated by the linear interpolation approach to define the shapes and amplitudes of the VI curves.

Table 1.
Equations of vegetation indices.
2.4. Yield Prediction Models Based on Phenological Information and Accumulated VIs
2.4.1. Phenological Information Extraction
Previous studies have shown that NDVI is sensitive for detecting plant phenological signals [13,42]. Therefore, this study selected an NDVI time series to extract the phenological stages of apple trees. The NDVI curve was consistent with the ground observations of the apple growth and management measures, assisting in the definition of the phenological stages. The start day of flowering stages was identified by site observation. Other phenological stages were identified by time-series NDVI data and validated by ground observation. The apple growth and development features, the main apple management measures, and the corresponding NDVI curves are shown in Figure 2. The flowering stage (FS), the new-shoot-growing stage (NGS), the new-shoot-stop-growing stage (NSS), the autumn shoot-growing stage (AGS), the autumn shoot-stop-growing stage (ASS), and the harvest stage (HS) were extracted. In order to accurately describe phenological changes, satellite observation was more frequent in FS to AGS stages (growing vigorously) than that in ASS and HS stages. Because the NDVI curve at the HS was affected by human activities, such as reflective mulching films and the removal of leaves, this study focused on the first five phenological stages.
2.4.2. Yield Prediction Model Based on Accumulated VIs
To improve the correlation between the RS data and the apple fruit yield [26], the cumulative VI () values at different phenology stages were calculated; the accumulation area was defined as the enclosed area of the zone by the phenological stage and the curve of the VI measured the day after flowering (Equation (1)). Then, an apple fruit yield prediction model based on the random forest algorithm (RF) was constructed by the values at different phenology stages (Equation (2)). As an ensemble learning approach, RF has a faster training speed and a stronger generalization ability than other statistical approaches [43]. It has been reported to perform more accurately for crop yield predictions than other statistical methods in recent studies [30,31,32].
2.5. Yield Predictions Based on the CASA Model
2.5.1. Improvement of the CASA Model
Due to the relationship between apple fruit yield and the accumulation of dry matter in fruit, this study used the Carnegie–Ames–Stanford approach (CASA) model to calculate the accumulation of net primary productivity (NPP). Then, we calculated the apple fruit yield based on the accumulation of NPP (Equation (3)). Due to the differences in the light absorption and utilization abilities of different crops, this study optimized the parameters and calculations of the CASA model. The detail contents are as follows.
where is the apple fruit yield (kg/tree), is the cumulative NPP over the entire apple tree growing season (g C/tree), is the harvest index of 0.7, is the carbon content of 47.5%, and is the water content of apple fruit, which is 84%. The NPP can be calculated as follows:
The CASA model estimated the NPP using the absorbed photosynthetically active radiation (APAR) and light use efficiency () (Equation (4)):
where is the absorbed photosynthetically active radiation (MJ/tree), and ε is the light use efficiency (g C/MJ).
2.5.2. Determination of Absorbed Photosynthetically Active Radiation
The APAR is related to two factors: photosynthetically active radiation (PAR) and the fraction of absorbed photosynthetically active radiation (FPAR). APAR was calculated as follows:
where is the photosynthetically active radiation (MJ/tree), and is the fraction of absorbed photosynthetically active radiation. PAR was calculated as follows:
PAR (0.4–0.7 μm) is the fraction of the shortwave solar radiation (0.3−3.0 μm) that is absorbed by chlorophyll for photosynthesis in plants and is, thus, a fraction (0.48 in the present study) of the incoming solar radiation. APAR was calculated as follows:
where is the surface solar radiation (MJ/m2), is the ratio of photosynthetically active radiation to the surface solar radiation, and is the planting density (tree/ha).
The SR or NDVI values obtained by linear functions are often used to estimate FPAR, and here, FPAR was calculated in three ways (Equations (7)–(9)). FPAR was calculated as follows:
where and and and represent the 5th and 95th percentiles of and , respectively, for the apple trees analyzed in this study. and were computed for every single date. The and values were defined as 0.01 and 0.95, respectively.
2.5.3. Determination of Light Use Efficiency
The light use efficiency was calculated using the maximum light use efficiency () and environmental stress factors (Equation (10)):
is the typical light use efficiency when the environmental conditions are optimal. Through repeated analysis and comparisons, was determined to be 0.499 g C/MJ in this study. Because of sufficient irrigation in the experimental orchards, the effects of water stress factors were not considered in this study. The temperature stress factors were calculated by Equations (11) and (12), as follows:
where is the maximum light use efficiency (MJ/tree), and are scalars representing temperature stress factors that reduce light use efficiency under unfavorable conditions (°C), is the mean air temperature during the month of maximum NDVI development (°C), and is the mean daily air temperature (°C).
2.6. Accuracy Evaluation
The sample trees were divided into two groups by the equidistant sampling method in 2019 and 2020 [44]; one group contained 78 samples as the calibration set, and the other group contained 26 samples as the independent validation set. The coefficient of determination (R2), root mean square error (RMSE), and residual predictive deviation (RPD) were calculated and used to evaluate the accuracies of the models (Equations (13)–(16)) [45]. Higher values indicate that a model is more stable, and lower and higher values indicated great model accuracy. Among them, models were classified in terms of as follows: 1.0 < < 1.4 = “poor”, 1.4 < < 1.8 = “general”, 1.8 < < 2.0 = “good”, 2.0 < < 2.5 = “very good” [46].
2.7. Yield Mapping
To obtain the spatial and quantitative information of apple fruit yield, this study predicts the apple fruit yield at a regional scale. Apple orchards are the main land type in Guanli town, so this study extracted the apple planting area using visual interpretation methods. In this study, the model with the best prediction accuracy was used to predict regional apple fruit yield in MATLAB software (MathWorks, Inc., Natick, MA, USA); the yield maps for the two years of study were produced using ArcGIS software (ESRI Inc., West Redlands, CA, USA).
3. Results
3.1. Statistical Results of Fruit Yield
The statistical indices of apple fruit yield, including the maximum (Max), minimum (Min), average (Avg), standard deviation (SD), and coefficient of variation (CV), are shown in Table 2. The highest, lowest, and average apple fruit yields of the sampled trees in 2019 were 125.13, 8.62, and 49.80 kg/tree, respectively, and the corresponding values of the sampled trees in 2020 were 115.60, 7.29, and 53.01 kg/tree, respectively. The CVs of the apple fruit yields of sampled trees in 2019 and 2020 were all over 50% (57% and 54%, respectively). These results indicated that apple fruit yields are extremely variable among trees.
Table 2.
Statistical indices of apple fruit yield.
3.2. Yield Prediction Based on
3.2.1. Correlation Analysis between Apple Fruit Yield and
The trends of six VIs and for apple trees during the whole growing period are shown in Figure 4. The VIs generally increased in the FS, NGS, and AGS and remained stable or slightly decreased in the NSS and ASS; this trend was consistent with the apple growth and development regulations. These results showed that VIs are sensitive to apple growth. Because the mainly depended on the VIs and the lengths of the phenological stages, the values were higher in NSS than the corresponding values in other stages. The correlation coefficients (r) between the apple fruit yield and were calculated and are shown in Table 3. and produced better correlations for the total growth stage, with r values of 0.74 and 0.73, respectively. When each phenological stage was analyzed separately, the highest r value obtained was different. In FS, and were identified as the VIs with the highest correlations (r = 0.60). NDVI showed the highest correlation in AGS and ASS (r = 0.47 and 0.78, respectively), and SR produced the highest correlation in NGS and NSS (r = 0.67 and 0.66, respectively). Overall, and were sensitive to the apple fruit yields.
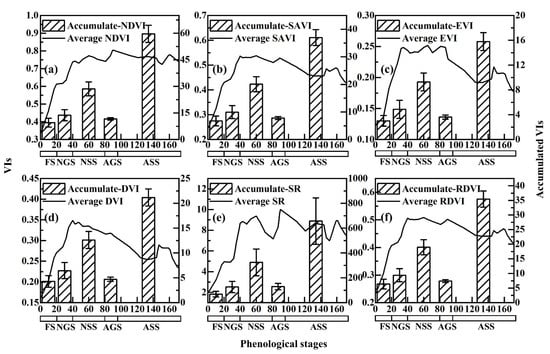
Figure 4.
The trends of six VIs and for apple trees during the whole growth period: (a) NDVI, (b) SAVI, (c) EVI, (d) DVI, (e) SR, and (f) RDVI.
Table 3.
Correlation analysis between yield and at different phenological stages.
3.2.2. Calibration Results of the Yield Prediction Model Based on Different
The at FS, NGS, NSS, AGS, and ASS were combined to predict the apple fruit yield based on the random forest algorithm (Figure 5). For the calibration results, the R2 values of the six models were all above 0.8. Among them, the model achieved the best calibration results (R2 = 0.84, RMSE = 11.62 kg/tree, and RPD = 2.42). The R2, RMSE and RPD of the model reached 0.82, 12.12 kg/tree, and 2.32, respectively. This result showed that the random forest algorithm has a good fitting ability. The differences in calibration accuracies among different models were small.
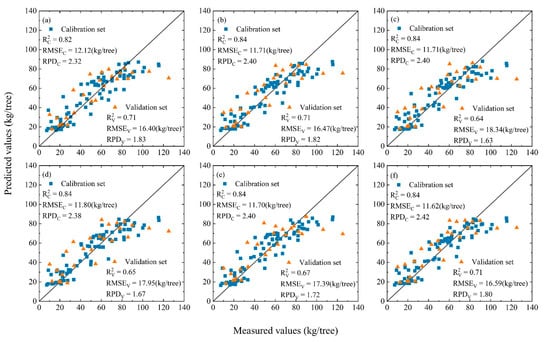
Figure 5.
Calibration and validation results of the yield prediction model based on : (a) the model, (b) the model, (c) the model, (d) the model, (e) the model, and (f) the model.
3.2.3. Validation Results of the Yield Prediction Model Based on Different Values
The validation set was used to validate the models (Figure 5). The , , and models reached the highest coefficients of determination (R2 = 0.71). Moreover, the RMSE and RPD values of the , , and models reached 16.40, 16.47, 16.59 kg/tree and 1.83, 1.82, 1.80, respectively; these values were better than the corresponding values of the , , and models (RMSE = 18.34, 17.95, 17.39 kg/tree and RPD = 1.63, 1.67, 1.72, respectively). The RPDs of the , , and models were all above 1.8, indicating that the models had good performances and could be used to predict apple fruit yield. Among them, the model reached the highest validation accuracy (R2 = 0.71, RMSE = 16.40 kg/tree and RPD = 1.83). This study selected the model for a comparison with the CASA model.
3.3. Yield Prediction Based on CASA Model
3.3.1. Net Primary Production Estimation
Fruit tree growth and meteorological conditions directly affect the formation of NPP. Figure 6 shows the mean daily NPP of apple trees in the study area as a function of time over the entire growing season. The results showed that the daily NPP generally increased first, then decreased, and remained stable after 90 days. The NPP estimated based on FPARNDVI was higher than the corresponding values based on FPARSR. These results may cause the FPARNDVI-based model to overpredict apple fruit yield.
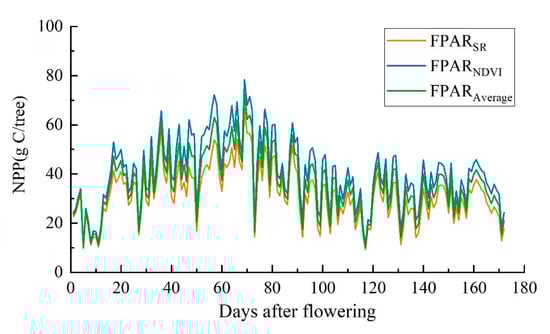
Figure 6.
Mean apple tree NPP for the entire growing season.
3.3.2. Calibration Results of the CASA Model
The CASASR, CASANDVI, and CASAAverage models were developed by FPARSR, FPARNDVI, and FPARAverage, respectively, to predict apple fruit yields (Figure 7). According to the calibration results, the best performance was produced by the CASASR model (R2 = 0.57, RMSE = 18.95 kg/tree, and RPD = 1.51), followed by the CASAAverage model (R2 = 0.57, RMSE = 19.95, and RPD = 1.43), and finally, the CASANDVI model (R2 = 0.55, RMSE = 23.29, and RPD = 1.23). The values predicted by the CASANDVI model were overvalued compared to the actual values.
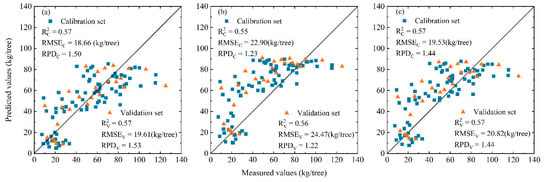
Figure 7.
Calibration and validation results of apple yield obtained by the CASA model: (a) CASASR model, (b) CASANDVI model, and (c) CASAAverage model.
3.3.3. Validation Results of the CASA Model
The validation set was used to validate the models (Figure 7). The CASASR model (R2 = 0.57, RMSE = 19.61 kg/tree, and RPD = 1.53) predicted apple fruit yield better than the CASANDVI model (R2 = 0.56, RMSE = 24.47 kg/tree, and RPD = 1.22) and the CASAAverage model (R2 = 0.57, RMSE = 20.82 kg/tree, and RPD = 1.44); these results were consistent with the calibration results. Because the CASANDVI and CASAAverage models did not improve the accuracy of apple fruit yield predictions, this study selected the CASASR model for a comparison with the machine-learning model.
3.4. Comparison of the Model and CASASR Model
To ensure the consistency of the models, the validation set was used to analyze the performances of the model and the CASASR model (Figure 8). The R2 and RMSE values of the model reached 0.71 and 16.40 kg/tree, respectively; these values were better than the corresponding values of the CASASR model (R2 = 0.56 and RMSE = 19.90 kg/tree). The RPDs of the model were above 1.8, indicating that the model displayed good performance in predicting apple fruit yield. The RPD of the CASASR model only reached 1.50, indicating that the model had a general performance in predicting apple fruit yield. These results indicated that the accuracy of the model was higher than that of the CASASR model when predicting apple fruit yield.
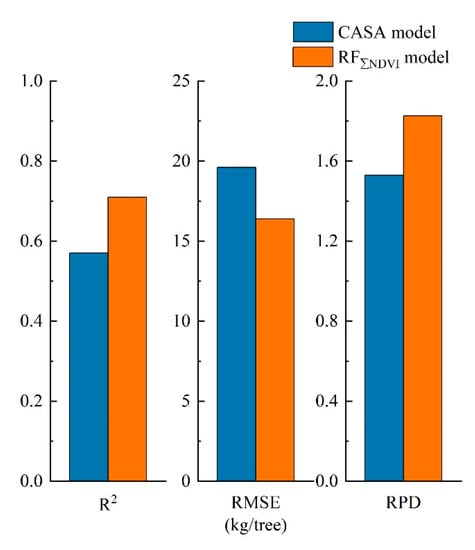
Figure 8.
Accuracy comparison of the results obtained by the model and the CASASR model.
3.5. Yield Map
Apple orchards are the main land type in Guanli town, so this study extracted the apple planting area using visual interpretation methods. Using the model, the apple fruit yield was predicted at the regional scale. The yield maps of Guanli town in 2019 and 2020 are shown in Figure 9.
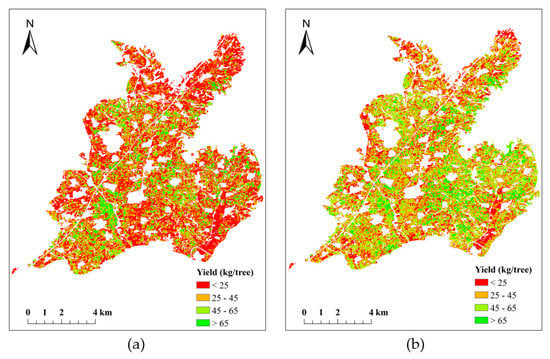
Figure 9.
Classified yield maps derived from the model for Guanli town in (a) 2019 and (b) 2020.
4. Discussion
4.1. The Machine-Learning Model for Apple Yield Prediction
At present, the ability to rapidly predict crop yields over large scales based on RS data is an area of active research. There are wide applications for field crop yield predictions, such as those of wheat, barley, potato, maize, and soybean [15,25,47,48,49]. However, there are few reports describing fruit tree yield predictions based on time-series RS data. The results obtained from this study indicate the potential of using time-series multispectral images to accurately predict apple fruit yields across multiple apple growing seasons and orchards.
As an effective method for monitoring crop growth, vegetation indices show strong correlations with fruit yield and greatly influence apple fruit predictions [16,17,18]. and consistently produced the strongest relationships with apple fruit yield in this study. Vegetation indices have been identified as being highly sensitive to the canopy chlorophyll content; chlorophyll is a plant constituent that is essential for fruit growth and development in apple trees [11,43]. Apple canopies with low vegetation index values may have low photosynthesis rates and, further, low organic matter accumulations [50,51]. Therefore, it follows that the measured in the apple growing season can be used to assess crop yields. The NDVI has been widely used for phenological characterizations because it is simple to calculate and sensitive to phenological changes [52,53]. In this study, the phenological stages of apple trees were extracted by NDVI because of the sensitivity of this VI to the growth stage. Some studies have demonstrated that the correlations between VIs and yield differ among different phenological stages [14,54]. In this study, the of the autumn shoot-stop-growing stage had the highest correlations with the apple fruit yield. Previously published results have indicated that later growing stages could provide higher prediction accuracies when RS data are used to predict fruit yields [16,18,27]; this is consistent with the results obtained from this study. These results may be caused by fruit growth competing for nutrition with new shoots [1]. The autumn shoot-stop-growing stage represents the peak of fruit growth in an apple tree, and dry matter mainly accumulates in fruit; this dry matter can reflect the yield potential well [55]. Therefore, using a combination of measured at different phenological stages is very important for accurately predicting apple fruit yields. These results showed that the model reached the highest yield prediction results and could be used to predict apple fruit yields.
4.2. The CASA Model for Apple Yield Prediction
Using RS time series and meteorological data, apple fruit yields were also predicted by the CASASR model. A previous study demonstrated that the parameters of the CASA model were often affected by several factors, such as the vegetation type, geographical location, and environmental conditions [13,35,36,56,57]. Therefore, this study optimized the parameters of the CASA model to improve its apple fruit yield prediction accuracy. The original CASA model only established a linear relationship between FPAR and SR [13,35]. The SR values become saturated, and noise contributes proportionally to the errors in the FPAR calculation and ultimately to the apple fruit yield predictions [13,58]. Although this study tried to combine NDVI and SR to improve the yield prediction accuracy [58,59], the results of the yield predictions suggested that FPARNDVI was not helpful for improving the prediction accuracy when compared to FPARSR. Light use efficiency was the primary controlling factor in the CASA model for predicting crop yields [56,60,61]. In this study, the light use efficiency was calculated using the maximum light use efficiency and environmental stress factors. The maximum light use efficiency of the original CASA model was assigned a value of 0.389 g C/MJ [35]. However, many studies have demonstrated that the maximum light use efficiency displays large differences among vegetation types and environmental conditions [56,57,60]. Zhu et al. [58] proposed that the maximum light use efficiency values ranged from 0.159 to 2.553 g C/MJ for woody vegetation in China. Clearly, the maximum light use efficiency must be adequately estimated when using the CASA model to predict yields [56]. Through repeated analyses and comparisons, the maximum light use efficiency of apple trees was determined to be 0.499 g C/MJ in this study. The environmental stress factors in the original CASA model are mainly divided into temperature and water stress factors [13,36]. Among them, water stress factors represent a physiological reduction in light use efficiency under drought conditions; drought conditions were calculated in this study using the precipitation time series [36]. Because of sufficient irrigation in apple orchards, the effects of the water stress factors were not considered in this study.
4.3. Application Prospect of Apple Fruit Yield Predictions
The results obtained from the accuracy comparison of apple fruit yield predictions indicated that the model performed better than the CASASR model. These results may have been caused by the relationships between vegetation indices and the apple fruit yield tending to be nonlinear [16,17]. As a machine-learning-based model, the model has a stronger ability to fit nonlinear data than the CASASR model. Therefore, the model can be applied to predict apple fruit yields on a regional level. However, in large-scale apple fruit yield predictions, the meteorological impacts may be more noticeable [62,63], and the relationships between the yield and VIs may be different. The CASASR model may perform better in large-scale apple fruit yield predictions, especially in extreme growing seasons. In addition, extreme weather, such as frost injury, and poor management also affect apple fruit yields. Modifying the model to consider these effects still requires further research. This study only compared the prediction accuracies between the model and the CASASR model in the Guanli town of Shandong, China. Further research will determine the performances of the model and the CASASR model in large-scale apple fruit yield predictions.
To predict the yield for other species, the model should be modified according to the agronomic characteristics of the species. The model needs to be modified according to the difference in phenological stages between species. The parameters of CASASR model could be adjusted to accommodate different species, including maximum light use efficiency, harvest index, and water content of apple fruit. The performances of the two models applied with other species still needs further study.
5. Conclusions
This study developed two kinds of models using time-series VIs, the model and the CASASR model, to predict apple fruit yields, to explore effective approaches, and to predict regional apple fruit yield. The results showed that (1) was the optimal predictor to construct RF model for apple fruit yield, and the R2, RMSE, and RPD values of the model reached 0.71, 16.40 kg/tree, and 1.83, respectively. (2) The maximum light use efficiency was determined to be 0.499 g C/MJ, and the CASASR model (R2 = 0.57, RMSE = 19.61 kg/tree, and RPD = 1.53) performed better than the CASANDVI model and the CASAAverage model (R2, RMSE, and RPD = 0.56, 24.47 kg/tree, 1.22 and 0.57, 20.82 kg/tree, 1.44, respectively). (3) This study compared the yield prediction accuracies obtained by the models using the same dataset, and the model (RPD = 1.83) showed a better performance in predicting apple fruit yields than the CASASR model (RPD = 1.53). The results obtained from this study indicated the potential of the model based on time-series Planet images to accurately predict apple fruit yields. The models could provide spatial and quantitative information of apple fruit yield, which would be valuable for agronomists to predict regional apple production to inform and develop national planting policies, agricultural management, and export strategies.
Author Contributions
Conceptualization, X.B., Z.L. and X.Z.; methodology, X.B. and Z.L.; formal analysis, X.B., M.L., W.L., S.W. and H.C.; writing—original draft preparation, X.B.; writing—review and editing, X.B., Y.Z., X.Z. and Z.L.; visualization, X.B., Z.L., X.Z. and S.W.; supervision, Y.J. and G.Y. All authors have read and agreed to the published version of the manuscript.
Funding
This research was funded by the National Key Research and Development Program of China (2017YFE0122500); the National Natural Science Foundation of China (41671346); Shandong Major Scientific and Technological Innovation Project (2018CXGC0209); the Taishan Scholar Assistance Program from Shandong Provincial Government, Funds of Shandong “Double Tops” Program (SYL2017XTTD02).
Institutional Review Board Statement
Not applicable.
Informed Consent Statement
Not applicable.
Data Availability Statement
Data available on request.
Conflicts of Interest
The authors declare no conflict of interest.
References
- Cheng, L.; Raba, R. Accumulation of Macro- and Micronutrients and Nitrogen Demand-supply Relationship of ‘Gala’/’Malling 26′ Apple Trees Grown in Sand Culture. J. Am. Soc. Hortic. Ence Am. Soc. Hortic. Ence 2009, 134, 3–13. [Google Scholar] [CrossRef]
- Wang, N.; Wolf, J.; Zhang, F.-s. Towards sustainable intensification of apple production in China—Yield gaps and nutrient use efficiency in apple farming systems. J. Integr. Agric. 2016, 15, 716–725. [Google Scholar] [CrossRef]
- FAO. FAOSTAT Production Database; FAO (Food and Agriculture Organization of the United Nations): Rome, Italy, 2018; Volume 2021. [Google Scholar]
- Aggelopoulou, A.D.; Bochtis, D.; Fountas, S.; Swain, K.C.; Gemtos, T.A.; Nanos, G.D. Yield prediction in apple orchards based on image processing. Precis. Agric. 2010, 12, 448–456. [Google Scholar] [CrossRef]
- Linker, R. Machine learning based analysis of night-time images for yield prediction in apple orchard. Biosyst. Eng. 2018, 167, 114–125. [Google Scholar] [CrossRef]
- Zhou, R.; Damerow, L.; Sun, Y.; Blanke, M.M. Using colour features of cv. ‘Gala’ apple fruits in an orchard in image processing to predict yield. Precis. Agric. 2012, 13, 568–580. [Google Scholar] [CrossRef]
- Liakos, V.; Tagarakis, A.; Aggelopoulou, K.; Fountas, S.; Nanos, G.D.; Gemtos, T. In-season prediction of yield variability in an apple orchard. Eur. J. Hortic. Sci. 2017, 82, 251–259. [Google Scholar] [CrossRef]
- Qian, J. A smartphone-based apple yield estimation application using imaging features and the ANN method in mature period. Sci. Agric. 2018, 75, 273–280. [Google Scholar] [CrossRef]
- Kang, H.; Chen, C. Fruit Detection and Segmentation for Apple Harvesting Using Visual Sensor in Orchards. Sensors 2019, 19, 4599. [Google Scholar] [CrossRef]
- Cheng, H.; Sun, Y.; Damerow, L.; Blanke, M.M. Detection of apple fruit in an orchard for early yield prediction as a function of crop load. Acta Hortic. 2016, 59–66. [Google Scholar] [CrossRef]
- Li, C.; Zhu, X.; Wei, Y.; Cao, S.; Guo, X.; Yu, X.; Chang, C. Estimating apple tree canopy chlorophyll content based on Sentinel-2A remote sensing imaging. Sci. Rep. 2018, 8, 3756. [Google Scholar] [CrossRef] [PubMed]
- Bai, T.; Wang, S.; Meng, W.; Zhang, N.; Mercatoris, B. Assimilation of Remotely-Sensed LAI into WOFOST Model with the SUBPLEX Algorithm for Improving the Field-Scale Jujube Yield Forecasts. Remote Sens. 2019, 11, 1945. [Google Scholar] [CrossRef]
- Wang, Y.; Xu, X.; Huang, L.; Yang, G.; Fan, L.; Wei, P.; Chen, G. An Improved CASA Model for Estimating Winter Wheat Yield from Remote Sensing Images. Remote Sens. 2019, 11, 1088. [Google Scholar] [CrossRef]
- Fieuzal, R.; Bustillo, V.; Collado, D.; Dedieu, G. Combined Use of Multi-Temporal Landsat-8 and Sentinel-2 Images for Wheat Yield Estimates at the Intra-Plot Spatial Scale. Agronomy 2020, 10, 327. [Google Scholar] [CrossRef]
- Son, N.-T.; Chen, C.-F.; Chen, C.-R.; Guo, H.-Y.; Cheng, Y.-S.; Chen, S.-L.; Lin, H.-S.; Chen, S.-H. Machine learning approaches for rice crop yield predictions using time-series satellite data in Taiwan. Int. J. Remote Sens. 2020, 41, 7868–7888. [Google Scholar] [CrossRef]
- Robson, A.; Rahman, M.; Muir, J. Using Worldview Satellite Imagery to Map Yield in Avocado (Persea americana): A Case Study in Bundaberg, Australia. Remote Sens. 2017, 9, 1223. [Google Scholar] [CrossRef]
- Miranda, C.; Santesteban, L.; Urrestarazu, J.; Loidi, M.; Royo, J. Sampling Stratification Using Aerial Imagery to Estimate Fruit Load in Peach Tree Orchards. Agriculture 2018, 8, 78. [Google Scholar] [CrossRef]
- Rahman, M.; Robson, A.; Bristow, M. Exploring the Potential of High Resolution WorldView-3 Imagery for Estimating Yield of Mango. Remote Sens. 2018, 10, 1866. [Google Scholar] [CrossRef]
- Ye, X.; Sakai, K.; Manago, M.; Asada, S.I.; Sasao, A. Prediction of citrus yield from airborne hyperspectral imagery. Precis. Agric. 2007, 8, 111–125. [Google Scholar] [CrossRef]
- Ye, X.; Sakai, K.; Sasao, A.; Asada, S.I. Estimation of citrus yield from canopy spectral features determined by airborne hyperspectral imagery. Int. J. Remote Sens. 2009, 30, 4621–4642. [Google Scholar] [CrossRef]
- Van Beek, J.; Tits, L.; Somers, B.; Deckers, T.; Verjans, W.; Bylemans, D.; Janssens, P.; Coppin, P. Temporal Dependency of Yield and Quality Estimation through Spectral Vegetation Indices in Pear Orchards. Remote Sens. 2015, 7, 9886–9903. [Google Scholar] [CrossRef]
- Dempewolf, J.; Adusei, B.; Becker-Reshef, I.; Hansen, M.; Potapov, P.; Khan, A.; Barker, B. Wheat Yield Forecasting for Punjab Province from Vegetation Index Time Series and Historic Crop Statistics. Remote Sens. 2014, 6, 9653–9675. [Google Scholar] [CrossRef]
- Louis, K.; Nathaniel, N.; Andrew, D.; Yinsuo, Z.; Aston, C. Assessing the Performance of MODIS NDVI and EVI for Seasonal Crop Yield Forecasting at the Ecodistrict Scale. Remote Sens. 2014, 6, 10193–10214. [Google Scholar] [CrossRef]
- Phan, P.; Chen, N.; Xu, L.; Chen, Z. Using Multi-Temporal MODIS NDVI Data to Monitor Tea Status and Forecast Yield: A Case Study at Tanuyen, Laichau, Vietnam. Remote Sens. 2020, 12, 1814. [Google Scholar] [CrossRef]
- Mirasi, A.; Mahmoudi, A.; Navid, H.; Valizadeh Kamran, K.; Asoodar, M.A. Evaluation of sum-NDVI values to estimate wheat grain yields using multi-temporal Landsat OLI data. Geocarto Int. 2019, 36, 1309–1324. [Google Scholar] [CrossRef]
- Wang, L.; Tian, Y.; Yao, X.; Zhu, Y.; Cao, W. Predicting grain yield and protein content in wheat by fusing multi-sensor and multi-temporal remote-sensing images. Field Crop. Res. 2014, 164, 178–188. [Google Scholar] [CrossRef]
- Bai, T.; Zhang, N.; Mercatoris, B.; Chen, Y. Jujube yield prediction method combining Landsat 8 Vegetation Index and the phenological length. Comput. Electron. Agric. 2019, 162, 1011–1027. [Google Scholar] [CrossRef]
- Sepulcre-Cantó, G.; Zarco-Tejada, P.J.; Jiménez-Mu?oz, J.C.; Sobrino, J.A.; Soriano, M.A.; Fereres, E.; Vega, V.; Pastor, M. Monitoring yield and fruit quality parameters in open-canopy tree crops under water stress. Implications for ASTER. Remote Sens. Environ. 2007, 107, 455–470. [Google Scholar] [CrossRef]
- Planet Lab. Available online: www.planet.com (accessed on 15 November 2020).
- Feng, L.; Zhang, Z.; Ma, Y.; Du, Q.; Luck, B. Alfalfa Yield Prediction Using UAV-Based Hyperspectral Imagery and Ensemble Learning. Remote Sens. 2020, 12, 2028. [Google Scholar] [CrossRef]
- Maimaitijiang, M.; Sagan, V.; Sidike, P.; Hartling, S.; Esposito, F.; Fritschi, F.B. Soybean yield prediction from UAV using multimodal data fusion and deep learning. Remote Sens. Environ. 2020, 237, 111599. [Google Scholar] [CrossRef]
- Shahhosseini, M.; Hu, G.; Archontoulis, S.V. Forecasting Corn Yield With Machine Learning Ensembles. Front. Plant Sci. 2020, 11, 1120. [Google Scholar] [CrossRef] [PubMed]
- Palosuo, T.; Kersebaum, K.C.; Angulo, C.; Hlavinka, P.; Moriondo, M.; Olesen, J.R.E.; Patil, R.H.; Ruget, F.O.; Rumbaur, C.; Taká, J. Simulation of winter wheat yield and its variability in different climates of Europe: A comparison of eight crop growth models. Eur. J. Agron. 2011, 35, 103–114. [Google Scholar] [CrossRef]
- Setiyono, T.D.; Quicho, E.D.; Holecz, F.H.; Khan, N.I.; Romuga, G.; Maunahan, A.; Garcia, C.; Rala, A.; Raviz, J.; Collivignarelli, F.; et al. Rice yield estimation using synthetic aperture radar (SAR) and the ORYZA crop growth model: Development and application of the system in South and South-east Asian countries. Int. J. Remote Sens. 2019, 40, 8093–8124. [Google Scholar] [CrossRef]
- Potter, C.S.; Randerson, J.T.; Field, C.B.; Matson, P.A.; Klooster, S.A. Terrestrial Ecosystem Production: A Process Model Based on Global Satellite and Surface Data. Glob. Biogeochem. Cycles 1993, 7, 811–841. [Google Scholar] [CrossRef]
- Du, X.; Li, Q.; Dong, T.; Jia, K. Winter wheat biomass estimation using high temporal and spatial resolution satellite data combined with a light use efficiency model. Geocarto Int. 2014, 30, 258–269. [Google Scholar] [CrossRef]
- Jordan, C.F. Derivation of Leaf-Area Index from Quality of Light on the Forest Floor. Ecology 1969, 50, 663–666. [Google Scholar] [CrossRef]
- Rouse, J.W.; Haas, R.H.; Schell, J.A.; Deering, D.W. Monitoring vegetation systems in the Great Plains with ERTS. In Proceedings of the Third Earth Resources Technology Satellite-1 Symposium—Volume I: Technical Presentations; NASA SP-351; NASA: Washington, DC, USA, 1974; pp. 309–317. [Google Scholar]
- Huete, A.R. A soil-adjusted vegetation index (SAVI). Remote Sens. Environ. 1988, 25, 295–309. [Google Scholar] [CrossRef]
- Roujean, J.L.; Breon, F.O.M. Estimating PAR absorbed by vegetation from bidirectional reflectance measurements. Remote Sens. Environ. 1995, 51, 375–384. [Google Scholar] [CrossRef]
- Huete, A.; Justice, C.; Liu, H. Development of vegetation and soil indices for MODIS-EOS. Remote Sens. Environ. 1994, 49, 224–234. [Google Scholar] [CrossRef]
- Zhu, Y.; Yang, G.; Yang, H.; Wu, J.; Lei, L.; Zhao, F.; Fan, L.; Zhao, C. Identification of Apple Orchard Planting Year Based on Spatiotemporally Fused Satellite Images and Clustering Analysis of Foliage Phenophase. Remote Sens. 2020, 12, 1199. [Google Scholar] [CrossRef]
- Bai, X.; Yu, R.; Xiong, J.; Peng, Y.; Jiang, Y.; Yang, G.; Li, Z.; Zhu, X. Hyperspectral estimation of apple canopy chlorophyll content using ensemble learning approach. Appl. Eng. Agric. 2021, 37, 505–511. [Google Scholar] [CrossRef]
- Zhao, H.S.; Zhu, X.C.; Li, C.; Wei, Y.; Zhao, G.X.; Jiang, Y.M. Improving the Accuracy of the Hyperspectral Model for Apple Canopy Water Content Prediction using the Equidistant Sampling Method. Sci. Rep. 2017, 7, 11192. [Google Scholar] [CrossRef] [PubMed]
- Janssen, P.H.M.; Heuberger, P.S.C. Calibration of process-oriented models. Ecol. Model. 1995, 83, 55–66. [Google Scholar] [CrossRef]
- Gaston, E.; Frías, J.M.; Cullen, P.J.; O’Donnell, C.P.; Gowen, A.A. Prediction of Polyphenol Oxidase Activity Using Visible Near-Infrared Hyperspectral Imaging on Mushroom (Agaricus bisporus) Caps. J. Agric. Food Chem. 2010, 58, 6226–6233. [Google Scholar] [CrossRef] [PubMed]
- Reyniers, M.; Vrindts, E.; Baerdemaeker, J.D. Comparison of an aerial-based system and an on the ground continuous measuring device to predict yield of winter wheat. Eur. J. Agron. 2006, 24, 87–94. [Google Scholar] [CrossRef]
- Mkhabela, M.S.; Bullock, P.; Raj, S.; Wang, S.; Yang, Y.J.A.; Meteorology, F. Crop yield forecasting on the Canadian Prairies using MODIS NDVI data. Agric. For. Meteorol. 2011, 151, 385–393. [Google Scholar] [CrossRef]
- Bolton, D.K.; Friedl, M.A. Forecasting crop yield using remotely sensed vegetation indices and crop phenology metrics. Agric. For. Meteorol. 2013, 173, 74–84. [Google Scholar] [CrossRef]
- Güler, S. Effects of nitrogen on yield and chlorophyll of potato (Solanum Tuberosum L.) Cultivars. Bangladesh J. Bot. 2010, 38, 163–169. [Google Scholar] [CrossRef]
- Serrano, L.; Filella, I.; Peuelas, J. Remote Sensing of Biomass and Yield of Winter Wheat under Different Nitrogen Supplies. Crop Sci. 2000, 40, 723–731. [Google Scholar] [CrossRef]
- Zeng, L.; Wardlow, B.D.; Xiang, D.; Hu, S.; Li, D. A review of vegetation phenological metrics extraction using time-series, multispectral satellite data. Remote Sens. Environ. 2019, 237, 111511. [Google Scholar] [CrossRef]
- Diao, C. Remote sensing phenological monitoring framework to characterize corn and soybean physiological growing stages. Remote Sens. Environ. 2020, 248, 111960. [Google Scholar] [CrossRef]
- Zhou, X.; Zheng, H.B.; Xu, X.Q.; He, J.Y.; Ge, X.K.; Yao, X.; Cheng, T.; Zhu, Y.; Cao, W.X.; Tian, Y.C. Predicting grain yield in rice using multi-temporal vegetation indices from UAV-based multispectral and digital imagery. ISPRS J. Photogramm. Remote Sens. 2017, 130, 246–255. [Google Scholar] [CrossRef]
- Zhang, Y.; Li, P.; Cheng, L. Developmental changes of carbohydrates, organic acids, amino acids, and phenolic compounds in ‘Honeycrisp’ apple flesh. Food Chem. 2010, 123, 1013–1018. [Google Scholar] [CrossRef]
- Jin, H.; Bao, G.; Chen, J.; Chopping, M.; Jin, E.; Mandakh, U.; Jiang, K.; Huang, X.; Bao, Y.; Vandansambuu, B. Modifying the maximal light-use efficiency for enhancing predictions of vegetation net primary productivity on the Mongolian Plateau. Int. J. Remote Sens. 2020, 41, 3740–3760. [Google Scholar] [CrossRef]
- Wang, Y.; Zhou, G. Light use efficiency over two temperate steppes in inner Mongolia, China. PLoS ONE 2012, 7, e43614. [Google Scholar] [CrossRef]
- Zhu, W.Q.; Pan, Y.Z.; He, H.; Yu, D.Y. Simulation of maximum light use efficiency of typical vegetation in Chinese. Chin. Sci. Bull. 2006, 51, 700–706. [Google Scholar] [CrossRef]
- Yuan, W.; Liu, S.; Zhou, G.; Zhou, G.; Tieszen, L.L.; Baldocchi, D.; Bernhofer, C.; Gholz, H.; Goldstein, A.H.; Goulden, M.L. Deriving a light use efficiency model from eddy covariance flux data for predicting daily gross primary production across biomes. Agric. For. Meteorol. 2007, 143, 189–207. [Google Scholar] [CrossRef]
- Chen, T.; van der Werf, G.R.; Dolman, A.J.; Groenendijk, M. Evaluation of cropland maximum light use efficiency using eddy flux measurements in North America and Europe. Geophys. Res. Lett. 2011, 38, 14707. [Google Scholar] [CrossRef]
- Running, S.W.; Thornton, P.E.; Nemani, R.; Glassy, J.M. Global Terrestrial Gross and Net Primary Productivity from the Earth Observing System. In Methods Ecosystem Science; Springer: Berlin/Heidelberg, Germany, 2000. [Google Scholar] [CrossRef]
- Zhang, Y.-Y.; Liu, B.-C.; Qiu, M.-J.; Liu, Y.; Wu, X.-Y.; Xiao, N.-S. Areas Suitable for Growing Apples Moved Northward and Westward in China under the Background of Climate Change: Climatic Degionalization of Apple Based on High-resolution Meteorological Grid Data. Chin. J. Agrometeorol. 2019, 40, 678. [Google Scholar] [CrossRef]
- Bosco, L.C.; Bergamaschi, H.; Marodin, G.A.B. Solar radiation effects on growth, anatomy, and physiology of apple trees in a temperate climate of Brazil. Int. J. Biometeorol. 2020, 64, 1969–1980. [Google Scholar] [CrossRef]


Publisher’s Note: MDPI stays neutral with regard to jurisdictional claims in published maps and institutional affiliations. |
© 2021 by the authors. Licensee MDPI, Basel, Switzerland. This article is an open access article distributed under the terms and conditions of the Creative Commons Attribution (CC BY) license (https://creativecommons.org/licenses/by/4.0/).