Abstract
This study compares the Gravity Recovery And Climate Experiment (GRACE)/GRACE Follow-On (GFO) errors with the coseismic gravity variations generated by earthquakes above Mw8.0s that occurred during April 2002~June 2017 and evaluates the influence of monthly model errors on the coseismic signal detection. The results show that the precision of GFO monthly models is approximately 38% higher than that of the GRACE monthly model and all the detected earthquakes have signal-to-noise ratio (SNR) larger than 1.8. The study concludes that the precision of the time-variable gravity fields should be improved by at least one order in order to detect all the coseismic gravity signals of earthquakes with M ≥ 8.0. By comparing the spectral intensity distribution of the GFO stack errors and the 2019 Mw8.0 Peru earthquake, it is found that the precision of the current GFO monthly model meets the requirement to detect the coseismic signal of the earthquake. However, due to the limited time length of the observations and the interference of the hydrological signal, the coseismic signals are, in practice, difficult to extract currently.
1. Introduction
Since the launch of the Gravity Recovery And Climate Experiment (GRACE) satellite in 2002, gravity field models recovered from GRACE observations have been widely used in the research fields of global water cycle and land water storage change [1], global sea level change and ice sheet mass balance [2,3,4]. GRACE can detect the gravity changes generated by large mass migration within the Earth’s system, and thus GRACE global time-variable gravity field data are also widely used in seismological research.
Sun and Okubo [5] pointed out that the 1964 Mw9.2 Alaska earthquake caused a geoid height change with a magnitude of 1.5 cm, which could be detected by the gravity satellite mission. By simulating GRACE’s precision, Gross and Chao [6] showed that GRACE could potentially detect the global gravitational field change caused by the 1960 Mw9.5 Chile and 1964 Mw9.2 Alaska earthquakes. Mikhailov et al. [7] indicated that the precision of the GGM-01S model is sufficient to detect the gravity field changes generated by the 1964 Mw9.2 Alaska earthquake, and if the model accuracy is improved by two orders of magnitude, the coseismic gravity signal caused by the 2003 Mw8.2 Hokkaido earthquake can be detected. Sun and Okubo [8] concluded that GRACE can detect coseismic gravity signals generated by earthquakes with magnitude above Mw 7.5 for tensile sources or above Mw 9.0 for shear sources by studying different independent dislocation sources, which was verified by the 2004 Mw9.1 Sumatra–Andaman earthquake [9,10].
In follow-up studies, coseismic gravity changes caused by the 2005 Mw8.6 Nias [11], 2010 Mw8.8 Maule [12,13,14], 2011 Mw9.0 Tohoku [15,16], 2007 Mw8.4 Bengkulu [17,18], 2012 Mw8.6 Indian Ocean [19] and 2013 Mw8.3 Okhotsk [20,21] earthquakes were detected, among which the 2007 Mw8.4 Bengkulu and 2013 Mw8.3 Okhotsk earthquakes were below Mw8.5. Chao et al. [22] analyzed the time-variable gravity signals during the GRACE mission by using the empirical orthogonal function (EOF) method, and summarized seven earthquakes with large coseismic gravity changes that had been detected by GRACE. The spatial distribution and amplitude of coseismic changes were generally consistent with the coseismic jump obtained by the least-squares method.
De Viron et al. [23] simulated nearly 2000 earthquakes with different source mechanisms and locations around the world by the EOF method. The results show that with the accuracy and resolution of the current GRACE, the possibility of retrieving signals of earthquakes exceeds 98% and 33% for earthquakes with magnitude above 9.0 and magnitude 8.3, respectively. Cambiotti et al. [24] simulated 291 coseismic and postseismic signals from different earthquake sources and concluded that the next generation of gravity satellite (NGGM) can detect the coseismic and postseismic signals of earthquakes with magnitude above 7.8, and the magnitude threshold can be reduced to 7.0 if the background model has high precision.
During the course of the GRACE mission, i.e., from April 2002 to June 2017, a total of 19 earthquake events with magnitude above 8.0 occurred. However, only seven of them were detected during the flight period of GRACE [22]. Since all these earthquakes generated mass variations, the question is why more than 10 earthquakes failed to be detected and how accurate the monthly gravity field model should be in order to detect all the earthquakes above Mw8.0. In order to answer these questions, this study compares the coseismic gravity changes of earthquakes with magnitude above Mw8.0 and GRACE/GRACE Follow-On (GFO) monthly gravity field model errors in the spectral domain. It further discusses the precision requirement of the monthly time-variable field model for detecting the coseismic gravity changes of earthquakes with magnitudes above Mw8.0.
2. Model and Method
2.1. Coseismic Dislocation Model
This study evaluates the coseismic changes using a half-space layered dislocation model by adopting the PSGRN/PSCMP algorithm developed by Wang et al. [25]. The input for the calculation includes the Earth layered model and seismic slip model. The Earth layered model is a group of physical parameters that describe the crustal and upper mantle layered information and can be found in CRUST2.0 [26]. The seismic slip model consists of several sub-blocks describing the fault rupture surface.
The PSGRN/PSCMP program predicts the gravity changes at the ‘‘observation points’’ on the deformed Earth’s surface, while the GRACE observations are given at the “space-fixed points” [27]. Therefore, free-air reduction is conducted to convert the model-predicted results into those at the “space-fixed points” [28] to ensure that the positions of the predicted values are consistent with the GRACE observations. The seawater compensation effect is non-negligible [12,29], and is quantified with the predicted coseismic vertical displacements and the land–ocean mask data over the region. The spherical harmonic (SH) coefficients can be obtained as follows:
where ; G is the gravitational constant; M is the mass of the Earth; a is the mean radius of the Earth; are the gravity signals predicted by the model; θ, λ are the latitude and longitude, respectively; is a fully normalized Legendre function.
The model prediction values are only given in the near-field of the earthquake region and the earthquake signals are mainly in local areas. Therefore, we use Equation (3) to calculate the gravity variation of each degree in the earthquake area (in size of 20° × 20° around the epicenter) and the point interval is 0.2° in both latitude and longitude directions:
The degree variance (i.e., the power spectral density) of earthquake gravity signals is evaluated as follows:
where k is the total number of sub-grids in the calculation area.
2.2. GRACE Time-Variable Gravity Field Model Error
In the released GRACE monthly model products, the standard deviation (std) errors of each coefficient of the model are all given. Hence, the corresponding gravity error at a point (θ, λ), denoted as , can be obtained based on the error propagation law as Equation (5) [30]. It is worth mentioning that this result is a formal error and may overestimate the accuracy of GRACE to a certain extent [31]:
where is the Gaussian smoothing factor; δClm and δSlm are the error stds of SH coefficients; l and m are the degree and order, respectively; N is the maximum degree.
In order to suppress the interference of stripe noise and annual and semiannual periodic signals, and to weaken the influence of random error, the stacking method is usually used to detect the coseismic jump [10]. Considering the influence of the postseismic signal, the two-year mean field before and after the earthquake is used in the stacking method. The error of the results extracted by the stacking method based on the error propagation law can be obtained as follows:
where is the error of the stacking method in the spatial domain; is the average error of the GRACE monthly model; k is the total number of monthly models before and after an earthquake.
The degree variance of gravity errors is calculated as follows [32]:
The error of the stacking method based on the error propagation law can be obtained as follows:
where is the error of the stacking method in the spectral domain; and are the average error std of SH coefficients of the monthly model.
3. Data
3.1. Fault Slip Models
In this paper, the Earth layered model and seismic slip model were used to calculate the coseismic gravity changes of dislocation model prediction. Due to differences in both the data sources and inversion methods used for deriving seismic fault slip models, significant differences exist among the fault slip models [14,33]. We selected the fault slip models with relatively high reliability for earthquakes, i.e., the 2004 Mw9.1 Sumatra–Andaman fault slip model provided by Han et al. [9], the 2011 Mw9.0 Tohoku fault slip model released by Caltech [34], and remaining fault slip models released by the United States Geological Survey (USGS).
3.2. GRACE Data
The GRACE and GFO level-2 RL06 monthly time-variable field models used in this study are provided by the Center for Space Research (CSR), with a maximum degree and order of 96. The data length is 163 months for GRACE data, i.e., from April 2002 to June 2017, and 24 months for GFO data i.e., from June 2018 to July 2020. During data preprocessing, the degree 2 order 0 (C20) coefficients are replaced by Satellite Laser Ranging (SLR) observations [35]; thus, the C20 errors should also be replaced by SLR observation errors. To suppress the stripe noise, a 300 km Gaussian filter was used to process the SH coefficients [32]. In some previous studies, the decorrelation filter is also used to reduce the north–south strips in GRACE observations [10,14,18,21]. However, the signal may also be attenuated or distorted by using the decorrelation filter [36,37]; thus, the decorrelation filter is not applied in this study.
4. Results and Analysis
4.1. The Error of Monthly Time-Variable Field Models
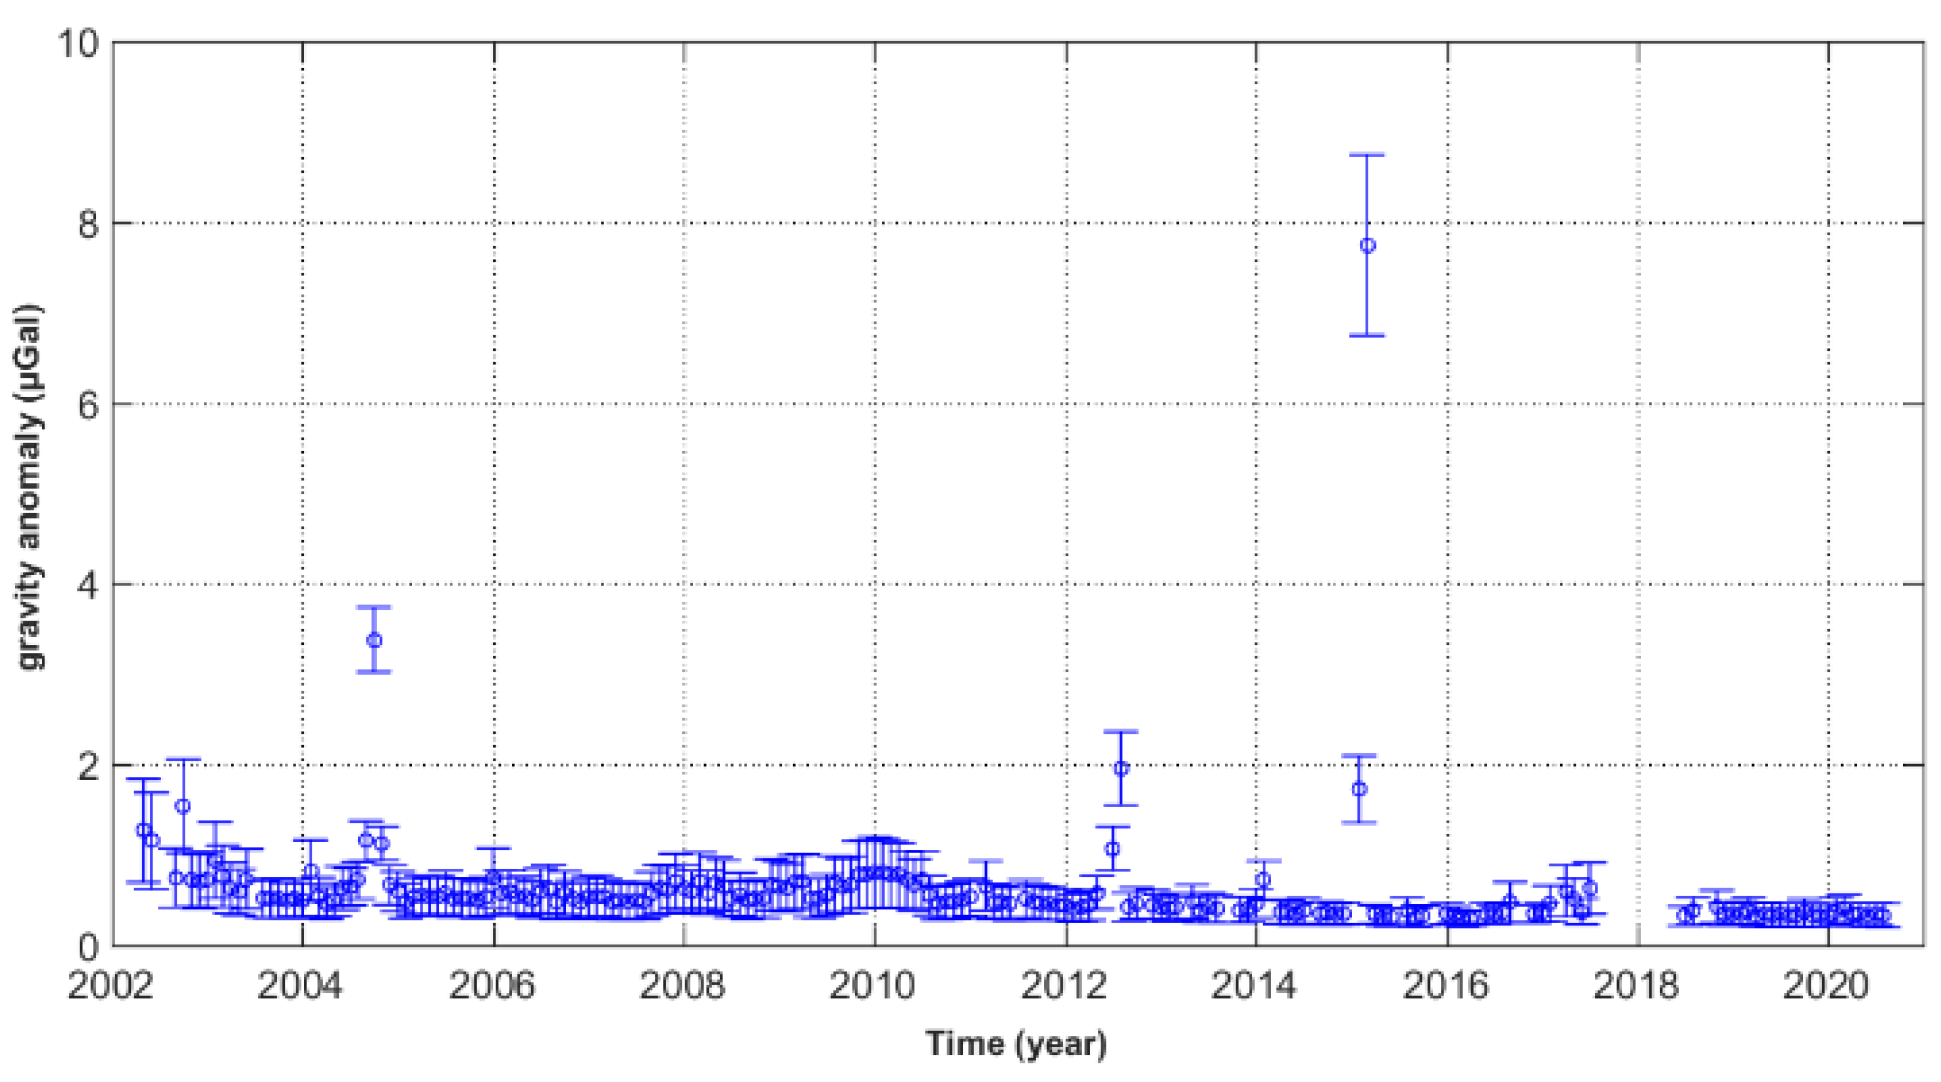
Truncating SH coefficients to degree and order 60 and processing the coefficients with the Gaussian filter, the global error distribution of each month model was derived by Equation (5). Figure 1 shows the global average and standard deviation of the error of each monthly model. According to this figure, the data of September 2004, July 2012 and February 2015 exceed the average error by two times of the mean error std (1.93 µGal). Therefore, the data in these months were removed in order to remove the possible gross errors.
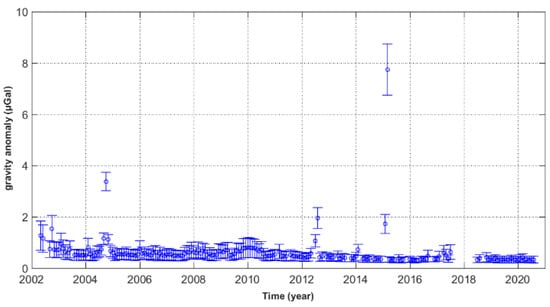
Figure 1.
Global mean and standard deviation of monthly time-variable gravity field model errors.
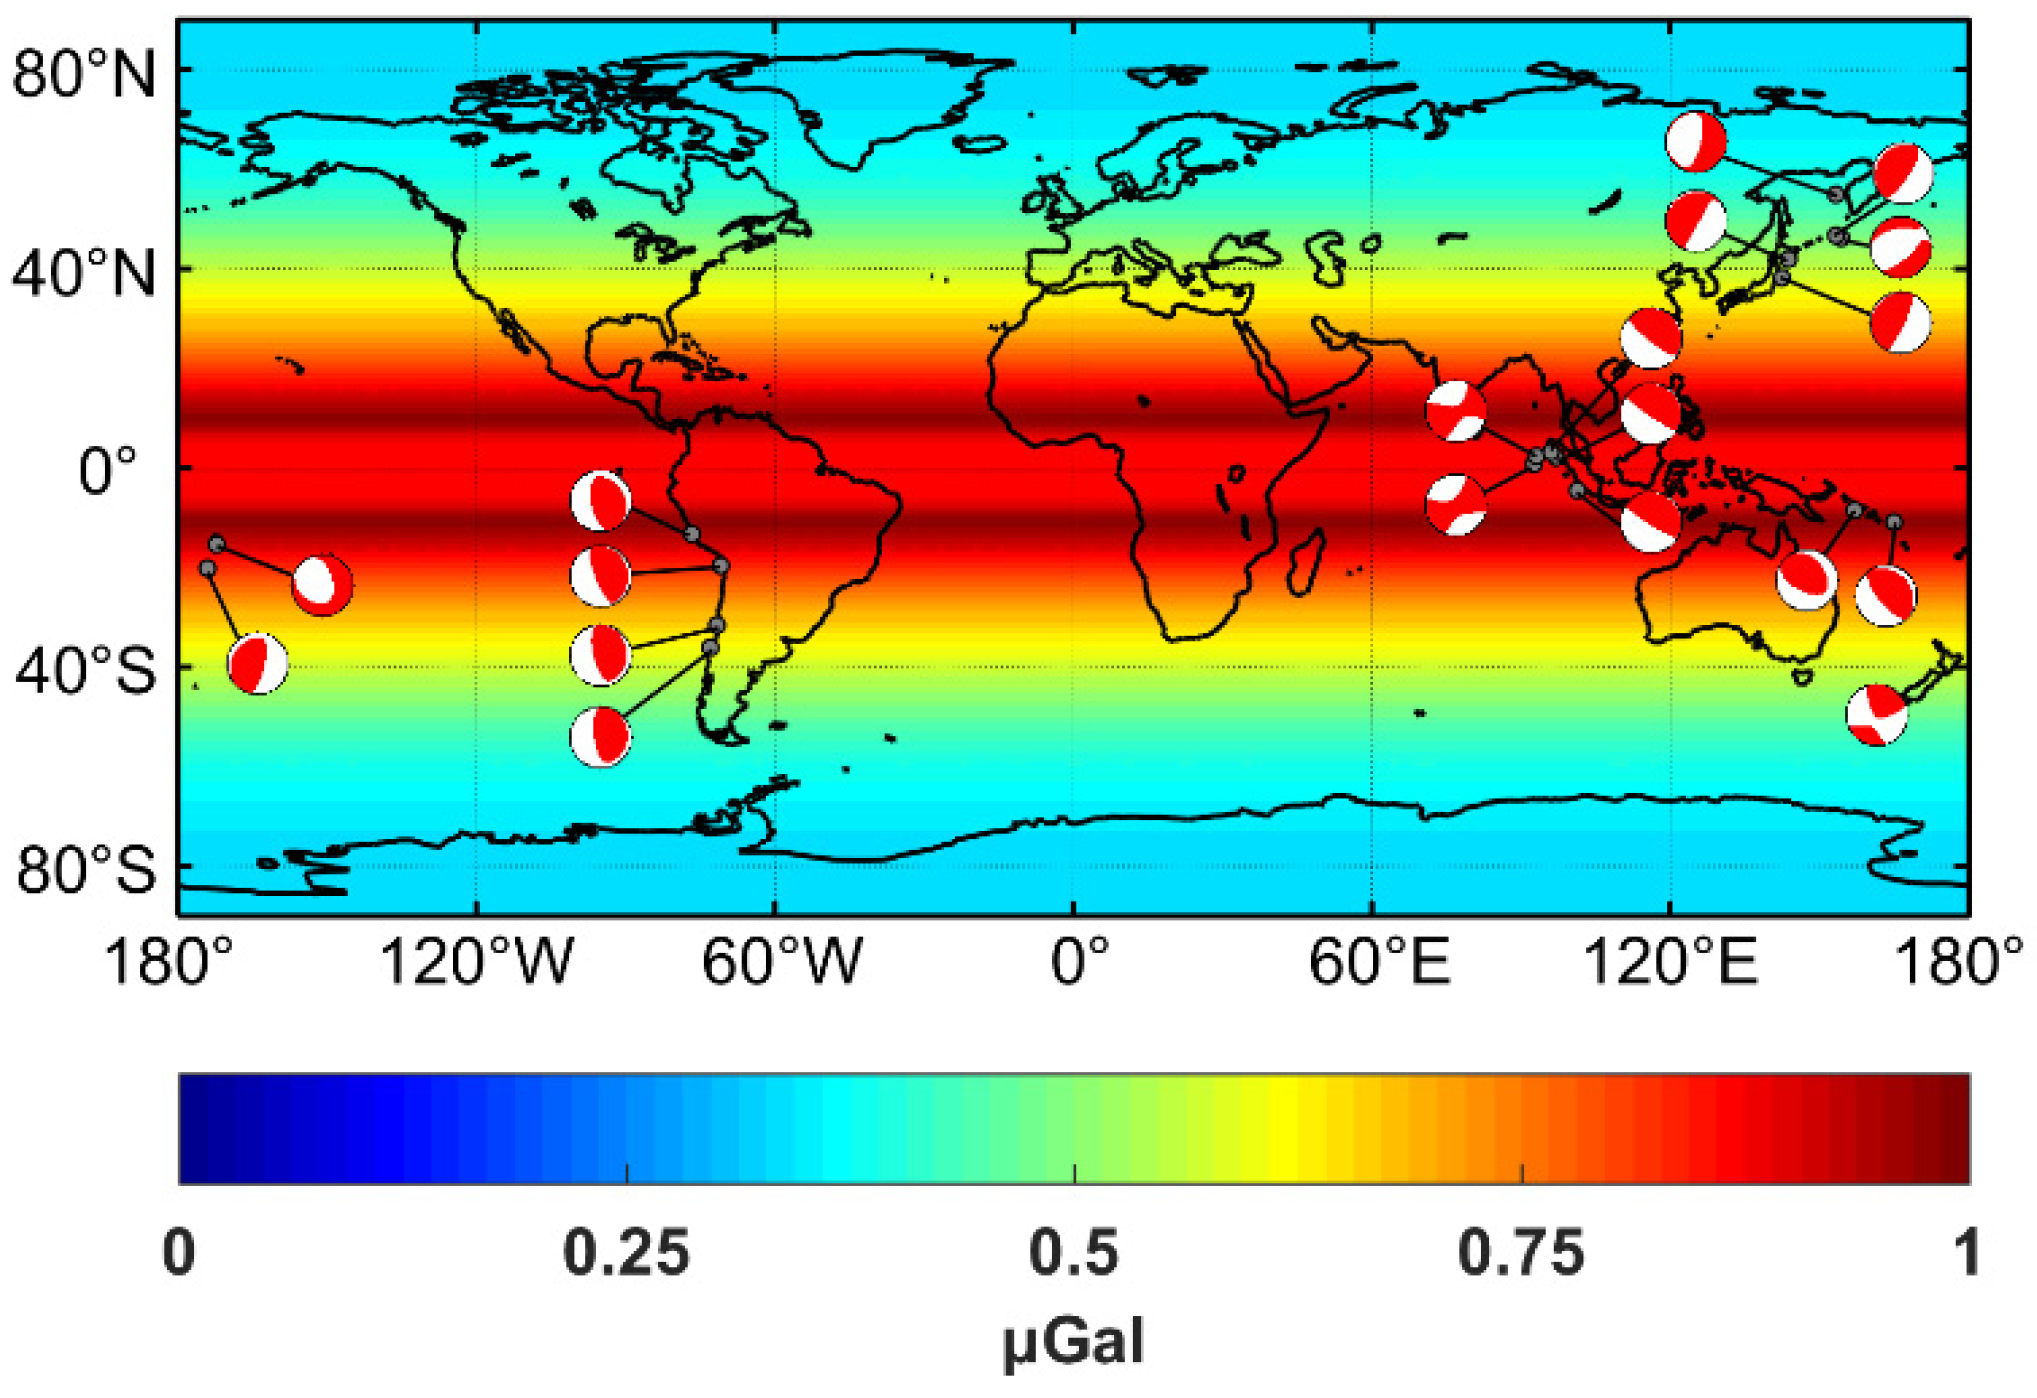
Figure 2 shows the average global error distribution of GRACE monthly models. The errors are distributed symmetrically in the north and south, are greater in low-latitude areas and decrease with increasing latitude. The amplitude ranges from 0.33~0.98 µGal and 0.21~0.61 µGal in the GRACE and GFO results, respectively. The gray dots in Figure 2 and Figure 3 are the locations of the earthquakes above Mw8.0 during the GRACE mission. It is found that these earthquakes occurred in areas with latitudes of −45°~45°, where the average error of GRACE and GFO is 0.76 µGal and 0.47 µGal, respectively. The precision of the GFO monthly model is around 38% higher than that of GRACE.
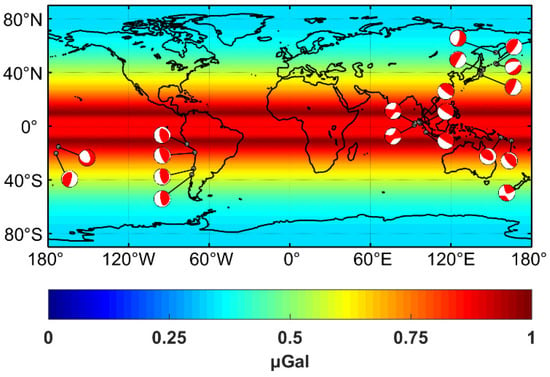
Figure 2.
Global average error distribution of GRACE monthly time-variable gravity field model. The gray dots represent the locations of the earthquakes above Mw8.0 during GRACE mission, and the “beach balls” from global CMT catalog.
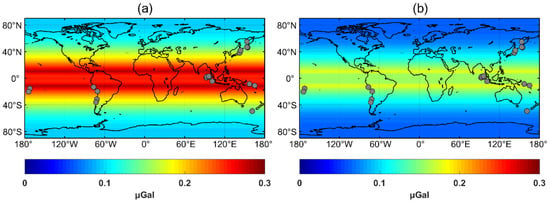
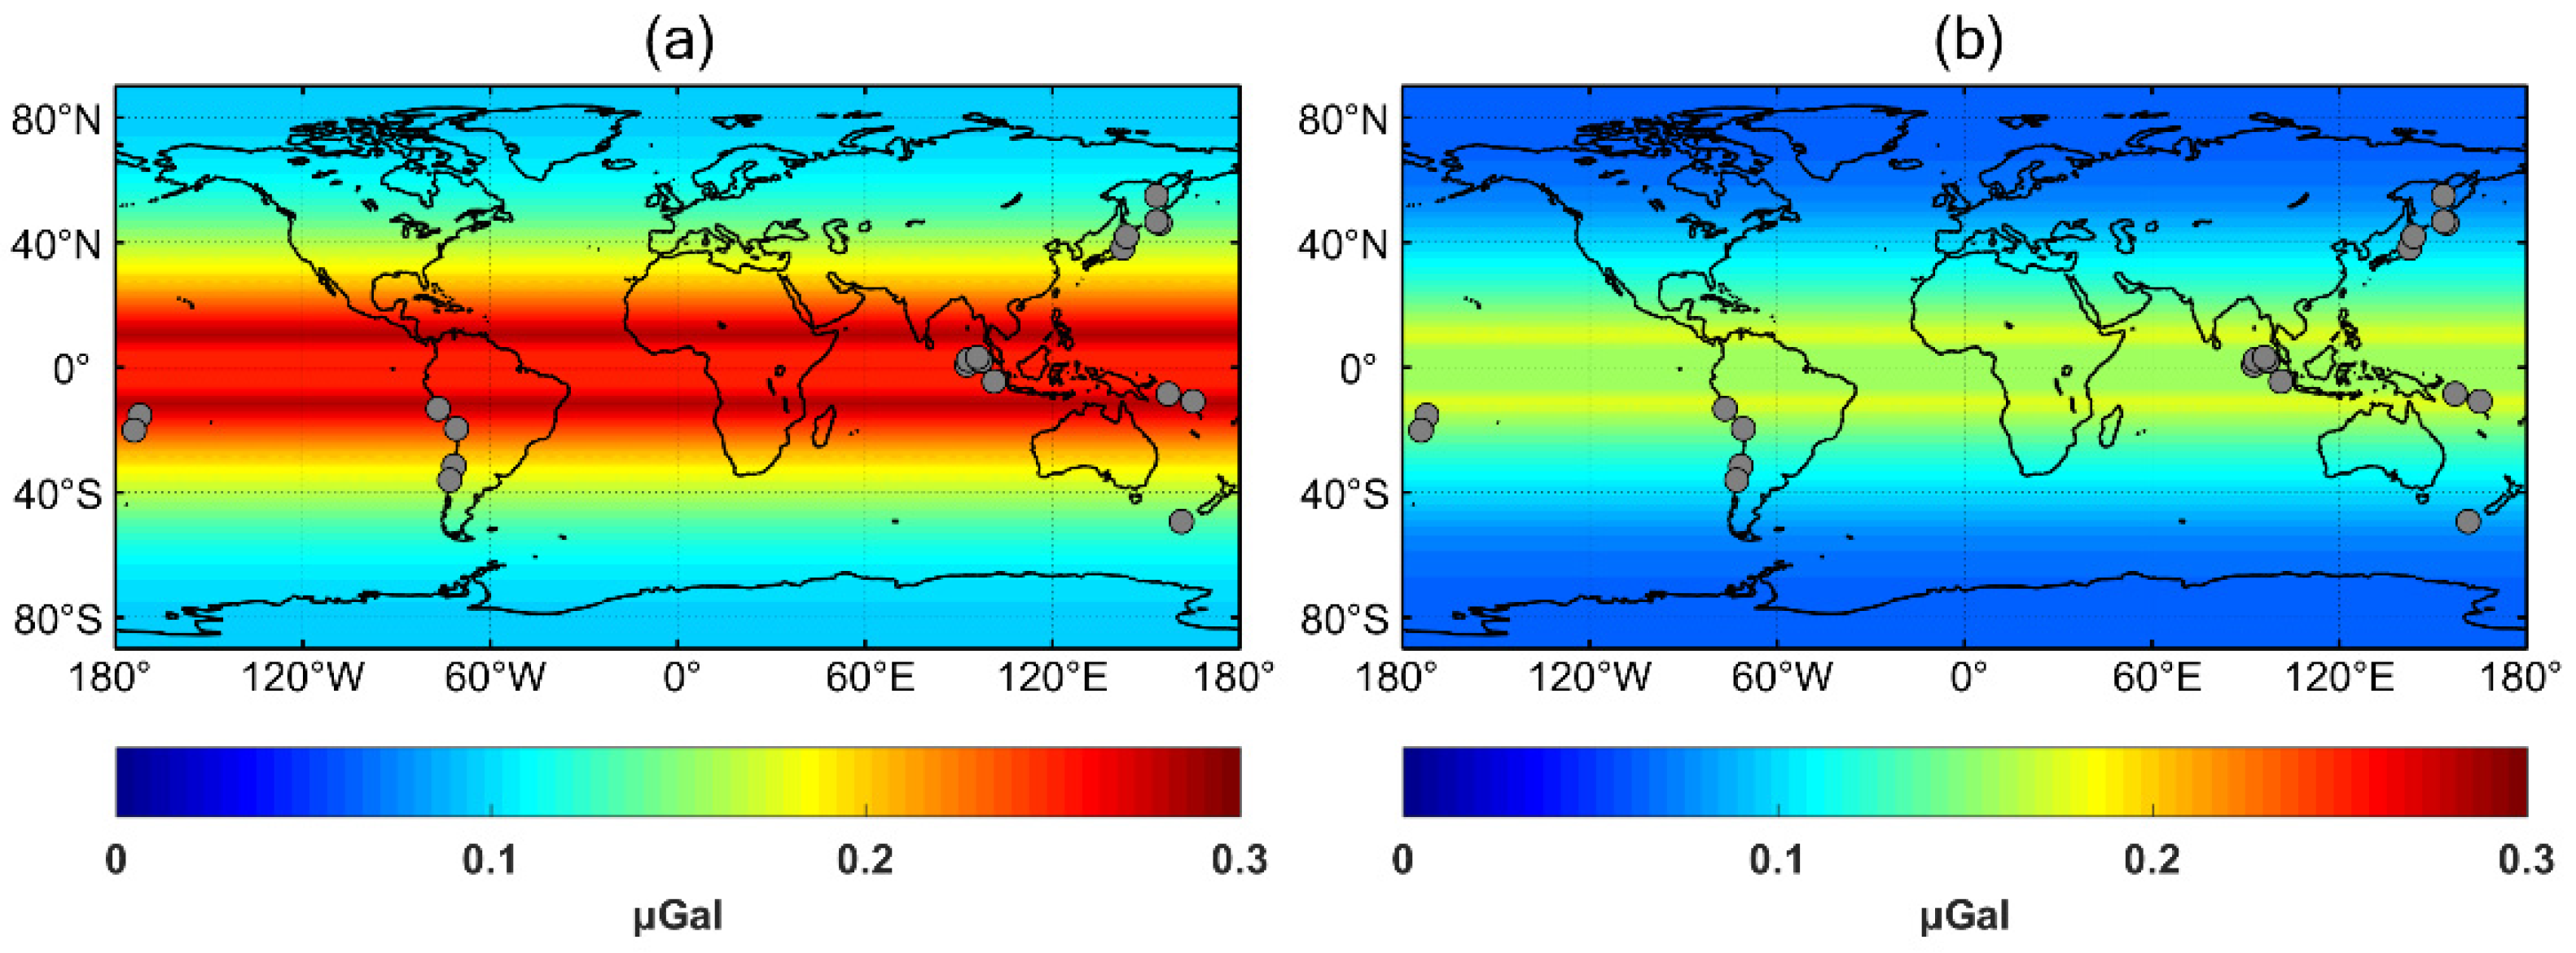
Figure 3.
Global error distribution of stacking method in monthly models of GRACE (a) and GFO (b), respectively.
It should be noted that the coseismic gravity change extracted by the stacking method is the mean field before and after the earthquake, and thus contains the postseismic signal. With an increase in the data length in the stacking method, the influence of the monthly model error for coseismic gravity signal detection decreases. However, if the data length is too long in the stacking method, the postseismic effect would be great. Since the influence of the postseismic effect on the coseismic signal is different, the influence of the postseismic effect extracted by the stacking method would also be different. For example, GRACE can detect the significant postseismic signals caused by the Kuril earthquakes in 2006 and 2007, but cannot detect their coseismic changes [38]. Chile is still affected by the postseismic effect of the 2010 Mw8.8 Maule earthquake, but the influence of the postseismic effect within 3 years after the earthquake is smaller than the coseismic signal [39]. Considering the coseismic and postseismic effects, the mean field of 2 years before and after the earthquake is used to detect the seismic signal in this study.
Taking the average error of the GRACE monthly model (as shown in Figure 2) as the monthly model error, Figure 3 shows the GRACE and GFO error distribution derived by the stacking method, i.e., from Equation (6). According to Figure 3, for the error of GRACE and GFO, the amplitude is in the range of 0.10~0.28 µGal and 0.06~0.18 µGal, and the average error is 0.22 µGal and 0.14 µGal in latitudinal regions of −45°~45°, respectively.
The PSGRN/PSCMP program was used to derive the coseismic gravity changes of earthquakes above Mw8.0 during the GRACE mission. The SH coefficients were truncated to degree and order 60 and a 300 km Gaussian filter was used to smooth the signals, which ensured that the resolution of the results was consistent with the GRACE monthly model. Table 1 shows the statistics of the coseismic gravity predictions calculated by the dislocation model, and the GRACE observations by the stacking method. According to Table 1, the coseismic signal of the 2005 Mw8.6 Nias earthquake cannot be clearly extracted by the stacking method. This is because the epicenters of the 2004 Mw9.1 Sumatra–Andaman and 2005 Nias events are less than 200 km away, and the time interval is only three months. However, using wavelet analysis or the EOF method, the signal of the 2005 Mw8.6 Nias event can be extracted [11,22]. Approximately 13 h after the occurrence of the 2007 Mw8.4 Bengkulu event, an aftershock of Mw7.9 occurred on the northeastern edge of the fault of the Mw8.4 event. The above two events must be included in the comparison of model prediction [18], because the coseismic prediction amplitude of Mw7.9 is larger than 10% of Mw8.4. The Mw8.2 event occurred less than 2 h after the 2012 Mw8.6 Indian Ocean event, and thus these two earthquakes could be detected by GRACE simultaneously, and the Table 1 does not present the model prediction of Mw8.2 because USGS has not published the slip fault model. This is the main reason for the difference between the prediction and observation of the 2012 Mw8.6 Indian Ocean event (−1.86~+1.85 vs. −3.08~+6.34 µGal). Considering that the effect of the Earth’s curvature on a strike slip source with a depth of 600 km constitutes 20% of the surface coseismic change [40], the 2013 Mw8.3 Okhotsk coseismic gravity change was derived by the spherical dislocation model [21].

Table 1.
Statistics of the model-predicted and GRACE-observed coseismic gravity changes of earthquakes above Mw8.0 during GRACE mission and monthly model errors (unit: µGal).
Table 1 also shows the peak-to-peak ranges of GRACE observation after removing the Global Land Data Assimilation System (GLDAS) hydrological model. It can be found that the hydrologic correction of the 2010 Mw8.8 Maule event is larger than that of other earthquakes and closer to the model-predicted result (−6.13~+1.73 vs. −5.77~+1.70 µGal), which indicates that hydrologic factors may have a greater influence on earthquakes near the mainland than the islands.
The model predictions of amplitudes of the seven detected earthquakes [22] are essentially 1.5 times larger than the average error of the GRACE monthly model (0.76 µGal), and the coseismic prediction amplitudes of 2003 Mw8.2 Hokkaido, 2006 Mw8.3 Kuril and 2015 Mw8.3 Illapel are equivalent to the average error. Although the amplitude of coseismic prediction of other earthquakes is essentially larger than the error of the stacking method (0.22 µGal), the coseismic gravity signal of related earthquakes has not been extracted from GRACE observations. This may be due to the north–south striping error or the interference of hydrological and interannual signals, and the calibration error of the monthly models overestimates the accuracy of the model to a certain extent [31]. In order to further evaluate the ability of time-variable gravity field models for coseismic gravity change detection, this study adopted the signal-to-noise ratio (SNR) as the index to analyze the coseismic gravity signals. This is because the signals can be detected only when the SNR reaches a certain threshold.
4.2. Comparison in Spectral Domain
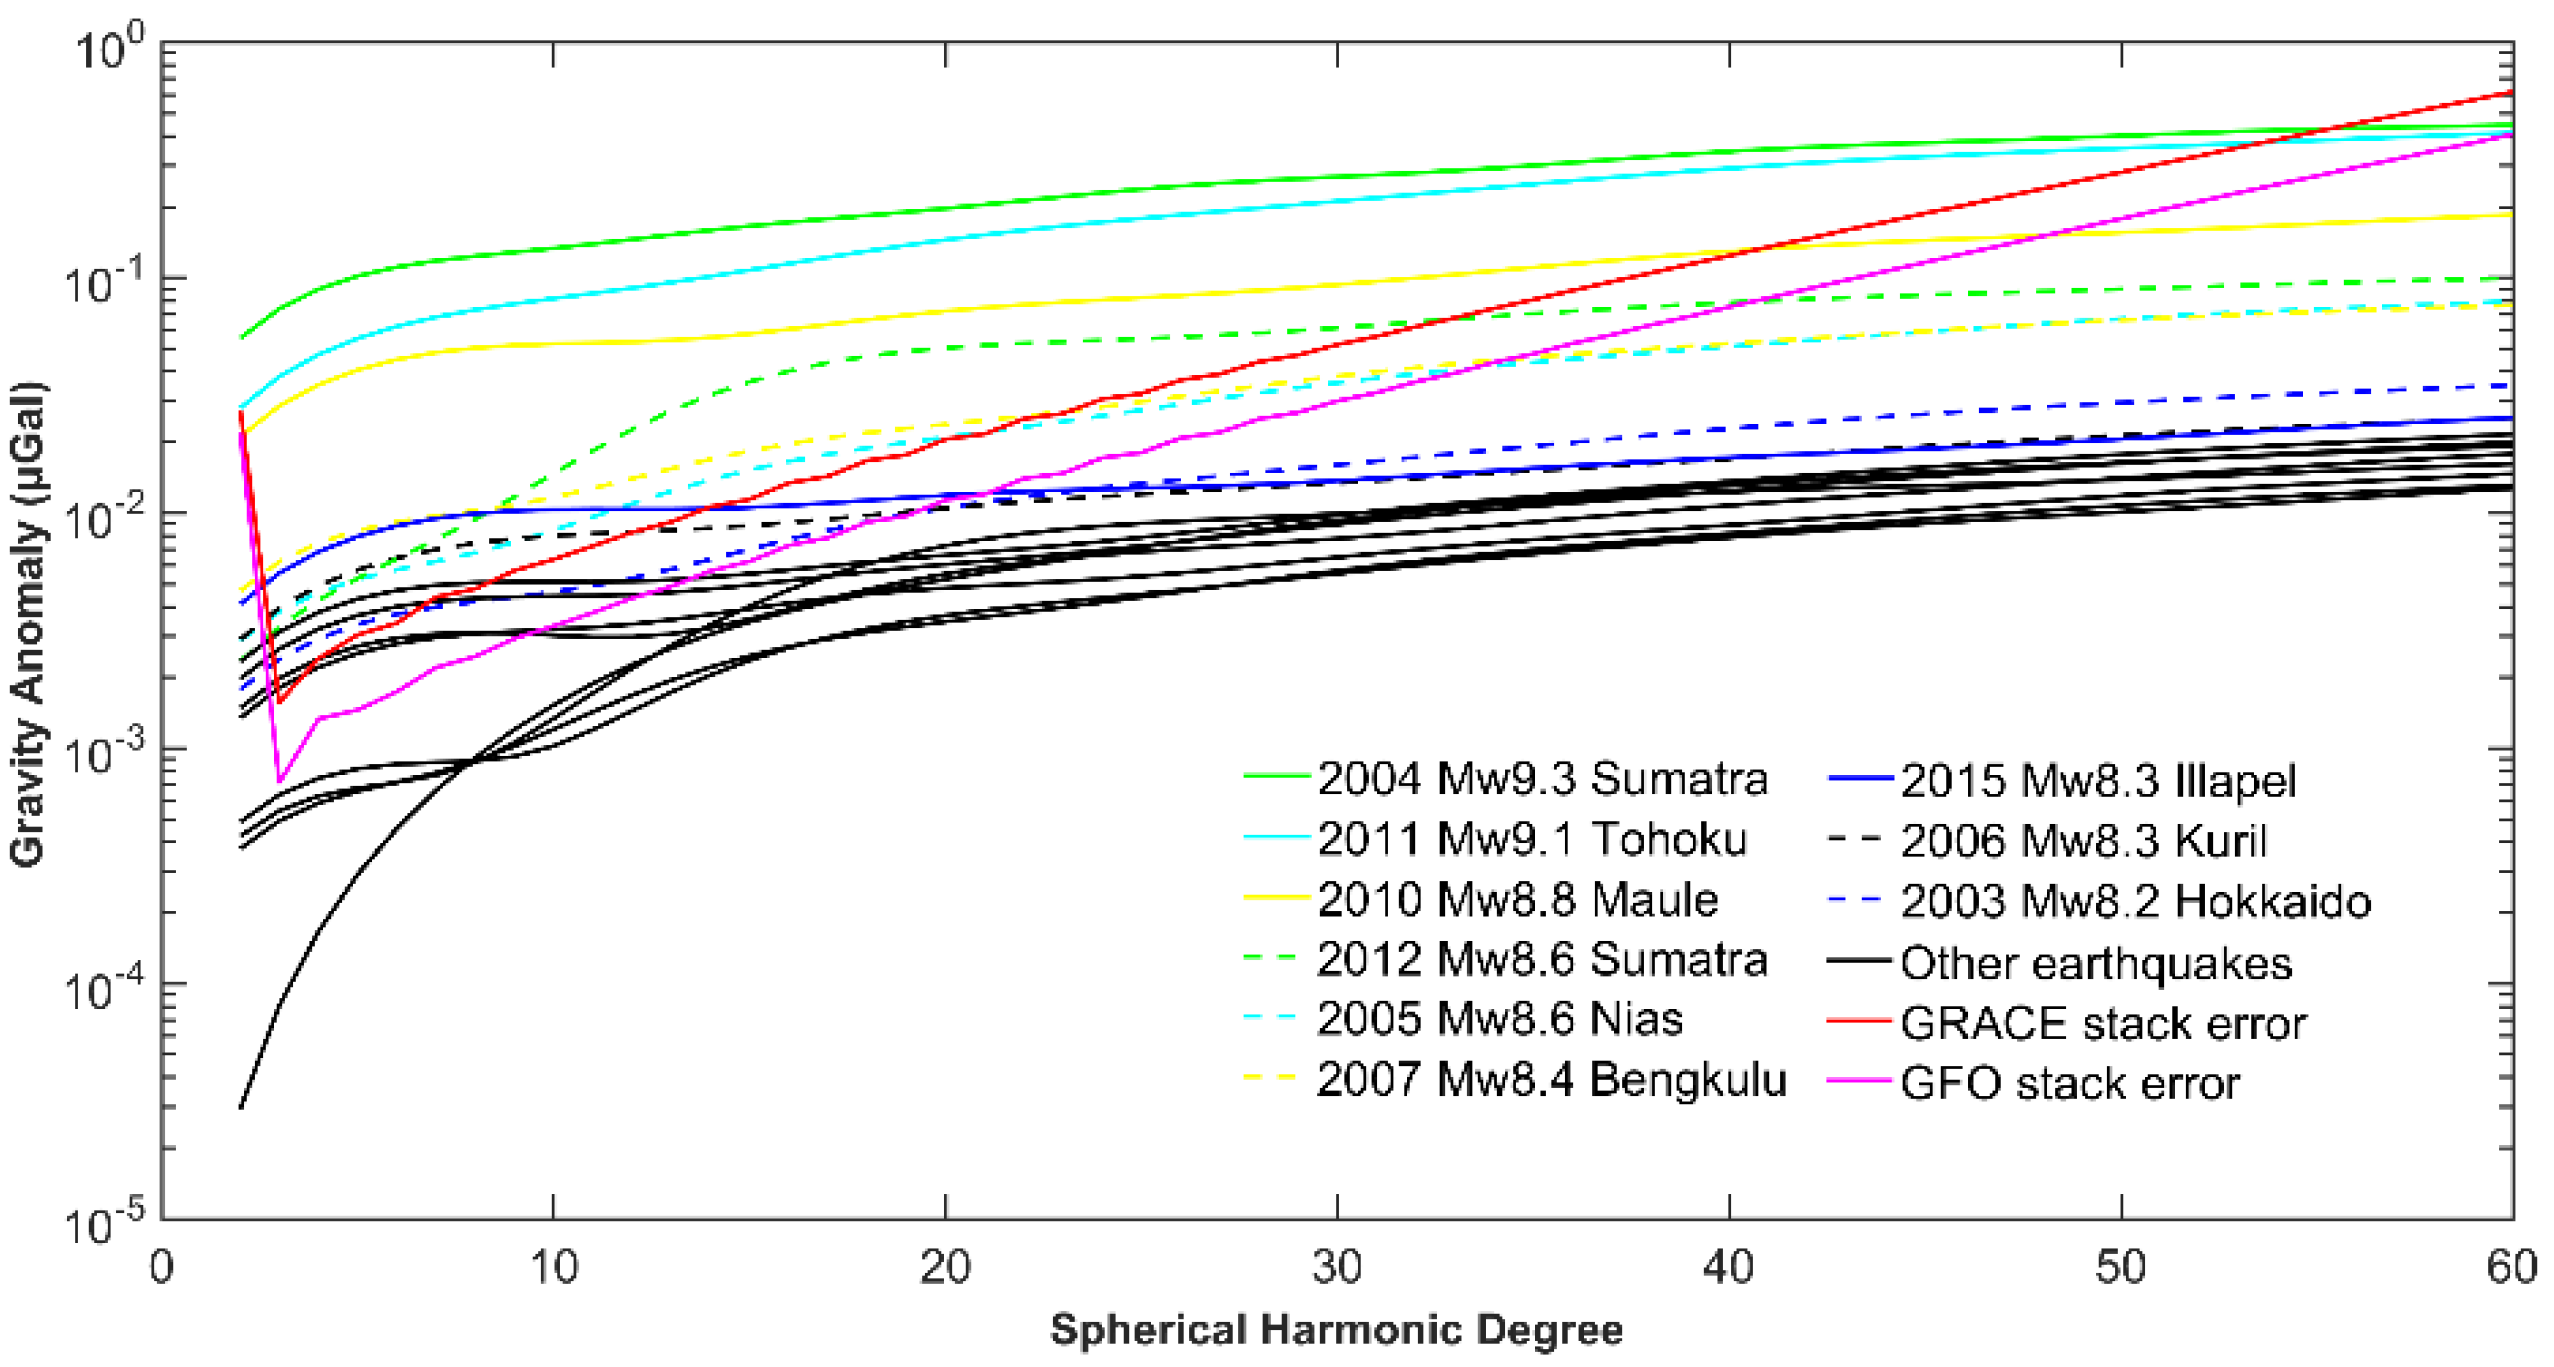
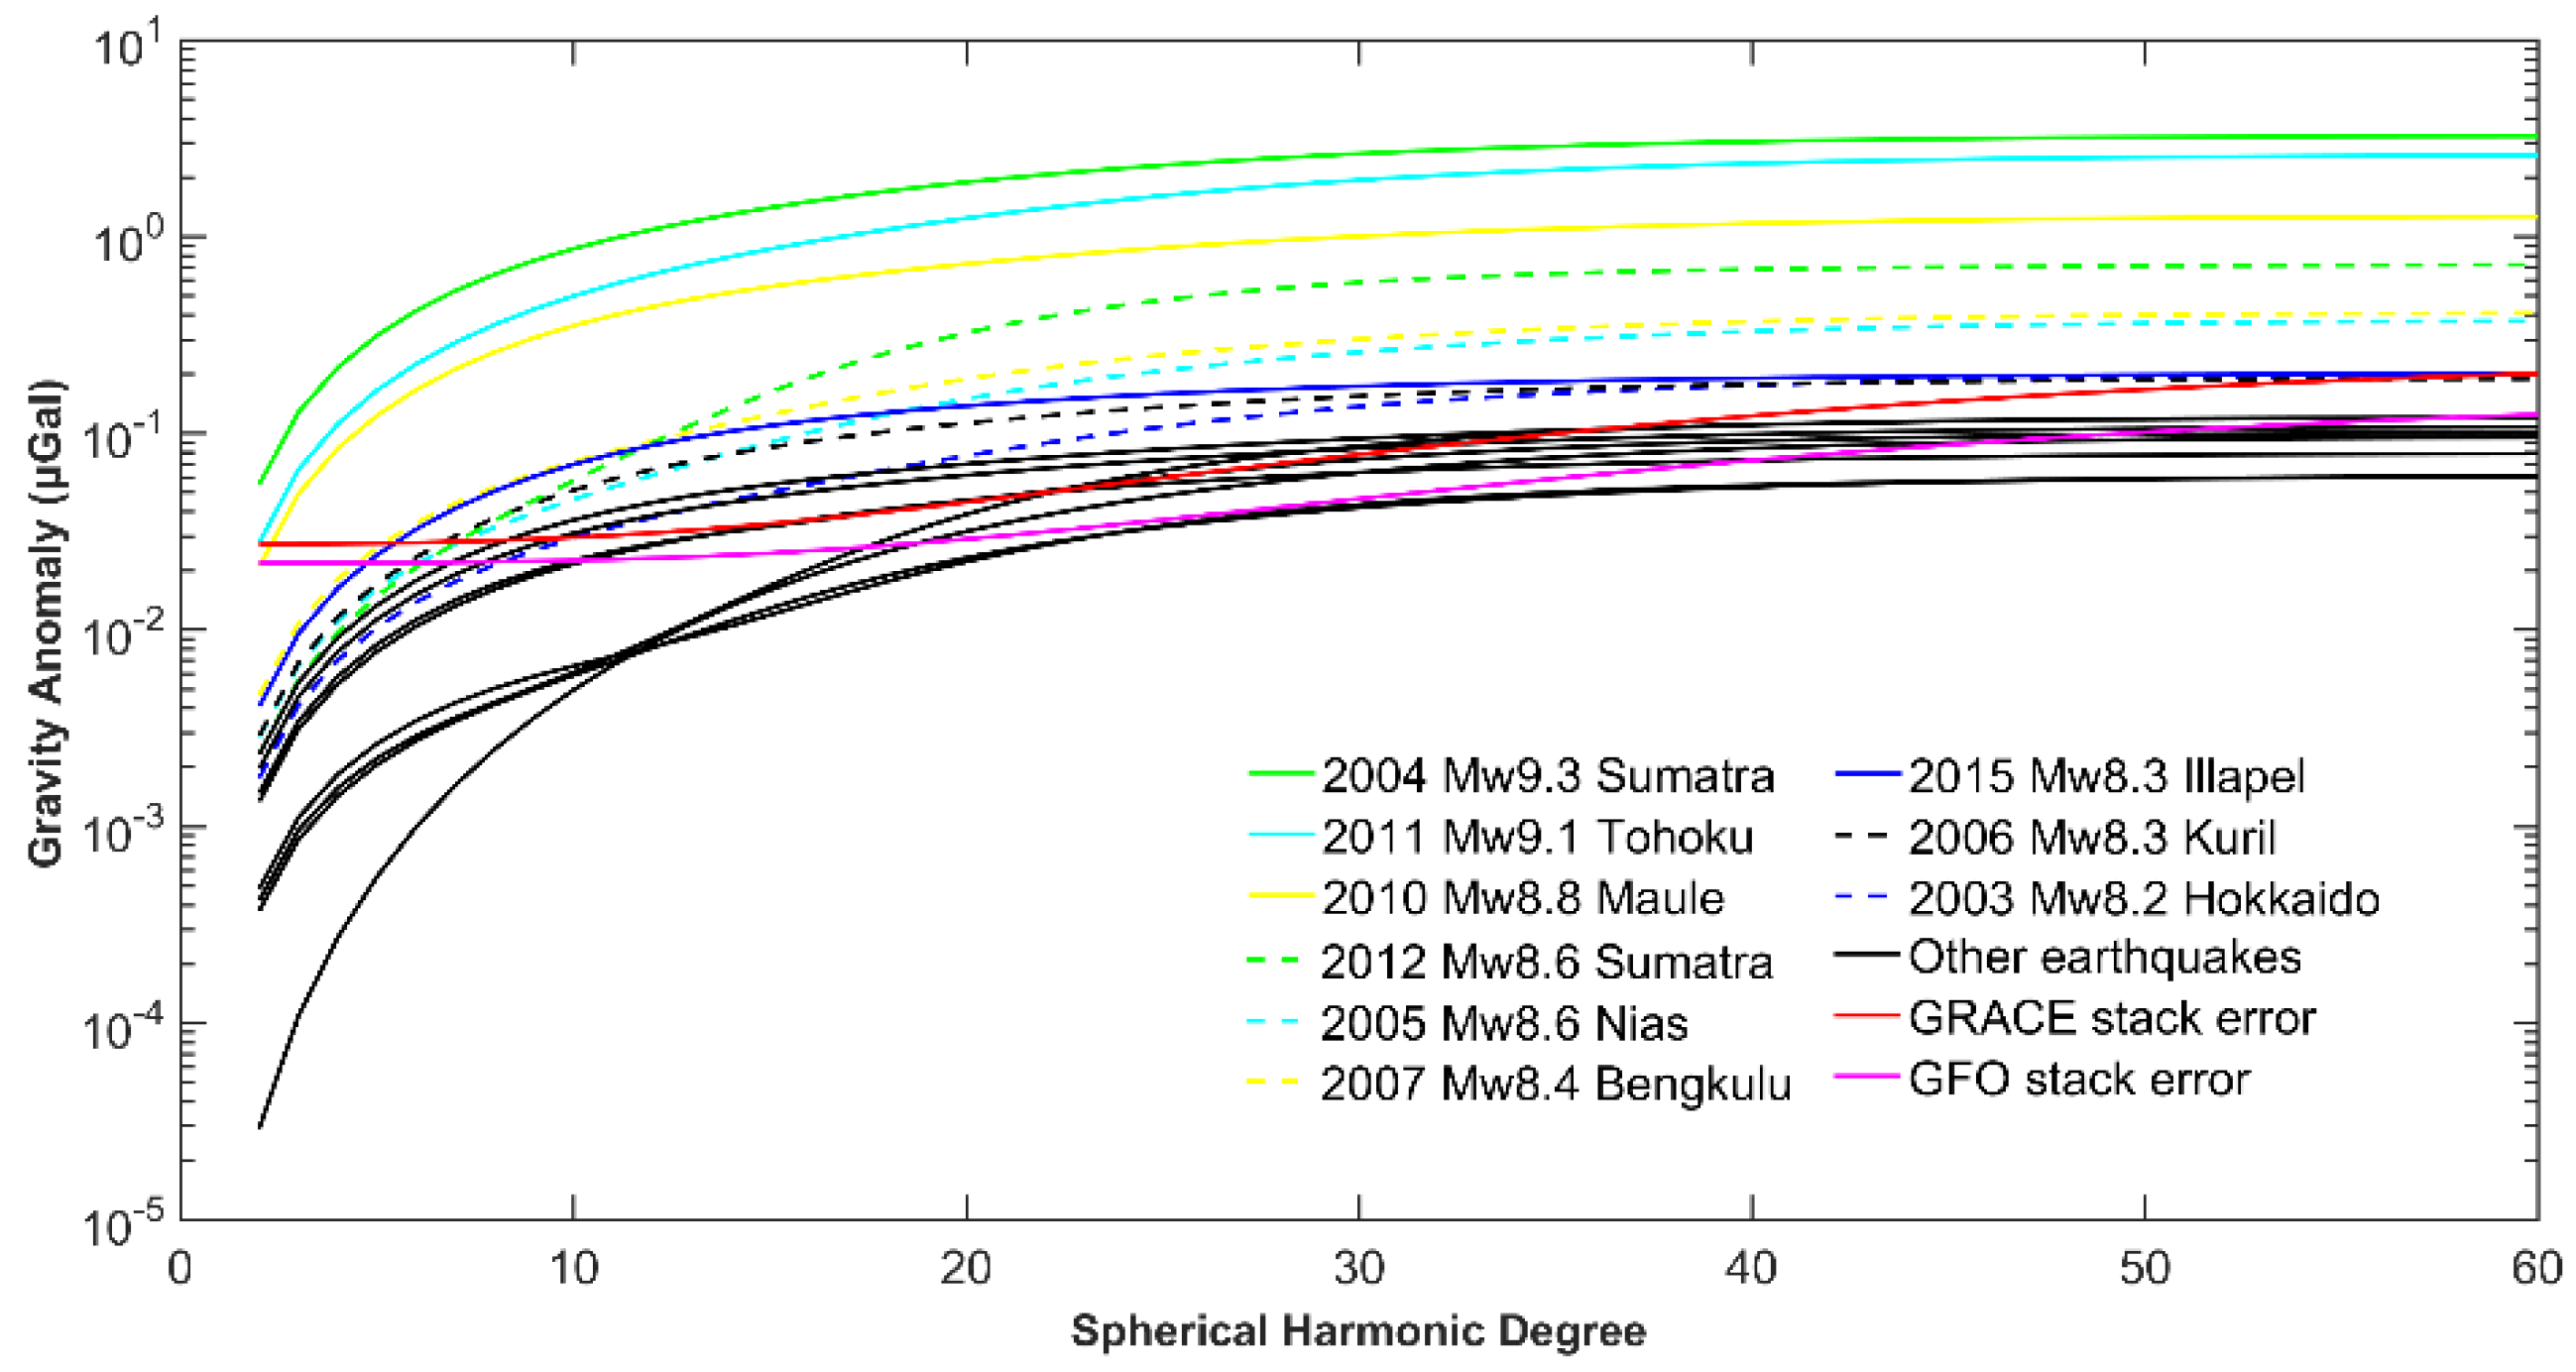
Coseismic gravity variations of earthquakes above Mw8.0 were derived by the method introduced in Section 2.1, and then further expanded to SH coefficients up to degree 60. Figure 4 shows the distributions of model prediction and GRACE model errors in terms of degree. The red solid line is the GRACE stack error curve calculated by the average error stds of GRACE RL06 163 monthly models based on the error propagation law, while the magenta solid line is the GFO stack error curve calculated by GFO 24 monthly models. The other lines are the degree variance distribution curves of signals of earthquakes above Mw8.0.
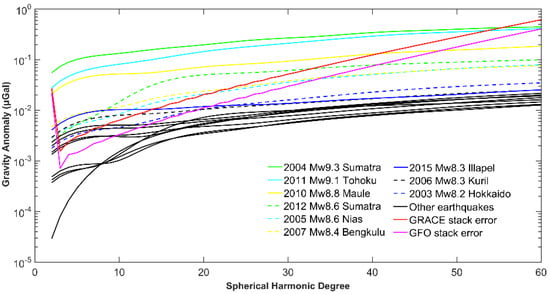
Figure 4.
Degree amplitude spectra for GRACE/GFO stack error and model-predicted coseismic gravity of earthquakes above Mw8.0 during GRACE mission.
According to Figure 4, the amplitude distribution of degree variances of 2004 Mw9.1 Sumatra–Andaman (green solid line) and 2011 Mw9.0 Tohoku (cyan solid line) are one order of magnitude larger than the GRACE stack error (red solid line) less than degree 30, and essentially in the same order of magnitude after degree 60. This indicates that GRACE was able to detect the above two earthquakes [10,15]. The magnitude of 2010 Mw8.8 Maule (yellow solid line) is larger than the magnitude with the GRACE stack error less than degree 40, and that of 2012 Mw8.6 Indian Ocean (green dotted line) is larger than the GRACE stack error less than degree 30. The amplitude distribution of the 2012 Indian Ocean event should be stronger than that in Figure 4, since this event was in fact Mw8.6 + Mw8.2 and the equivalent magnitude of the two events would be Mw8.7. Therefore, GRACE is able to detect the 2010 Maule and 2012 Indian Ocean events [14,19]. In the first 20 degrees, the coseismic degree variances of 2005 Mw8.6 Nias (cyan dotted line) and 2007 Mw8.4 Bengkulu (yellow dotted line) are larger than the errors of the stacking method, and they have the same order of magnitude as the stack error in the first 40 degrees, which is consistent with Han et al. [17]. This means that it is possible to detect the coseismic signals of these two earthquakes by improving the SNR. For example, Panet et al. [11] extracted the coseismic signal of 2005 Mw8.6 Nias by wavelet analysis; Zheng et al. [18] extracted the 2007 Mw8.4 Bengkulu signal by the time series analysis method; and Chao et al. [22] extracted the coseismic signals of the above two earthquakes by using the EOF method.
The amplitude distribution of degree variances of 2015 Mw8.3 Illapel (blue solid line) is similar to that of 2005 Mw8.6 Nias and 2007 Mw8.4 Bengkulu in the first 15 degrees, whereas the spectral amplitude is reduced by half an order of magnitude after degree 15, which leads to the failure of the detection of this earthquake. The spectral amplitude of other events is apparently smaller than the GRACE stack error, so it is difficult to detect the corresponding signals in practice. Note that the results of the 2003 Mw8.2 Hokkaido event show almost the same characteristics as those given by Sun and Okubo [8].
The method of truncation and spatial filtering is used to improve the SNR due to the low SNR of the high-degree part of the gravity field models, and 300 km Gaussian filtering is conducted to smooth the coseismic signals and model errors. Figure 5 depicts the amplitude distribution of cumulative degree variances and with a 300 km Gaussian filter. The cumulative degree amplitude spectra of earthquakes detected in practice are within degree 60 (i.e., 2004 Mw9.1 Sumatra–Andaman, 2005 Mw8.6 Nias, 2007 Mw8.4 Bengkulu, 2010 Mw8.8 Maule, 2011 Mw9.0 Tohoku and 2012 Mw8.6 Indian Ocean), in which the coseismic signals are clearly greater than the GRACE stack errors. The 2003 Mw8.2 Hokkaido, 2006 Mw8.3 Kuril and 2015 Mw8.3 Illapel events are close to the GRACE stack errors at the 60th degree, and the other earthquakes are nearly half an order of magnitude smaller than the stack errors. Therefore, the precision of the GRACE monthly model needs to be improved by one order of magnitude in order to detect earthquake events above Mw8.0 without considering the influence of other factors.
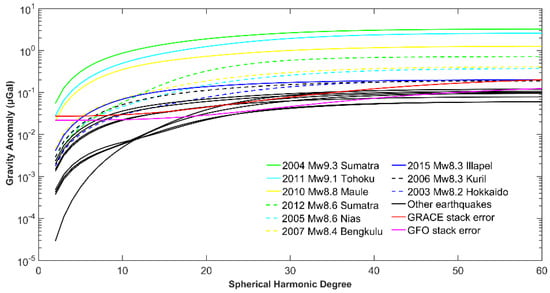
Figure 5.
Cumulative degree amplitude spectra for GRACE/GFO stack errors and model-predicted coseismic gravity of earthquakes above Mw8.0 during GRACE mission.
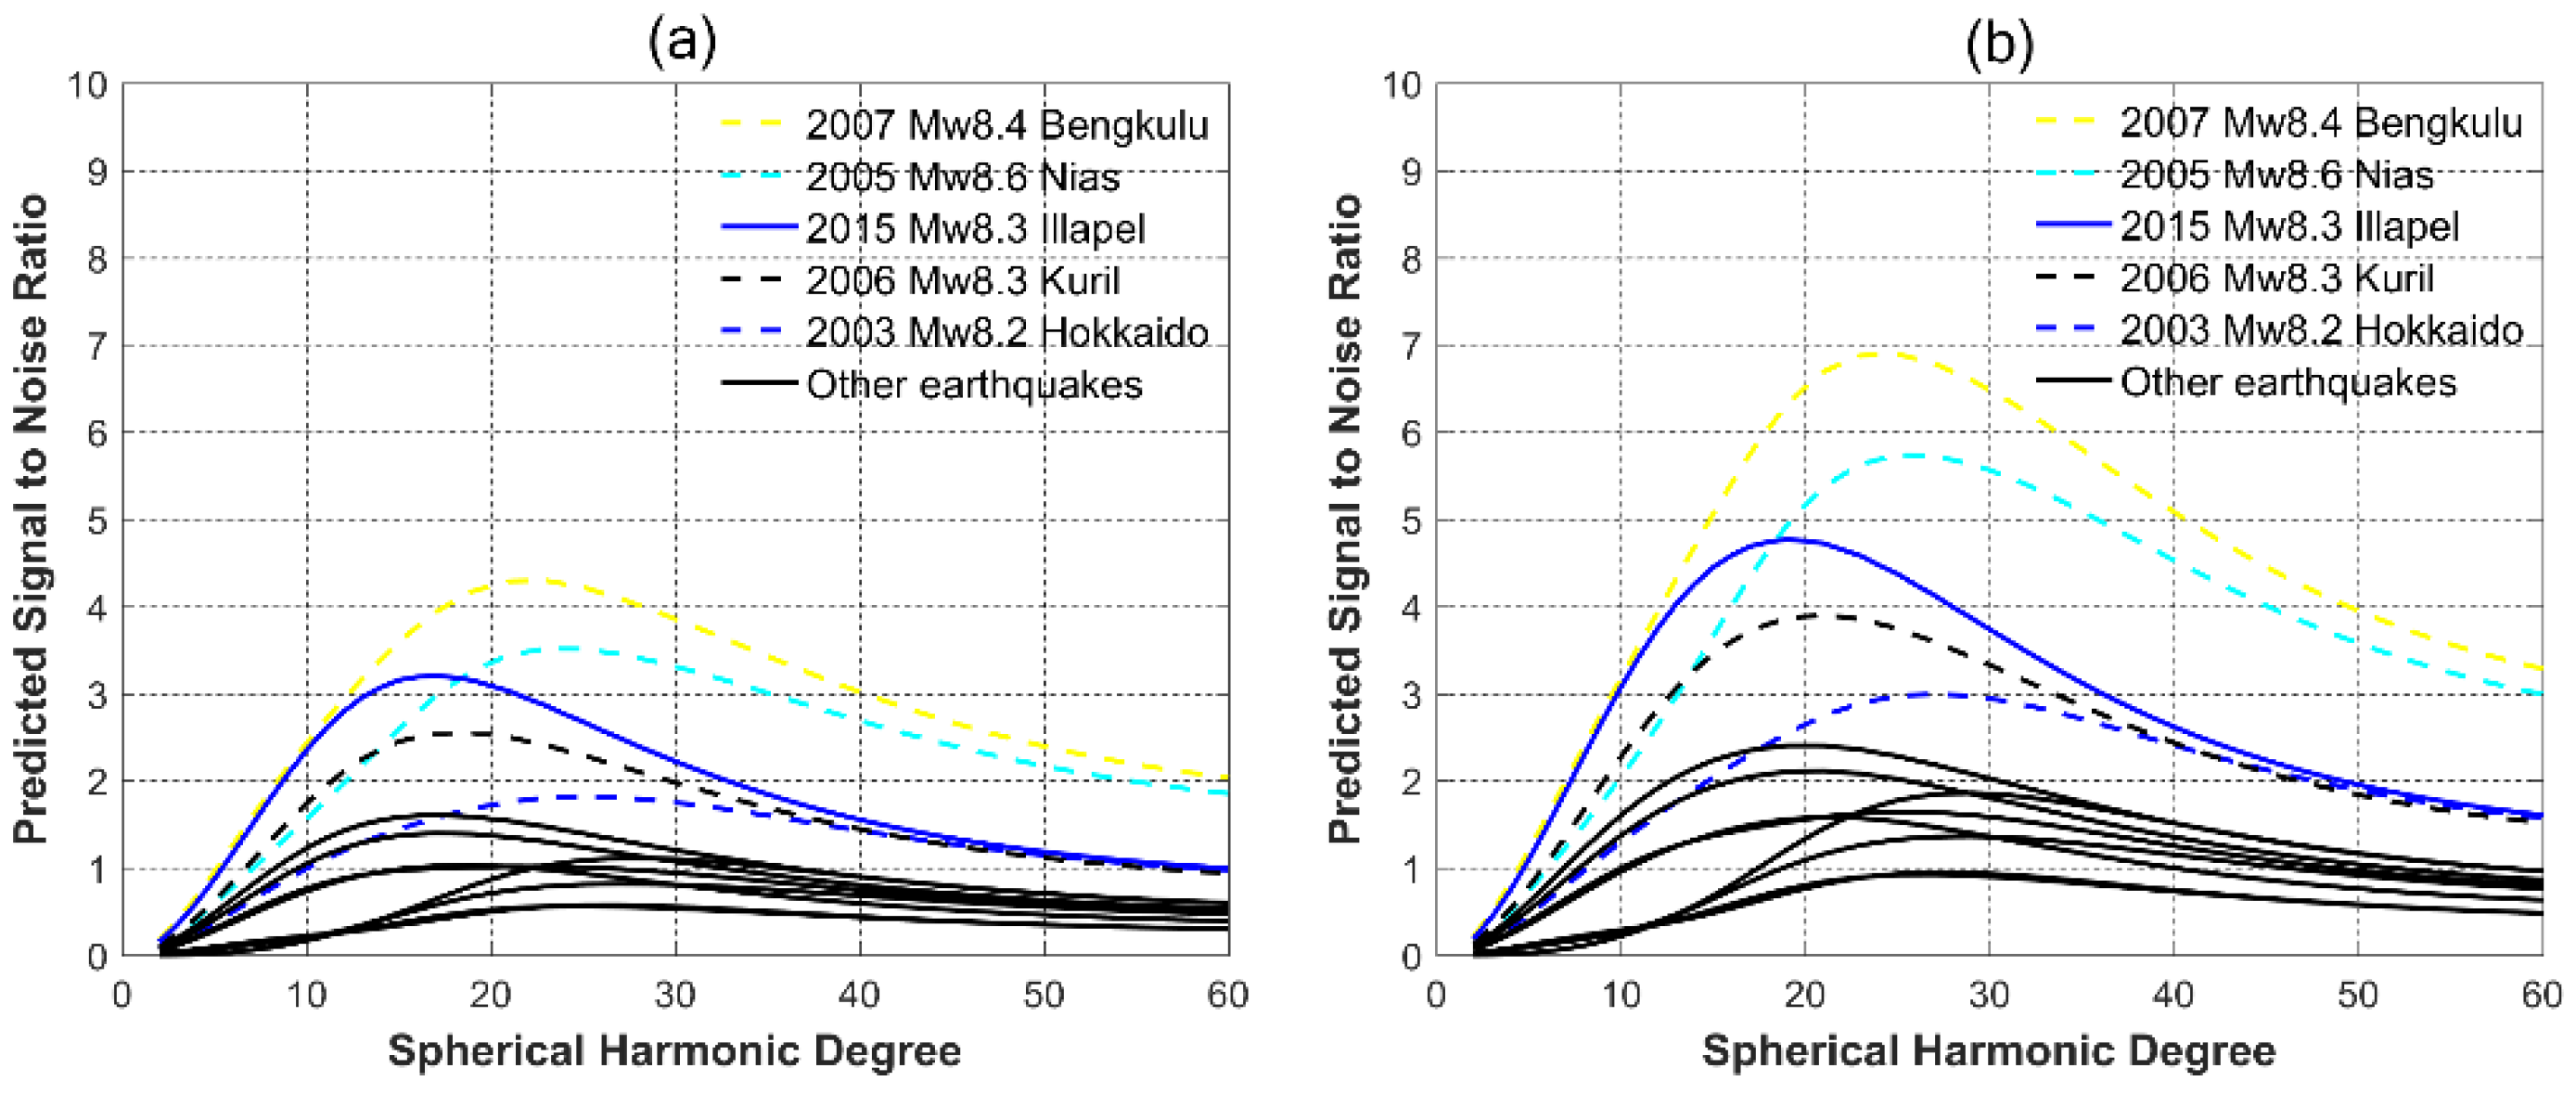
The cumulative degree variance amplitudes of the 2004 Mw9.1 Sumatra–Andaman, 2010 Mw8.8 Maule, 2011 Mw9.0 Tohoku and 2012 Mw8.6 Indian Ocean earthquakes are significantly greater than the errors of the stacking method at degree 60, and other earthquakes are equal to or smaller than the errors. In order to further compare the magnitudes between other coseismic signals and GRACE errors, the ratios of the model predictions to the cumulative stack errors (i.e., SNR) in the spectral domain are derived as shown in Figure 6a. Please note that the SNRs of the 2004 Mw9.1 Sumatra–Andaman, 2010 Mw8.8 Maule, 2011 Mw9.0 Tohoku and 2012 Mw8.6 Indian Ocean earthquakes are not presented in Figure 6a, because the values of these earthquakes are significantly larger than those of other earthquakes. According to this figure, the high SNR of coseismic changes is mainly distributed in the low degrees, and the distribution and peak position of SNR for different earthquakes are different due to the differences in the source mechanism. The 2005 Mw8.6 Nias and 2007 Mw8.4 Bengkulu earthquakes have obviously higher SNR than other earthquakes in Figure 6a. Among the detected earthquakes, the SNR of 2005 Mw8.6 Nias is the smallest. However, it arrives at 1.86 at degree 60, but other earthquakes that have not been detected so far all have an SNR less than or close to 1. It should be noted that, although the SNRs of 2015 Mw8.3 Illapel, 2006 Mw8.3 Kuril and 2003 Mw8.2 Hokkaido earthquakes are all approximately 1, it is difficult to detect the coseismic signals using GRACE time-variable products. This may be caused by the influences of other factors, such as strip errors, hydrological signals, etc., which will be discussed in the next section. Hence, considering the influences of other factors, in order to detect earthquake signals using GRACE products, the SNR needs to be larger than 1 up to degree 60, such as 1.8.
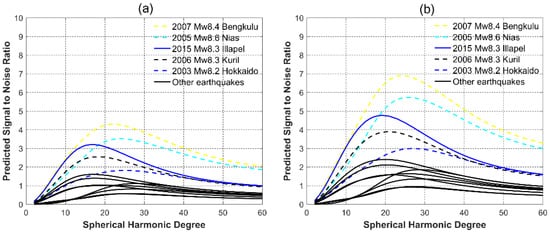
Figure 6.
Ratio of the model-predicted coseismic gravity changes to cumulative stack errors of GRACE (a)/GFO (b) in spectral domain, respectively.
Assuming that the discussed earthquakes occurred during the GFO mission, Figure 6b shows the SNR for the GFO stacking method. The SNR of GFO is clearly higher than that of GRACE (shown in Figure 6a). For example, the SNRs of 2005 Mw8.6 Nias and 2007 Mw8.4 Bengkulu are both around 3.1 at degree 60, and the SNRs of 2015 Mw8.3 Illapel, 2006 Mw8.3 Kuril and 2003 Mw8.2 Hokkaido are 1.61, 1.52 and 1.57 at degree 60, respectively. This means that GFO can detect more earthquake gravity variations than GRACE without considering the influence of other factors.
5. Discussion
5.1. Other Factors on Extraction of Coseismic Signals
The error sources in the extraction of coseismic signals are not only the monthly time-variable gravity field model errors, but also the influence of other factors, such as strip errors, hydrological signals, differences in slip fault models, influences of other earthquakes, etc.
5.1.1. Strip Errors
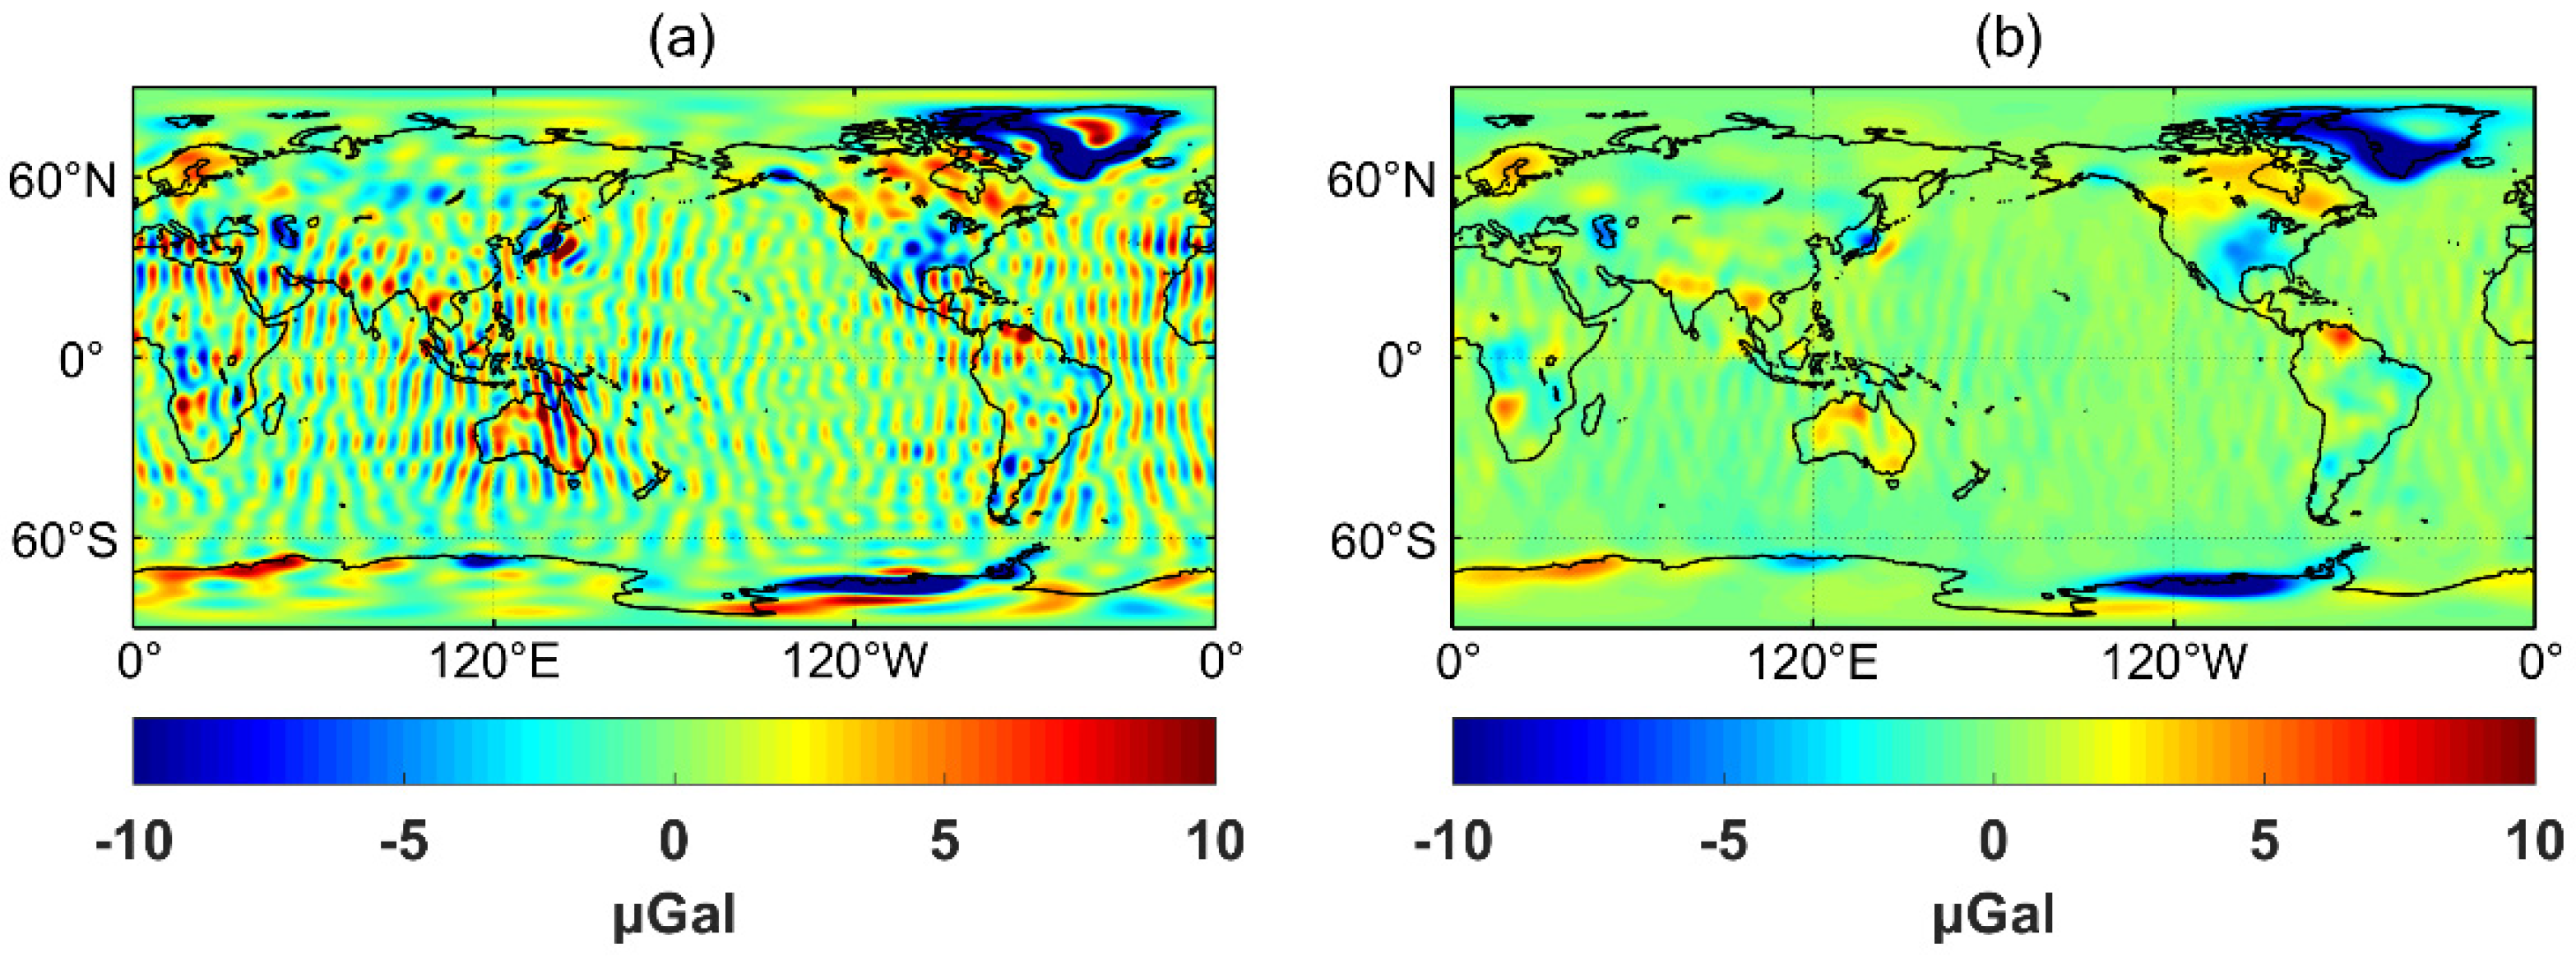
Figure 7 shows the global gravity changes from GRACE observations by the stacking method between the mean signals of 2011 + 2012 and 2009 + 2010. Figure 7a presents the results without any filter and shows obvious “north–south strip” error due to the correlated errors of SH coefficients. As shown in Figure 7b, the strip error was effectively suppressed with 300 km Gaussian smoothing. It should be noted that if a decorrelation filter is also used, the strip error could be better suppressed [28]. However, the signal would also be attenuated or distorted [36,37], and thus a decorrelation filter is not applied in this study.
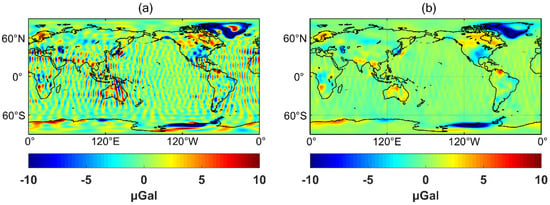
Figure 7.
GRACE global gravity changes between the mean of 2011+2012 and 2009+2010. (a) Without any filter; (b) With 300 km Gaussian smoothing.
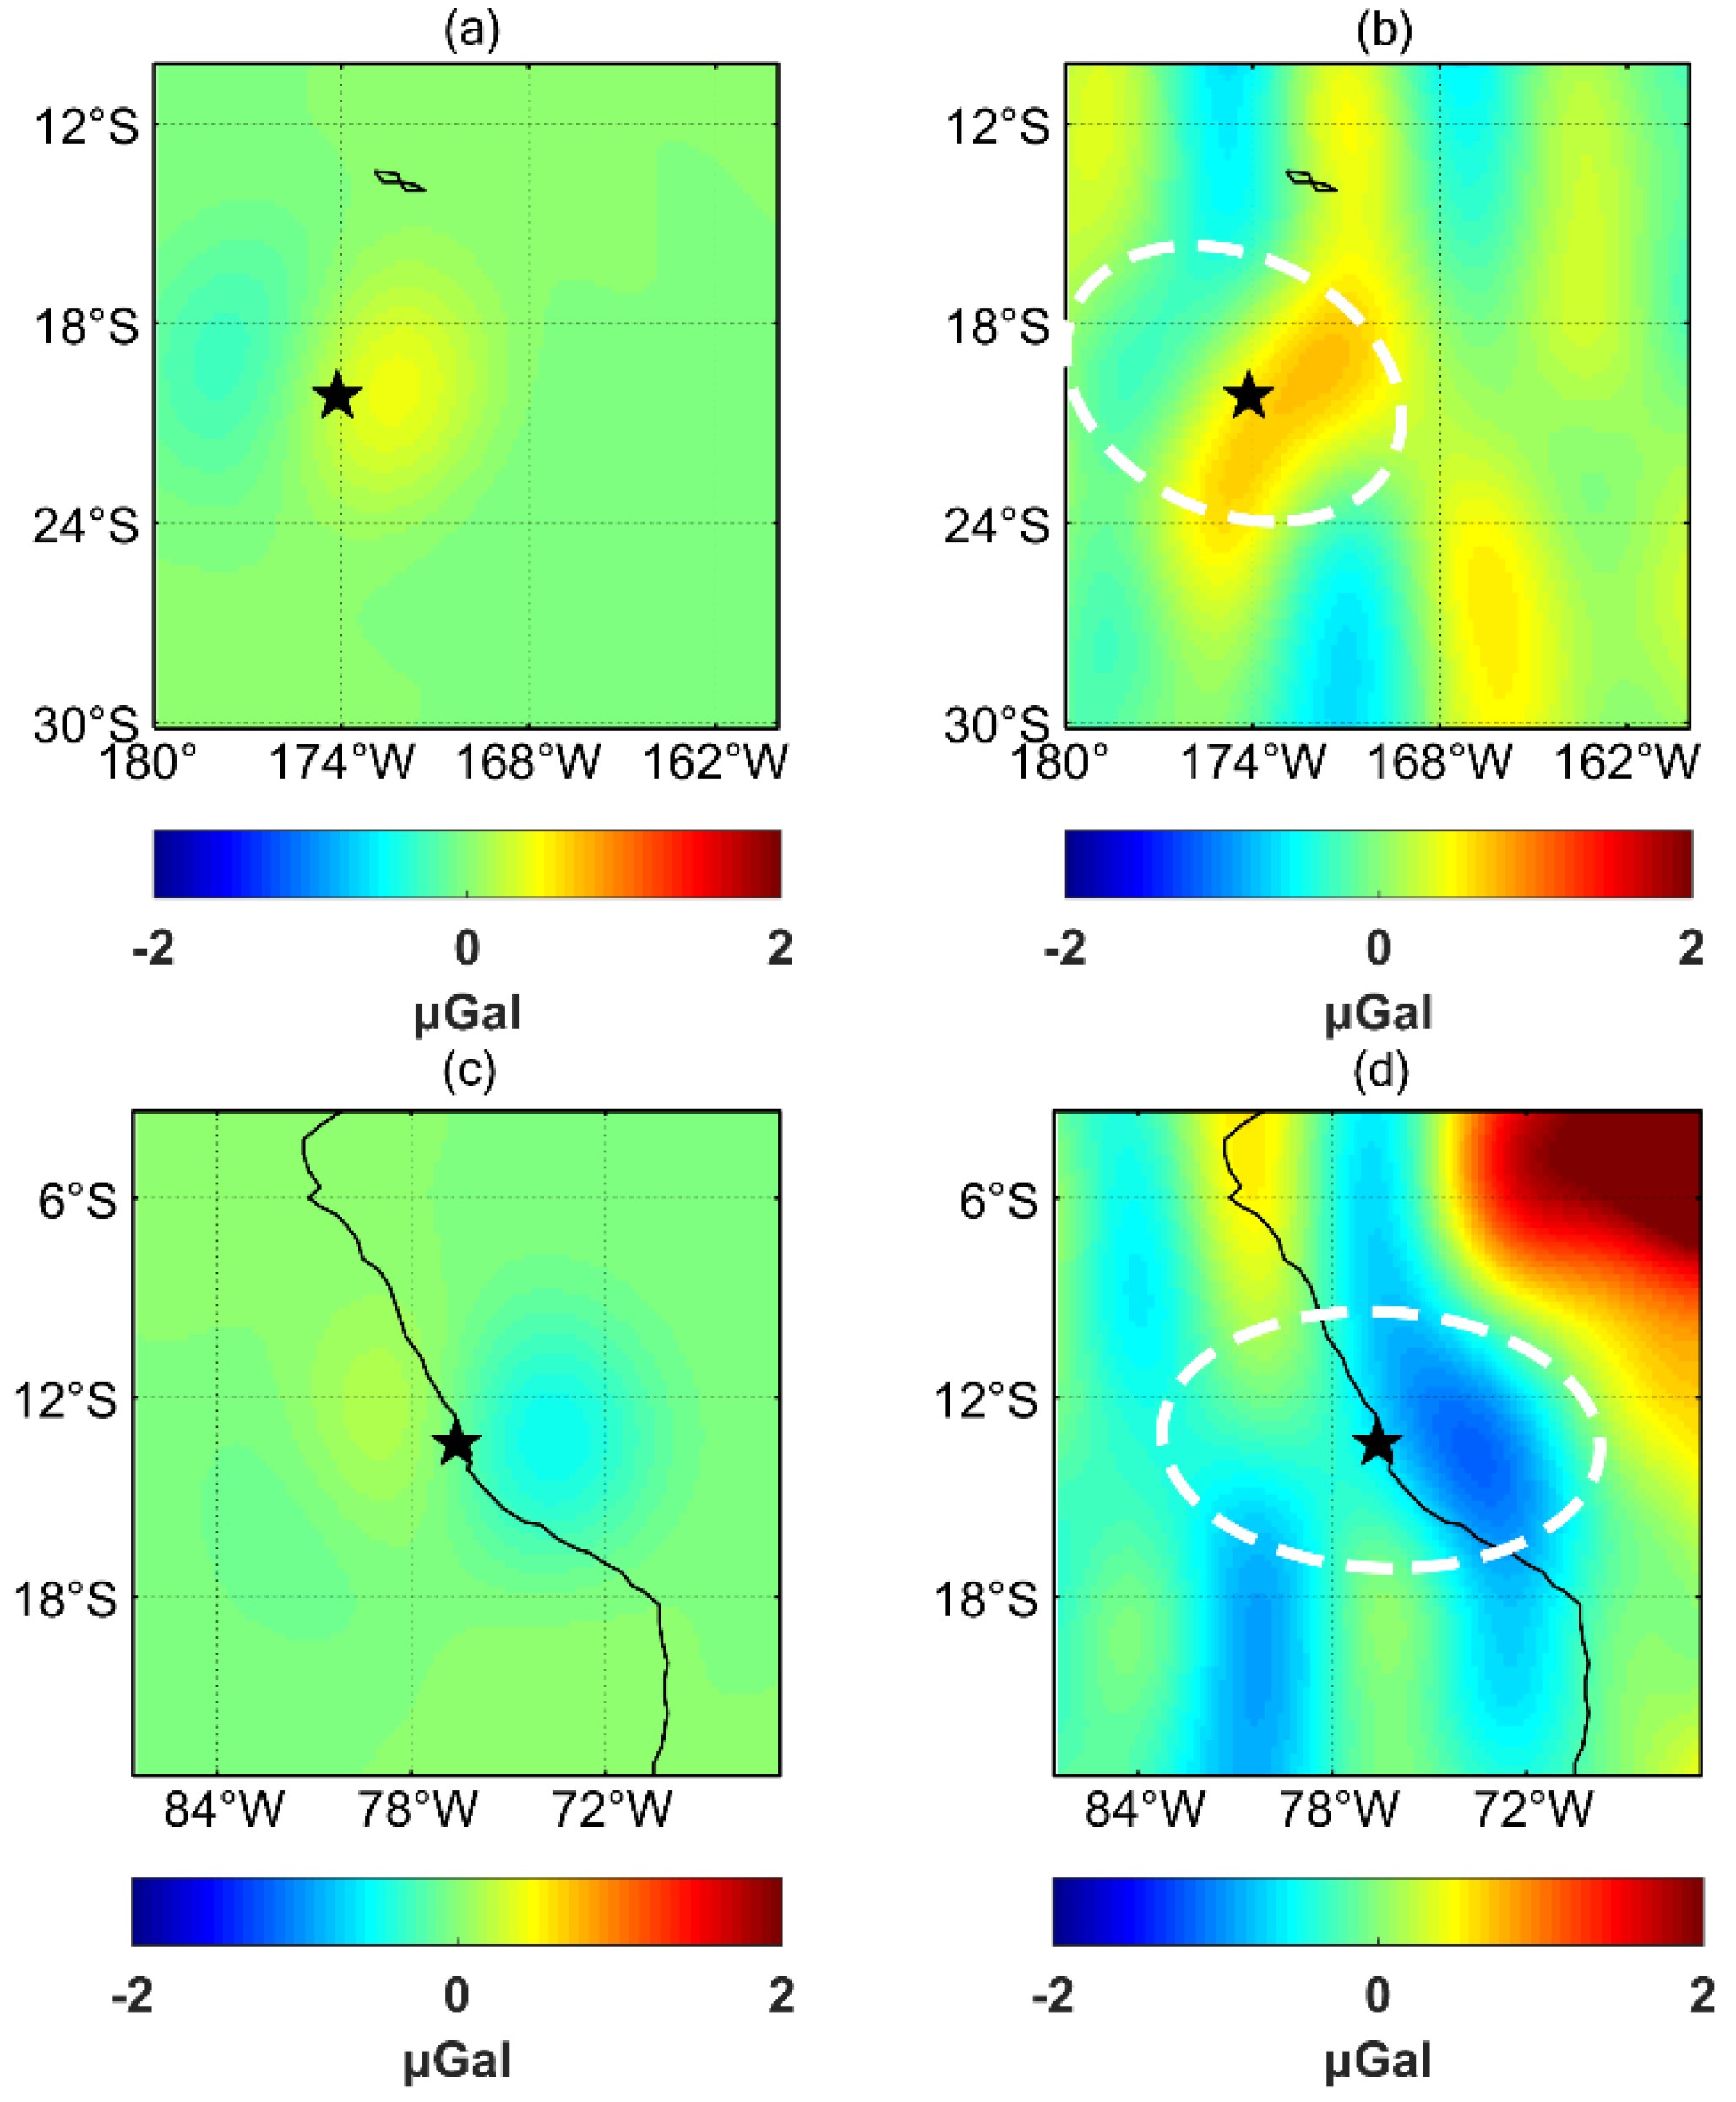
Although the 300 km Gaussian filter is applied, there is still a weak “north–south strip” error (~0.6 µGal). Figure 8a,c show the dislocation model predictions of the 2006 Mw8.0 Tonga and 2007 Mw8.0 Peru fault models, with ranges of −0.28~+0.41 and −0.49~+0.16 µGal, respectively. Compared with the predictions, we can see “similar signals” from GRACE observations (such as the white circles in Figure 8b,d). However, the magnitude of predictions is relatively small and the “signal” amplitude is similar to the nearby strip errors. Therefore, it is difficult to derive the “signal” caused by the 2006 Mw8.0 Tonga and 2007 Mw8.0 Peru earthquakes due to the strip errors. It should also be noted that the magnitude of the strip error, i.e., 0.6 µGal, is close to the magnitude of the mean error of GRACE (see Table 1). This may be the reason that the smallest SNR of the detected earthquakes is around 2.
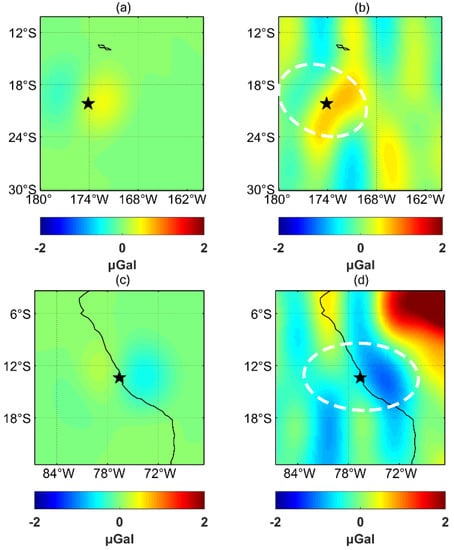
Figure 8.
Coseismic gravity change in the 2006 Mw8.0 Tonga and 2007 Mw8.0 Peru earthquake region, respectively. (a) The dislocation model prediction of 2006 Mw8.0 Tonga. (b) Coseismic gravity changes by stacking method in the 2006 Mw8.0 Tonga region. (c) The prediction of 2007 Mw8.0 Peru. (d) Coseismic gravity changes in Peru region. The white dotted lines represent “similar coseismic signals”.
5.1.2. Influence of Hydrological Signals
This study adopted the plant canopy, soil moisture and snow water of the Global Land Data Assimilation System monthly model (GLDAS, Noah) [41] to derive the changes in terrestrial water storage, which are expanded to SH coefficients truncated to degree and order 60 with 300 km Gaussian filter processing to ensure the consistency of the resolution of the results and the GRACE observations. The residual RMS of GLDAS data are derived by deducting the annual period, semiannual period, trend term and constant term from the initial GLDAS time series from 2002 to 2012. The residual GLDAS are used to evaluate the influence of hydrological signals.
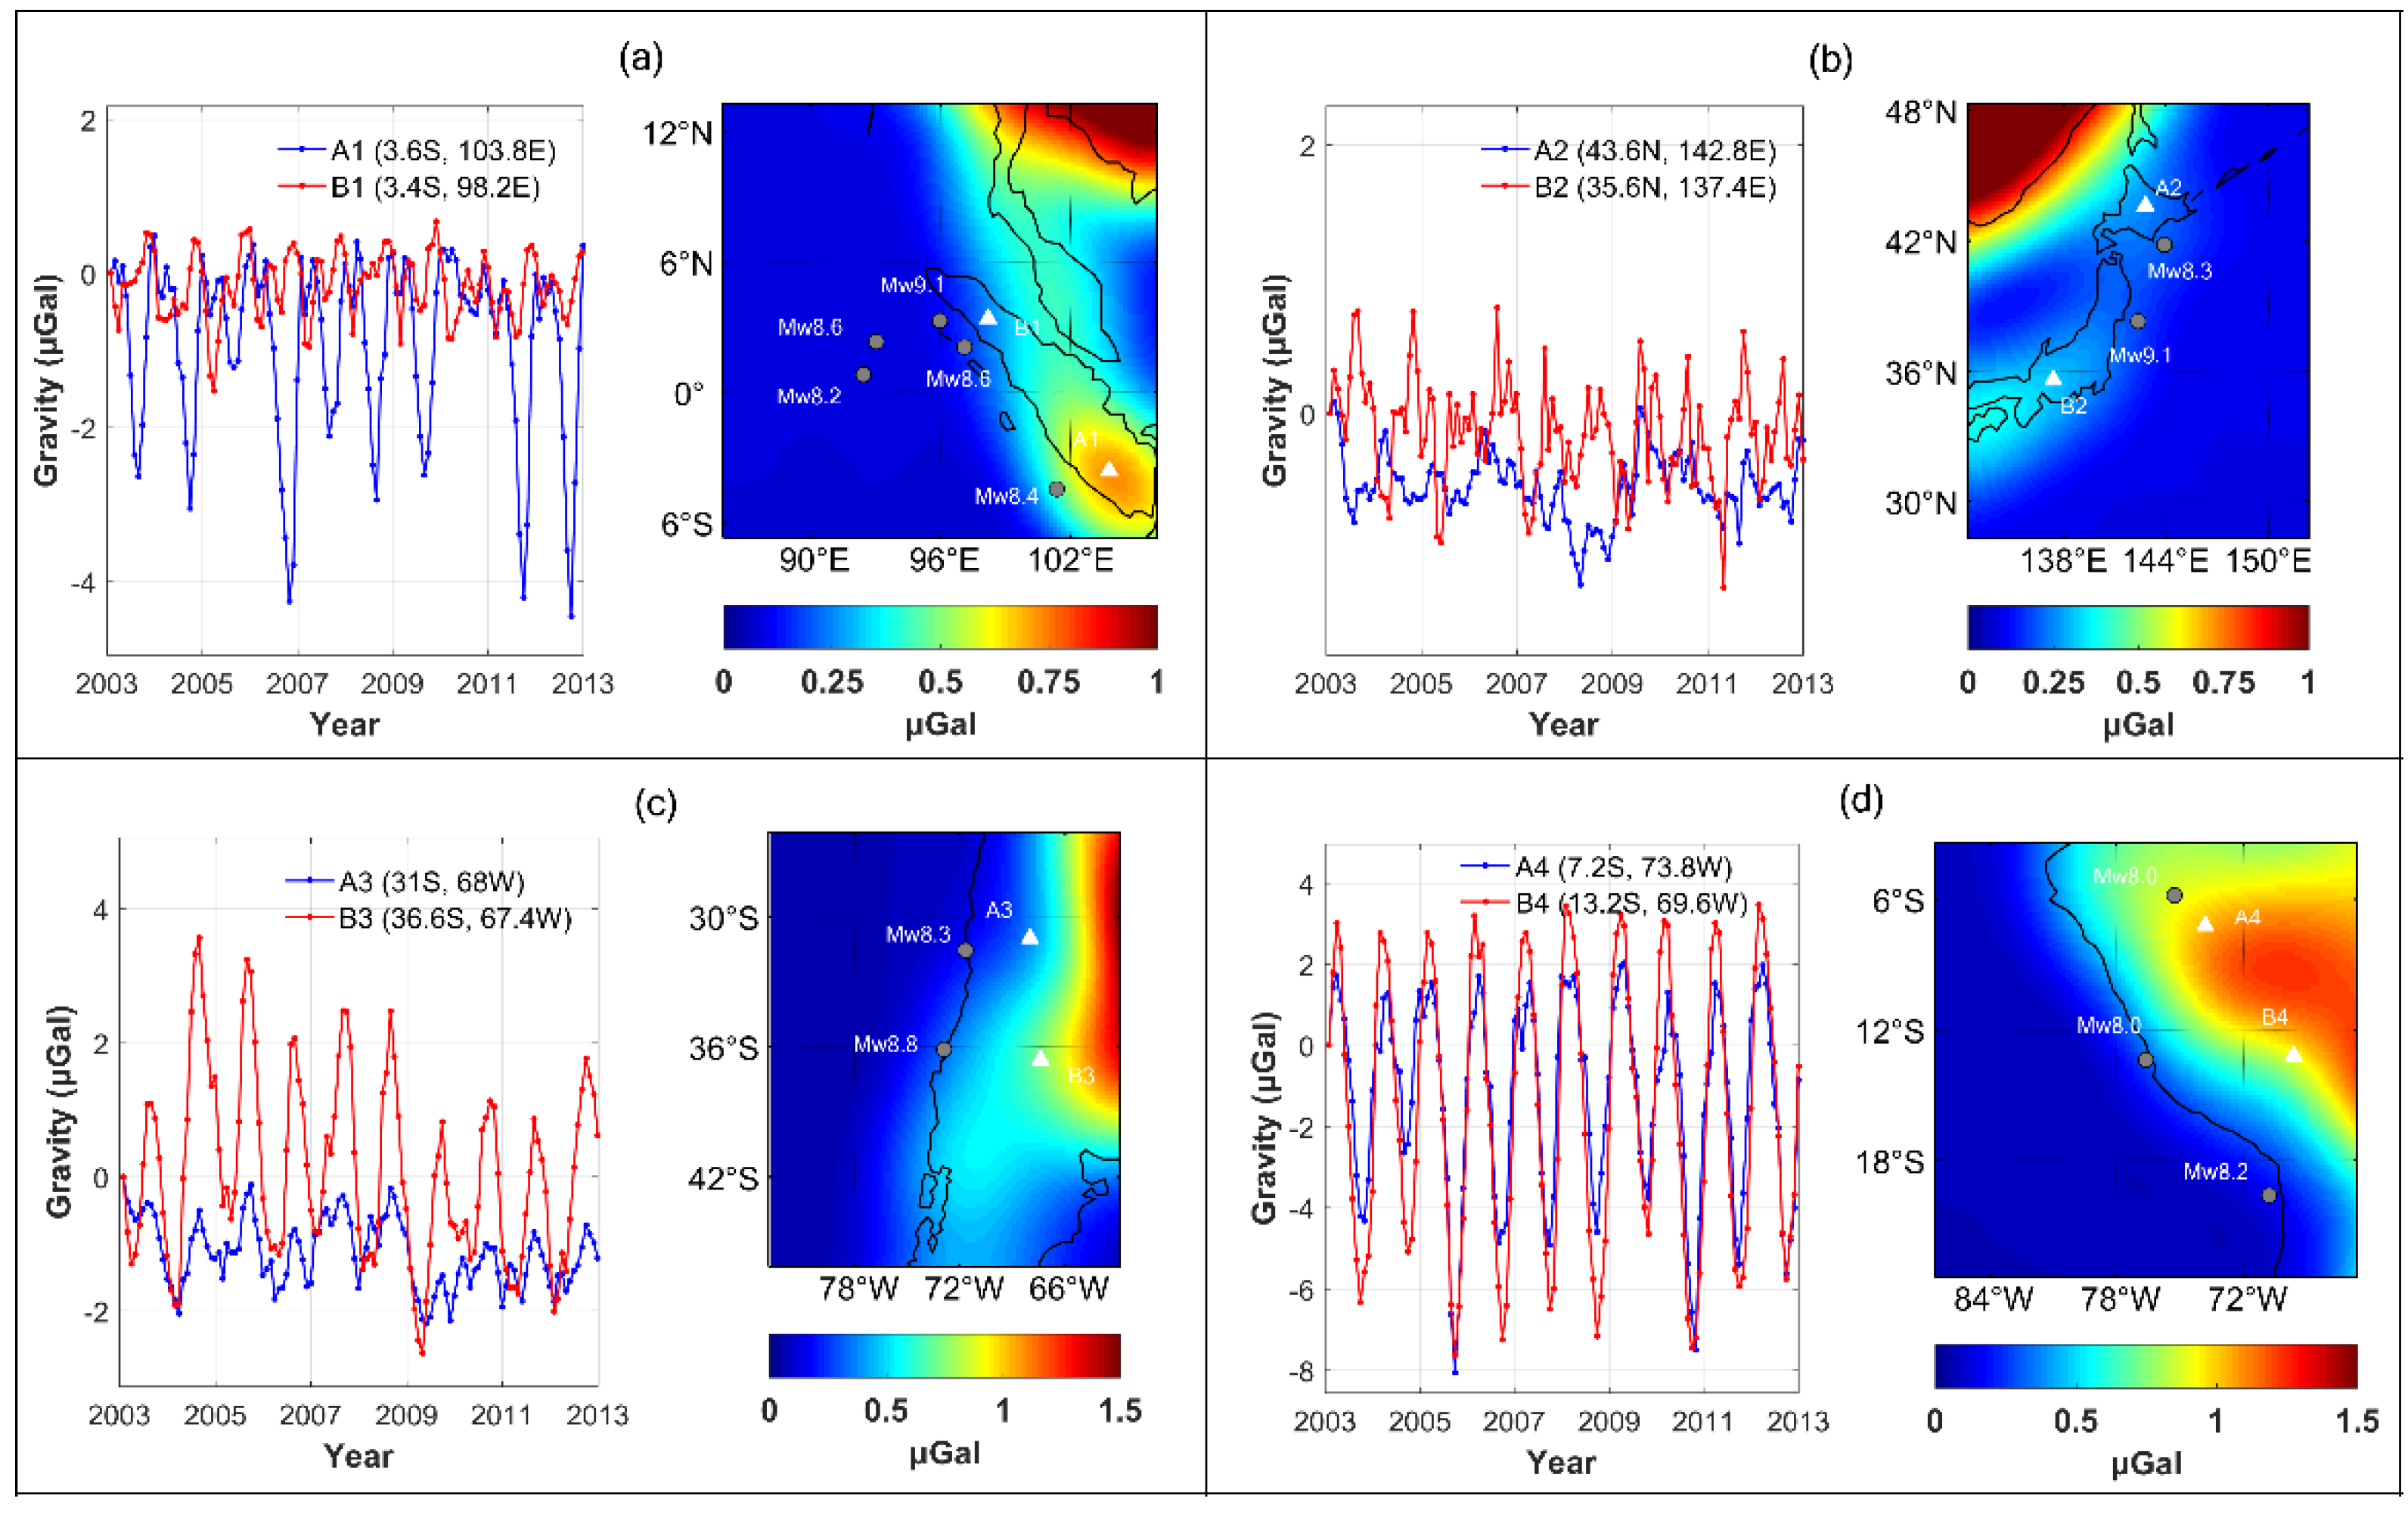
According to Figure 2, most large earthquakes with M ≥ 8 occur near Sumatra, Japan, Chile and Peru. In Figure 9, the left figure shows the gravity change caused by hydrological variations provided by GLDAS at points A and B. The right figure shows the distribution map of GLDAS RMS residuals and marks points A and B with white triangles. Figure 9a exhibits the time series of selected points A1 and B1 in Sumatra, with an obvious annual period (−4.5~+0.7 µGal), and the residual RMS of GLDAS in the Sumatra region is probably below 0.7 µGal. Figure 9b shows the time series of selected points near Japan with peak-to-peak a range of −1.3~0.2 µGal. According to the residual RMS distribution, the hydrological signal level is around 0.4 µGal, which is consistent with Li et al. [42]. Figure 9c,d shows the time series of selected points and RMS variations in Chile and Peru, with the amplitude in the range of −2.6~+3.6 and −8.1~+3.5 µGal, respectively, in which the amplitude variation of the hydrological signal is generally larger than those of Sumatra and Japan. The RMS residuals of these two areas are around 0.7 µGal and 1.2 µGal, respectively, and the error of the GLDAS hydrological model has a significant influence on the extraction of coseismic signals, such as 2015 Mw8.3 Illapel (−0.85 µGal) and 2019 Mw8.0 Peru (−1.1 µGal). Therefore, the interference of land water near the coast of the continental plate (e.g., Chile and Peru regions) is greater than that near the island (e.g., Sumatra and Japan regions), which means that the coseismic gravity change is more difficult to detect near the coasts of continental plates.
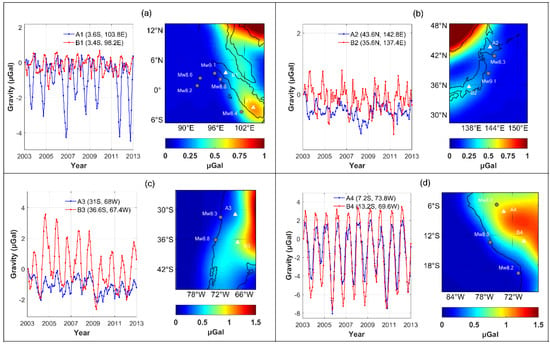
Figure 9.
RMS of GLDAS time series from 2003 to 2013 over the earthquake region. The GLDAS time series corresponding to selected points A and B in the left figure, which are marked with white triangles in the right figure. (a) Sumatra region; (b) Japan region; (c) Chile region; (d) Peru region. Note the colorbar range differs among the subfigures.
5.1.3. Influences of the Differences in Seismic Slip Models
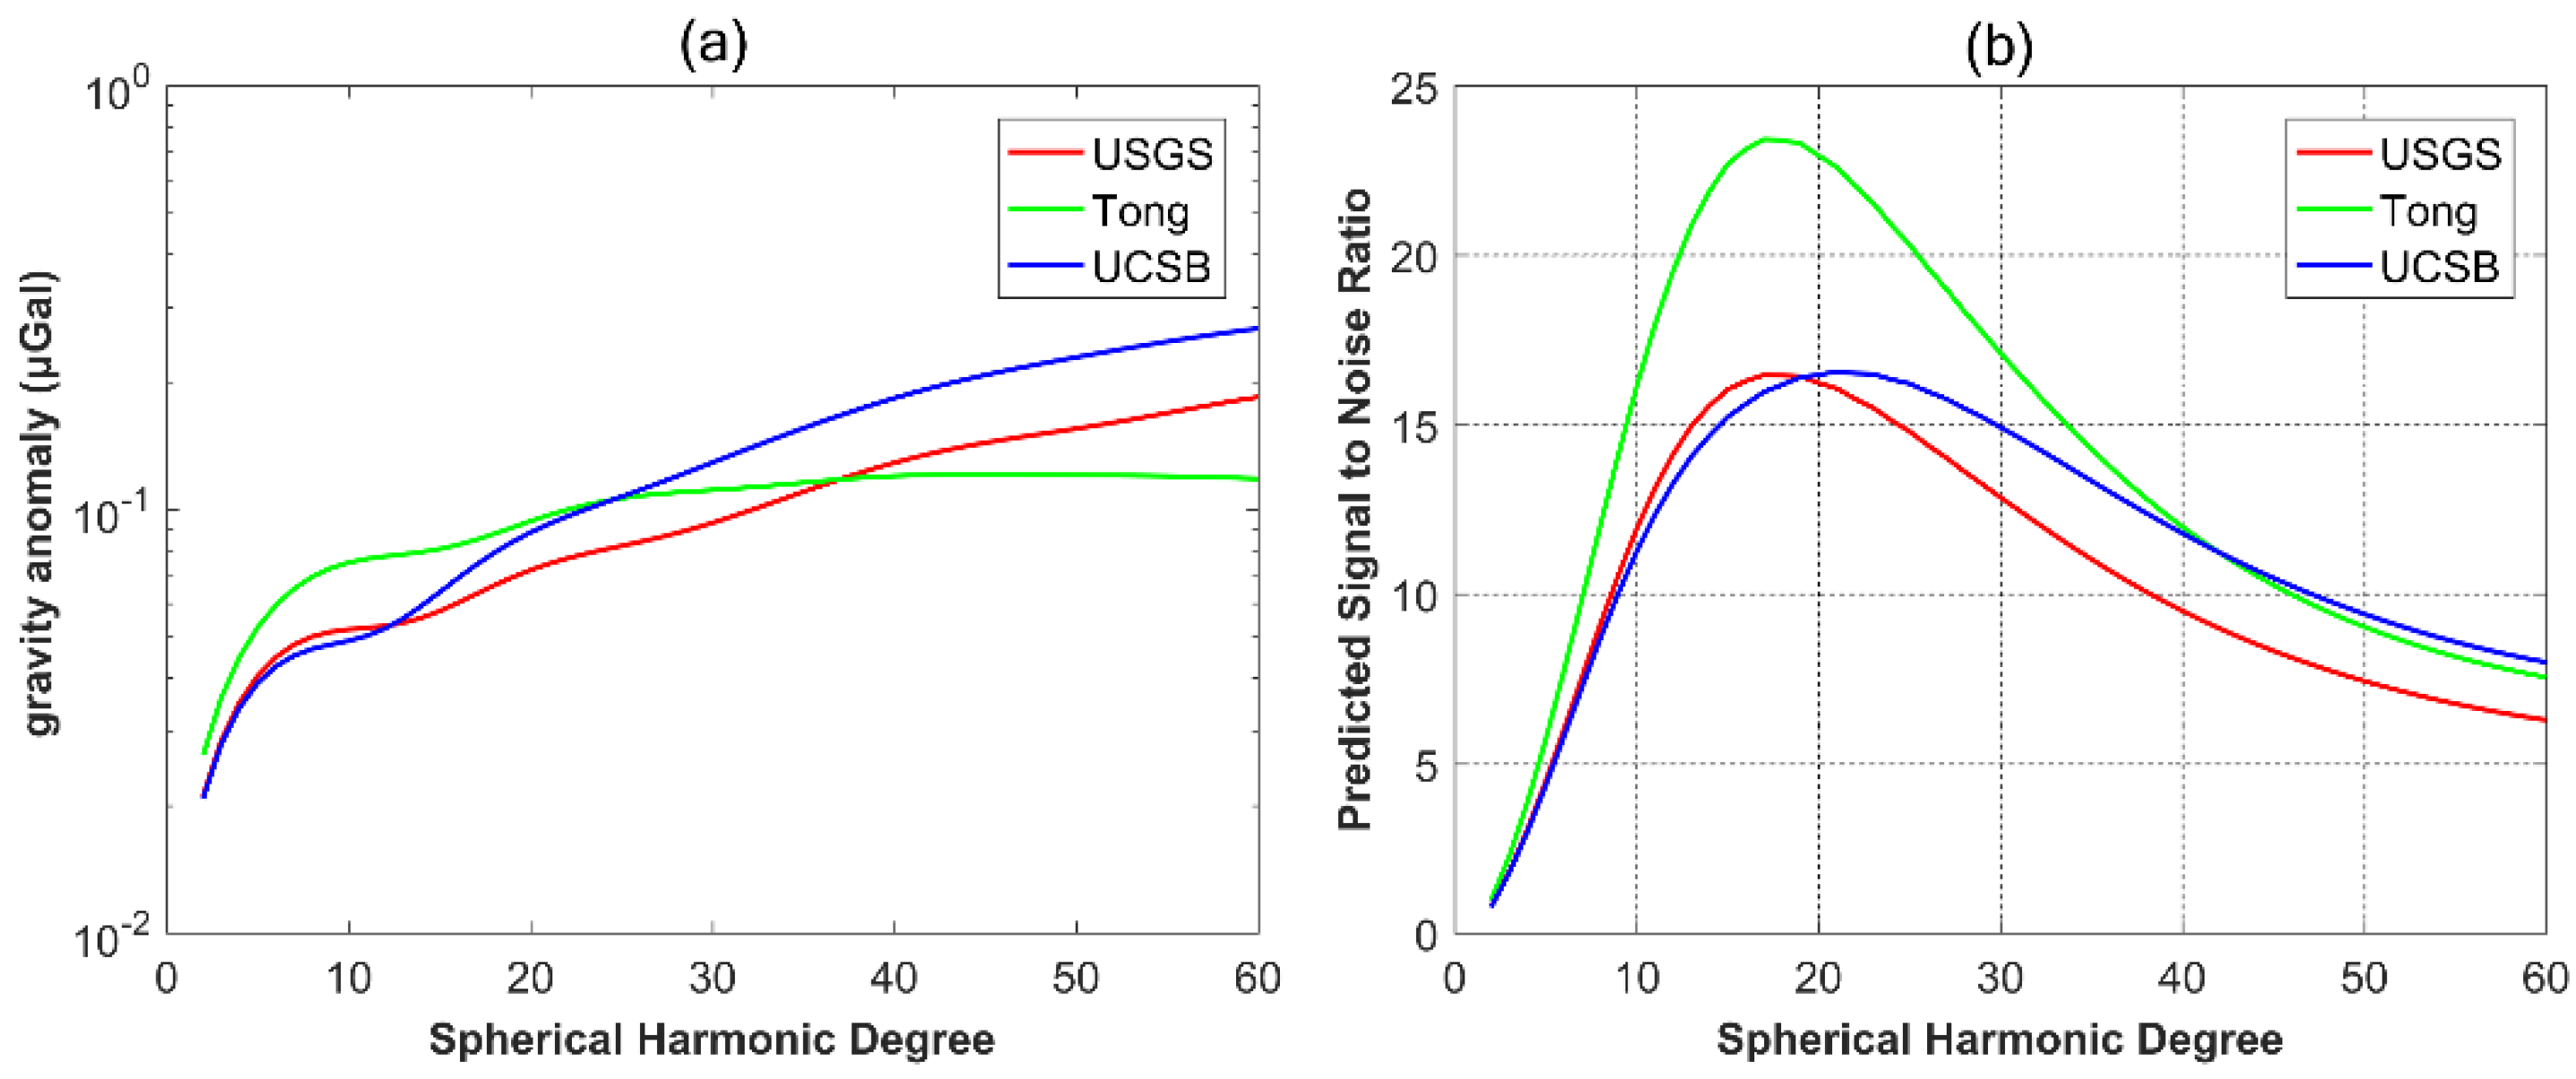
The predictions of fault slip models are different due to differences in both data sources and inversion methods. Figure 10a shows the degree amplitude spectra of 2010 Mw8.8 Maule coseismic gravity changes predicted by different fault slip models (as in Figure 4). According to this figure, the predictions are obviously different due to the different models used. The Tong model [43] has stronger power at a lower degree, but this is lower than other models after degree 35. Moreover, the University of California, Santa Barbara (UCSB) model [44] is larger than other models after degree 22. Figure 10b shows the ratio of the coseismic gravity changes of 2010 Mw8.8 Maule to the cumulative GRACE stack error in the spectral domain (as in Figure 6a). The SNRs of the three models at degree 60 are slightly different after smoothing. Vigny et al. [33] compared the GPS observations and coseismic displacements predicted by the above three models and found that UCSB had the lowest coincidence. However, although these three models lead to different SNRs, all the SNR values are far larger than 1 and thus it is reasonable to suggest that GRACE has the ability to detect the signal of the 2010 Mw8.8 Maule earthquake. Hence, SNR analysis in the spectral domain is helpful in order to verify which earthquakes can be detected by time-variable gravity field products.
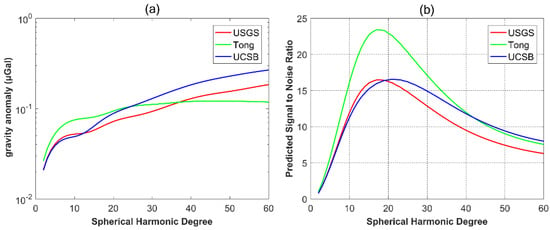
Figure 10.
(a) Degree amplitude spectra of 2010 Mw8.8 Maule coseismic gravity changes predicted by different fault slip models. (b) SNR of 2010 Mw8.8 Maule based on different fault slip models in spectral domain. The red, green and blue lines represent USGS, Tong and UCSB model, respectively.
5.1.4. Influence of Earthquake Location
The gravity changes and degree amplitude spectra caused by the same fault model are different due to the differences in independent sources, and a tensile source has stronger power than a shear source [8]. If the same earthquake event occurs at different latitudes, the coseismic changes are also different due to the different Earth layered model and land–ocean distribution. The model errors at mid-latitudes are smaller than those at lower latitudes; thus, the SNR is higher than that of earthquakes at lower latitudes if the same earthquake occurs in the mid-latitude region.
Sun [45] simulated the perturbed gravitation generated by different independent sources at different depths. It is shown that the spatial pattern of gravity variation of a focal depth of 637 km is larger than that of a focal depth of 100 km. Moreover, the amplitude of perturbed gravitation of 637 km is smaller than that of 100 km; however, on the whole, they are in the same order of magnitude.
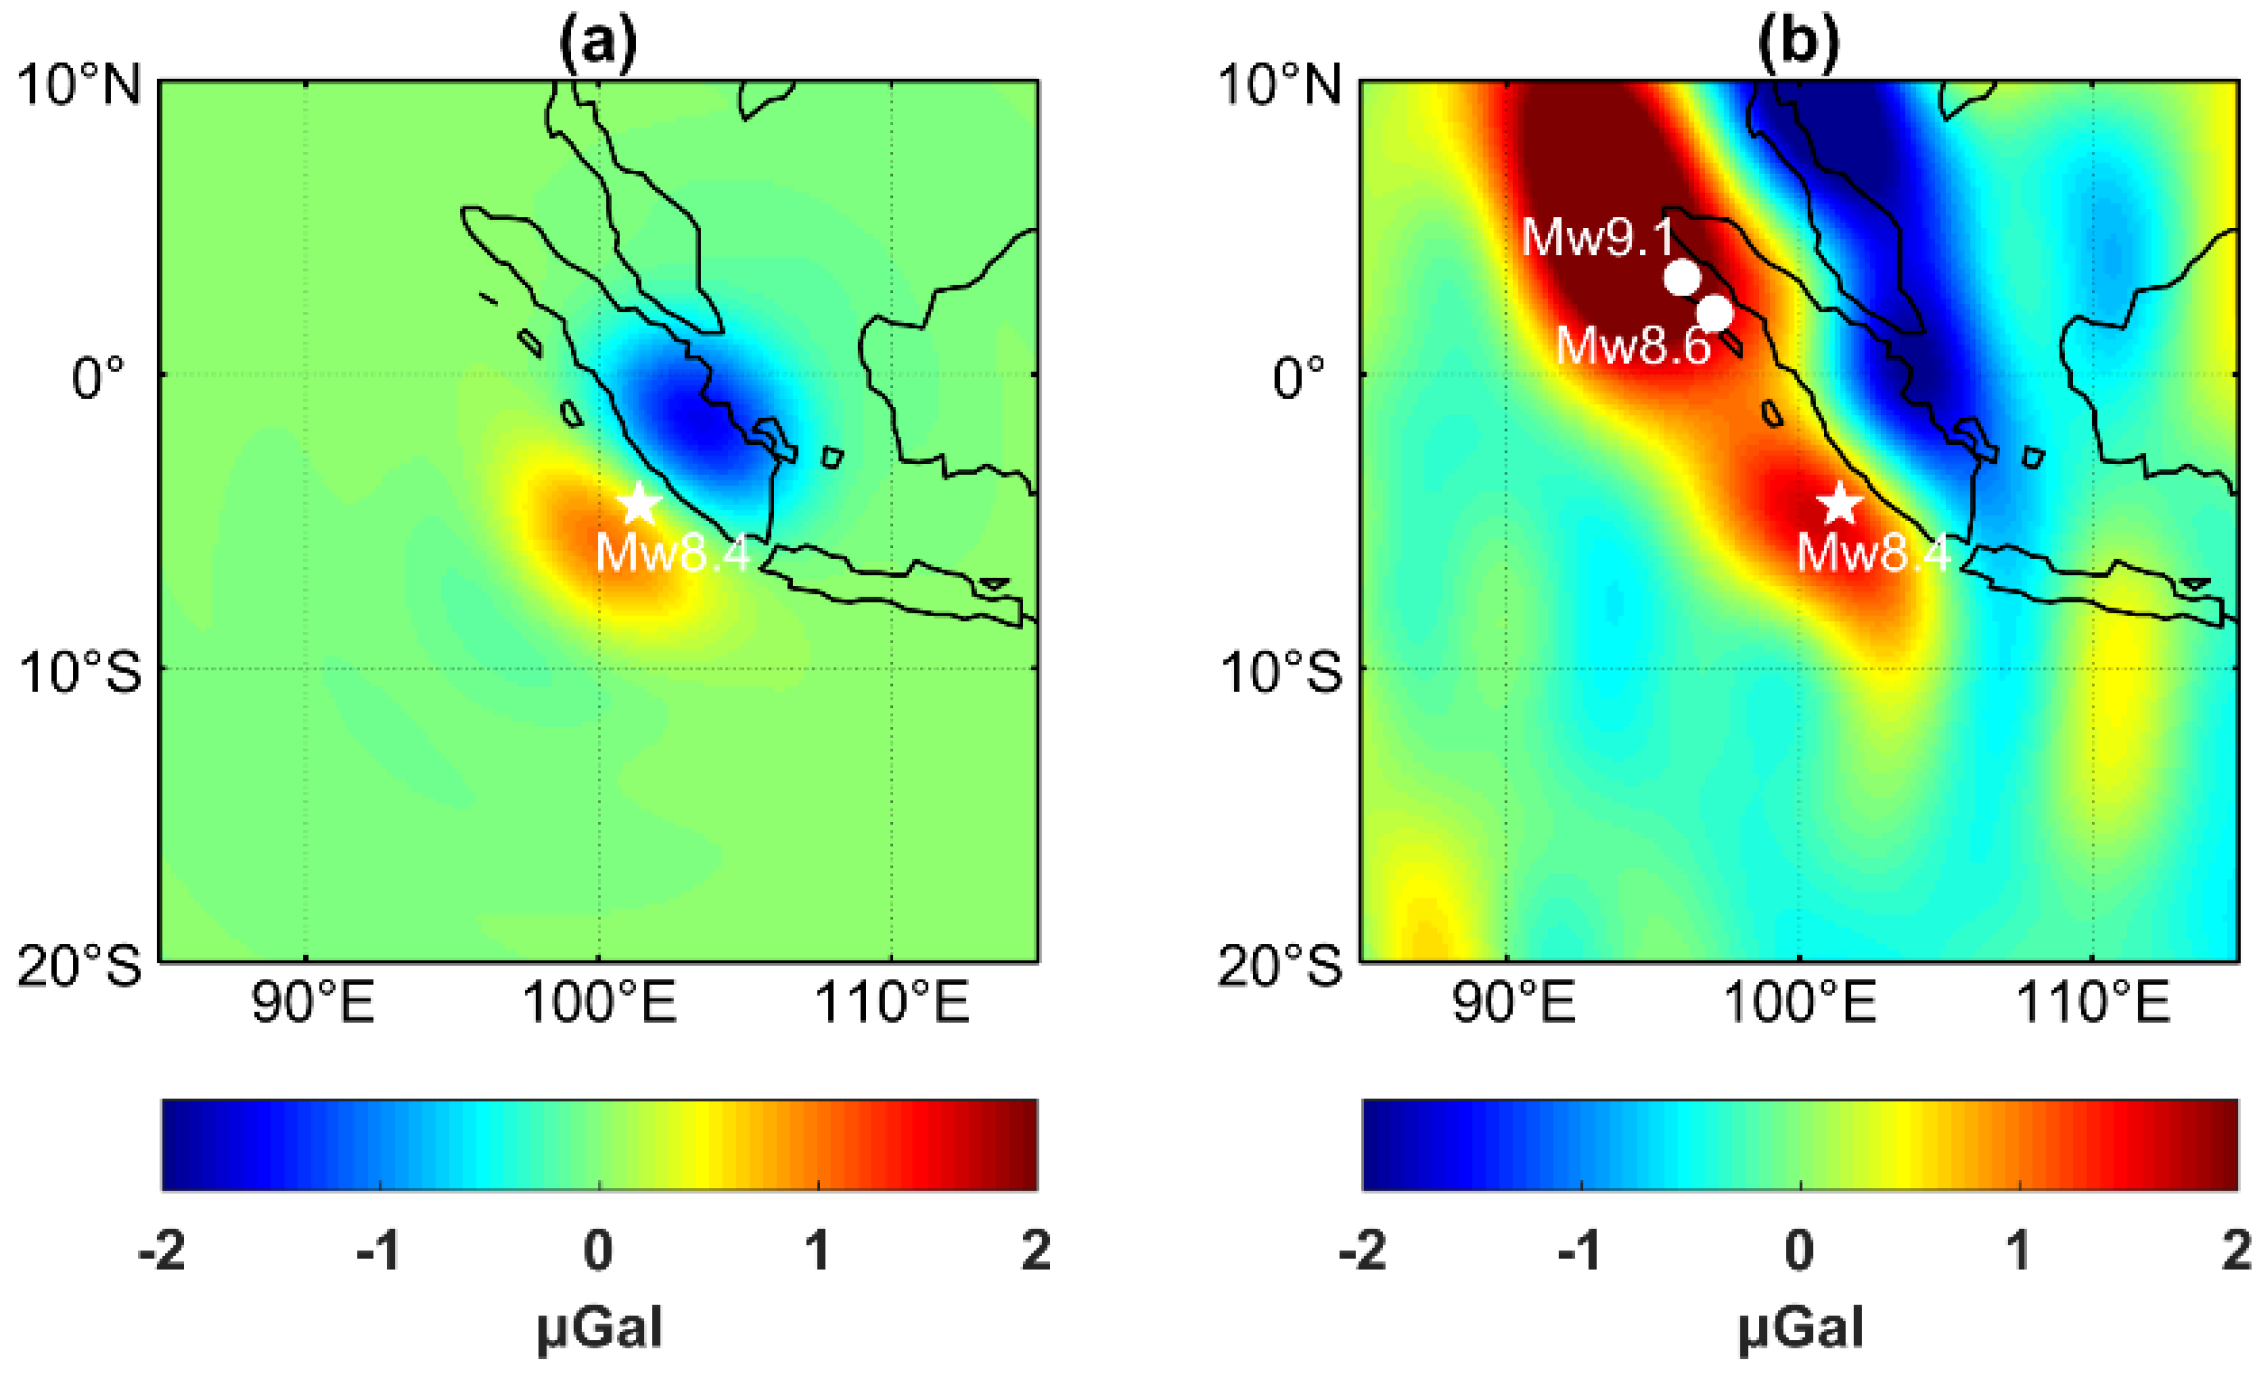
In earthquake-prone areas, the seismic signals will affect each other when the coseismic signals are extracted. For example, there were five earthquakes with magnitude above 8.0 in 2004–2012 in Sumatra, and the postseismic decay of 2004 Mw9.1 Sumatra–Andaman will affect the detection of the coseismic signals of subsequent earthquakes [18]. Figure 11a shows the predicted coseismic gravity changes of the 2007 Mw8.4 Bengkulu earthquake, which presents a positive–negative spatial pattern near the epicenter, with an amplitude of −1.6~+1.0 µGal; Figure 11b shows the GRACE-observed coseismic gravity changes of 2 years before and after the earthquake, in which the spatial distribution of coseismic signals is consistent with the model prediction in the earthquake area. However, there are obvious gravity signal differences in the northwest, mainly due to the postseismic gravity change caused by the decay of the 2004 Mw9.1 Sumatra–Andaman earthquake. Therefore, the coseismic gravity changes extracted by the stacking method may include the postseismic signals of other earthquakes in earthquake-prone areas. In actual earthquake detection, this issue should be considered.
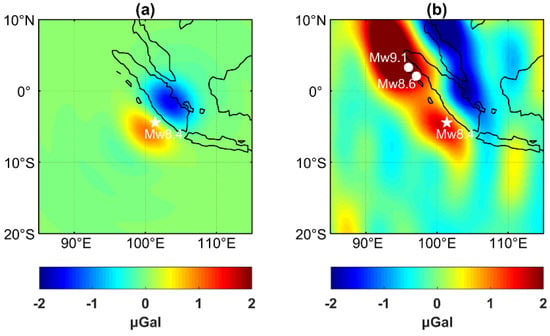
Figure 11.
Coseismic gravity change in the 2007 Mw8.4 Bengkulu earthquake region. (a) The dislocation model prediction by USGS fault slip model. (b) Coseismic gravity changes from GRACE observations.
5.2. Influence of Spectral Leakage in Spectral Domain
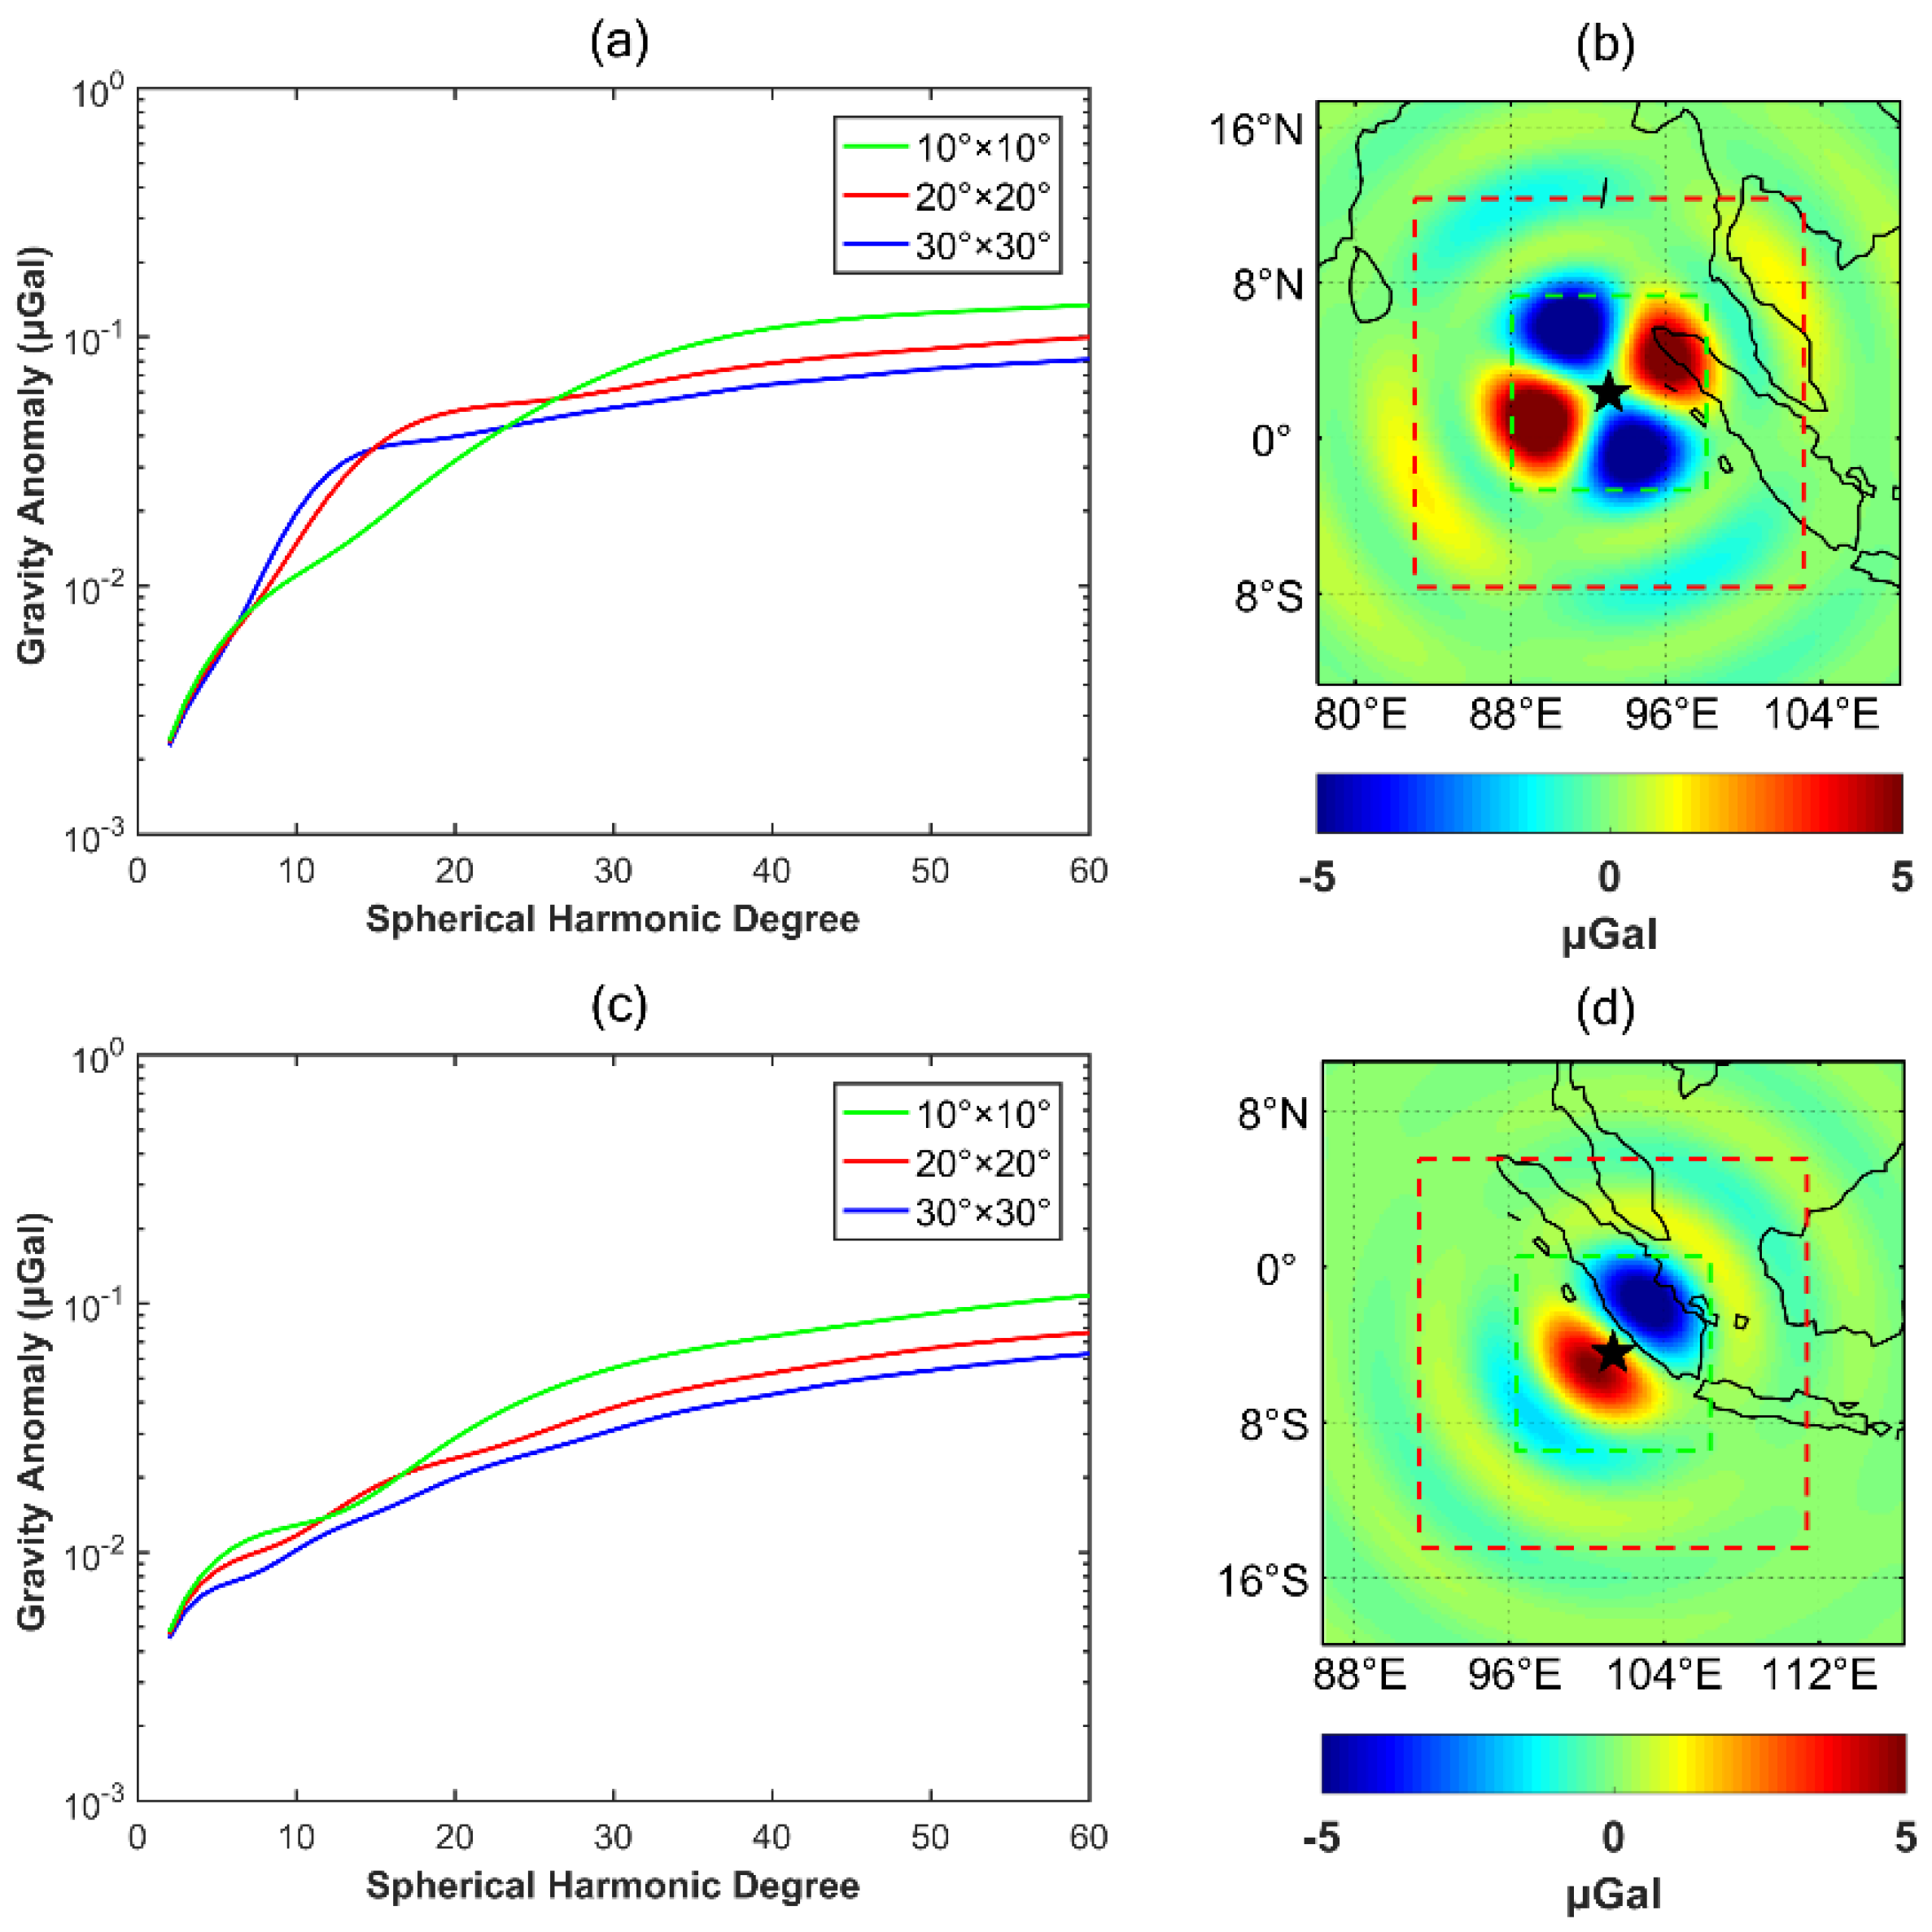
The coseismic gravity change is a local signal, so we use the method in Section 2.1 to evaluate the spectral degree of amplitude of earthquakes. However, different calculation regions will lead to different spectral results. Taking 2012 Mw8.6 Indian and 2007 Mw8.4 Bengkulu as examples, Figure 12 shows the model-predicted coseismic gravity changes with different calculation regions. Note that the results are truncated to degree 60 without filtering processing. The green line in the left figure is the spectral degree amplitude curve of coseismic gravity changes with a calculation region of 10° × 10°, corresponding to the calculation area of the green dotted box in the right figure. It can be found that the calculation area of 10° × 10° contains local signals in a small area, but cannot contain all the main seismic signals, so the high-degree signal is strong whereas the low-degree signal is weak (see Figure 12a,c). The blue line is the result with a calculation region of 30° × 30°, which corresponds to the whole area in the right figure. The calculation area contains the main coseismic signals and more long-wavelength signals. However, with a larger calculation region, the coseismic signals will also be averaged in a larger area and weaken the strength of the coseismic signals. For example, the signals of 30° × 30° are smaller than those of 10° × 10° during degree 30~60 in Figure 12a,c. This study selects 20° × 20° as the calculation region to derive the changes of earthquake in the spectral domain, as shown by the red line in Figure 12. This is because 20° × 20° can contain the main signals of the earthquakes discussed in this study and can also reduce the influence of the signal weakening due to an excessively large region.
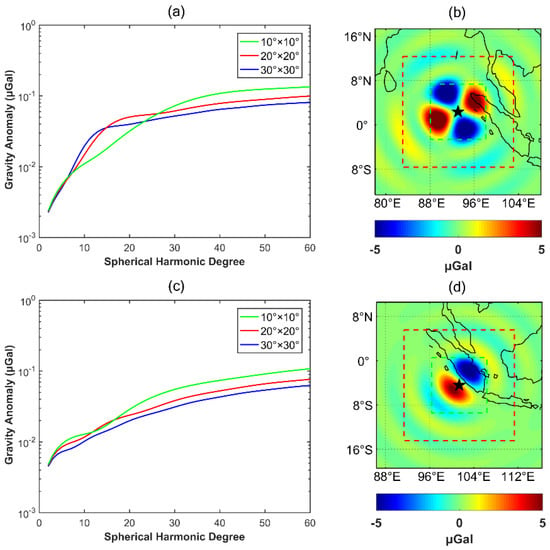
Figure 12.
Model predictions of coseismic gravity change in spectral domain and spatial domain for different region ranges. (a,b) are the 2012 Mw8.6 Indian Ocean coseismic gravity change in spectral and spatial domain, respectively. (c,d) correspond to 2007 Mw8.4 Bengkulu event. The green line is 10° × 10° region and red line is 20° × 20° region.
5.3. Coseismic Signal Detection of 2019 Peru Earthquake
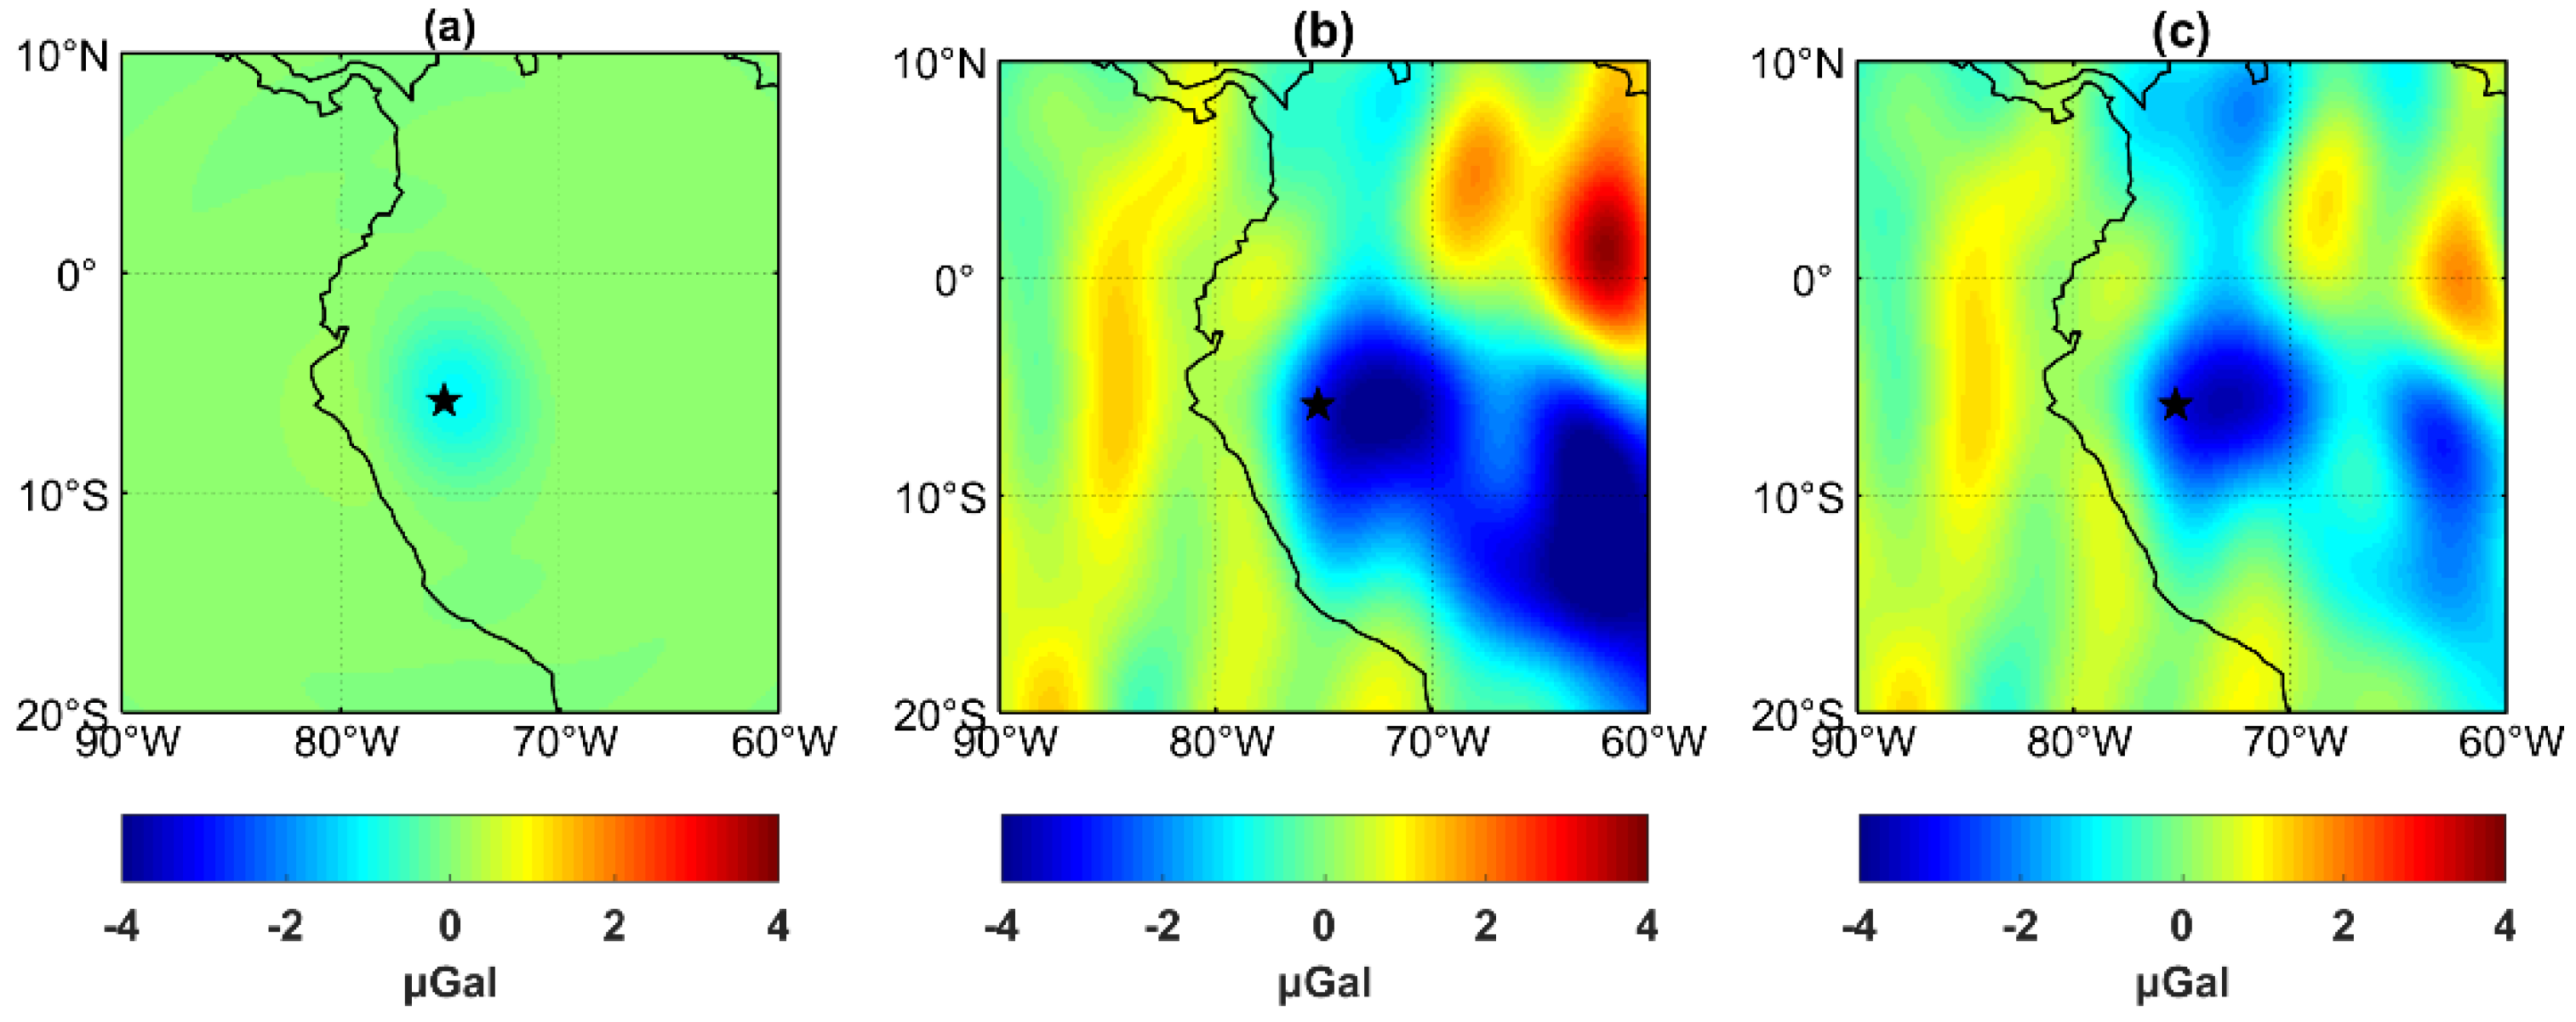
The 2019 Mw8.0 Peru event was an earthquake with a magnitude above 8.0 that occurred during the GFO mission. Thus far, the coseismic gravity change has not been extracted from the GFO observations (as shown in Figure 13). Figure 13a is the dislocation model prediction values, in which the coseismic gravity changes mainly represent a negative pattern near the epicenter, with an amplitude of −1.1 µGal. Figure 13b shows the variations between the GFO observation of 11 months before and after the earthquake, in which there is a negative change near the epicenter, and an obvious hydrological signal in the eastern part of the earthquake region. Figure 13c shows the coseismic gravity change after removing the hydrological signal provided by the GLDAS (−3.7 µGal). Comparing Figure 13b,c, the interference of the hydrological signal is obviously smaller but not completely removed, and obvious stripe noise exists around the epicenter; thus, the gravity changes caused by the earthquake are not shown clearly. According to Figure 9d, the residual RMS of GLDAS in Peru is approximately 1.2 µGal, which is equivalent to the magnitude of the 2019 Mw8.0 Peru coseismic signal. Hence, the influence of hydrological signals may be one of the reasons that this earthquake has not been detected so far.
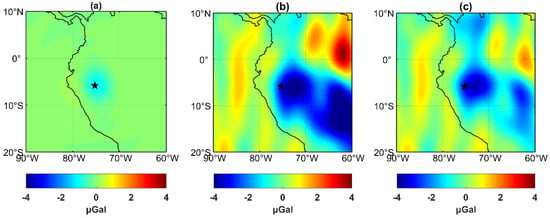
Figure 13.
Coseismic gravity change in the 2019 Mw8.0 Peru earthquake region. (a) The dislocation model prediction by USGS fault slip model. (b) Coseismic gravity changes from GFO observations. (c) Coseismic gravity changes from GFO observations with hydrological signal removed by the GLDAS model.
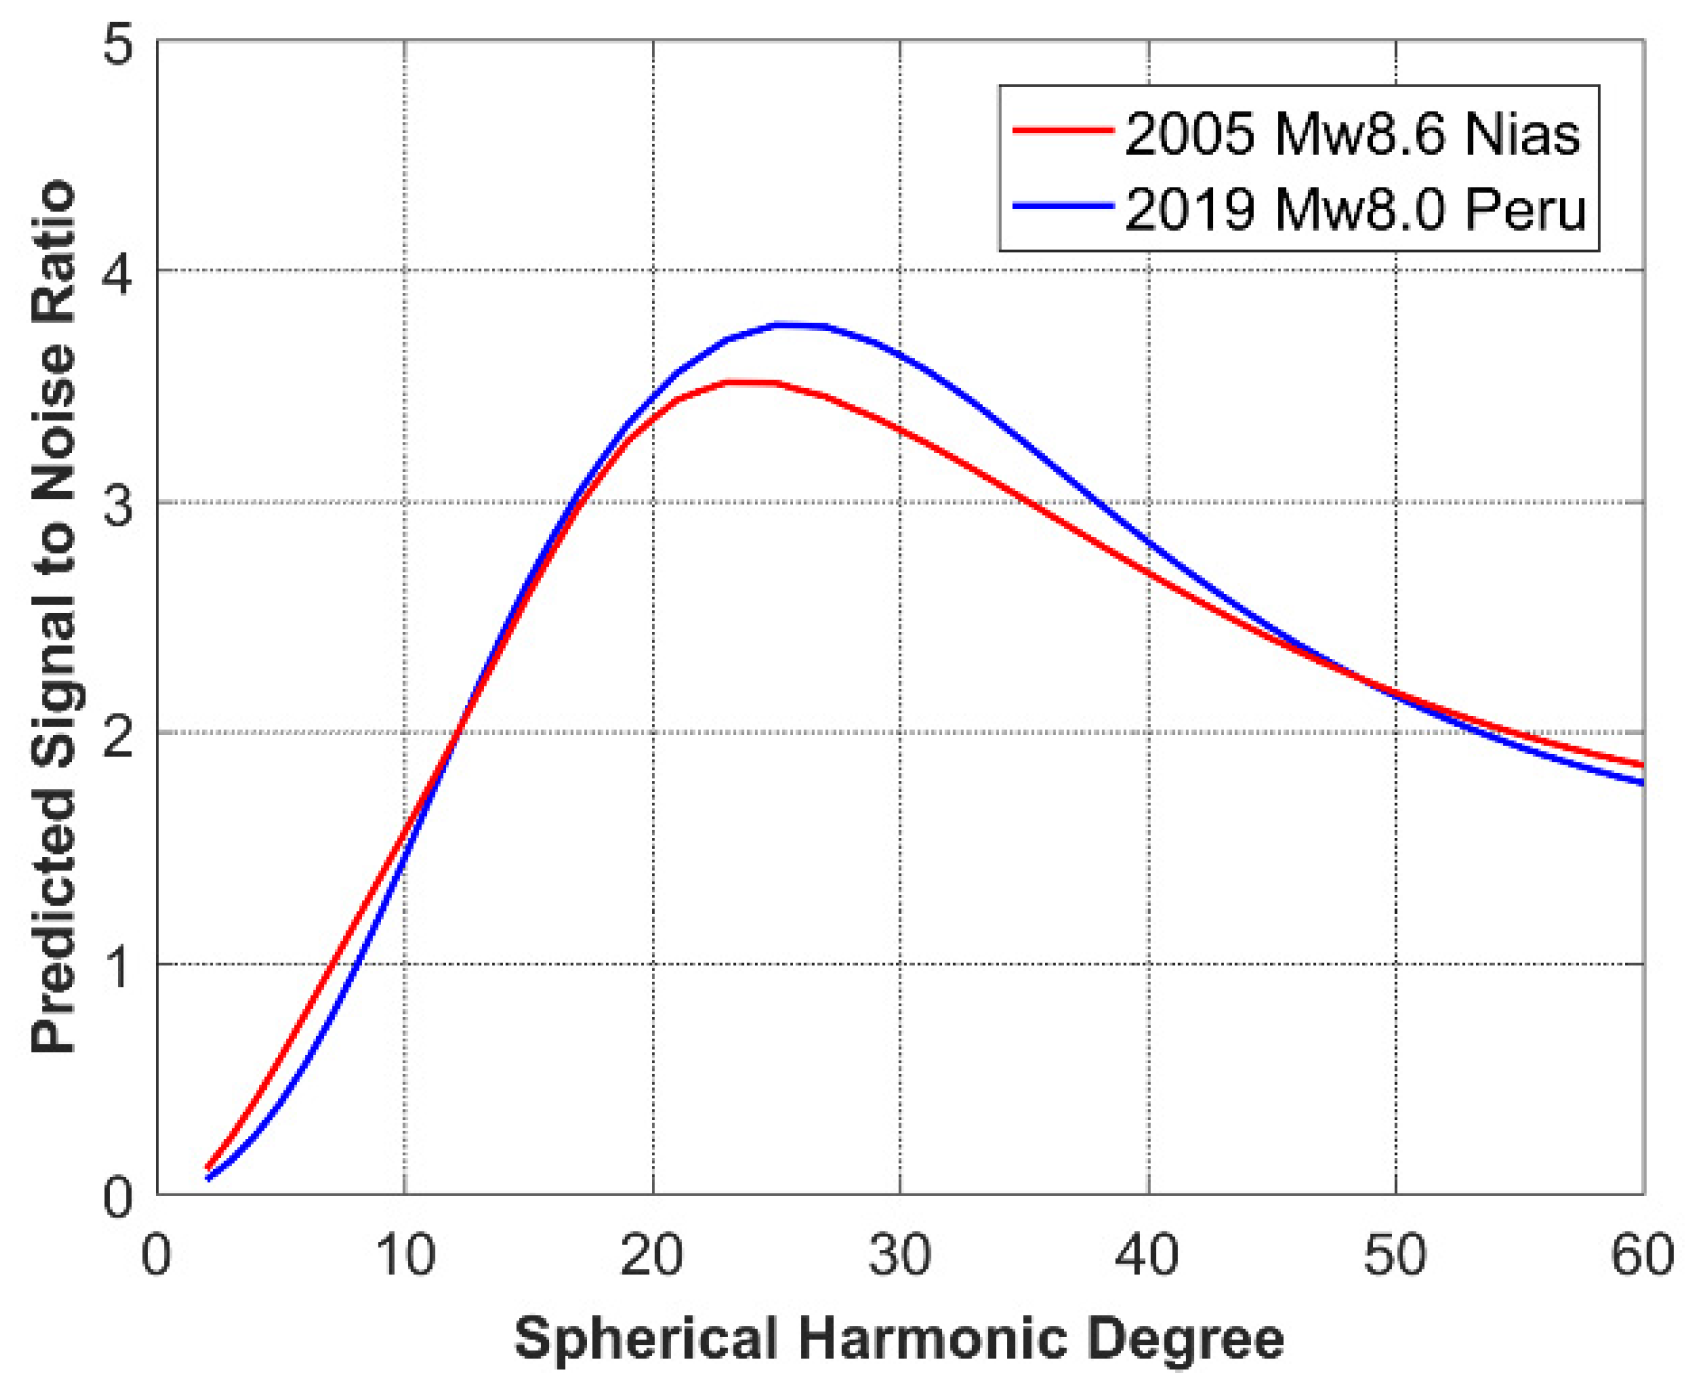
The blue line in Figure 14 shows the ratio of the coseismic signal of the 2019 Mw8.0 Peru earthquake to the error of the GFO stacking method (as in Figure 6). The SNR is highest at degree 25, and is 1.78 at degree 60. The red line denotes the SNR of the 2005 Mw8.6 Nias event for the GRACE error of the stacking method, and the SNR of the two earthquakes is essentially the same at degree 60. The results indicate that the precision of the GFO monthly model is not the main limiting factor for extracting the coseismic gravity change; therefore, the precision can meet the requirements for detecting the coseismic signals of the earthquake. However, due to the lack of observations and the influence of hydrological signals, the coseismic gravity change has not been extracted successfully.
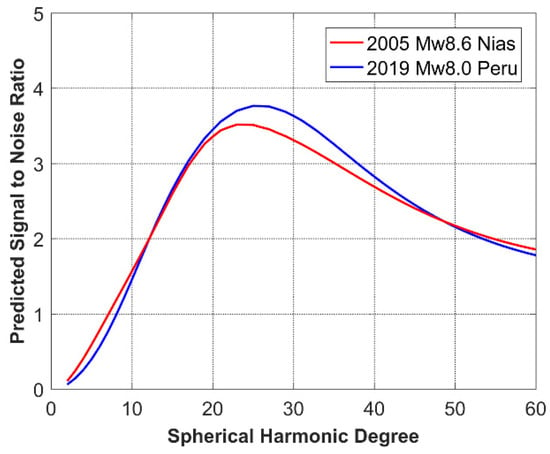
Figure 14.
Ratio of the coseismic gravity changes to cumulative error of stacking method in spectral domain. The blue line is the ratio of the coseismic signal of the 2019 Mw8.0 Peru earthquake to the error of the GFO stacking method. The red line is SNR of the 2005 Mw8.6 Nias event for the GRACE error.
6. Conclusions
By truncating the SH coefficients of time-variable gravity field models to degree 60 and smoothing the coefficients with a 300 km Gaussian filter, this study firstly evaluated the precision of the GRACE/GFO products. The results show that the data of GRACE models in September 2004, July 2012 and February 2015 have greater noise than those of other months; hence, they were not used in this study. It was found that, at this spatial resolution, the precision of GFO is around 38% higher than that of GRACE.
In the spectral domain, this study compared the coseismic gravity changes above Mw8.0 earthquakes and the errors of GRACE/GFO models (see Figure 4). According to the amplitude distribution of degree variances, it was found that among the seven large earthquakes that have been detected by GRACE [22], the 2004 Mw9.1 Sumatra–Andaman and 2011 Mw9.0 Tohoku earthquakes generated gravity changes with magnitudes larger than the GRACE stack error less than degree 50. The degree amplitude spectra of 2010 Mw8.8 Maule and 2012 Mw8.6 Indian Ocean are larger than the stack error less than degree 30. The 2007 Mw8.4 Bengkulu and 2005 Mw8.6 Nias events are larger than the stack error in degree 20, indicating that if high-degree error is effectively suppressed and the SNR is improved, GRACE is able to detect the coseismic signals of these earthquakes. According to the distribution of cumulative degree amplitude spectra, all the detected earthquakes have an SNR far larger than 1. This means that other factors should also be considered in order to detect earthquakes successfully. According to this study, the precision of the GRACE monthly model needs to be improved by one order of magnitude, if the objective is to detect all the earthquake events above Mw8.0 without considering the influence of other factors. Finally, SNR analysis in the spectral domain is helpful in order to verity which earthquakes could be detected by time-variable gravity field products. It is suggested that the SNR should be stronger than 1 if considering the influence of other factors.
Although the GRACE observations of 2006 Mw8.0 Tonga and 2007 Mw8.0 Peru are somewhat similar to the model predictions, the coseismic signals of these two earthquakes have not been detected so far. This is because the amplitude of the coseismic signals is too close to the error of the surrounding “north–south strip” and it is difficult to separate the signal from the error. This means that strip errors have a significant influence on the detection of earthquake signals, and GRACE-like satellites with non-polar orbit are needed to resolve this issue. The spatial pattern of the GRACE observations of 2019 Mw8.0 Peru after hydrological model correction are similar to the predictions of the dislocation model (−1.1 µGal). However, the amplitude of GRACE observations is three times the prediction value. This indicates that other signals such as hydrological residual signals still exist in the GRACE observations. This was investigated by the analysis of GLDAS time series. It is clear that the error of the hydrological model should be considered in coseismic extraction. We also found that the SNR of the GFO stack error of 2019 Mw8.0 Peru at the 60th degree is essentially same as the GRACE stack error of 2005 Mw8.6 Nias, and the precision of the monthly model of GFO is not the main factor leading to the failure of the extraction of this earthquake. The coseismic signal of this earthquake is likely to be extracted with the release of more products and with more effective removal of hydrological signals.
Author Contributions
All the authors participated in editing and reviewing the manuscript. Conceived and designed the experiments: M.X. and X.W.; performed the experiments: M.X., X.W. and W.W.; analyzed and interpreted the results: M.X., X.W., R.C. and Y.W. All authors have read and agreed to the published version of the manuscript.
Funding
This work was funded by the National Natural Science Foundation of China (No. 42074017, 41804019, 41931074, 41974096); Fundamental Research Funds for the Central Universities (No. 2652018027); Open Research Fund of Qian Xuesen Laboratory of Space Technology, CAST (No. GZZKFJJ2020006); Open Research Fund of Key Laboratory of Space Utilization, Chinese Academy of Sciences (LSU-KFJJ-201902); China Geological Survey (No. 20191006). (Corresponding author: Xiaoyun Wan).
Institutional Review Board Statement
Not applicable.
Informed Consent Statement
Not applicable.
Data Availability Statement
The GRACE monthly solutions used in this study are available through GFZ’s ftp link: (ftp://rz-vm152.gfz-potsdam.de/grace/Level-2/ (accessed on 1 December 2019). The other data presented in this study are available on request from the corresponding author.
Acknowledgments
We would like to thank CSR for providing the GRACE data. We also thank three anonymous reviewers for their insightful comments, which led to significant improvement of the manuscript. We are grateful to R.J. Wang for providing the PSGRN/PSCMP code. We especially appreciate J. Li for his discussion and suggestions in calculating the model error method.
Conflicts of Interest
The authors declare no conflict of interest.
References
- Swenson, S.; Wahr, J. Monitoring the water balance of Lake Victoria, East Africa, from space. J. Hydrol. 2009, 370, 163–176. [Google Scholar] [CrossRef]
- Chen, J.L.; Wilson, C.R.; Tapley, B.D. Contribution of ice sheet and mountain glacier melt to recent sea level rise. Nat. Geosci. 2013, 6, 549–552. [Google Scholar] [CrossRef]
- Allison, I.; Alley, R.B.; Fricker, H.A.; Thomas, R.H.; Warner, R.C. Ice sheet mass balance and sea level. Antarct. Sci. 2009, 21, 413–426. [Google Scholar] [CrossRef]
- Quinn, K.J.; Ponte, R.M. Uncertainty in ocean mass trends from GRACE. Geophys. J. Int. 2010, 181, 762–768. [Google Scholar] [CrossRef]
- Sun, W.K.; Okubo, S. Surface potential and gravity changes due to internal dislocations in a spherical earth—II. Application to a finite fault. Geophys. J. Int. 1998, 132, 79–88. [Google Scholar] [CrossRef]
- Gross, R.S.; Chao, B.F. The gravitational signature of earthquakes. In Proceedings of the Gravity, Geoid and Geodynamics: GGG2000 IAG International Symposium, Banff, AB, Canada, 31 July–4 August 2000; Volume 123, pp. 205–210. [Google Scholar]
- Mikhailov, V.; Tikhotsky, S.; Diament, M.; Panet, I.; Ballu, V. Can tectonic processes be recovered from new gravity satellite data? Earth Planet. Sci. Lett. 2004, 228, 281–297. [Google Scholar] [CrossRef]
- Sun, W.K.; Okubo, S. Coseismic deformations detectable by satellite gravity missions: A case study of Alaska (1964, 2002) and Hokkaido (2003) earthquakes in the spectral domain. J. Geophys. Res. Solid Earth. 2004, 109, B04405. [Google Scholar] [CrossRef]
- Han, S.C.; Shum, C.K.; Bevis, M.; Ji, C.; Kuo, C. Crustal dilatation observed by GRACE after the 2004 Sumatra-Andaman earthquake. Science 2006, 313, 658–662. [Google Scholar] [CrossRef] [PubMed]
- Chen, J.L.; Wilson, C.R.; Tapley, B.D.; Grand, S. GRACE detects coseismic and postseismic deformation from the Sumatra-Andaman earthquake. Geophys. Res. Lett. 2007, 34, L13302. [Google Scholar] [CrossRef]
- Panet, I.; Mikhailov, V.; Diament, M.; Pollitz, F.; King, G.; De Viron, O.; Holschneider, M.; Biancale, R.; Lemoine, J.M. Coseismic and post-seismic signatures of the Sumatra 2004 December and 2005 March earthquakes in GRACE satellite gravity. Geophys. J. Int. 2007, 171, 177–190. [Google Scholar] [CrossRef]
- Heki, K.; Matsuo, K. Coseismic gravity changes of the 2010 earthquake in central Chile from satellite gravimetry. Geophys. Res. Lett. 2010, 37, L24306. [Google Scholar] [CrossRef]
- Han, S.C.; Sauber, J.; Luthcke, S. Regional gravity decrease after the 2010 Maule (Chile) earthquake indicates large-scale mass redistribution. Geophys. Res. Lett. 2010, 37, L23307. [Google Scholar] [CrossRef]
- Zhou, X.; Sun, W.K.; Fu, G.Y. Gravity satellite GRACE detects coseismic gravity changes caused by 2010 Chile Mw8.8 earthquake. Chin. J. Geophys. 2011, 54, 1745–1749. (In Chinese) [Google Scholar]
- Matsuo, K.; Heki, K. Coseismic gravity changes of the 2011 Tohoku-Oki earthquake from satellite gravimetry. Geophys. Res. Lett. 2011, 38, L00G12. [Google Scholar] [CrossRef]
- Han, S.C.; Sauber, J.; Riva, R. Contribution of satellite gravimetry to understanding seismic source processes of the 2011 Tohoku-Oki earthquake. Geophys. Res. Lett. 2011, 38, L24312. [Google Scholar] [CrossRef]
- Han, S.C.; Riva, R.; Sauber, J.; Okal, E. Source parameter inversion for recent great earthquakes from a decade-long observation of global gravity fields. J. Geophys. Res. Solid Earth 2013, 118, 1240–1267. [Google Scholar] [CrossRef]
- Zheng, Z.J.; Jin, S.G.; Fan, L. Co-seismic deformation following the 2007 Bengkulu earthquake constrained by GRACE and GPS observations. Phys. Earth Planet. Inter. 2018, 280, 20–31. [Google Scholar] [CrossRef]
- Han, S.C.; Sauber, J.; Pollitz, F. Coseismic compression/dilatation and viscoelastic uplift/subsidence following the 2012 Indian Ocean earthquakes quantified from satellite gravity observations. Geophys. Res. Lett. 2015, 42, 3764–3772. [Google Scholar] [CrossRef]
- Tanaka, Y.; Heki, K.; Matsuo, K.; Shestakov, N.V. Crustal subsidence observed by GRACE after the 2013 Okhotsk deep-focus earthquake. Geophys. Res. Lett. 2015, 42, 3204–3209. [Google Scholar] [CrossRef]
- Zhang, G.; Shen, W.; Xu, C.; Zhu, Y. Coseismic Gravity and Displacement Signatures Induced by the 2013 Okhotsk Mw8.3 Earthquake. Sensors 2016, 16, 1410. [Google Scholar] [CrossRef]
- Chao, B.F.; Liau, J.R. Gravity Changes Due to Large Earthquakes Detected in GRACE Satellite Data via Empirical Orthogonal Function Analysis. J. Geophys. Res. Solid Earth 2019, 124, 3024–3035. [Google Scholar] [CrossRef]
- De Viron, O.; Panet, I.; Mikhailov, V.; Van Camp, M.; Diament, M. Retrieving earthquake signature in grace gravity solutions. Geophys. J. Int. 2008, 174, 14–20. [Google Scholar] [CrossRef]
- Cambiotti, G.; Douch, K.; Cesare, S.; Haagmans, R.; Sneeuw, N.; Anselmi, A.; Marotta, A.M.; Sabadini, R. On Earthquake Detectability by the Next-Generation Gravity Mission. Surv. Geophys. 2020, 41, 1049–1074. [Google Scholar] [CrossRef]
- Wang, R.; Lorenzo-Martín, F.; Roth, F. PSGRN/PSCMP—A new code for calculating co- and post-seismic deformation, geoid and gravity changes based on the viscoelastic-gravitational dislocation theory. Comput. Geosci. 2006, 32, 527–541. [Google Scholar] [CrossRef]
- Bassin, C.; Laske, G.; Masters, G. The Current Limits of Resolution for Surface Wave Tomography in North America. EOS Trans. AGU 2000, 81, F897. [Google Scholar]
- Sun, W.K.; Okubo, S.; Fu, G.; Araya, A. General formulations of global co-seismic deformations caused by an arbitrary dislocation in a spherically symmetric earth model-applicable to deformed earth surface and space-fixed point. Geophys. J. Int. 2009, 177, 817–833. [Google Scholar] [CrossRef]
- Li, J.; Chen, J.; Zhang, Z. Seismologic applications of GRACE time-variable gravity measurements. Earthq. Sci. 2014, 27, 229–245. [Google Scholar] [CrossRef]
- Broerse, T.; Riva, R.; Vermeersen, B. Ocean contribution to seismic gravity changes: The sea level equation for seismic perturbations revisited. Geophys. J. Int. 2014, 199, 1094–1109. [Google Scholar] [CrossRef]
- Wahr, J.; Swenson, S.; Velicogna, I. Accuracy of GRACE mass estimates. Geophys. Res. Lett. 2006, 33, L06401. [Google Scholar] [CrossRef]
- Wahr, J.; Swenson, S.; Zlotnicki, V.; Velicogna, I. Time-variable gravity from GRACE: First results. Geophys. Res. Lett. 2004, 31, L11501. [Google Scholar] [CrossRef]
- Wahr, J.; Molenaar, M.; Bryan, F. Time variability of the Earth’s gravity field: Hydrological and oceanic effects and their possible detection using GRACE. J. Geophys. Res. Solid Earth 1998, 103, 30205–30229. [Google Scholar] [CrossRef]
- Vigny, C.; Socquet, A.; Peyrat, S.; Ruegg, J.C.; Métois, M.; Madariaga, R.; Morvan, S.; Lancieri, M.; Lacassin, R.; Campos, J.; et al. The 2010 Mw 8.8 Maule Megathrust Earthquake of Central Chile, Monitored by GPS. Science 2011, 332, 1417–1421. [Google Scholar] [CrossRef]
- Wei, S.; Sladen, A.; The ARIA Group. Updated Result 3/11/2011 (Mw 9.0), Tohoku-Oki, Japan. Rep. Calif. Inst. of Technol. Pasadena. 2011. Available online: http://www.tectonics.caltech.edu/slip_history/2011_taiheiyo-oki/ (accessed on 4 August 2021).
- Cheng, M.; Tapley, B.D.; Ries, J.C. Deceleration in the Earth’s oblateness. J. Geophys. Res. Solid Earth 2013, 118, 740–747. [Google Scholar] [CrossRef]
- Wang, L.; Shum, C.K.; Jekeli, C. Gravitational gradient changes following the 2004 December 26 Sumatra-Andaman Earthquake inferred from GRACE. Geophys. J. Int. 2012, 191, 1109–1118. [Google Scholar] [CrossRef]
- Li, J.; Shen, W.-B. Monthly GRACE detection of coseismic gravity change associated with 2011 Tohoku-Oki earthquake using northern gradient approach. Earth Planets Space 2015, 67, 29. [Google Scholar] [CrossRef]
- Han, S.C.; Sauber, J.; Pollitz, F. Postseismic gravity change after the 2006–2007 great earthquake doublet and constraints on the asthenosphere structure in the central Kuril Islands. Geophys. Res. Lett. 2016, 43, 3169–3177. [Google Scholar] [CrossRef]
- Qu, W.; Han, Y.; Lu, Z.; An, D.; Zhang, Q.; Gao, Y. Co-Seismic and Post-Seismic Temporal and Spatial Gravity Changes of the 2010 Mw 8.8 Maule Chile Earthquake Observed by GRACE and GRACE Follow-on. Remote Sens. 2020, 12, 2768. [Google Scholar] [CrossRef]
- Dong, J.; Sun, W.; Zhou, X.; Wang, R. An analytical approach to estimate curvature effect of coseismic deformations. Geophys. J. Int. 2016, 206, 1327–1339. [Google Scholar] [CrossRef][Green Version]
- Rodell, M.; Houser, P.R.; Jambor, U.E.A.; Gottschalck, J.; Mitchell, K.; Meng, C.J.; Arsenault, K.; Cosgrove, B.; Radakovich, J.; Bosilovich, M.; et al. The Global Land Data Assimilation System. Bull. Am. Meteorol. Soc. 2004, 85, 381–394. [Google Scholar] [CrossRef]
- Li, J.; Chen, J.L.; Wilson, C.R. Topographic effects on coseismic gravity change for the 2011 Tohoku-Oki earthquake and comparison with GRACE. J. Geophys. Res. Solid Earth 2016, 121, 5509–5537. [Google Scholar] [CrossRef]
- Tong, X.; Sandwell, D.; Luttrell, K.; Brooks, B.; Bevis, M.; Shimada, M.; Foster, J.; Smalley, R., Jr.; Parra, H.; Báez Soto, J.C.; et al. The 2010 Maule, Chile earthquake: Downdip rupture limit revealed by space geodesy. Geophys. Res. Lett. 2010, 37, L24311. [Google Scholar] [CrossRef]
- Shao, G.; Li, X.; Liu, Q.; Zhao, X.; Yano, T.; Ji, C.; UCSB. Preliminary Slip Model of the 27 February 2010 Mw 8.9 Maule, Chile Earthquake. 2010. Available online: www.geol.ucsb.edu/faculty/ji/big_earthquakes/2010/02/27/chile_2_27.html (accessed on 4 August 2021).
- Sun, W.K. Seismic Dislocation Theory; Science Press: Beijing, China, 2012; pp. 210–214. (In Chinese) [Google Scholar]
Publisher’s Note: MDPI stays neutral with regard to jurisdictional claims in published maps and institutional affiliations. |
© 2021 by the authors. Licensee MDPI, Basel, Switzerland. This article is an open access article distributed under the terms and conditions of the Creative Commons Attribution (CC BY) license (https://creativecommons.org/licenses/by/4.0/).

