Article

Building Change Detection Method to Support Register of Identified Changes on Buildings

Faculty of Technical Sciences, University of Novi Sad, 106314 Novi Sad, Serbia
*
Author to whom correspondence should be addressed.
Remote Sens. 2021, 13(16), 3150; https://doi.org/10.3390/rs13163150
Submission received: 30 June 2021 / Revised: 22 July 2021 / Accepted: 29 July 2021 / Published: 9 August 2021
(This article belongs to the Special Issue Remote Sensing for Land Administration 2.0)

Abstract

:
Based on a newly adopted “Rulebook on the records of identified changes on buildings in Serbia” (2020) that regulates the content, establishment, maintenance and use of records on identified changes on buildings, it is expected that the geodetic-cadastral information system will be extended with these records. The records contain data on determined changes of buildings in relation to the reference epoch of aerial or satellite imagery, namely data on buildings: (1) that are not registered in the real estate cadastre; (2) which are registered in the real estate cadastre, and have been changed in terms of the dimensions in relation to the data registered in the real estate cadastre; (3) which are registered in the real estate cadastre, but are removed on the ground. For this purpose, the LADM-based cadastral data model for Serbia is extended to include records on identified changes on buildings. In the year 2020, Republic Geodetic Authority commenced a new satellite acquisition for the purpose of restoration of official buildings registry, as part of a World Bank project for improving land administration in Serbia. Using this satellite imagery and existing cadastral data, we propose a method based on comparison of object-based and pixel-based image analysis approaches to automatically detect newly built, changed or demolished buildings and import these data into extended cadastral records. Our results, using only VHR images containing only RGB and NIR bands, showed object identification accuracy ranging from 84% to 88%, with kappa statistic from 89% to 96%. The accuracy of obtained results is satisfactory for the purpose of developing a register of changes on buildings to keep cadastral records up to date and to support activities related to legalization of illegal buildings, etc.

Graphical Abstract

1. Introduction

With advanced technology related to collecting geospatial data in the 21st century, each organization is faced with growing volumes of spatial data. Geospatial data can originate from different satellites, airplanes or even UAV platforms. Collected data vary from large amounts of LiDAR data to the satellite and aerial images with different spatial resolutions. Very high spatial resolution (VHR) optical satellite imageries have increased their usability in applications of change detection and urban monitoring. Classification of VHR images requires a significant research task in remote sensing and image analysis; thus, it has great importance in infrastructure planning and change detection in the urban area, etc. [1]. Often, focus on these applications is on the classification of urban structures and identification, characterization and quantification of change detection on footprints of buildings or buildings’ rooftops.
The manual method of collecting individual building information with attributes is very expensive and time-consuming. Automatic extraction of building information using high resolution (HR) remote sensing images is one of the widely used methods globally.
Even though building footprint extraction has received quite a bit of attention in the computer vision community, most approaches use supplemental data, such as point clouds, building height information, and multi-band imagery—all of which are too expensive to produce or unattainable for most cities worldwide [2].
In the past, many methods based on automatic or semi-automatic processes were developed for building footprint extraction. The large variations in appearance, geometry and spectral properties of buildings altogether make it a challenging task to enable automated building extraction at large scale from remote sensing satellite imagery. The spectral and geometrical properties of buildings such as rectangular shape, homogeneous surface (uniform spectra) and low-level features such as edges, lines/corners and association of shadows with the buildings are a few of the fundamental elements of buildings [3].
Within the context of increasing availability of high-resolution imagery, image segmentation is regarded as a solution to automate conversion of the raw data into tangible information, which is required in many application domains [4]. With the advancement of remote sensing technology, spatial resolution has become finer to the extent that even the smallest objects consist of a larger number of pixels, which has significantly increased variability within the class, making it difficult to classify at the pixel level and highlighting the need for segmentation and object-oriented classification of images [5]. Hossain and Chen in their review paper found 290 publications since 1999 that are related to object-based image analysis (OBIA) or image segmentation [6]. A variety of image segmentation methods have been developed. According to Schiewe [7], these methods can be grouped into three categories: edge-based, region-based, and hybrid segmentation methods. Meinel and Neubert [8] compared several segmentation methods and concluded that region merging is the most effective image segmentation method for the analysis of high-resolution remote sensing images. A characteristic region-merging method and probably the most widely used one within the OBIA domain is multi-resolution segmentation (MRS) [9], which is available in the eCognition® software package. Multiresolution segmentation (MRS) is now one of the most important algorithms in the object-oriented analysis of remote sensing imagery [10]. MRS performs region-growing segmentation, starting at the pixel level, then adjacent pixels are merged if they are homogeneous. The unitless user-set scale parameter represents the heterogeneity threshold, below which merging occurs, and above which merging stops. The higher the scale parameter, the higher the allowed within-segment heterogeneity, and thus the larger the resulting image segments. For a given scale parameter, heterogeneous regions will have smaller segments than homogeneous regions. The scale parameter is defined as the maximum standard deviation of the homogeneity criteria, which are a weighted combination of color and shape values. The user can adjust the relative weights (importance) assigned to each [11]. In terms of the segmentation software adopted in the 254 case studies, studies on segmentation using eCognition software account for 80.9% [12].
Myint et al. [13] used QuickBird satellite image with four spectral ranges of 2.4 m spatial resolution for the Phoenix area in Arizona. The target materials or classes in both types of classification were buildings, other man-made structures (roads and parking lots), land, trees/shrubs, grass, swimming pools and lakes/ponds. The authors used multi-resolution segmentation, where they used different parameters and weight factors of this method for each class. In the classification process, the authors used different parameters (scale factor, compactness and shape) in the segmentation process and created additional data that they used for each of the classes. Thus, in addition to the basic bands, the authors created the PCA layer and NDVI, and in the classification, they used membership function classifier and nearest neighbor.
Zhou et al. [14] presented a study with WorldView-2 images to provide detailed land use and land cover map at local level using OBIA method. The result shows that a total of nine LULC classes have been successfully classified with an overall classification accuracy of 79.4%. Masayu at el. [15] used Sentinel 2 images to classify buildings in Selangor, Malaysia, using suitable segmentation parameters and features. They used support vector machine (SVM) and decision tree (DT) classifiers to categorize five different classes: water, forest, green area, building, and road. Accuracy of the classified image using a different number of object features was assessed and it shown that the number of features applied will affect the classification accuracy. Additionally, the overall accuracy of SVM was 93% and for DT was 73%. Masayu at el. [16] extracted building footprint from high-resolution Worldview 3 (WV3) satellite data. They used 25 experiments with three segmentation parameters (scale, shape, and compactness), each having five varying values that directly affect the quality of segmentation. With optimal parameters used for segmentation process in eCognition, image objects were classified into five land cover classes (building, road, water, trees, and grass) by using a supervised non-parametric statistical learning technique, support vector machine (SVM) classifier.
In the last few years, algorithms for segmentation of satellite images based on convolutional neural networks have been developed. These networks learn spatial-contextual characteristics directly from the input VHR image, efficiently integrating the feature extraction step into the training classifier [17]. One of the most successful algorithms is based on the fully convolutional network (FCN) [18]. The most common way to perform semantic segmentation is to use a convolutional neural network because it achieves very good results. For image segmentation, one of the most well-known architectures used is U-Net, which has a coder-decoder type structure [19]. U-Net is a type of fully convolutional network that was originally used for medical image analysis, but later this model began to be applied to the pixel-based classification of satellite images [20].
Automatic building extraction from remote sensing data is a hot but challenging research topic for cadastre verification, modernization and updating. Deep learning algorithms are perceived as more promising in overcoming the difficulties of extracting semantic features from complex scenes and large differences in buildings’ appearance.
Geospatial objects change over time and this necessitates periodic updating of the cartography that represents them. Currently, this updating is done manually, by interpreting aerial photographs, but this is an expensive and time-consuming process.
Automatic detection of illegally built or changed buildings from satellite imagery is a specific and important problem for both the research community and government agencies, which has not been sufficiently investigated since it combines the challenge of automatic remote sensing data interpretation and verification with a cadastral map. Recovery of building footprints from satellite images is a very complicated process because building areas and their surroundings are represented with various color intensities and complex features. Yanan et al. [21] in their survey, with 195 different papers related to the change detection methods based on different remote sensing images and multi-objective scenarios, found that 61% of multi-source images are multispectral. Additionally, from the point of the multi-objective scenarios, urban change detection is mostly related to the buildings and roads, where for the buildings important information includes features such as unique roof feature, and shape of parallelograms that represent buildings.
The Republic Geodetic Authority (RGA) in Serbia is a government organization responsible for professional and public administration related to state survey, real estate cadastre, utility cadastre, topographic-cartographic activities, property valuation, and geodetic-cadastral. This organization is also responsible for the legal framework related to survey and cadastre. As part of this legal framework, the rulebook on records on determined changes on buildings was adopted in 2020 [22]. This rulebook defines the content, development, maintenance and use of the register about the determined changes on buildings based on satellite imagery. For this purpose, RGA conducted the acquisition of the VHR satellite imagery data for the entire country. The register will be built for the entire territory of the Republic of Serbia and will be part of the geodetic-cadastral information system (GCIS). The register should contain data about detected changes on objects in relation to the reference era of aerial or satellite photography. These changes include data about buildings that are not recorded in the real estate cadastre, and buildings that are recorded in GCIS, but are removed from the field or changed in terms of dimensions of the footprint recorded in the database. The register contains graphical and alphanumerical parts, i.e., geospatial data about footprints of the buildings, and attribute data that describe particular buildings (such as, unique identification number, building area, type of change, etc.)
The aim of this paper is to develop a procedure that will automate the development of the register on determined changes on buildings based on satellite imagery. Since there are no additional data for Serbia other than high-resolution images, we propose the use of pixel-based and object-based classification, over VHR images from two epochs, 2016 and 2020, as the first step in detecting changes in buildings. Furthermore, one of the largest issues is the existence of more than two million illegal buildings (according to the official data [23]) and a lack of software tools that can help in detection of illegal buildings (newly built or changed). With this proposed method we want to improve the current situation and support the implementation of the new “Rulebook on the records of identified changes on buildings” in Serbia. The Rulebook on records on determined changes on buildings was used as a reference framework for the development of the proposed approach that will result in (semi)automatic extraction of changes on buildings and update of cadastral records in the cadastral database in a timely manner. Our tests with VHR images containing only RGB and NIR bands showed object identification accuracy ranging from 84% to 88%, with kappa statistic from 89% to 96%. Based on these results, the LADM-based cadastral data model for Serbia is extended to include records on identified changes on buildings and their legality assessment.
The paper is structured as follows: after the introduction in Section 1, Section 2 presents materials and methods used. This section describes datasets used for the experiments, and overall methodology used for the development of the register on determined changes on buildings based on satellite imagery, based on pixel based and object-based methods. The data model of the register is also developed and described to demonstrate what information is necessary to extract from the satellite imagery to build a register according to the rulebook. Results of the development and assessment of the model are presented in Section 3. Furthermore, the results are classified into three categories of possible changes on buildings defined in the rulebook to support the conclusion that the method is capable of solving the problem defined in the rulebook. Discussion and conclusions are presented afterwards.

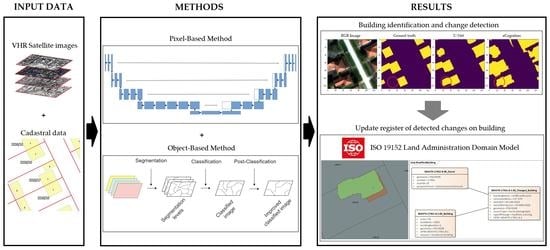
2. Materials and Methods

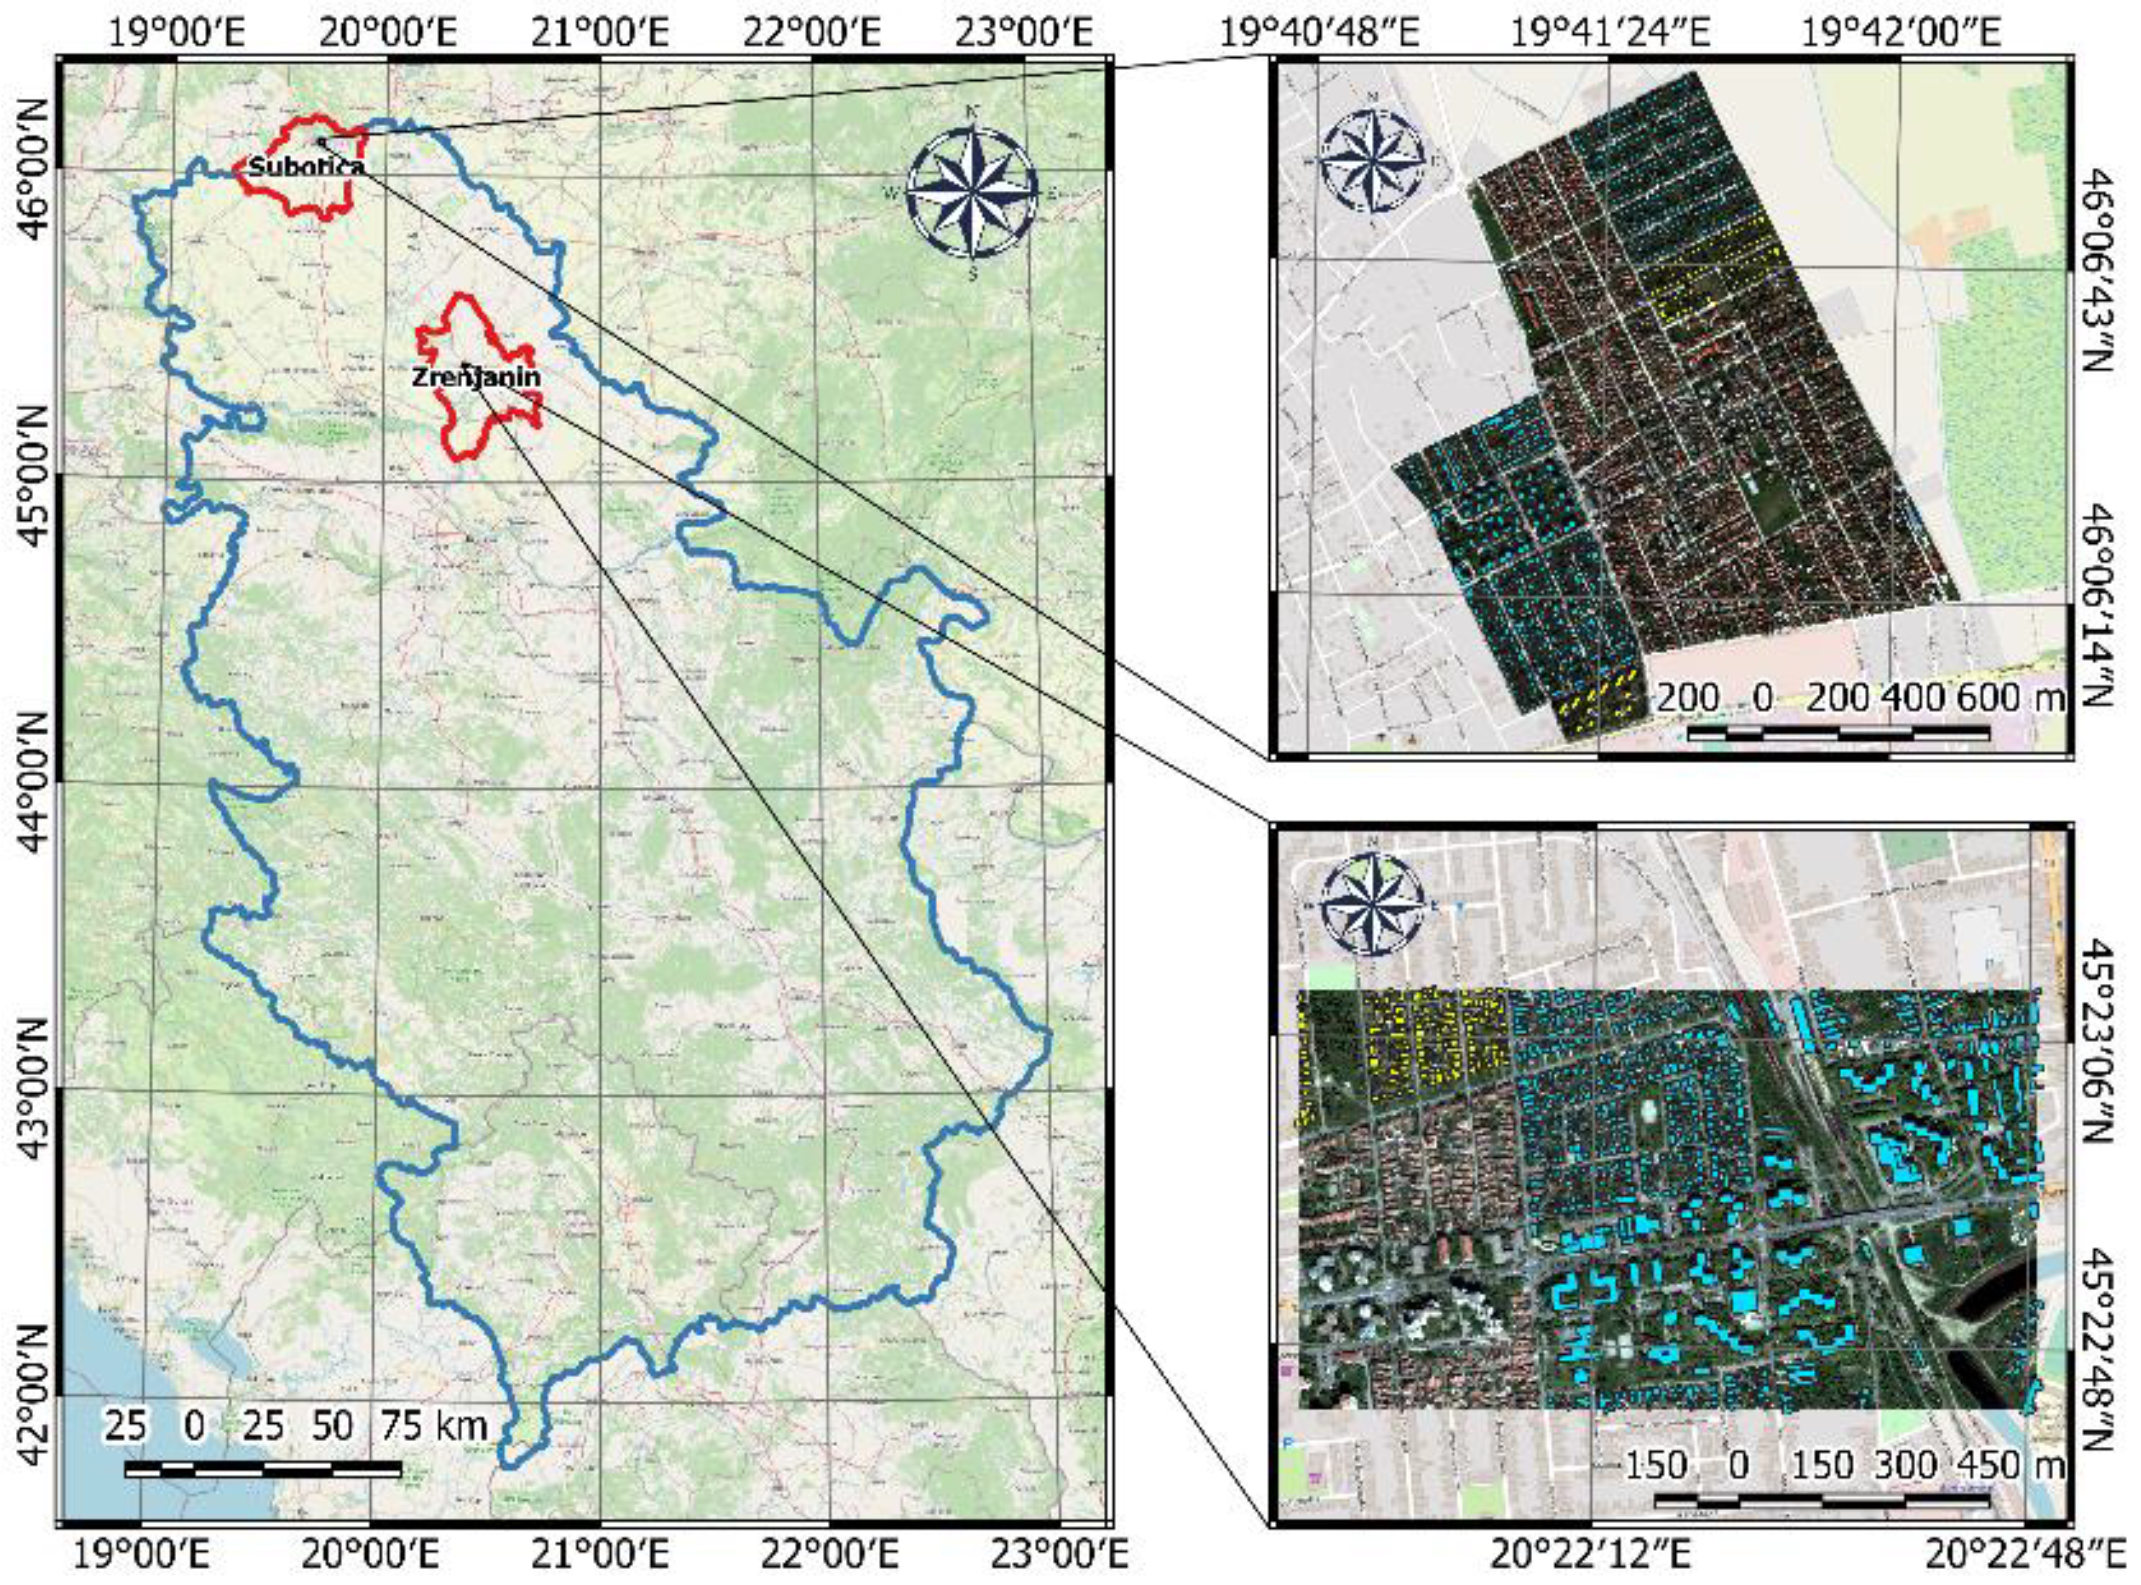
2.1. Study Areas and Datasets

The study areas are parts of two cities, Subotica and Zrenjanin, in the province of Vojvodina, located in the northern part of Serbia. Topography in the study area is without variations and it is characterized by a low altitude from 76 to 109 m. The geographical coordinates of Subotica are 46°06′ N and 19°39′ E, and for Zrenjanin 45°23′ N and 20°23′ E (Figure 1). These two cities are typical representatives of Serbia’s type of settlements, in how they consist of urban parts (with high buildings and lot of impervious surfaces such as roads, parking lots, etc.) and rural parts where there are predominantly houses with big green spaces (parks or even gardens). Urban parts of the cities are similar not only in Serbia, but also in the wider area of this region, and rooftops are usually created from concrete or similar types of materials. On the other hand, what is typical for Serbia is a different type of roof on the houses, which is built from clay tiles oriented in two or four sides, and with lots of vegetation cover. We have chosen this kind of study area because with our proposed method we want to include all possible kinds of buildings that can be found in Serbia.
An area of 0.5 km2 was selected as a training area for developing classification rules for building rooftop detection in both cities, and test area covered about 2.5 km2. The accuracy of building rooftops detection was estimated based on the test area divided into two categories, as previously described, comprising urban parts with high buildings and areas that predominantly contain houses. Later, the same algorithm was applied to both cities, to verify its reliability and transferability to other settlements in Serbia.
The Worldview 2 image of the area of Zrenjanin was acquired on 12 April 2016 at an angle of 16.5°, with the cloud cover equal to 0%. The Worldview 2 image of the area of Subotica was acquired on 29 March 2020 at an angle of 14.1°, with the cloud cover equal to 1%. The WorldView-2 image includes four multispectral bands (Blue, Green, Red, and Near-Infrared-1). The data were purchased by the private company Vekom, involved as a partner in this research, and downloaded from the DigitalGlobe image archive, as a standard Ortho-Ready product projected on a plane with a UTM projection (Universal Transverse Mercator) and a WGS84 datum. The orthorectification procedure was performed by the employees of the private company and authors of this paper.
Objects’ cadastral data are for the area of the city of Zrenjanin from 2016, and for the area of the city of Subotica from 2020.

2.2. Methods

The general idea and overall architecture of the proposed software solution is shown in Figure 2. According to the developed conceptual data model of the register of detected changes, a physical model and database schema are generated. The cadastral database is populated with the data obtained using a developed method for the (semi)automatic change detection, which is additionally inspected and corrected using traditional GIS editing tools.
The overview of the basic steps of the proposed methodology is shown in Figure 3. The first step after the pre-processing and validation of the proposed model is a detection of the building’s footprint using satellite images with a high spatial resolution. After detection of the building’s footprint and identification of changes on objects according to the rulebook and digital cadastral plan (DCP), it is necessary to check if the geometry of a detected object is valid, and to fix it if it is not. This step is manual, which means that for each detection it is necessary to validate geometry using an editing tool. After the validation, the final step is to update the cadastral database. All steps will be explained in detail.
The building footprint detection used in the study included two proposed methods. The first one used OBIA methods developed using eCognition, shown in Figure 4, while the pixel-based classification was carried out using U-Net.

2.2.1. Object-Based Classification Method

Generally, this process consists of several phases. The first one was multi-resolution segmentation (MRS) of the satellite image. This technique was used to extract reasonable image objects that we can use in the next steps. In the segmentation stage, scale, shape, and compactness must be determined in advance (related parameters are described in detail in [4,24] and weights were 2 for NIR band and 1 for RGB bands. Generally, the parameters were determined through visual assessment as well as trial and error for all three multi-resolution segmentations. We set the scale factor as 20, 30 and 45 respectively, shape parameter was 0.2, 0.2 and 0.4, and compactness was 0.5, 0.5 and 0.6 respectively. After MRS, spectral difference segmentation was performed, which allows merging of neighbouring image objects if the difference between their layer mean intensities is below the value given by the maximum spectral difference, which in our case was 30. With this segmentation, objects produced by previous MRS segmentations were refined by merging spectrally similar image objects. Association of attributes or feature selection was carried out using several indices such as NDVI, Zabud and MSAVI2, and we calculated the ratio of RGB and NIR bands, mean brightness values and Hue of RGB bands. Specifically, for the vegetation class we used training data or values of NDVI greater than 0.43. MSAVI2 and Zabud2 was additionally used to distinguish vegetation, ground, and objects. For class shadow, we used training data or values of brightness from −1 to 230. For class sun red roof, we have used training data and size of objects greater than 15 pixels (approximately 4 m2). In the classification part we have used all parts of the features form the previous step, and we also used relations to neighbour objects and relations to classification to reclassify all classes (shadow, sunny red roofs, shadow red roofs, brown roofs, vegetation, white roofs, orange roofs, red roofs with shadow and roads/concrete) in order to get one class that represents buildings footprints. Specifically, for example, for all sunny classes (brown, red, grey, and orange roof) the relation border to class shadow objects has a value of 0. For classes red and orange roof, values for relative border to shadow class must be below 0.09 and rectangularity fit value must be greater than 0.6. Classes red roof with shadow also must have a value of relative border to shadow greater than 0.1 and below 0.6. The most difficult part was to separate concrete roofs from concrete roads and paths. In this situation we have used relative border values with concrete (lower than 0.7), roads (lower than 0.4), vegetation (greater than 0.4) and shadow (lower than 0.2). All these values were defined after analysis of values of all clearly classified objects. Therefore, at the beginning of the classification, great attention should be given to image segmentation, and by the end of these several segmentations, we must get as clearly separated objects as possible. Reclassification and accuracy assessment was the final step.

2.2.2. Pixel-Based Method

In the last few years, convolutional neural networks have achieved superior accuracy in various areas of computer processing, such as image classification, object detection, and semantic segmentation. You et al. [25] analyzed the literature related to change detection using remote sensing images in the last five years, to summarize the current development situation and outline the possible direction of research to detect changes in an urban environment. Convolutional neural networks are a subtype of artificial neural networks, a type of deep neural network, designed to process locally dependent data coming in multiple sequences, usually images. Convolutional neural networks are widely accepted because they have proven superior to traditional methods in tasks such as image classification, object detection, and semantic segmentation [26,27,28].
Long, Shelhamer and Darrell were the first to develop an end-to-end model for image segmentation called fully convolutional neural network (FCN). An FCN uses a convolutional neural network to transform image pixels to pixel classes [29]. As Cheng et al. noted after covering more than 160 papers, this is still an active research topic [30]. Avoiding the use of dense layers means fewer parameters, which makes such nets faster for training. According to the structure, the most modern models of semantic segmentation can be divided into encoder-decoder and spatial association of pyramids. U-Net is a typical architecture with an encoder-decoder structure. The descending and ascending paths of the network are symmetrical, so the network has the appearance of the letter U, from which it derived its name. This architecture has shown significant improvement in several applications, especially for the detection of objects on satellite images, as evidenced by numerous papers [31,32,33,34,35]. U-Net has gained popularity due to its results in various semantic segmentation tasks. The main advantage of U-Net is the ability to perform precise segmentation with small training data.
The second approach for the object detection used in this paper is based on the application of convolutional neural networks, more precisely on the U-Net architecture of the neural networks. The methodology is shown in the Figure 5, and it will be explained in detail below.
The first step in this methodology is preprocessing of data, which in addition to creating vegetation indices and dividing the data into a set for training, test, and prediction, also includes slicing the raster into smaller parts of regular shape (128 × 128 pixels in our case). This step is necessary to apply the U-Net neural network architecture to our data.
As shown in Figure 6, the U-Net consists of two parts: an encoder (left) and a decoder (right). The U-Net architecture consists of an encoder that captures contextual information and a symmetric decoder that returns the spatial resolution of the initial raster. Skip connection is used to connect high-resolution maps from the encoder to the corresponding caused decoder output, allowing the network to more accurately predict the outputs based on that information.
The encoder has a typical CNN architecture (convolution, activation, maximum association). In each step of the down-sampling, we double the number of channels. This encoder architecture contains four blocks: the first two blocks consist of two convolutional layers with a 3 × 3 filter, while the third and fourth have three and five convolutional layers, respectively. The addition of new convolutional layers represents a simple modification of the basic model of the U-net architecture, which provides satisfactory accuracy. The ReLU activation function was applied to each block, as well as a maximalization operation with a 2 × 2 filter.
The decoder and encoder contain four blocks. Each decoder block consists of a re-sampling operation followed by a 2 × 2 convolution that halves the number of channels, which is combined with the corresponding encoder map. Each decoder block has two convolutional layers with a 3 × 3 filter and a ReLU activation function applied to each of them. The last layer of the grid connects each pixel with a certain class and performs a convolution operation with a 1 × 1 filter. Finally, we can say that the network architecture applied in this paper has 23 convolutional layers, and 21 ReLU activation functions.
After the data were prepared in an appropriate way, the neural network architecture was chosen and the model for classification was created, the training of that model and the assessment of its accuracy could begin. The input data set for training was divided into two parts with a ratio of 80:20. With this step, we could conduct a quantitative assessment of the model during the training of the neural network, and we could obtain information about how well the network is trained with data that did not participate in the training. To avoid excessive network training, which can lead to poor identification of objects, the early stop parameter in the training phase was used. With this parameter, the training was interrupted at the moment when the accuracy rating over the validation data starts to decrease (if better results are not obtained in the next three epochs from the moment the highest accuracy is reached).
After the completion of the training phase, testing and evaluation of the results was performed. We first applied the trained model for building identification, and then evaluated the accuracy of the classification, using the dataset for testing. After that, we applied the same model on the part of the image, for which we do not have cadastral records, and used it to perform semantic segmentation of the raster (building detection).
The goal of the semantic image segmentation is to mark each pixel of an image with an appropriate class. Image segmentation is the process of dividing a digital image into multiple segments known as image objects. Modern models for image segmentation are based on convolutional networks. Consequently, deep learning, especially the deep convolutional neural network (CNN), is a good and rewarding approach to automatic learning of object characteristics. Panboonyuen et al. [36] proposed a new method to improve the accuracy of semantic segmentation. The proposed model showed superiority over other models on all tested data. The important thing to note is that in this segmentation, instances of the same class are not separated, in other words, if we have two objects of the same category in the input image, we do not essentially distinguish them as separate objects.
After we applied the model over the input data, the result was a raster that represents probability maps with a range of (0, 1), with 0 as the lowest probability of the building’s existence, and with 1 as the highest probability of the building’s existence. The next step is to define the probability value, based on which buildings will be identified. The probability value used in this work is 0.5.
The last step is to merge all the classified parts of the initial raster in order to obtain a raster with two classes (object and not object) of the same dimensions as the initial satellite image.

2.2.3. Accuracy Assessment

Metrics

In addition to the visual assessment, the most important is certainly the numerical, i.e., quantitative, assessment of the accuracy of the obtained results. In classification tasks, the confusion matrix is often used to assess the accuracy and reveal information and performance of the model, where each row of the confusion matrix represents the prediction category, and each column represents the actual category to which the pixel belongs.
Overall accuracy is one indicator for evaluating the classification model. The total accuracy tells us the number of accurately classified pixels, from all reference locations. Total accuracy is usually expressed as a percentage, with an accuracy of 100% representing perfect classification where all reference locations are correctly classified [37].
Formally, accuracy has the following definition:
O A = N u m b e r   o f   c o r r e c t   p r e d i c t i o n s T o t a l   n u m b e r   o f   p r e d i c t i o n s [ 0 , 1 ]
For binary classification, accuracy can also be calculated using positives and negatives as follows: [38]
O A = T P + T N T P + T N + F P + F N [ 0 , 1 ]
True positive (TP) is the number of correctly identified pixels of buildings, and true negative (TN) is the number of correctly identified pixels that do not belong to buildings. False positive (FP) pixels are those that are classified as a building in a place where it does not exist, while false negative pixels (FN), are those that belong to buildings and are classified in another class.
The Kappa coefficient is one of the parameters used in this paper to assess the quality of the model and it is a measure of the correspondence between the classification results and the reference data [39]:
k = p 0 p e 1 p e = 1 1 p 0 1 p e
where p0 is observed accuracy and pe is random agreement. The observed accuracy is determined by the diagonal in the confusion matrix, while the random agreement includes the members outside the diagonal. If p0 and pe completely agree, then the Kappa statistic is equal to 1. However, if there is no agreement between these values the Kappa statistic will be zero. Similar to most correlation statistics, Kappa can range from −1 to +1. Although Kappa is one of the most commonly used statistics for reliability testing, it also has limitations on the level of Kappa statistics that are sufficient to accept a model. To solve this problem Landis and Koch [40] proposed the following scale:
  • <0—No agreement
  • 0—0.20 Slight
  • 0.21—0.40 Fair
  • 0.41—0.60 Moderate
  • 0.61—0.80 Substantial
  • 0.81–1.0—Perfect
Additionally, the values of the Precision and Recall parameters provide accuracy information. The overall performance of the model is not well described when it comes to an unbalanced data set, and the precision and recall parameters reflect the true performance of the classification [18]:
P r e c i s i o n = T P T P + F P [ 0 , 1 ]
R e c a l l = T P T P + F N [ 0 , 1 ]  
Precision is the measurement of accurately identified positive cases from all positive cases and will decrease if the number of false positive results is high. Recall is the measurement of accurately identified positive cases from all actual positive cases. This will indicate whether false negatives have a large impact on model performance. These ratings range from 0 to 1, where a higher number indicates better performance.

Loss Function

Deep learning is an iterative process, usually with many parameters. In order to make the adjustment as efficient as possible, the loss function is applied to the problem, among other things. The loss function is a cost that the optimizer will try to reduce by updating the weights, so the neural network learns and improves its performance. The loss function examines each pixel individually and compares class predictions with accurate data.
One of the most commonly used loss functions for image segmentation tasks is pixel-wise cross entropy. Cross entropy can be derived from the maximum likelihood (ML) method, which is a method for estimating model parameters [41,42]. A good estimate of the parameters is obtained by using the parameter model p m o d e l ( x i ; θ ) , where x is the input data and θ the model parameters. The ML will try to fit the function that maps the given entry as close as possible to the true function, and this is achieved by optimization via the parameter θ , with the criterion:
θ M L = argmax θ i = 1 m p m o d e l ( x i ; θ )  
In the case of a binary classification problem, binary cross entropy can be used as a loss function, assuming that there are only two classes. The loss minimization in this paper was conducted using the Adam optimizer.

2.2.4. Data Model for the Register on Determined Changes on Buildings

Due to the frequent occurrence of illegal construction of buildings and due to the inconsistency of data in the field and in official registers in general, the Rulebook on established changes on buildings was adopted in July 2020 [22]. This rulebook regulates the content, establishment, maintenance and use of the records that contain data about identified changes on buildings.
The records should contain data on the determined changes in the buildings in relation to reference epoch of aerial photography. Three cases of change should be recorded:
  • Buildings which are not registered in the real estate cadastre.
  • Buildings which are registered in the real estate cadastre, but their base dimension has changed in relation to buildings registered in the real estate cadastre.
  • Buildings which are registered in the real estate cadastre but are demolished in the field.
The buildings for which changes are determined are buildings of all types (residential, commercial and commercial buildings, cultural, sports and recreation buildings and similar buildings).
The rulebook defines the new records as an extension of real estate cadastre records. Therefore, it is necessary to define a data model for the determined changes on the buildings. A well-defined data model is the core of the cadastral information system. Thus, it must be in accordance with existing international standards as well as with national legislation. A conceptual data model for real estate cadastre in Serbia [43] was developed according to the Law on State Survey and Cadastre [44] and ISO 19152 Land Administration Domain Model [45]. A conceptual data model (UML Class diagram) for Serbian cadastre is based on four classes that represent main concepts of real estate cadastre as shown on Figure 7: parties (RS_Party), spatial units such as parcels, buildings and building parts (flats, business offices) (RS_SpatialUnit), rights and restrictions that parties can have over spatial units (RS_RRR) and basic administrative units that collect all the data regarding one spatial unit (RS_BAUnit).
This core model is further developed in detail to introduce all necessary classes and associations between them to fully represent the standardized cadastral domain for Serbia [43]. In order to extend this model to contain new records on changed buildings, a new class RS_Changed_Building was added (Figure 8).
An attribute UPIN represents the unique property identification number that is defined for each property in Serbia. For the new building this number is generated, and for the modified or deleted building it is the same as the UPIN in the real estate cadastre for a specific building. For the case of new and modified buildings, a geometry attribute will be populated, and the area of the building base will be calculated. Class RS_Changed_Building is derived from RS_SpatialUnit and contains a link to a specific spatial unit group such as cadastral municipality. When the building is built illegally it is possible that it is placed not on just one, but on multiple parcels. In order to record such data, an association between classes RS_Parcel and RS_Changed_Building is added. There is also association to the class RS_Building to show the connection with existing buildings in the real estate cadastre. Further, it is necessary to keep the information about the source (for example, aerial photography) that is used to compare with actual real estate cadastre data (CL_SourceType). Whether the identified change is the new building, demolished building or modified building, is one of the key pieces of information for these records. These data are selected from CL_TypeOfIdentidiedBuilding code list. Two dates, dateDCP and dateOtherSource, represent the dates of digital cadastral plan validity and other source’s validity. Based on collected data, derived building status can be chosen from CL_IdentifiedBuildingStatus.
These records are used in the process of maintaining the real estate cadastre, in the procedure of legalization of buildings in accordance with the national laws.

3. Results

3.1. Preprocessing

In the initial phase of data collection and analysis, a large amount of data on buildings were collected; this set contains over 1500 polygons which represent the position and shape of each object. Of the total amount of data on buildings, for classification in eCognition and U-net, about 80% was taken for model training while the remaining 20% was used for model testing to assess accuracy (Figure 9).
In the next phase, inaccuracies in the vector data were corrected, and then that data were converted to raster format. In this way, binary rasters were obtained where pixels with a value of 1 represent the locations where the object is located, while pixels with a value of 0 represent locations where there are no objects. The raster obtained in this way, together with satellite image, will represent the input data for the training of the U-Net neural network (Figure 10).
Since the models of deep learning for the training phase need to forward images of fixed size, it is necessary to slice satellite images and rasters with object masks into smaller parts (defined dimensions of the input data are 128 × 128 pixels).
The following table (Table 1) provides data on the number of images for training, test, and prediction for both analyzed locations, and total number of objects from cadastral data.

3.2. Training and Accuracy

The neural network training was conducted using the publicly available cloud platform Collaborators, hosted on Google Cloud [46].
Using early stop parameter, we determine that the number of epochs required for training the U-Net network with data for Zrenjanin and Subotica is 17, while the accuracy of the training model in both cases is over 90%.
In the following diagrams (Figure 11 and Figure 12), we can see the accuracy and loss function curve, that are obtained in the process of training the neural network. From these diagrams we can see that, for both analyzed areas, slightly weaker results are obtained for data that did not participate in the training. What can still be concluded is that with the increase in the number of epochs, greater accuracy of the model will not be obtained, since after the first 10 epochs the evaluation curve of the model takes a stable appearance without major jumps, while the validation curve follows with smaller variations. Therefore, if necessary, the accuracy of the model could be increased in some other way, such as increasing the set of input data, satellite image bands, use of DSM, or change of neural network architecture (by adding new layers).

3.3. Building Identification Results

After the completion of the training phase, testing and evaluation of results is performed. Next, the trained model was applied to the testing data set, and accuracy assessment of the classification was performed again. The same procedure was applied on the remaining data set. The results obtained using the U-Net neural network in the test area for both locations are shown in (Table 2):
The total number of objects in both tables (Table 1 and Table 2) represents a number of all objects from the official cadastral database. As we can see, there are a number of buildings that have not been identified, but based on the results shown above, we can conclude that the accuracy of object identification on the new data set is about 90%, which follows the accuracy of the model obtained during training. Based on this, we can conclude that the model is able to identify buildings with high accuracy for areas that are outside the area used for training. In the next figure (Figure 13) we can see the result of the identification of objects in the test area of the city of Subotica.
Evaluation of the accuracy of the classification (object identification) was carried out using 2000 points for each test area, and 1000 points for each of the classes (we have two classes of buildings and not buildings). That number was chosen because with 2000 points a high density was obtained and the entire test area was evenly covered. Accuracy assessment was performed based on error matrix and Kappa statistics. The results of the accuracy assessment are shown in the following table (Table 3).
During the analysis of the results, the raster data obtained after the applied classification were compared with the reference data, and a new raster was obtained in which the pixels were classified into three categories: TP—true positive, FP—false positive and FN—false negative. A visual overview for one of the three test areas is given in the following figure (Figure 14). Green polygons represent correctly identified objects (TP), blue polygons represent an object that was not recognized the with model but does exist (FN), and red parts are recognized as objects but do not exist (FP).
In the next figure (Figure 15) RGB view of the satellite image, ground truth data, prediction results and the difference between this data and ground truth data are presented. This is an example of how the resulting changes can be identified.
Very often with this type of analysis, a problem in identifying roofs can be caused by the size of the building, which varies greatly, so the building can be defined with a few pixels or can cover most of the image. Additionally, another problem consists of old buildings that have dark roofs and are visually difficult to distinguish from other buildings and structures. The orientation of the object can also play an important role in identifying objects, because the part of the roof that is oriented towards the sun (in the shade) has a weak reflection, while the opposite side is light and shows a high reflection in all lanes; thus, obtained high contrast can make it impossible to identify the part of the roof that is in the shade (this is typical for classification results from eCognition). However, in the following figure (Figure 16), which displays the result of identifying objects without ground truth data, we can see that the proposed U-Net neural network architecture copes very well with these problems and easily overcomes them.
Additionally, the proposed architecture of the U-Net neural network is capable of solving problems in the input data, when some parts of the image are incorrectly marked as parts under the object. Such errors most often occur in densely built-up parts of the city when several buildings are located next to each other. In these cases, it may happen in the input data, that all these near objects are marked as one, although this is not the case. In the following figure (Figure 17), we can see the building blocks and the error in the input data, which was partially corrected after classification. As can be seen, in the end, individual polygons are obtained, which represent separate objects and not one common polygon for all buildings, as was the case in the input data.
We can conclude that the proposed architecture of the U-Net neural network can easily cope with errors in the input data, which is the main advantage of this type of object identification compared to other models of machine learning that are much more sensitive to input data errors.
Errors in this type of building identification can also be caused by red cars that have a reflection similar to the reflection of roofs (Figure 18).
Moreover, due to the existence of residential buildings in the area of analysis that have gray roofs, errors are visible in concrete surfaces (such as playgrounds, football fields, etc.). Examples of these errors are given in the figure below (Figure 19).

3.4. Identification of Objects According to the Rulebook

The following results show how identified objects can be classified according to the Rulebook and demonstrate the applicability of the method to address the requirements given in this official document.

3.4.1. Objects That Exist in Cadastral Records but Are Not Visible on the Orthophoto

The lack of up to date data in the cadastre is a big problem for the further development of the cadastre itself and the successful collection of taxes. In addition to not registering newly built facilities, another problem is outdated records of facilities, i.e., we can find information about buildings that have been demolished and do not exist anymore but are still registered in the cadastre. To solve this problem, two different methods of satellite image classification have been applied. The following figures indicate the errors in the input data and show the classification results.
Figure 20 shows that both methods correctly identified the non-existence of objects that are still registered in the real estate cadastre. Here we can also see the correct identification of newly built objects that are not registered in the cadastre, so we conclude that U-Net and eCognition give quite similar results.
Figure 21 show the success of both methods in overcoming this problem, with very similar results obtained using U-Net and eCognition.

3.4.2. Objects That do Not Exist in Cadastre but Are Visible on the Orthophoto

One of the reasons for the non-existence of some objects in the input data set (cadastral data), which can be seen on the orthophoto, is the result of illegally constructed buildings that need to be identified, which with the estimate of two million illegally constructed buildings [47] represent a major issue in Serbia. As already mentioned, the biggest advantage of the U-Net neural network architecture is that it can handle errors in the input data set used for training without major problems. Therefore, if some buildings were not given in the training set (cadastral data), after training and running the model over the same data all objects that were omitted from the input data set will be successfully identified, which can be seen in the following figures (Figure 22 and Figure 23) circled in red.
Due to the comparison of this type of classification (U-Net neural network) with the object-oriented classification from eCognition, the following images show the same part of the satellite image with the results in the identification of illegal objects obtained in both ways. In the following example, we notice that two smaller objects are successfully recognized by both methods, but we can also see that in addition to these two objects, there is a certain number of pixels that are incorrectly classified. Depending on the classification method and the area of analysis, the number of these misclassified pixels varies, so for this area we see that the best results were achieved using the U-Net neural network (Figure 24).
The following examples (Figure 25) also show a comparison of the two classification models, where we can see that both methods successfully recognized the upgrade of one object. In this example as well as in the previous one, we see that the best results (with the least number of misclassified pixels) are achieved using the proposed architecture of the U-Net neural network.

3.4.3. Objects Exist in Cadastre and in Orthophoto, but with Different Surfaces

A problem that can occur when comparing the data obtained from the cadastre and the data obtained during the identification of buildings is the identification of a slightly wider zone around the building and the assignment to the same class of buildings. The reason for the appearance of this “buffer” is often the acquisition angle, which can make it difficult to separate the roof from the side walls of the object. U-Net neural network architecture can solve this problem, by reducing the probability limit. The following figure (Figure 26) gives an example of this problem for all classification methods. This problem, which is especially pronounced in tall buildings, leads to incorrect identification of objects, i.e., an object with a larger area than the actual area of the object in cadastral records; moreover, spatial position of the identified object will be shifted in relation to the building (the position of the object will differ from the cadastre).
On the other side, proposed methods for classification of objects show very good results in identification of objects that exist in the cadastre and in orthophoto, but with different surfaces. The following figure (Figure 27) shows the difference between the objects identified by both analyzed methods and the objects in the cadastre. We can now see much more clearly that both classification methods found a newly constructed building near an existing one.

3.5. Verification of the Results in the Register on Determined Changes on Buildings

Based on the obtained data, a register on determined changes on buildings can be established. Such a register should be based on the data model defined in Section 2.2.4. The main class (that represents a database table after conversion) that will be populated with detected data is RS_Changed_Building. An algorithm for this process will be based on spatial operators in order to create associations with parcels and buildings that are stored in the official records and also to create additional values and codes that will be stored in attributes of the RS_Changed_Building database table. The next three figures present three cases that can arise from the obtained data. These cases are important to recognize according to the Rulebook.
The first case is a situation when the detected data show that the building is demolished. A building 4602/1/3 is stored in the official records. The proposed method showed that there is no building on that location anymore. Since the date of satellite acquisition is later than the validity date in the official records, it can be concluded that the building has been demolished in the meantime. An instance diagram and building in the official records that represent such situation in Subotica are presented on Figure 28.
The second case is a situation when the detected data show the existence of new buildings that do not exist in the official records. An example on Figure 29 shows that two buildings have been built on agricultural parcels in Subotica in the period between the date of satellite acquisition and the validity date in the official records. Additionally, the new buildings are located on two parcels which means that these buildings are built without proper building permit, and that further processes of decision-making should be conducted by the surveying and mapping authority.
The third case is a situation when the detected data show that the building was modified since its footprint differs from the one in the official records. Figure 30 shows an example in Subotica where the existing building was expanded, which was also carried out without proper permits and requires an appropriate response from the surveying and mapping authority.

4. Discussion

Organized and well-structured cadastral maps are a prerequisite for better services in land administration. Following best practices with using remote sensing techniques instead of a filed survey, Republic Geodetic Authority of the Republic of Serbia has acquired very high resolution satellite images for the years 2015/2016, and 2020. New very high resolution satellite images were acquired within the project “Improvement of Land Administration in Serbia” that is being implemented with the support of the World Bank [47]. These images will provide numerous benefits for both citizens and the economy, through the provision of up to date information on real properties.
Very high resolution satellite images from the years 2015/2016 and 2020 were of great importance for the implementation of infrastructure projects, spatial planning, and projects of national importance in the fields of agriculture, water management, forestry, environmental protection, mining and energy, risk management, and establishment of spatial information systems at the national and local levels.
By using orthophotos, made on the basis of satellite images that were collected in 2020 and 2015/2016, it will be possible to determine changes on real properties in order to update official registers and records on real properties of the responsible state institutions. The results of building extraction presented in this paper can be compared to other results reported in the literature, but also not directly due to different study areas, data that are used, variety of buildings and finally approaches that are used and the purpose of the study.
Lucian et al. [48] evaluated the impact of the spatial extent on the geometric accuracy of the objects delineated through multiresolution image segmentation. The experiments revealed that the geometric accuracy improved by 8–19% in quality rate when multiresolution segmentation was performed in smaller extents, as compared to the segmentation of whole images. Mariana and Lucian [49] also compared supervised and unsupervised segmentation approaches in OBIA by using them to classify buildings from three test areas in Salzburg, Austria, using QuickBird and WorldView-2 imagery. All three of the methods evaluated achieved similar classification accuracies, with overall accuracies between 82.3% and 86.4% and Kappa coefficients between 0.64 and 0.72. They also concluded that segmentation has an impact on classification with very different image objects, but accuracies were very similar. This result suggests that, as long as under-segmentation remains at acceptable levels, imperfections in segmentation can be ignored so that a high level of classification accuracy can still be achieved. Lei et al. [12], using information available in 173 scientific publications, among other things have found that high spatial resolution remote-sensing imagery remains the most frequently used data source for supervised object-based land-cover image classification, and the dominant image resolutions are 0–2 m. Divyesh in his thesis [50] used two datasets from East Asia and Munich, Germany (Ikonos and WV2) and DSM. He used information similarity measures for change detection of buildings, using VHR satellite images and DSM (incorporating height information from DSMs to assess changes in both horizontal as well as vertical direction). The effectiveness of the presented approach was evaluated through pixel-based assessment, as well as object-based assessment, with overall accuracy ranging from 86.307% to 93.75 % for object-based and 96.99 to 99.1291 for pixel-based quality assessment.
Khosravi et al. [51] evaluated and compared four building detection algorithms: two pixel-based and two object-based algorithms, using a diverse set of high-resolution satellite imagery. The results indicated that the performance and the reliability of object-based algorithms were better than pixel-based algorithms. Kriti et al. [52] compared several deep learning techniques with different architecture in automatic building footprint extraction. The evaluation over the test datasets with different networks showed accuracy from 85.2% to 91.5% in global results, and in urban areas of slums, isolated and dense built-up areas, accuracy went from 60% to 96.75% due to low spectral and textural variance among the buildings. Additionally, distances between buildings are less than 2 pixels which are difficult to delineate even through visual interpretation, resulting in creation of relatively poor training data for slum areas, with model accuracy of 72.5%. On the other hand, Wang et al. [31] reached a very high value of overall accuracy (94.12%) for building segmentation with their proposed innovative image processing method implementing the efficient Non-local Residual U-shape Network (ENRU-Net).
The main issue in Serbia is a lack of (or limited access to) up to date VHR images and other remote sensing data such as LiDAR and other derived products, not just for practical application, but also for research. Furthermore, one of the largest issues is the existence of more than two million illegal buildings [23] (newly built or changed), which results in an inaccurate cadastral database and a lack of tools that can help in detection of those illegally built or changed buildings in a (semi)automatic manner. With our proposed method we want to improve the current situation and support the implementation of a newly adopted “Rulebook on the records of identified changes on buildings” in Serbia, which requires the development of a special register of such buildings. This method will significantly speed up the entire process of detecting such buildings, entering data in the register, and, consequently, it will lead to an up to date cadastral database. The methodology proposed in this paper for automatic building extraction is simple, fast, efficient and achieves accuracy from 84% to 88% (Table 3). It does not require additional information, such as digital surface models (DSM), and gives good results even when we have only a satellite image with RGB and NIR bands. The proposed methodology can be further used for various applications, not only in Serbia, but also in all developing countries, which have a problem of lack of funds and access to additional spatial data that can help. In addition, it can be used in the process of the identification of illegally constructed or changed buildings, for which it is applied in this paper, and to assess damage by identifying damaged and undamaged buildings. Interpretation of the obtained results shows that buildings with very light and dark roofs have been successfully identified. Additionally, interpretation of obtained results shows that proposed models can be used in a typical Serbian type of settlements, in an urban part, but also in the rural part of settlements where there are dominantly houses with different types of roofs and big green spaces. Similarly, some non-building structures such as cars are classified in the class of buildings because of their similar reflection value and structural properties.
Future work should consider the development of an appropriate software solution with a fully automated proposed methodology for storing and maintaining acquired data and using U-Net as a tool for change detection, since it is simple for implementation and achieves results comparable to the object-based method. The database for the solution should be organized according to the extended LADM country profile defined in the Methods and Material section. Available data not just for research, but also for practical application are limited, so future work will include improvements of proposed methods for building detection in terms of accuracy based on those available data.

5. Conclusions

The paper proposes a building change detection method to support the development of the register of identified changes on buildings defined in the official Rulebook of the Government of Serbia. Our results, using only VHR images containing only RGB and NIR bands, showed object identification accuracy ranging from 84% to 88%, with kappa statistic from 89% to 96%.
The proposed method is simple, efficient and achieves sufficient accuracy in both building detection and legality assessment, without the need of additional information such as LiDAR data or a digital terrain model. The proposed method can greatly increase the speed of the development of such a register compared to the manual procedure, considering a very large number of objects that need to be identified. The results are classified into three categories of possible changes on buildings defined in the rulebook to support the conclusion that the method is capable of solving the set of requirements specified in this Rulebook. Further improvements of the method will consider achieving higher accuracy based on the available data. Furthermore, the development of an appropriate software solution for storing and maintaining acquired data is anticipated.

Author Contributions

Conceptualization, D.J.; Data curation, M.G. (Milan Gavrilović); Investigation, M.G. (Milan Gavrilović) and A.R.; Methodology, D.J., M.G. (Milan Gavrilović), D.S. and A.R.; Supervision, D.J. and M.G. (Miro Govedarica); Writing—original draft, D.J., D.S. and A.R.; Writing—review and editing, M.G. (Milan Gavrilović), D.S., A.R. and M.G. (Miro Govedarica). All authors have read and agreed to the published version of the manuscript.

Funding

This research received no external funding.

Acknowledgments

Results presented in this paper are part of the research conducted within the Grant No. 37017, Ministry of Education and Science of the Republic of Serbia.

Conflicts of Interest

The authors declare no conflict of interest.

References

  1. Yan, L.; Fan, B.; Liu, H.; Huo, C.; Xiang, S.; Pan, C. Triplet Adversarial Domain Adaptation for Pixel-Level Classification of VHR Remote Sensing Images. IEEE Trans. Geosci. Remote Sens. 2020, 58, 3558–3573. [Google Scholar] [CrossRef]
  2. Li, W.; He, C.; Fang, J.; Zheng, J.; Fu, H.; Yu, L. Semantic Segmentation-Based Building Footprint Extraction Using Very High-Resolution Satellite Images and Multi-Source GIS Data. Remote Sens. 2019, 11, 403. [Google Scholar] [CrossRef] [Green Version]
  3. Inglada, J. Automatic recognition of man-made objects in high resolution optical remote sensing images by SVM classification of geometric image features. ISPRS J. Photogramm. Remote Sens. 2007, 62, 236–248. [Google Scholar] [CrossRef]
  4. Blaschke, T. Object based image analysis for remote sensing. ISPRS J. Photogramm. Remote Sens. 2010, 65, 2–16. [Google Scholar] [CrossRef] [Green Version]
  5. Cheng, G.; Han, J.; Lu, X. Remote Sensing Image Scene Classification: Benchmark and State of the Art. Proc. IEEE Inst. Electr. Electron Eng. 2017, 105, 1865–1883. [Google Scholar] [CrossRef] [Green Version]
  6. Hossain, M.D.; Chen, D. Segmentation for Object-Based Image Analysis (OBIA): A review of algorithms and challenges from remote sensing perspective. ISPRS J. Photogramm. Remote Sens. 2019, 150, 115–134. [Google Scholar] [CrossRef]
  7. Schiewe, J. Segmentation of high-resolution remotely sensed data-concepts, applications and problems. Int. Arch. Photogramm. Remote Sens. Spat. Inf. Sci. 2002, 4, 380–385. [Google Scholar]
  8. Meinel, G.; Neubert, M. A Comparison of segmentation programs for high resolution remote sensing data. Int. Arch. Photogramm. Remote Sens. Spat. Inf. Sci. 2004, 35, 1097–1102. [Google Scholar]
  9. Baatz, M.; Schäpe, A. Multiresolution Segmentation—An Optimization Approach for High Quality Multi-Scale Image Segmentation. In Angewandte Geographische Informations-Verarbeitung; Strobl, J., Blaschke, T., Griesebner, G., Eds.; Wichmanm Verlag: Karlsruhe, Germany, 2000; Volume 38, pp. 12–23. [Google Scholar]
  10. Cheng, G.; Han, J. A survey on object detection in optical remote sensing images. ISPRS J. Photogramm. Remote. Sens. 2016, 117, 11–28. [Google Scholar] [CrossRef] [Green Version]
  11. Trimble. Trimble eCognition Developer for Windows Operating System; Trimble Germany GmbH: Munich, Germany, 2017; ISBN 2008000834. Available online: https://bit.ly/3ldP6bc (accessed on 20 April 2020).
  12. Ma, L.; Li, M.; Ma, X.; Cheng, L.; Du, P.; Liu, Y. A review of supervised object-based land-cover image classification. ISPRS J. Photogramm. Remote Sens. 2017, 130, 277–293. [Google Scholar] [CrossRef]
  13. Myint, S.W.; Gober, P.; Brazel, A.; Grossman-Clarke, S.; Weng, Q. Per-pixel vs. object-based classification of urban land cover extraction using high spatial resolution imagery. Remote Sens. Environ. 2011, 115, 1145–1161. [Google Scholar] [CrossRef]
  14. Zhou, X.; Jancso, T.A.; Chen, C.H.; Verone, M.W. Urban land cover mapping based on object oriented classification using WorldView 2 satellite remote sensing images. In Proceedings of the International Scientific Conference on Sustainable Development & Ecological Footprint, Sopron, Hungary, 26–27 March 2012; p. 10. Available online: https://bit.ly/3j23Ozs (accessed on 1 June 2021).
  15. Norman, M.; Shahar, H.M.; Mohamad, Z.; Rahim, A.; Mohd, F.A.; Shafri, H.Z.M. Urban building detection using object-based image analysis (OBIA) and machine learning (ML) algorithms. IOP Conf. Ser. Earth Environ. Sci. 2021, 620, 012010. [Google Scholar] [CrossRef]
  16. Norman, M.; Shafri, H.Z.M.; Idrees, M.O.; Mansor, S.; Yusuf, B. Spatio-statistical optimization of image segmentation process for building footprint extraction using very high-resolution WorldView 3 satellite data. IEEE Trans. Geosci. Remote Sens. 2019, 35, 1124–1147. [Google Scholar] [CrossRef]
  17. Bergado, J.R.; Persello, C.; Stein, A. Recurrent Multiresolution Convolutional Net-works for VHR Image Classification. IEEE Trans. Geosci. Remote Sens. 2018, 56, 6361–6374. [Google Scholar] [CrossRef] [Green Version]
  18. Wu, G.; Shao, X.; Guo, Z.; Chen, Q.; Yuan, W.; Shi, X.; Xu, Y.; Shibasaki, R. Automatic Building Segmentation of Aerial Imagery Using Multi-Constraint Fully Convolutional Networks. Remote Sens. 2018, 10, 407. [Google Scholar] [CrossRef] [Green Version]
  19. Kokeza, Z.; Vujasinović, M.; Govedarica, M.; Milojević, B.; JakovljeviĆ, G. Automatic building footprint extraction from UAV images using neural networks. Geod. Vestn. 2020, 64, 4. [Google Scholar] [CrossRef]
  20. Ronneberger, O.; Fischer, P.; Brox, T. U-Net: Convolutional Networks for Biomedical Image Segmentation. ArXiv 2015, 9351, 234–241. [Google Scholar] [CrossRef] [Green Version]
  21. Xiao, P.; Yuan, M.; Zhang, X.; Feng, X.; Guo, Y. Cosegmentation for Object-Based Building Change Detection from High-Resolution Remotely Sensed Images. IEEE Trans. Geosci. Remote Sens. 2017, 55, 1587–1603. [Google Scholar] [CrossRef]
  22. Official Gazette of the Republic of Serbia No 102/20. The Rulebook on Established Changes on Buildings. Available online: https://bit.ly/3j6pxpF (accessed on 10 April 2021).
  23. Database of Illegally Constructed Buildings. Ministry of Building, Transportation and Infrastructure of Serbia, Belgrade. 2017. Available online: https://bit.ly/3rI00XP (accessed on 1 April 2021).
  24. Devereux, B.J.; Amable, G.S.; Posada, C.C. An efficient image segmentation algorithm for landscape analysis. Int. J. Appl. Earth Obs. Geoinf. 2004, 6, 47–61. [Google Scholar] [CrossRef]
  25. You, Y.; Cao, J.; Zhou, W. A Survey of Change Detection Methods Based on Remote Sensing Images for Multi-Source and Multi-Objective Scenarios. Remote Sens. 2020, 12, 2460. [Google Scholar] [CrossRef]
  26. Huang, J.; Zhang, X.; Xin, Q.; Sun, Y.; Zhang, P. Automatic building extraction from high-resolution aerial images and LiDAR data using gated residual refinement network. ISPRS J. Photogramm. Remote Sens. 2019, 151, 91–105. [Google Scholar] [CrossRef]
  27. Shao, Z.; Tang, P.; Wang, Z.; Saleem, N.; Yam, S.; Sommai, C. BRRNet: A Fully Convolutional Neural Network for Automatic Building Extraction from High-Resolution Remote Sensing Images. Remote Sens. 2020, 12, 1050. [Google Scholar] [CrossRef] [Green Version]
  28. Wierzbicki, D.; Matuk, O.; Bielecka, E. Polish Cadastre Modernization with Remotely Extracted Buildings from High-Resolution Aerial Orthoimagery and Airborne LiDAR. Remote Sens. 2021, 13, 611. [Google Scholar] [CrossRef]
  29. Long, J.; Shelhamer, E.; Darrell, T. Fully convolutional networks for semantic segmentation. In Proceedings of the 2015 IEEE Conference on Computer Vision and Pattern Recognition (CVPR), Boston, MA, USA, 7–12 June 2015. [Google Scholar]
  30. Cheng, G.; Xie, X.; Han, J.; Guo, L.; Xia, G.-S. Remote Sensing Image Scene Classification Meets Deep Learning: Challenges, Methods, Benchmarks, and Opportunities. IEEE J. Sel. Top. Appl. Earth Obs. Remote Sens. 2020, 13, 3735–3756. [Google Scholar] [CrossRef]
  31. Wang, S.; Hou, X.; Zhao, X. Automatic building extraction from high-resolution aerial imagery via fully convolutional encoder-decoder network with non-local block. IEEE Access 2020, 8, 7313–7322. [Google Scholar] [CrossRef]
  32. Wu, C.; Zhang, F.; Xia, J.; Xu, Y.; Li, G.; Xie, J.; Du, Z.; Liu, R. Building Damage Detection Using U-Net with Attention Mechanism from Pre and Post-Disaster Remote Sensing Datasets. Remote Sens. 2021, 13, 905. [Google Scholar] [CrossRef]
  33. Jin, Y.; Xu, W.; Zhang, C.; Luo, X.; Jia, H. Boundary-Aware Refined Network for Automatic Building Extraction in Very High-Resolution Urban Aerial Images. Remote Sens. 2021, 13, 692. [Google Scholar] [CrossRef]
  34. Ivanovsky, L.; Khryashchev, V.; Pavlov, V.; Ostrovskaya, A. Building Detection on Aerial Images Using U-NET Neural Networks. In Proceedings of the 24th Conference of Open Innovations Association (FRUCT), Moscow, Russia, 8–12 April 2019; pp. 116–122. Available online: https://bit.ly/2UWpQf2 (accessed on 1 June 2021).
  35. De Jong, K.L.; Sergeevna Bosman, A. Unsupervised Change Detection in Satellite Images Using Convolutional Neural Networks. In Proceedings of the International Joint Conference on Neural Networks (IJCNN), Budapest, Hungary, 14–19 July 2019; pp. 1–8. Available online: https://bit.ly/3fbOuii (accessed on 15 June 2021). [CrossRef]
  36. Panboonyuen, T.; Jitkajornwanich, K.; Lawawirojwong, S.; Srestasathiern, P.; Vateekul, P. Semantic Labeling in Remote Sensing Corpora Using Feature Fusion-Based En-hanced Global Convolutional Network with High-Resolution Representations and Depthwise Atrous Convolution. Remote Sens. 2020, 12, 1233. [Google Scholar] [CrossRef] [Green Version]
  37. Ulmas, P.; Liiv, I. Segmentation of Satellite Imagery using U-Net Models for Land Cover Classification. Comput. Sci. 2020, 3, 1–2. [Google Scholar] [CrossRef]
  38. Kulkarni, A.; Chong, D.; Batarseh, F.A. Foundations of data imbalance and solutions for a data democracy. ScienceDirect 2020, 6, 83–106. [Google Scholar] [CrossRef]
  39. Julius, S.; Wright, C.C. The Kappa Statistic in Reliability Studies: Use, Interpretation, and Sample Size Requirements. Phys. Ther. 2005, 85, 257–268. [Google Scholar] [CrossRef] [Green Version]
  40. Landis, J.R.; Koch, G.G. The measurement of observer agreement for categorical data. Int. J. Biom. 1977, 3, 159–174. [Google Scholar] [CrossRef] [Green Version]
  41. Goodfellow, I.; Bengio, Y.; Courville, A. Deep Learning; MIT Press: Cambridge, MA, USA, 2016. [Google Scholar]
  42. Fritz, K. Instance Segmentation of Buildings in Satellite Images. Master’s Thesis, Linköping University, Linköping, Sweden, January 2020. Available online: https://bit.ly/3fbdHcV (accessed on 15 April 2021).
  43. Radulović, A.; Sladić, D.; Govedarica, M. Towards 3D Cadastre in Serbia: Development of Serbian Cadastral Domain Model. ISPRS Int. J. Geo-Inf. 2017, 6, 312. [Google Scholar] [CrossRef] [Green Version]
  44. Official Gazette of the Republic of Serbia. The Law on State Survey and Cadastre. 2009. Available online: https://bit.ly/3xjMXxe (accessed on 30 May 2021).
  45. ISO 19152:2012 Geographic Information—Land Administration Domain Model (LADM). Available online: https://bit.ly/3fcfM8r (accessed on 24 May 2021).
  46. Cloud Computing Services. Available online: https://cloud.google.com/ (accessed on 15 April 2021).
  47. Serbia-Real Estate Management Project. The World Bank. Available online: https://bit.ly/3j7EUOZ (accessed on 15 April 2021).
  48. Lucian, D.; Mariana, B.; George, P.; Peter, B. Sensitivity of multiresolution segmentation to spatial extent. Int. J. Appl. Earth Obs. Geoinf. 2019, 81, 146–153. [Google Scholar] [CrossRef]
  49. Mariana, B.; Lucian, D. Comparing supervised and unsupervised multiresolution segmentation approaches for extracting buildings from very high resolution imagery. ISPRS J. Photogramm. Remote Sens. 2014, 96, 65–75. [Google Scholar] [CrossRef] [Green Version]
  50. Divyesh, V. Change Detection of Buildings Using Satellite Images and DSMs. Master’s Thesis, Technische Universität München, München, Germany, 2011. [Google Scholar]
  51. Khosravi, I.; Momeni, M.; Rahnemoonfar, M. Performance Evaluation of Object-based and Pixel-based Building Detection Algorithms from Very High Spatial Resolution Imagery. Photogramm. Eng. Remote Sens. 2014, 6, 519–528. [Google Scholar] [CrossRef] [Green Version]
  52. Kriti, R.; Pankaj, B.; Shashikant, A.S. Automatic Building Footprint extraction from Very High-Resolution Imagery using Deep Learning Techniques. Geocarto Int. 2020, 5, 1–4. [Google Scholar] [CrossRef]
Figure 1. Area of interest.
Remotesensing 13 03150 g001
Figure 2. Overall architecture of the proposed solution.
Remotesensing 13 03150 g002
Figure 3. The overview of the proposed methodology.
Remotesensing 13 03150 g003
Figure 4. Extracting footprints of buildings using ecognition.
Remotesensing 13 03150 g004
Figure 5. Extracting footprints of buildings using U-net.
Remotesensing 13 03150 g005
Figure 6. Proposed adapted U-net architecture.
Remotesensing 13 03150 g006
Figure 7. LADM core clasess.
Remotesensing 13 03150 g007
Figure 8. Proposed conceptual model for the register on determined changes on buildings.
Remotesensing 13 03150 g008
Figure 9. Data used for training (blue) and model testing data (yellow): (a) Subotica; (b) Zrenjanin.
Remotesensing 13 03150 g009
Figure 10. An example of a pair of input data used for training: (a) Subotica; (b) Zrenjanin.
Remotesensing 13 03150 g010
Figure 11. Subotica—accuracy and loss function curve.
Remotesensing 13 03150 g011
Figure 12. Zrenjanin—accuracy and loss function curve.
Remotesensing 13 03150 g012
Figure 13. Ground truth cadastral data overlap with results—Subotica.
Remotesensing 13 03150 g013
Figure 14. Example of object identification in Subotica: (a) U-Net; (b) eCognition.
Remotesensing 13 03150 g014
Figure 15. Test data—Subotica.
Remotesensing 13 03150 g015
Figure 16. Examples of object identification without ground truth data—Zrenjanin.
Remotesensing 13 03150 g016
Figure 17. Corrected errors in the input data.
Remotesensing 13 03150 g017
Figure 18. A car identified as a building.
Remotesensing 13 03150 g018
Figure 19. Concrete terrain identified as a building.
Remotesensing 13 03150 g019
Figure 20. Non-existence of objects that are still registered in the real estate cadastre—Subotica.
Remotesensing 13 03150 g020
Figure 21. Non-existence of objects that are still registered in the real estate cadastre—Zrenjanin.
Remotesensing 13 03150 g021
Figure 22. Correctly identified objects that were not in the training set—Zrenjanin.
Remotesensing 13 03150 g022
Figure 23. Correctly identified objects that were not in the training set—Subotica.
Remotesensing 13 03150 g023
Figure 24. New identified objects.
Remotesensing 13 03150 g024
Figure 25. Comparison of the two classification models—misclassified pixels.
Remotesensing 13 03150 g025
Figure 26. Examples of identifying tall objects.
Remotesensing 13 03150 g026
Figure 27. Difference of identified buildings and cadastral data.
Remotesensing 13 03150 g027
Figure 28. (a) Building in the official records. (b) An instance diagram of the detected demolished building.
Remotesensing 13 03150 g028
Figure 29. (a) Purple—parcels in the official records, yellow—buildings in the official records, pink—detected buildings. (b) An instance diagram of detected new buildings.
Remotesensing 13 03150 g029
Figure 30. (a) Blue—parcels in the official records, red—buildings in the official records, green—detected buildings. (b) An instance diagram of detected change on the building.
Remotesensing 13 03150 g030
Table 1. Number of images used for training, test and prediction, and total number of objects.
CityNumber of ImagesNumber of Objects
TrainingTestPredictionTotal
Zrenjanin26932106407780
Subotica321806041005778
Table 2. Building identification results in test area.
CityTotal Number of ObjectsNumber of Correctly Identified Objects
U-NeteCognition
Zrenjanin141127126
Subotica120104111
Table 3. Accuracy assessment.
CityAccuracyKappa Statistic
U-NeteCognitionU-NeteCognition
Zrenjanin86.0886.028989
Subotica83.9988.0496.8496
Publisher’s Note: MDPI stays neutral with regard to jurisdictional claims in published maps and institutional affiliations.

