Article

A No-Reference CNN-Based Super-Resolution Method for KOMPSAT-3 Using Adaptive Image Quality Modification

1
Korea Aerospace Research Institute, 169-84 Gwahak-ro, Yuseong-Gu, Daejeon 34133, Korea
2
Department of System Semiconductor Engineering, Sangmyung University, Cheonan 31066, Korea
*
Author to whom correspondence should be addressed.
Remote Sens. 2021, 13(16), 3301; https://doi.org/10.3390/rs13163301
Submission received: 26 June 2021 / Revised: 6 August 2021 / Accepted: 17 August 2021 / Published: 20 August 2021
(This article belongs to the Special Issue Photogrammetry and Image Analysis in Remote Sensing)

Abstract

:
In recent years, research on increasing the spatial resolution and enhancing the quality of satellite images using the deep learning-based super-resolution (SR) method has been actively conducted. In a remote sensing field, conventional SR methods required high-quality satellite images as the ground truth. However, in most cases, high-quality satellite images are difficult to acquire because many image distortions occur owing to various imaging conditions. To address this problem, we propose an adaptive image quality modification method to improve SR image quality for the KOrea Multi-Purpose Satellite-3 (KOMPSAT-3). The KOMPSAT-3 is a high performance optical satellite, which provides 0.7-m ground sampling distance (GSD) panchromatic and 2.8-m GSD multi-spectral images for various applications. We proposed an SR method with a scale factor of 2 for the panchromatic and pan-sharpened images of KOMPSAT-3. The proposed SR method presents a degradation model that generates a low-quality image for training, and a method for improving the quality of the raw satellite image. The proposed degradation model for low-resolution input image generation is based on Gaussian noise and blur kernel. In addition, top-hat and bottom-hat transformation is applied to the original satellite image to generate an enhanced satellite image with improved edge sharpness or image clarity. Using this enhanced satellite image as the ground truth, an SR network is then trained. The performance of the proposed method was evaluated by comparing it with other SR methods in multiple ways, such as edge extraction, visual inspection, qualitative analysis, and the performance of object detection. Experimental results show that the proposed SR method achieves improved reconstruction results and perceptual quality compared to conventional SR methods.

1. Introduction

The term super-resolution (SR) imaging refers to the ill-posed problem of reconstructing a high-resolution image from a single low-resolution image. In the past, the method was mainly used for multiple images. However, single-image SR techniques which are able to learn a mapping relationship from a low-resolution (LR) space to a high-resolution (HR) space using deep learning have been recently studied. Therefore, interest in SR techniques has been increasing with regards to their practical applications. Thus far, deep learning-based research has focused on designing networks of various structures to improve the performance of natural datasets.
Dong et al. [1] proposed a simple network architecture consisting of three convolutional layers, called super-resolution convolutional neural network (SRCNN), which outperformed previous machine learning-based SR approaches. Kim et al. [2] proposed a very deep convolutional network based on VGG-net (VDSR), which was used in the ImageNet classification competition. VDSR demonstrated the capability to reconstruct HR images better than SRCNN by using 20 convolution layers in a very deep network. This performance may be attributed to the network’s large receptive field, which was achieved using multiple layers, and its ability to exploit contextual information over wide image regions. Processes designed to learn residuals between bicubic interpolated images and HR target images, as well as using high learning rates with adaptive gradient clipping, were used to alleviate slow training convergence, which is a common problem in very deep networks. In addition, Kim et al. [3] proposed a neural network applying a recursive method called Deeply-Recursive convolutional neural network (DRCN); they claimed that raising the recursion depth without adding new convolution parameters enabled improved performance. Lim et al. [4] proposed an enhanced deep residual network called EDSR to train the very deep layers; they demonstrated superior performance on benchmark datasets compared to state-of-the-art methods.
Tai et al. [5] proposed a deep recursive residual network as a compact network of residual layers and recursive learning. However, their model involved significant computational complexity owing to the pre-amplified input image generation method and deep network. Meanwhile, Haris et al. [6] proposed a deep back project network (DBPN) connecting iterative up- and down- sampling steps. The proposed network showed that the SR result was improved up to eight times by applying a method providing a feedback mechanism for the projection error at each step. Zhang et al. [7] proposed a residual density block (RDB) to extract abundant local features. The performance of their proposed network was improved by linking all levels from the prior RDB state to a current RDB state directly. Zhang et al. [8] created a network that improved the peak signal-to-noise ratio (PSNR) by using a channel attention mechanism; this network showed the effect of increasing detail by learning high spatial frequencies from general images.
Meanwhile, the generative adversarial network (GAN) method, involving networks applying generator/discriminator pairs, has shown great promise in SR research. Ledig et al. [9] first applied the GAN technique to SR, and their proposed method showed a high level of visual quality compared to the existing mean square error (MSE)-based technique even at the four times up-scaling resolution of the original image. Sajjadi et al. [10] proposed EnhanceNet, in which perceptual loss and texture transfer loss were combined with the GAN method. Tan et al. [11] proposed a feature super-resolution GAN, called FSRGAN, which was able to transform the raw poor features of small images into highly discriminative features in the feature space. Wang et al. [12] proposed a new network that removed the batch normalization layer from the SRGAN and added a residual-in-residual dense block (RRDB). In particular, in contrast to the prior GAN techniques, they achieved improved spatial resolution performance by adding a relativistic loss that compares the difference between HR and SR to the discriminator. Although the subjective image quality of images resulting from the use of GAN-based SR is improved, the texture is not restored correctly compared to the original image with the SRGAN method. The GAN method adds new information to the image textures that was not present in the original picture. As restorations with significant differences from the original images occur frequently, such method should be carefully applied in the case of important facts [13].
In the abovementioned study, bicubic down-sampling was used to acquire LR images for training super-resolution networks. The bicubic down-sampling technique for LR image acquisition has been widely used as a benchmark to evaluate SR methods owing to its simplicity. However, recent studies have been actively conducted on degradation models for obtaining LR images that are more sophisticated than bicubic down-sampling techniques. Essentially, the relationship between the LR image and the HR image is defined by a degradation model, which specifies how the LR image degrades in the HR image. According to Efrat et al. [14], an accurate estimate of the blur kernel is more important than a sophisticated image prior. As a result, the quality of the super-resolution image is determined by how well the blur kernel is predicted. Previous studies [15,16] conducted for estimating the blur kernel have shown inaccurate results. Kai et al. [17] designed a new SR degradation model to utilize the existing blind deblurring method for blur kernel estimation. Their proposed blur kernel used three types of kernels (Gaussian, motion, and disk) to create LR images. Based on their proposed method, they designed a super-resolution framework: a deep plug-and-play super-resolution (DPSR) that predicted the blur kernel and demonstrated high-quality performance in natural images. In a similar study, Kai et al. [18] proposed a denoising network for super-resolution: a deep unfolding network for super-resolution (USRNET) that produced clearer HR images instead of clearer LR images, as proposed by DPSR. The methods proposed in DPSR and USRNET had the disadvantage of having to repeatedly pass through the network to obtain a better super-resolution image. Therefore, iteration schemes typically consumed more inference time and required more human intervention to select the optimal number of iterations. To address this issue, some recent studies [19,20] proposed a non-iterative framework by introducing a more accurate performance degradation estimation or more efficient function adaptation strategy.
Unlike natural images, the various blur kernels proposed in previous studies [17,18,19,20] are rarely applied to satellite images owing to a variety of external conditions. For example, the quality of satellite images varies according to the external conditions such as weather and satellite altitude. Moreover, due to the extreme distance between the sensor and the objects on earth, it is possible to have extensive coverage; however, the number of targets in one scene is huge compared to that of natural images, and the resolution may be low depending on sensor performance [21]. In this situation, when the conventional SR methods are applied to satellite images, the quality of the obtained SR images may deteriorate. Consequently, it is essential to design sophisticated degradation models due to the difference in image characteristics for satellite images different from natural images.
Recently, much research has been conducted on the practical implementations of SR in satellite imaging. Jiang et al. [22] proposed a novel, deep distillation recursive network (DDRN) for remote sensing satellite image SR reconstruction using an end-to-end training method. They proposed ultra-dense residual blocks, which provide additional opportunities for feature extraction via ultra-dense connections that correspond to the uneven complexity of image content. They also built distillation and compensation mechanisms to compensate for the loss of high-frequency details. Kwan [23] proposed a review of recent image resolution enhancement algorithms for hyperspectral images, including single super-resolution and multi-image fusion methods. The author also proposed some proactive ideas for addressing the aforementioned issues in practice. In the absence of hyperspectral images, the author proposed using band synthesis techniques to generate high resolution (HR) hyperspectral images from low resolution (LR) MS images. In addition, many studies have been attempted to apply the super-resolution algorithm to unmanned aerial vehicle (UAV) applications. Burdziakowski [24] demonstrated super-resolution (SR) algorithms for improving the geometric and interpretive quality of the final photogrammetric product. They evaluated its impact on photogrammetric processing accuracy and the traditional digital photogrammetry workflow. Haris et al. [25] proposed a super-resolution method for UAV images based on sparse representation by adapting multiple pairs of dictionaries that are classified by edge orientation. Consequently, they demonstrated the proposed method’s effectiveness in reconstructing 3-D images. Kang et al. [26] proposed an improved regularized SR method for UAV images by combining the directionally-adaptive constraints and multiscale non-local means filter. By estimating the color of a HR image from a set of multispectral LR images using intensity–hue–saturation image fusion, they were able to overcome the physical limitations of multispectral sensors.
Although satellite images may be obtained from the same orbit, perfectly identical image pairs for a specific area are impossible to obtain owing to many factors that cannot be controlled, such as weather conditions, sensors used, and moving objects on the ground. For this reason, the importance of the single-image SR (SISR) method is further emphasized in the field of remote sensing [27]. Among the notable studies applying SISR to satellite and overhead imagery, Bosch et al. [28] analyzed several satellite images and showed up to eight times resolution improvement with a GAN-based network configuration. The subjective image quality of the resulting image was improved; however, some differences between the reconstructed image and the original image were revealed. Lui et al. [21] developed a deep neural network model simultaneously enabling SR and colorization through multitask learning. Liebel and Körner [29] proposed SRCNN for multispectral remote sensing images using domain-specific datasets to introduce the multispectral band characteristics of Sentinel-2. Shermeyer and Van [30] applied a deep learning-based SR ( × 2 , × 4 , × 8 ) model to satellite images of five different spatial resolutions. They revealed that SR improved performance on object detection tasks and land-cover change mapping. In addition, Rabbi et al. [31] confirmed the superior detection performance effect compared to a standalone state-of-the-art object detector of an edge-enhanced SR GAN (EESRGAN). Thus, many studies have shown that SR can improve object detection performance in the field of remote sensing, or that SR technology itself can be used as a pre-processing step for level products.
In this study, we propose a target-specialized SR technique able to obtain the overall image quality of KOrea multi-purpose Satellite-3 (KOMPSAT-3) images. The main contributions of this study are summarized below.
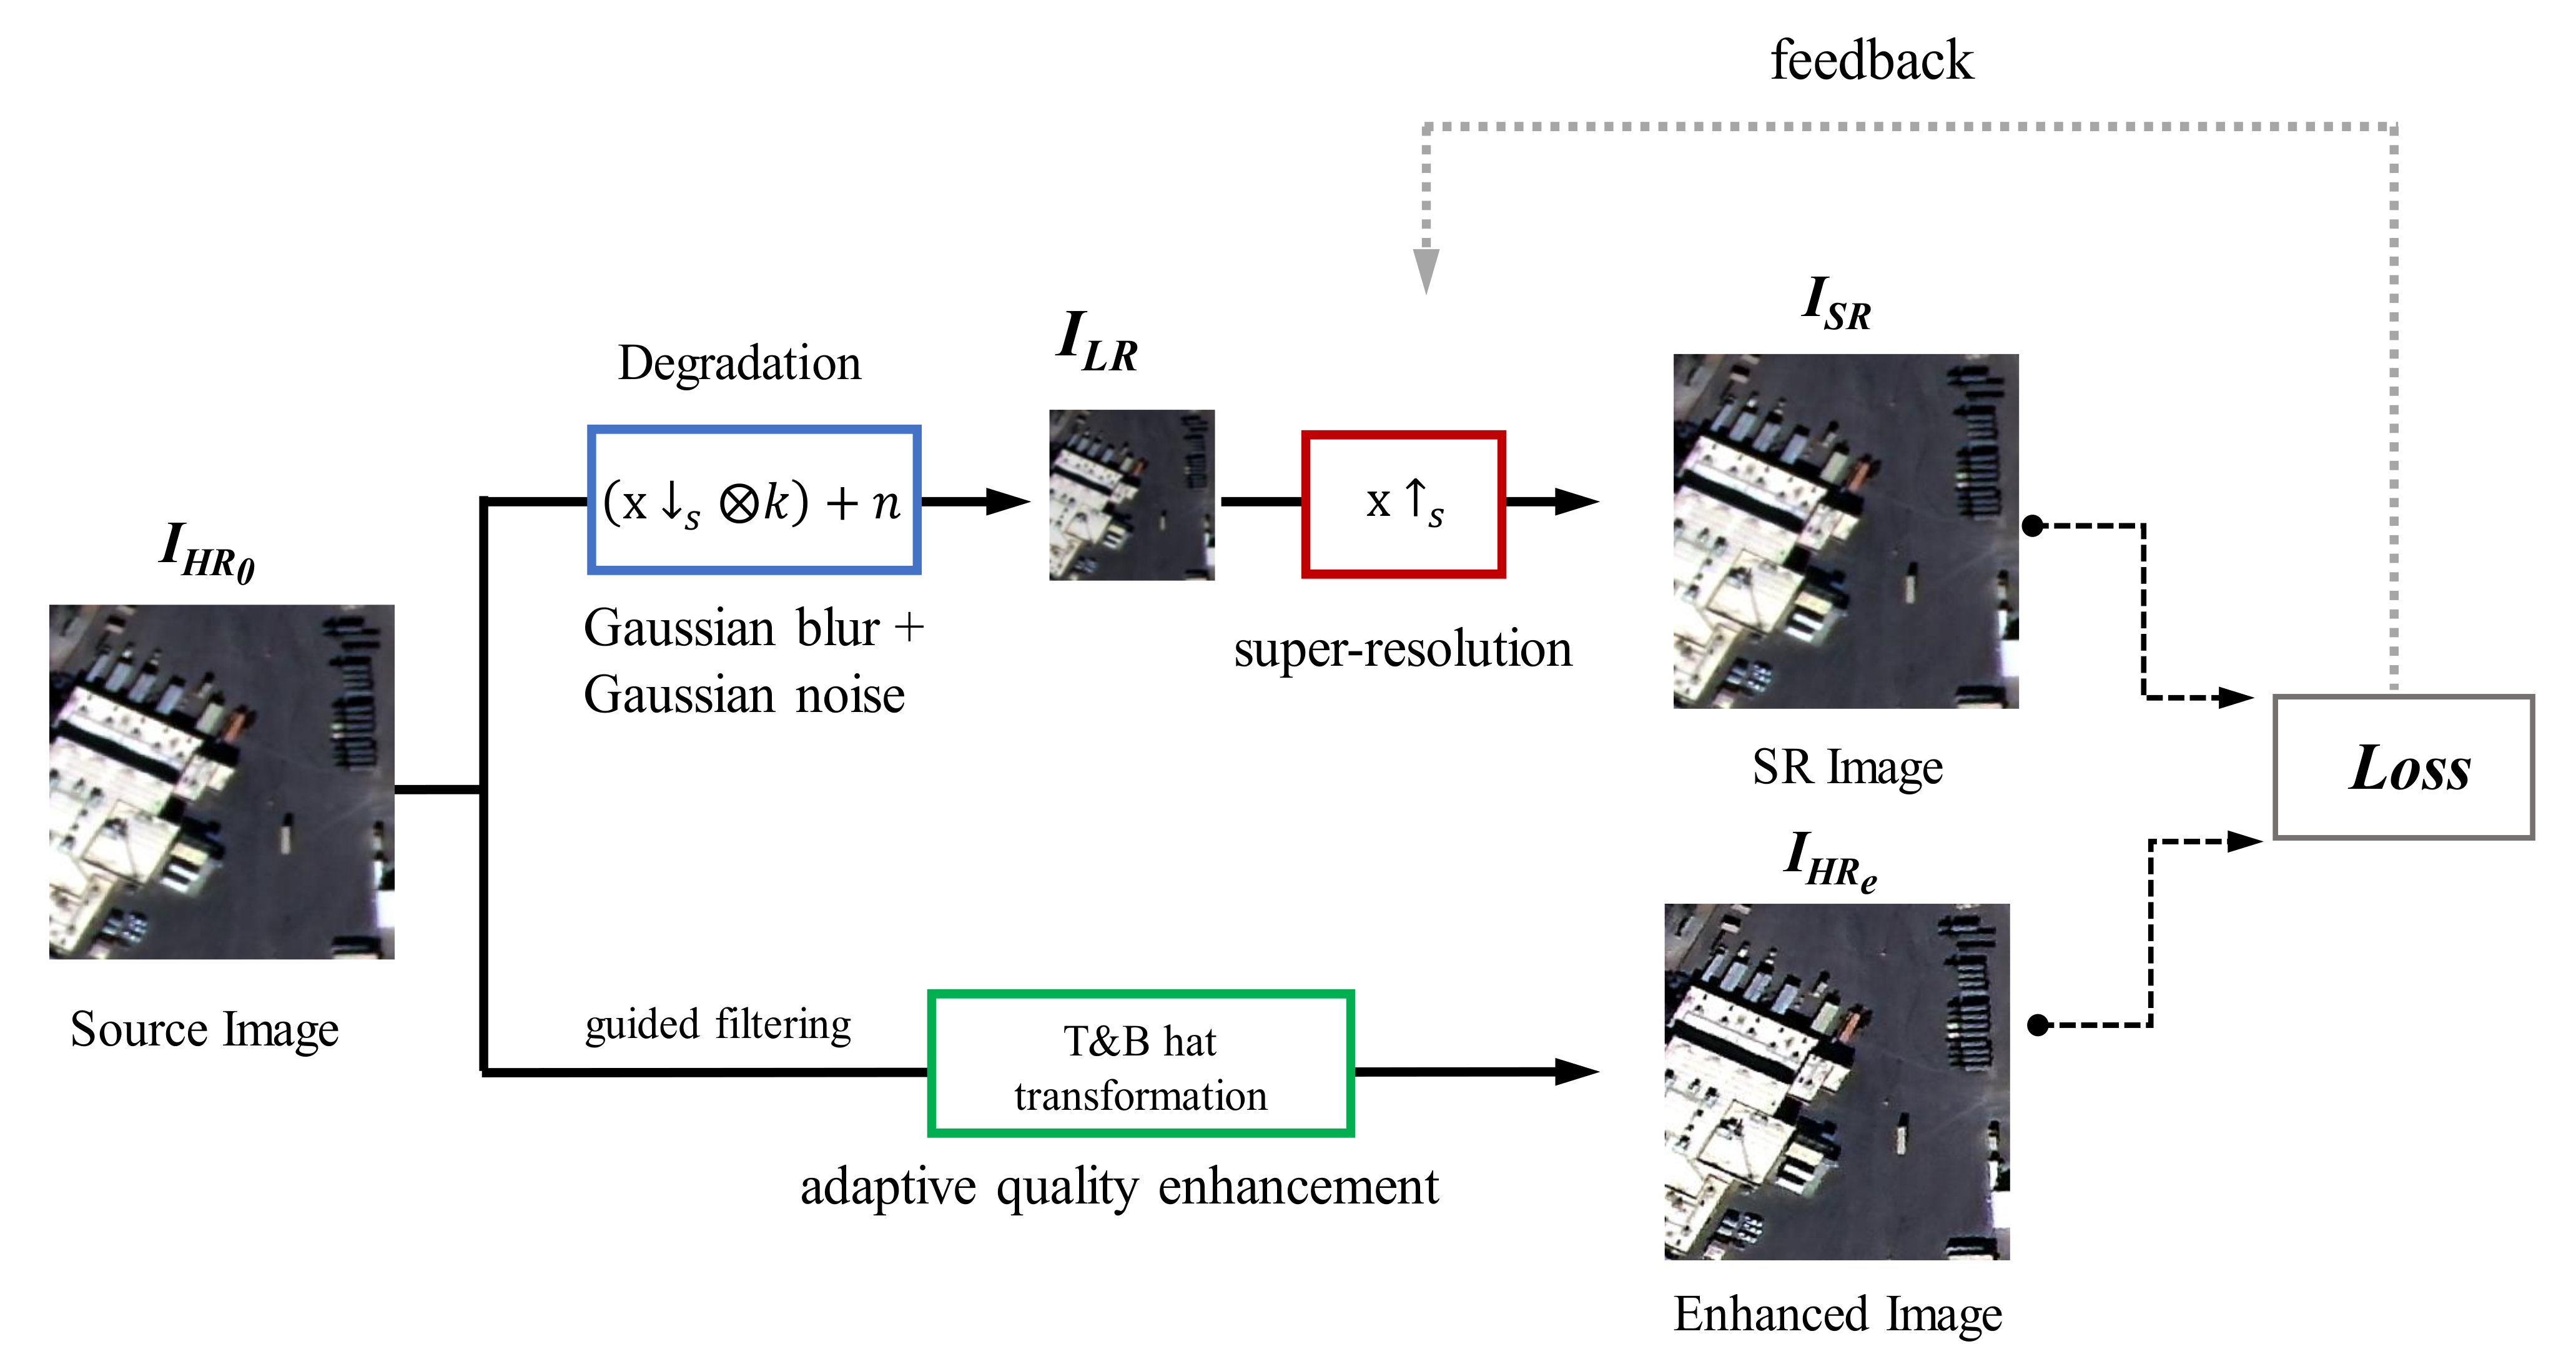
  • In this study, we propose a new degradation model for generating LR images required for training to obtain high-quality SR images from KOMPSAT-3 imaging data. This degradation model generates various input images by adding Gaussian noise and blur kernel to the training LR input images. Using the proposed degradation model, we were able to obtain clear and sharpened SR images with noise removed.
  • In addition, we propose an adaptive image quality modification technique that applies top-hat and bottom-hat transformation and guided filter to HR images to generate the sharpened edge and reduced the noise on SR images compared to the original images.
  • In comparison with other SR methods, the effect of improving edge sharpness and reducing noise was verified through various experiments. Three diverse types of analysis methods were introduced to verify the SR performance. First, the reconstruction performance was evaluated with visual comparison and reference quantitative indices, PSNR and structural similarity index (SSIM). In addition, we performed the no-reference quantitative evaluation index with proposed SR method and other SR methods. Second, to evaluate improvement performance, we extracted edges from the super-resolved panchromatic (PAN) images and compared them with the reference target specification. Finally, the effect of the SR images on the object detection performance was analyzed by applying the object detection algorithm to the obtained SR image.
The remainder of this paper is organized as follows. Section 2 describes the proposed method in detail. Section 3 introduces a dataset of KOMPSAT-3 imagery, explains the experimental environment, and presents the experimental results and analyses. Section 4 discusses the similarities and differences between the conventional SR methods and the proposed SR method; finally, Section 5 concludes the paper.

2. Methodology

In this study, we propose an adaptive image quality modification method for SR network, i.e., a degradation model to generate LR images for training input and the HR enhancement process for obtaining enhanced HR images ( H R e ) for use as ground truth, as depicted in Figure 1. All training and testing conducted in this work consisted of panchromatic and pansharpened images collected by KOMPSAT-3. In addition, we described a CNN-based SR model, which was trained by applying the proposed method.

2.1. Degradation Model for Training LR Images

As shown in Figure 1, we propose a degradation process for generating LR input images for training. In the conventional SR methods [1,2,4,6] the bicubic down-sampling method has been mainly used to generate an LR image used as the training input from the original HR image ( H R 0 ), as expressed in Equation (1).
y = x s ,
where the LR image y is degraded by bicubic downsampling from the H R 0 and s is the down-sampling operation with scale factor s.
However, the degradation model obtained by this bicubic downsampling is most suitably applied to the case where the original HR image ( H R 0 ) has very sharp, vivid edges, and almost no included noise. In general, satellite images show quite different image qualities depending on external imaging conditions such as altitude, weather, and camera angle. Therefore, it is known that most of the SR images obtained by applying the bicubic degradation model to satellite images with a large amount of noise or distortion of sharpness and edges have problems of blurred edges or relatively amplified noise [14,32]. Therefore, in this study, a degradation model that minimizes the distortion of the SR image by reflecting the characteristics of the KOMPSAT-3 satellite image is used, as expressed in Equation (2) below.
y = ( x s k ) + n ,
where x is the HR image, y is the LR image obtained using the proposed degradation model, and k is the Gaussian blur kernel. In addition, s is a down-sampling operation with a scale factor s, which is equal to 2 in this study. Further, n denotes the additive white Gaussian noise with sigma σ . During training, the value which determines the degree of blur was randomly changed within the range of 0.2–0.8 for every iteration and every LR image to generate a training image. The resulting SR images trained in this manner were able to minimize artifacts and halos.
In contrast, most satellite images contain a significant amount of noise because of various factors, such as noise affecting the camera sensor and weather phenomena. As the goal of the SR process is to increase the resolution while maintaining the characteristics of the original image as much as possible, noise was added when generating the LR image to simulate the noise of recorded images. Consequently, training was performed from an input image that was noisier than the original image, and it was similar to learning a denoising process to sharpen the image by removing the noisy part in the network. In this study, we assumed that the noise in the KOMPSAT-3 images was Gaussian noise, then estimated it and added it to the LR images [33]. The predicted Gaussian noise from the KOMPSAT-3 satellite image for training was confirmed through an experiment in which the mean was zero and the standard deviation ranged from 0.001 to 0.02. During training, the standard deviation was randomly changed to LR, and Gaussian noise was added to the image. As shown in Figure 2, the images obtained with the proposed degradation model was more noisy and blurrier than the images obtained with the bicubic degradation model.

2.2. Image Quality Enhancement for HR Images

The LR training input images generated through the degradation method described in Section 2.1 were produced by learning the characteristics of the HR original image as a target. The deep learning network trained using the KOMPSAT-3 original image ( H R 0 ) image as the ground truth may generate SR results including noise, because there many of the original images in the dataset contain artifacts such as noise. The adaptive image quality modification model is proposed based on the assumption that high-quality SR images can be obtained when training with newly obtained enhanced HR ( H R e ) which improves the contrast and edge sharpness by applying the technique to the target. In this study, two methods are considered for improving the quality of the original image: First is improving the sharpness of the edges, and the other is reducing noise. A top-hat and bottom-hat transformation was used to emphasize the edge, and a guided filter was used to reduce noise.
The top-hat and bottom-hat transformation (T&B) [34] technique was firstly applied to the H R 0 original image to generate the H R e image. This method was proposed by Serra [35], and it has been widely used for pattern recognition and image processing. The T&B technique can strengthen the image contrast by using a n × n rectangular structural element. The operation was applied to two sets of images, original image, I (x,y) and a structuring element, M(u,v), and is performed by combining dilation (+) and erosion (−) operations. The erosion and dilation operations for I (x,y) and M(u,v) are defined as given in Equation (3).
I M = min u , v ( I ( x + u , y + v ) M ( u , v ) ) , I M = max u , v ( I ( x u , y v ) + M ( u , v ) ) ,
where x and u are the width and y and v are the height of each image. We used the structuring element, M(u,v), with a rectangular shape and the size of the kernel (3,3).
Meanwhile, based on dilation and erosion operations, opening (∘) and closing (•) for I (x,y) and M(u,v) are defined in Equation (4). The open operation is dilation operation of erosion result and the close is erosion operation of dilation result.
I M = ( I M ) M , I M = ( I M ) M .
After combining the opening and closing operations of Equation (3), the T&B are derived, as expressed in Equation (5).
I t o p = I ( I M ) , I b o t t o m = ( I M ) I .
The top-hat transform extracts brightness corresponding to the used structuring element M(u,v) like high-pass filter and subtract the open operation result of original image from the itself. And the bottom-hat transformation leaves dim part and subtract the original image from its close operation result. A standard method to improve the quality of an image involves the emphasis of the contrast between the light and dim parts of the original image. Therefore, the image quality can be improved through contrast enhancement by adding a bright part and subtracting the dim part from the original image, as expressed in Equation (6).
I t & b = I + ( I t o p I b o t t o m ) ,
where I t o p is top-hat transform, I b o t t o m is bottom-hat transform, and I t & b is a top-hat and bottom-hat transformation.
Meanwhile, not only enhancement of contrast, but we also consider noise reduction to improve the image quality. As we described in Section 2.1, Gaussian noise is added to the LR image as mentioned. It is assumed that the effect can be maximized by not only adding noise to the LR image, but also by reducing the noise from the HR image. When T&B is applied, the edge is strengthened, but the noise stays prominent. To suppress the noise, the Guided filter is applied in the H R 0 image to obtain a denoising effect. An edge-preserving guided filter is a smoothing filter with guided images that acts as a bilateral filter, but is known to show better performance at the boundary [36]. In this study, when calculating T&B in Equation (7), a guided filtered image was applied instead of the original image. In this case, the noise is reduced compared to the original, and the edge was strengthened. Finally, as described in Equation (7), T&B was applied to H R g u i d e d where a guided filter was utilized on H R 0 . The weight between T&B and the guided filter was adopted to generate the enhancement HR image ( H R e ).
H R e = H R g u i d e d + α ( T o p ( H R g u i d e d ) B o t t o m ( H R g u i d e d ) ) ,
where the used parameter in Equation (7) are r = 1 and eps = 0.0005 in the guided filter, and the α is weight between the guided filter and T&B operation defined as 0.95. When α was small, the noise of the image is reduced, but the detail of the image was weakened at the same time, and when it was larger than 1, the noise increased compared to the original. An optimized value of 0.95 was obtained through several experiments to minimize this phenomenon. When the proposed T&B technique was applied to the original images recorded by KOMPSAT-3, as shown in Figure 3, it was confirmed that not only the contrast enhancement effect of the image described in [37] but also the complex noise removal measures were effective.

2.3. Proposed CNN-Based SR Network

In this study, as shown in Figure 4, the SR network architecture was modified and designed to obtain improved results based on the existing SRResNet [9]. The characteristics of the proposed model differ from those of the existing models. A residual block deeper than the original network was designed, and the batch norm was removed at each step. A residual learning technique that adds the final network output and the bicubic interpolated image is used to learn the network only the residual signal of the image. Moreover, we used a LeakyReLU activation function for our proposed SR network. The LeakyReLU is one attempt to address the “dying ReLU” issue. When input of activation function is negative, instead of the function being zero, the LeakyReLU will have a small positive slope, such as 0.1.
To learn the proposed CNN-based SR, the learning rate, scheduler, and optimizer were also improved. The learning rate was initiated as 2 × 10 4 , and the scheduler determining the update time of the learning rate applied the cosine annealing technique. In addition, the weights were initialized using the uniform distribution, and no biases were used to reduce the number of parameters. The L1 loss was used as a cost function instead of L2 loss. The proposed SR network was trained using Adam optimizer. The batch size was set to 16, the patch size was determined to be 128, and the proposed CNN-based SR structure used a parameter of approximately 1.3 M. Finally, the adaptive image quality modification method mentioned in Section 2.1 and Section 2.2 was applied during network training. The difference in the proposed CNN architecture that processes panchromatic and pansharpened images is that the first convolutional layer and the last convolutional layer have 1 channel and 3 channels, respectively.

3. Experiment

The Korea Multi-Purpose Satellite-3 and -3A (KOMPSAT-3/3A) are optical HR remote sensing satellites that were launched in 2012 and 2015 as part of a geographical information system and have been operating for more than 7 years. KOMPSAT-3 provides 0.7 m ground sampling distance (GSD) panchromatic (PAN) image and 2.8 m GSD multi-spectral (Visible: R, G, B, NIR) band image and K3A provides a 0.55 m PAN image, as described in Table 1. In this study, images acquired from KOMPSAT-3 and KOMPSAT-3A were mixed to form the training dataset and the subject of the quality evaluation was KOMPSAT-3. L1G-level images with PAN and pansharpening (PS) spatial correction processing were used; to create an optimized model for KOMPSAT-3, training data was composed of images including various conditions. The training dataset has consisted with the cloud coverage limited from 0% to 10% and the tilt angle range was −30 to 30 .
The original KOMPSAT-3/3A files have a maximum size of 30,000 × 30,000 pixels and approximately occupy 1.5 GB per scene. After data acquisition, the original images were analyzed and a data cleaning process was performed. In this process, artifacts such as light exposure and poor weather conditions such as snow/clouds and the pixels filled with zeros due to image cutting during the geometric correction process was removed. The dataset used in this study is of PAN and PS images from KOMPSAT-3. Both band data have a 0.7 m spatial resolution. A PAN image is a single-channel image, whereas a pansharpened is a three-channel color image. As the images selected after the cleaning process were large and difficult to use directly for training, they were cut into 1024 × 1024 pixel size images, and the number of images finally included in each sub-dataset was 32,176 for KOMPSAT-3 and 56,474 for KOMPSAT-3A. However, the cropped 1024 × 1024 images were still too large to be used for training. Hence, they were randomly cropped with a patch of 128 × 128 sizes in the image to constitute a ground truth dataset. A random crop means that different patches were configured for each iteration and used for training. Although this involves the disadvantage of increasing the training time, it can solve the problem of lack of data and is a generalized training method that has been widely used in existing SR studies. In addition, the number of training data was increased by augmentation, such as rotation and flipping of the corresponding patch during the training process. Approximately 10% of the total KOMPSAT-3 images were used for testing. As previously described, the proposed SR network is trained with patches of 128 × 128 size randomly cropped from 1024 × 1024, but a 1024 × 1024 image is used for inference. As a result, the SR image size after inference is 2048 × 2048. In summary, the size of the SR result of PAN image is 2048 × 2048 × 1 and the size of the SR result of PS image is 2048 × 2048 × 3. Figure 5 shows the selections of PAN and PS images of KOMPSAT-3/3A used for training and testing.

4. Results and Discussion

In Section 4, the performance of the proposed SR method and other SR methods was performed in two ways. First, the performance of the restoration results from the degraded original image was described in Section 4.1. The performance of the improvement results from the original image was described in Section 4.1 and Section 4.2.

4.1. Quantitative and Qualitative Analysis

A reference restoration metric is defined as a comparison with the original image, and the performance of the restoration is calculated numerically. This reference restoration metric is a popular method in super-resolution studies. We apply the peak signal to noise ratio (PSNR) as a widely used evaluation index. As commonly used evaluation measure of image quality loss information, the higher the PSNR, the higher the similarity between two images compared.
PSNR ( x , y ) = 10 log 10 M A X 2 M S E
In Equation (8), MAX is a value corresponding to the image depth of the satellite image. Since the KOMPSAT-3 image has a 14-bit dynamic range, the MAX value is 16,383. Further, as shown in Equation (9), the structural similarity index (SSIM) was calculated; SSIM is a method for evaluating the similarity between two images x and y by combining brightness, contrast, and structural information.
SSIM ( x , y ) = ( 2 μ x μ y + C 1 ) + ( 2 σ x y + C 2 ) ( μ x 2 + μ y 2 + C 1 ) ( σ x 2 + σ y 2 + C 2 ) ,
where μ x , μ y , σ x , σ y and σ x y are the local means, standard deviations, and cross-covariance for image x,y and C 1 , C 2 are small constants.
In addition, the natural image quality evaluator (NIQE) [38] method, which is a no-reference evaluation index, was used to evaluate the image quality. NIQE calculates the performance of the image quality improvement by comparing images with a basic model calculated from a normal image. A lower NIQE score indicates better visual quality. The test images used for quantitative numerical comparison were calculated by randomly selecting 25 KOMPSAT-3 satellite images, excluding the training images. The performance of prior SR methods including nearest neighbor, bicubic, SRResNet [9], RCAN [8], RRDB [12], DPSR [17] and USRNET [18] models were compared with the proposed SR method.
As presented in Table 2, it can be seen that the proposed SR method has relatively lower PSNR and SSIM values than other SR methods. However, in NIQE, which is a no-reference measure, the proposed method exhibited better performance than the other methods. Next, a qualitative experiment was conducted to confirm image quality. In the KOMPSAT-3 satellite images, both panchromatic and pansharpened (PS) images were tested. As shown in Figure 6 and Figure 7, the experimental results of the panchromatic (PAN) images show that the SR images obtained by the proposed SR method represents the clear text on the ground and had clearer edge compared to the other SR methods. Furthermore, as shown in Figure 8, it may be observed that the noise was reduced throughout the image. As shown in Figure 8, although other SR methods improve the clarity of the white sign in the traffic mark on the road, the distortion at the boundary with the road surface remains prominent unlike the proposed SR method. In addition, in the case of Figure 9, noisy patterns appear separately on the road surface from the improvement in the sharpness of the text on the road, which may be attributed to the noise included in the original image being distorted or emphasized through the SR process. This phenomenon appears in various parts, such as around vehicles or buildings. Contrarily, the proposed SR results show that this distortion is minimized and the sharpness at the structure’s boundary is improved. In addition, the experimental results applied to the PS satellite images are shown in Figure 9, Figure 10 and Figure 11. In PS images, it was confirmed that, similar to the PAN images, the SR images to which the proposed SR method was applied showed relatively enhanced image quality, compared to other SR methods, in terms of clarity and edge sharpness.

4.2. Edge Detection Performance by Target Site

Since satellite images are taken at high altitudes, the image quality evaluation is carried out by installing a structure comprising various large structural components with an accurately known length on the ground, and then analyzing satellite images of the known installation. To evaluate the performance of the developed SR method in this study, an image quality test field, which is officially used for satellite image quality evaluation, was used, obtained from [39]. The USGS provides sites that can evaluate the quality of satellite images in three categories: radiometric, geometric, and spatial.
The images of spatial resolution calibration sites were used to evaluate the performance of the image quality improvement as a reference. As the test images of the site were not acquired for calibration purpose and did not satisfy conditions such as camera angle, geometrical correction, and weather, there is a difference between the specification of the structure in the original calibration site and test image. All performances of SR methods results were evaluated under the same edge extraction condition.
The Baotou site selected for this experiment is located in China (l = 40.85, b = 109.63), and it is used for comprehensive calibration and validation of satellite system. These permanent artificial targets have the advantages of year-round availability, lower maintenance operations, and long lifetime, and are an excellent reference for satellites. In consideration of the local environment and climate conditions, knife-edge targets, fan-shaped targets, and bar-pattern targets were designed on the ground at the Baotou site [40]. We extracted the edges of those targets from the nearest neighbor, bicubic, SRResNet [9], RCAN [8], RRDB [12], DPSR [17], USRNET [18] and proposed SR method results, then we overplotted the extracted edge lines on the SR result images to compare the performance in terms of resolution improvement.
The first analysis target was a fan-shaped that spread out to 155 and shown on the left side of Figure 12, with 31 black and white sectors spaced at 5 intervals; The black or white sector width at the limit target radius where the black and white lines of the target image can be differentiated is referred to as spatial resolution. The second analysis structure consisted of 15 groups of black bars of various shapes with thicknesses from 0.1 m to 5 m. As a bar target shown in the yellow box in Figure 12, the structure had the same thickness from the bottom to the 5th bars, and the thickness or spacing decreases from 0.9 m to 0.1 m; hence, it was used as a resolution measurement criterion.
In Figure 13 and Figure 14, a performance was evaluated on the sharpness of the edges and the degree of resolvability for the above two targets. As shown in Figure 13, the result image of the proposed method and the USRNET [18] method discriminated the structure closest to the center of the fan shape compared to other SR methods results. The two red dash lines in Figure 13 represents arcs with different diameters which can be helpful to interpret the spatial resolution performance.
As shown in Figure 14, in the case of DPSR [17], it can only draw the edge lines up to bar with size of 0.8 m and it might be probably due to the strong smoothing effect. In addition, SRResNet [9], RCAN [8] and RRDB [12] were extracted more lines than DPSR [17], however, there were many square lines that were not perfectly extracted, therefore, the performance was determined to be 0.8 m. The nearest neighbor, bicubic and USRNET [18] extracted well up to a bar with a size of 0.7 m which is smaller than the previous SR methods. In the case of USRNET [18], some edges of 0.6 m bars appear connected, the performance was determined to be 0.7 m. Finally, our proposed SR method represents the clear edge extraction line up to 0.6 m bar. In contrast, the structure in the red box in Figure 12 consists of five white bars with a length of 4 m and a width of 0.2 m. It may be observed that only the proposed SR method was able to distinguish the structure clearly.
The proposed method not only improved the clarity of the structure in original image, but also maintained the clarity of the texture compared to the USRNET [18] and RRDB [12] methods. As described above, the original resolution of KOMPSAT-3 images is 0.7 m. However, it should be noted that the original resolution did not appear as it is because the images used were not captured image to satisfy the conditions for calibration. Nevertheless, as this experiment evaluated the performance of the algorithm under the same criterion, it is meaningful that the image generated by the proposed method was improved the image quality with relatively high precision.

4.3. Object Detection Performance Test

In this section, we evaluate the improvement of object detection performance according to the SR effect. Vehicles appear very often in satellite images but tend to be as small as 10 pixels and can appear in any direction. Therefore, it is often difficult to detect small vehicles such as cars in the LR images. However, small vehicles detection and analysis are important techniques used in fields such as economy, social analysis, and security, and various studies are being conducted to improve detection performance. For object detection, S2A-Net [41] was used in this experiment and the small vehicle detection performance was analyzed before and after applying the proposed SR method result. Figure 15a shows a small vehicle detected in the original image as cyan boxes and Figure 15b shows the same small vehicle detected in the SR image obtained by the proposed method. As shown in Figure 15a, closely parked small vehicles were not detected well in the original image, but it can be confirmed that the detection performance was improved in the SR image as depicted in Figure 15b. Consequently, the object detection performance was effectively improved using the proposed SR technique. In addition, we performed an additional quantitative experiment for the performance of the object detection improvement. A total of 25 test images, including those of small vehicles, were used for the experiment. The total number of small vehicles in the test images is 3618. The Intersection over Union (IoU) criterion for quantitative evaluation was used; it measures the detected box’s overlapping image with the ground truth box. When detecting objects, the confidence score threshold was set to 0.05 and the IoU threshold to 0.1. Small objects in the image, such as cars, have a smaller number of pixels; thus a lower IoU value improves detection performance. As shown in Table 3, for object detection evaluation, the metrics of true positive (TP), false positive (FP), and average precision (AP) were calculated. As a result of evaluating the performance using the proposed SR method as a pre-processing for object detection, it was confirmed that the AP performance improved by approximately 13.5% as described in Table 3.

4.4. Discussion

In this study, the adaptive image quality modification method including the degradation model and image quality improvement were proposed to improve the SR results. First, the degradation model is proposed that generates noisy input images by randomly applying a Gaussian noise and Gaussian blur kernel to each training image. In addition, to generate an enhanced HR image, top- and bottom-hat transformations and guided filters are applied to the original HR image to emphasize the edges and reduce noise from the original HR image. The performance of the proposed SR network is confirmed through various experiments, such as qualitative visual comparisons with other SR methods and quantitative numerical comparisons such as NIQE, PSNR, and SSIM. For the PSNR and SSIM score, the performance of the proposed method showed that the SR images obtained were lower than those obtained with other SR methods. However, in terms of NIQE score, the proposed SR method outperformed the other SR methods. Visual inspection confirmed that the proposed SR method significantly reduced image noise on the road surface or roof of a building compared to other SR methods. Furthermore, the proposed SR method significantly improved the clarity of structures and characters.
Next, the edge extraction using a validation site image was performed, assuming that the edge extraction would be effective if the sharpness of structures such as buildings in the image was improved through the proposed SR method. The validation site image was extensively used to verify the image quality of the satellite using various sizes or shapes of the bar- and fan-shaped target. Compared to other SR methods, the proposed SR method produced the most effective results in extracting various target edges, with excellent spatial resolution performance confirmed.
Finally, by applying the super-resolution method to the satellite image object detection tasks, it was verified that the proposed super-resolution method could improve the performance of small object-detection techniques. In the case of small objects such as automobiles in the satellite image, the detection performance differs according to the resolution of the satellite image. The object detection performance improved by the proposed SR method, therefore, the proposed SR method is expected to function as a practical pre-processing step in various object detection applications.

5. Conclusions

In this study, a super-resolution method with adaptive image quality modification to improve the resolution of KOMPSAT-3 satellite images is proposed. First, a degradation model is proposed that generates noisy input images by randomly applying a Gaussian noise and Gaussian blur kernel to each training image. In addition, top-hat and bottom-hat transformation and guided filter were applied to the original HR image to increase the contrast and emphasize the edges and reduce the noise compared to the original HR image, thereby improving the quality of the generated SR image. The performance of the proposed SR network is confirmed through various experiments such as qualitative visual comparisons with other methods, quantitative numerical comparisons, and edge extraction using validation site images. Finally, by applying the proposed SR method to the satellite image object detection tasks, it is verified that the proposed super-resolution method is able to improve the performance of small object detection techniques. The proposed SR method is expected to be highly useful as a pre-processing step for various object detection, segmentation and analysis application because the image quality performance improvement over other algorithms. In this study, low-resolution input images are generated based on Gaussian noise, but in the future, optimized noise kernel modeling will be reviewed to process KOMPSAT-3 and 3A images. In addition, we intend to expand the model so that it can be applied to a wide area by using not only specific images but also heterogeneous data with similar resolution.

Author Contributions

Conceptualization, S.H.; Methodology, Y.C. and Y.K.; Software, Y.C. and Y.K.; Validation, S.H.; Formal Analysis, Y.C. and Y.K.; Investigation, Y.C. and Y.K; Resources, Y.C. and Y.K.; Data Curation, S.H.; Writing—Original Draft Preparation, Y.C. and Y.K.; Writing—Review & Editing, Y.C. and Y.K.; Visualization, Y.C. and Y.K.; Supervision, S.H.; Project Administration, S.H.; Funding Acquisition, S.H. All authors have read and agreed to the published version of the manuscript.

Funding

This study was supported by research on aerospace core technology based on artificial intelligence and metal 3D printing technology by the Ministry of Science and ICT. This research was funded by the Korea government (MSIT) (No.1711135081).

Conflicts of Interest

The authors declare no conflict of interest.

References

  1. Dong, C.; Loy, C.C.; He, K.; Tang, X. Image super-resolution using deep convolutional networks. IEEE Trans. Pattern Anal. Mach. Intell. 2015, 38, 295–307. [Google Scholar] [CrossRef] [PubMed] [Green Version]
  2. Kim, J.; Lee, J.K.; Lee, K.M. Accurate image super-resolution using very deep convolutional networks. In Proceedings of the IEEE Conference on Computer Vision and Pattern Recognition, Las Vegas, NV, USA, 27–30 June 2016; pp. 1646–1654. [Google Scholar]
  3. Kim, J.; Lee, J.K.; Lee, K.M. Deeply-recursive convolutional network for image super-resolution. In Proceedings of the IEEE Conference on Computer Vision and Pattern Recognition, Las Vegas, NV, USA, 27–30 June 2016; pp. 1637–1645. [Google Scholar]
  4. Lim, B.; Son, S.; Kim, H.; Nah, S.; Mu Lee, K. Enhanced deep residual networks for single image super-resolution. In Proceedings of the IEEE Conference on Computer Vision and Pattern Recognition Workshops, Honolulu, HI, USA, 21–26 July 2017; pp. 136–144. [Google Scholar]
  5. Tai, Y.; Yang, J.; Liu, X. Image super-resolution via deep recursive residual network. In Proceedings of the IEEE Conference on Computer Vision and Pattern Recognition, Honolulu, HI, USA, 21–26 July 2017; pp. 3147–3155. [Google Scholar]
  6. Haris, M.; Shakhnarovich, G.; Ukita, N. Deep back-projection networks for super-resolution. In Proceedings of the IEEE Conference on Computer Vision and Pattern Recognition, Salt Lake City, UT, USA, 18–22 June 2018; pp. 1664–1673. [Google Scholar]
  7. Zhang, Y.; Tian, Y.; Kong, Y.; Zhong, B.; Fu, Y. Residual dense network for image super-resolution. In Proceedings of the IEEE Conference on Computer Vision and Pattern Recognition, Salt Lake City, UT, USA, 18–22 June 2018; pp. 2472–2481. [Google Scholar]
  8. Zhang, Y.; Li, K.; Li, K.; Wang, L.; Zhong, B.; Fu, Y. Image super-resolution using very deep residual channel attention networks. In Proceedings of the European Conference on Computer Vision (ECCV), Munich, Germany, 8–14 September 2018; pp. 286–301. [Google Scholar]
  9. Ledig, C.; Theis, L.; Huszár, F.; Caballero, J.; Cunningham, A.; Acosta, A.; Aitken, A.; Tejani, A.; Totz, J.; Wang, Z.; et al. Photo-realistic single image super-resolution using a generative adversarial network. In Proceedings of the IEEE Conference on Computer Vision and Pattern Recognition, Honolulu, HI, USA, 21–26 July 2017; pp. 4681–4690. [Google Scholar]
  10. Sajjadi, M.S.; Scholkopf, B.; Hirsch, M. Enhancenet: Single image super-resolution through automated texture synthesis. In Proceedings of the IEEE International Conference on Computer Vision, Honolulu, HI, USA, 21–26 July 2017; pp. 4491–4500. [Google Scholar]
  11. Tan, W.; Yan, B.; Bare, B. Feature super-resolution: Make machine see more clearly. In Proceedings of the IEEE Conference on Computer Vision and Pattern Recognition, Salt Lake City, UT, USA, 18–22 June 2018; pp. 3994–4002. [Google Scholar]
  12. Wang, X.; Yu, K.; Wu, S.; Gu, J.; Liu, Y.; Dong, C.; Qiao, Y.; Change Loy, C. Esrgan: Enhanced super-resolution generative adversarial networks. In Proceedings of the European Conference on Computer Vision (ECCV) Workshops, Munich, Germany, 8–14 September 2018. [Google Scholar]
  13. Lucas, A.; Lopez-Tapia, S.; Molina, R.; Katsaggelos, A.K. Self-supervised Fine-tuning for Correcting Super-Resolution Convolutional Neural Networks. arXiv 2019, arXiv:1912.12879. [Google Scholar]
  14. Efrat, N.; Glasner, D.; Apartsin, A.; Nadler, B.; Levin, A. Accurate blur models vs. image priors in single image super-resolution. In Proceedings of the IEEE International Conference on Computer Vision, Sydney, Australia, 1–8 December 2013; pp. 2832–2839. [Google Scholar]
  15. Michaeli, T.; Irani, M. Nonparametric Blind Super-resolution. In Proceedings of the 2013 IEEE International Conference on Computer Vision, Sydney, Australia, 1–8 December 2013; pp. 945–952. [Google Scholar] [CrossRef]
  16. Sroubek, F.; Cristobal, G.; Flusser, J. Simultaneous super-resolution and blind deconvolution. J. Phys. Conf. Ser. 2008, 124, 012048. [Google Scholar] [CrossRef]
  17. Zhang, K.; Zuo, W.; Zhang, L. Deep plug-and-play super-resolution for arbitrary blur kernels. In Proceedings of the IEEE/CVF Conference on Computer Vision and Pattern Recognition, Long Beach, CA, USA, 15–20 June 2019; pp. 1671–1681. [Google Scholar]
  18. Zhang, K.; Van Gool, L.; Timofte, R. Deep Unfolding Network for Image Super-Resolution. In Proceedings of the 2020 IEEE/CVF Conference on Computer Vision and Pattern Recognition (CVPR), Seattle, WA, USA, 14–19 June 2020; pp. 3214–3223. [Google Scholar] [CrossRef]
  19. Wang, L.; Wang, Y.; Dong, X.; Xu, Q.; Yang, J.; An, W.; Guo, Y. Unsupervised Degradation Representation Learning for Blind Super-Resolution. In Proceedings of the IEEE/CVF Conference on Computer Vision and Pattern Recognition (CVPR), Virtual, 19–25 June 2021; pp. 10581–10590. [Google Scholar]
  20. Kim, S.Y.; Sim, H.; Kim, M. KOALAnet: Blind Super-Resolution Using Kernel-Oriented Adaptive Local Adjustment. In Proceedings of the IEEE/CVF Conference on Computer Vision and Pattern Recognition (CVPR), Virtual, 19–25 June 2021; pp. 10611–10620. [Google Scholar]
  21. Liu, H.; Fu, Z.; Han, J.; Shao, L.; Liu, H. Single satellite imagery simultaneous super-resolution and colorization using multi-task deep neural networks. J. Vis. Commun. Image Represent. 2018, 53, 20–30. [Google Scholar] [CrossRef] [Green Version]
  22. Jiang, K.; Wang, Z.; Yi, P.; Jiang, J.; Xiao, J.; Yao, Y. Deep Distillation Recursive Network for Remote Sensing Imagery Super-Resolution. Remote Sens. 2018, 10, 1700. [Google Scholar] [CrossRef] [Green Version]
  23. Kwan, C. Remote Sensing Performance Enhancement in Hyperspectral Images. Sensors 2018, 18, 3598. [Google Scholar] [CrossRef] [Green Version]
  24. Burdziakowski, P. Increasing the Geometrical and Interpretation Quality of Unmanned Aerial Vehicle Photogrammetry Products using Super-Resolution Algorithms. Remote Sens. 2020, 12, 810. [Google Scholar] [CrossRef] [Green Version]
  25. Haris, M.; Watanabe, T.; Fan, L.; Widyanto, M.R.; Nobuhara, H. Superresolution for UAV Images via Adaptive Multiple Sparse Representation and Its Application to 3-D Reconstruction. IEEE Trans. Geosci. Remote Sens. 2017, 55, 4047–4058. [Google Scholar] [CrossRef]
  26. Kang, W.; Yu, S.; Ko, S.; Paik, J. Multisensor Super Resolution Using Directionally-Adaptive Regularization for UAV Images. Sensors 2015, 15, 12053–12079. [Google Scholar] [CrossRef] [PubMed] [Green Version]
  27. Wang, Z.; Jiang, K.; Yi, P.; Han, Z.; He, Z. Ultra-dense GAN for satellite imagery super-resolution. Neurocomputing 2020, 398, 328–337. [Google Scholar] [CrossRef]
  28. Bosch, M.; Gifford, C.M.; Rodriguez, P.A. Super-resolution for overhead imagery using densenets and adversarial learning. In Proceedings of the 2018 IEEE Winter Conference on Applications of Computer Vision (WACV), Lake Tahoe, NV, USA, 12–15 March 2018; pp. 1414–1422. [Google Scholar]
  29. Liebel, L.; Körner, M. Single-image super resolution for multispectral remote sensing data using convolutional neural networks. ISPRS Int. Arch. Photogramm. Remote Sens. Spat. Inf. Sci. 2016, 41, 883–890. [Google Scholar] [CrossRef] [Green Version]
  30. Shermeyer, J.; Van Etten, A. The effects of super-resolution on object detection performance in satellite imagery. In Proceedings of the IEEE/CVF Conference on Computer Vision and Pattern Recognition Workshops, Long Beach, CA, USA, 15–20 June 2019. [Google Scholar]
  31. Rabbi, J.; Ray, N.; Schubert, M.; Chowdhury, S.; Chao, D. Small-object detection in remote sensing images with end-to-end edge-enhanced GAN and object detector network. Remote Sens. 2020, 12, 1432. [Google Scholar] [CrossRef]
  32. Zhou, R.; Susstrunk, S. Kernel modeling super-resolution on real low-resolution images. In Proceedings of the IEEE/CVF International Conference on Computer Vision, Seoul, Korea, 27 October–3 November 2019; pp. 2433–2443. [Google Scholar]
  33. Donoho, D.L.; Johnstone, J.M. Ideal spatial adaptation by wavelet shrinkage. Biometrika 1994, 81, 425–455. [Google Scholar] [CrossRef]
  34. Hassanpour, H.; Samadiani, N.; Salehi, S.M. Using morphological transforms to enhance the contrast of medical images. Egypt. J. Radiol. Nucl. Med. 2015, 46, 481–489. [Google Scholar] [CrossRef]
  35. Haralick, R.M.; Sternberg, S.R.; Zhuang, X. Image analysis using mathematical morphology. IEEE Trans. Pattern Anal. Mach. Intell. 1987, PAMI-9, 532–550. [Google Scholar] [CrossRef] [PubMed]
  36. He, K.; Sun, J.; Tang, X. Guided image filtering. IEEE Trans. Pattern Anal. Mach. Intell. 2012, 35, 1397–1409. [Google Scholar] [CrossRef] [PubMed]
  37. Bai, X.; Zhou, F.; Xue, B. Image enhancement using multi scale image features extracted by top-hat transform. Opt. Laser Technol. 2012, 44, 328–336. [Google Scholar] [CrossRef]
  38. Mittal, A.; Soundararajan, R.; Bovik, A.C. Making a “completely blind” image quality analyzer. IEEE Signal Process. Lett. 2012, 20, 209–212. [Google Scholar] [CrossRef]
  39. USGS Remote Sensing Technologies Test Sites. Available online: https://calval.cr.usgs.gov/apps/test_sites_catalog (accessed on 10 June 2021).
  40. Li, C.; Tang, L.; Ma, L.; Zhou, Y.; Gao, C.; Wang, N.; Li, X.; Wang, X.; Zhu, X. Comprehensive calibration and validation site for information remote sensing. Int. Arch. Photogramm. Remote Sens. Spat. Inf. Sci. 2015, 40, 1233. [Google Scholar] [CrossRef] [Green Version]
  41. Han, J.; Ding, J.; Li, J.; Xia, G.S. Align deep features for oriented object detection. IEEE Trans. Geosci. Remote Sens. 2021, 1–11. [Google Scholar] [CrossRef]
Figure 1. Architecture of the proposed SR method for training phase.
Remotesensing 13 03301 g001
Figure 2. Comparison of low-resolution images: (a) bicubic degradation model and (b) proposed degradation model.
Remotesensing 13 03301 g002
Figure 3. Comparison of high-resolution images: (a) original image, (b) enhanced image by top-hat and bottom-hat transformation.
Remotesensing 13 03301 g003
Figure 4. Architecture of the proposed SR network for panchromatic.
Remotesensing 13 03301 g004
Figure 5. Selected dataset of PAN and PS images of KOMPAT-3/3A.
Remotesensing 13 03301 g005
Figure 6. Visual qualitative comparisons of the proposed method with other SR methods on a panchromatic image, Two Stroke To Turbo LTD, England.
Remotesensing 13 03301 g006
Figure 7. Visual qualitative comparisons of the proposed method with other SR methods on a panchromatic image, Weehawken Stadium, USA.
Remotesensing 13 03301 g007
Figure 8. Visual qualitative comparisons of the proposed method with other SR methods on a panchromatic image, Henry Hudson Parkway, USA.
Remotesensing 13 03301 g008
Figure 9. Visual qualitative comparisons of the proposed method with other SR methods on a pansharpened KOMPSAT-3 image, Dubai In-ternational Airport, UAE.
Remotesensing 13 03301 g009
Figure 10. Visual qualitative comparisons of the proposed method with other SR methods on an pansharpened KOMPSAT-3 image, VA Southern Nevada Healthcare System, USA.
Remotesensing 13 03301 g010
Figure 11. Visual qualitative comparisons of the proposed method with other SR methods on pansharpened KOMPSAT-3 image, North Las Vegas Readiness Center, USA.
Remotesensing 13 03301 g011
Figure 12. Targets design and specification of Baotou site.
Remotesensing 13 03301 g012
Figure 13. Fan-shaped target SR results: (a) Original, (b) Nearest Neighbor, (c) Bicubic, (d) SRResNet, (e) RCAN, (f) RRDB, (g) DPSR, (h) USRNET, (i) Proposed.
Remotesensing 13 03301 g013
Figure 14. Bar-pattern target SR results: (a) Original, (b) Nearest Neighbor, (c) Bicubic, (d) SRResNet, (e) RCAN, (f) RRDB, (g) DPSR, (h) USRNET, (i) Proposed.
Remotesensing 13 03301 g014
Figure 15. Object detection performance results on Hyogo, Japan: (a) detected small vehicles in original image (left) and (b) detected small vehicles in super resolved image (right).
Remotesensing 13 03301 g015
Table 1. Data Specification of Korea Multi-Purpose Satellite-3/3A.
KOMPSAT-3KOMPSAT-3A
Ground
Sampling Distance
PAN: 0.7 m
MS: 2.8 m
PAN: 0.54 m
MS: 2.16 m
Spectral BandsPAN: 450∼900 nm
Blue: 450∼520 nm
Green: 520∼600 nm
Red: 630∼690 nm
PAN: 450∼900 nm
Blue: 450∼520 nm
Green: 520∼600 nm
Red: 630∼690 nm
View AngleRoll: −30∼30 deg
Pitch: −30∼30 deg
Roll: −30∼30 deg
Pitch: −30∼30 deg
Data Quantization14 bits/pixel14 bits/pixel
Table 2. Comparison between the difference methods under upscale factor ×2 on KOMPSAT-3 dataset. (The bold values are the best among all the methods).
PSNR (dB)SSIMNIQE
Nearest Neighbor40.560.809622.94
Bicubic42.740.867222.98
SRResNet [9]47.630.922422.79
RRDB [12]47.780.923422.80
RCAN [8]47.650.922622.76
DPSR [17]47.340.918222.76
USRNET [18]47.690.922922.53
Proposed47.390.915822.47
Table 3. Comparison results for original image and scaled image with scale factor 2 using proposed SR method for small vehicle detection using S2A-Net.
MethodTPFPAP
Original + S2A-Net [41]27788400.768
Proposed SR + S2A-Net [41]31544640.872
Publisher’s Note: MDPI stays neutral with regard to jurisdictional claims in published maps and institutional affiliations.

