Abstract
Driven by erodible soil, hydrological stresses, land use/land cover (LULC) changes, and meteorological parameters, windblown dust events initiated from Lordsburg Playa, New Mexico, United States, threaten public safety and health through low visibility and exposure to dust emissions. Combining optical and radar satellite imagery products can provide invaluable benefits in characterizing surface properties of desert playas—a potent landform for wind erosion. The optical images provide a long-term data record, while radar images can observe land surface irrespective of clouds, darkness, and precipitation. As a home for optical and radar imagery, powerful algorithms, cloud computing infrastructure, and application programming interface applications, Google Earth Engine (GEE) is an invaluable resource facilitating acquisition, processing, and analysis. In this study, the fractional abundance of soil, vegetation, and water endmembers were determined from pixel mixtures using the linear spectral unmixing model in GEE for Lordsburg Playa. For this approach, Landsat 5 and 8 images at 30 m spatial resolution and Sentinel-2 images at 10–20 m spatial resolution were used. Employing the Interferometric Synthetic Aperture Radar (InSAR) techniques, the playa’s land surface changes and possible sinks for sediment loading from the surrounding catchment area were identified. In this data recipe, a pair of Sentinel-1 images bracketing a monsoon day with high rainfall and a pair of images representing spring (dry, windy) and monsoon seasons were used. The combination of optical and radar images significantly improved the effort to identify long-term changes in the playa and locations within the playa susceptible to hydrological stresses and LULC changes. The linear spectral unmixing algorithm addressed the limitation of Landsat and Sentinel-2 images related to their moderate spatial resolutions. The application of GEE facilitated the study by minimizing the time required for acquisition, processing, and analysis of images, and storage required for the big satellite data.
1. Introduction
Playas are one of the major sources of atmospheric dust [1,2,3,4,5], attributed to the availability of thick deposits of erodible clastic and chemical sediments [1], often inherited from wetter conditions during the Pleistocene and Holocene epochs [6], and unvegetated land cover type [4,7,8]. They are generally dry lake beds in internal draining basins, common in arid and semi-arid environments where evaporation exceeds precipitation and inflow [9,10]. Globally, ephemeral water bodies account for around 31% of dust emissions [11]. For example, Bodele Depression, part of a dry lake bed at the southern edge of the Sahara Desert, is the world’s greatest source of mineral dust, contributing between 6 and 18% to the global atmospheric dust composition [5,12]. Likewise, playas in southern Africa were responsible for more than half of the all the dust plumes detected over the region [13]. At the northern edge of the Mojave Desert, the dried bed of Owens Lake, California, United States, was described as the most potent source of mineral dust in North America [14,15]. At the eastern Great Basin of Utah, United States, barren playa surfaces were identified as the major dust sources, recording the largest number of observed dust plumes ( 60% of the plumes) [3]. Ephemeral lakes in the Chihuahuan Desert of Southwest North America, despite a very small areal coverage (only 4%), were the sources of 48% of the observed dust plumes in the desert [16].
The land surface’s response to the wind erosion is determined by a combination of physical processes including soil moisture, surface roughness, vegetation cover, degree of surface crusting, and climate [17,18,19,20,21]. Soil moisture increases threshold friction velocity for dust emission by increasing cohesion between soil particles [22,23]. Density of vegetation cover, rocks, and microtopography affects threshold friction velocity by modulating surface roughness [20,24,25]. Diminishing of grass cover below 9% can increase dust flux dramatically [26]. Bolstering this observation, climate-induced decrease in perennial vegetation cover coupled with the disturbance of biological soil crusts triggers an exponential increase of aeolian sediment flux [27]. The setting of land cover in terms of spatial pattern, distribution, density, and vegetation height also play a significant role in the land surface’s response to erosion and deposition of soil particles [21,28,29,30].
Hydrology linked inundation of playas is a crucial factor in controlling the amount of sediment loading from watersheds and their deposition on playa surfaces, leading to regional and local changes of dust storm hotspots [31,32]. Changes in the frequency and intensity of runoff and spatial extent of inundated area of playas may lead to a significant fluctuation of sediment availability on seasonal and inter-annual bases [33,34]. The movement of the edge of a playa’s water body also dictates the variation in the spatial pattern of sediment deposition across the playa surface and the area susceptible to aeolian erosion [34,35]. Heavy precipitation may eventually trigger an increase of dust events through the development of soft surfaces with thin and newly formed crusts, production of loose aggregates of evaporite minerals, and rise of water table’s hydraulic head [19]. These processes create erodible surfaces by increasing rates of vapor discharge, formation of loose evaporite minerals, and temporary softening of playa surfaces. During sediment runoff onto playas from surrounding uplands, coarse particles deposit at the edge of the playa and fine particles accumulate at the inner part of the playa, primarily influenced by their settling velocity [36]. When a playa surface rich with loose sediments is coupled with strong surface winds, dust events develop. Dust particles are entrained and transported from the surfaces when the wind speed reaches a critical threshold friction velocity and often assisted by saltation mechanisms [37,38].
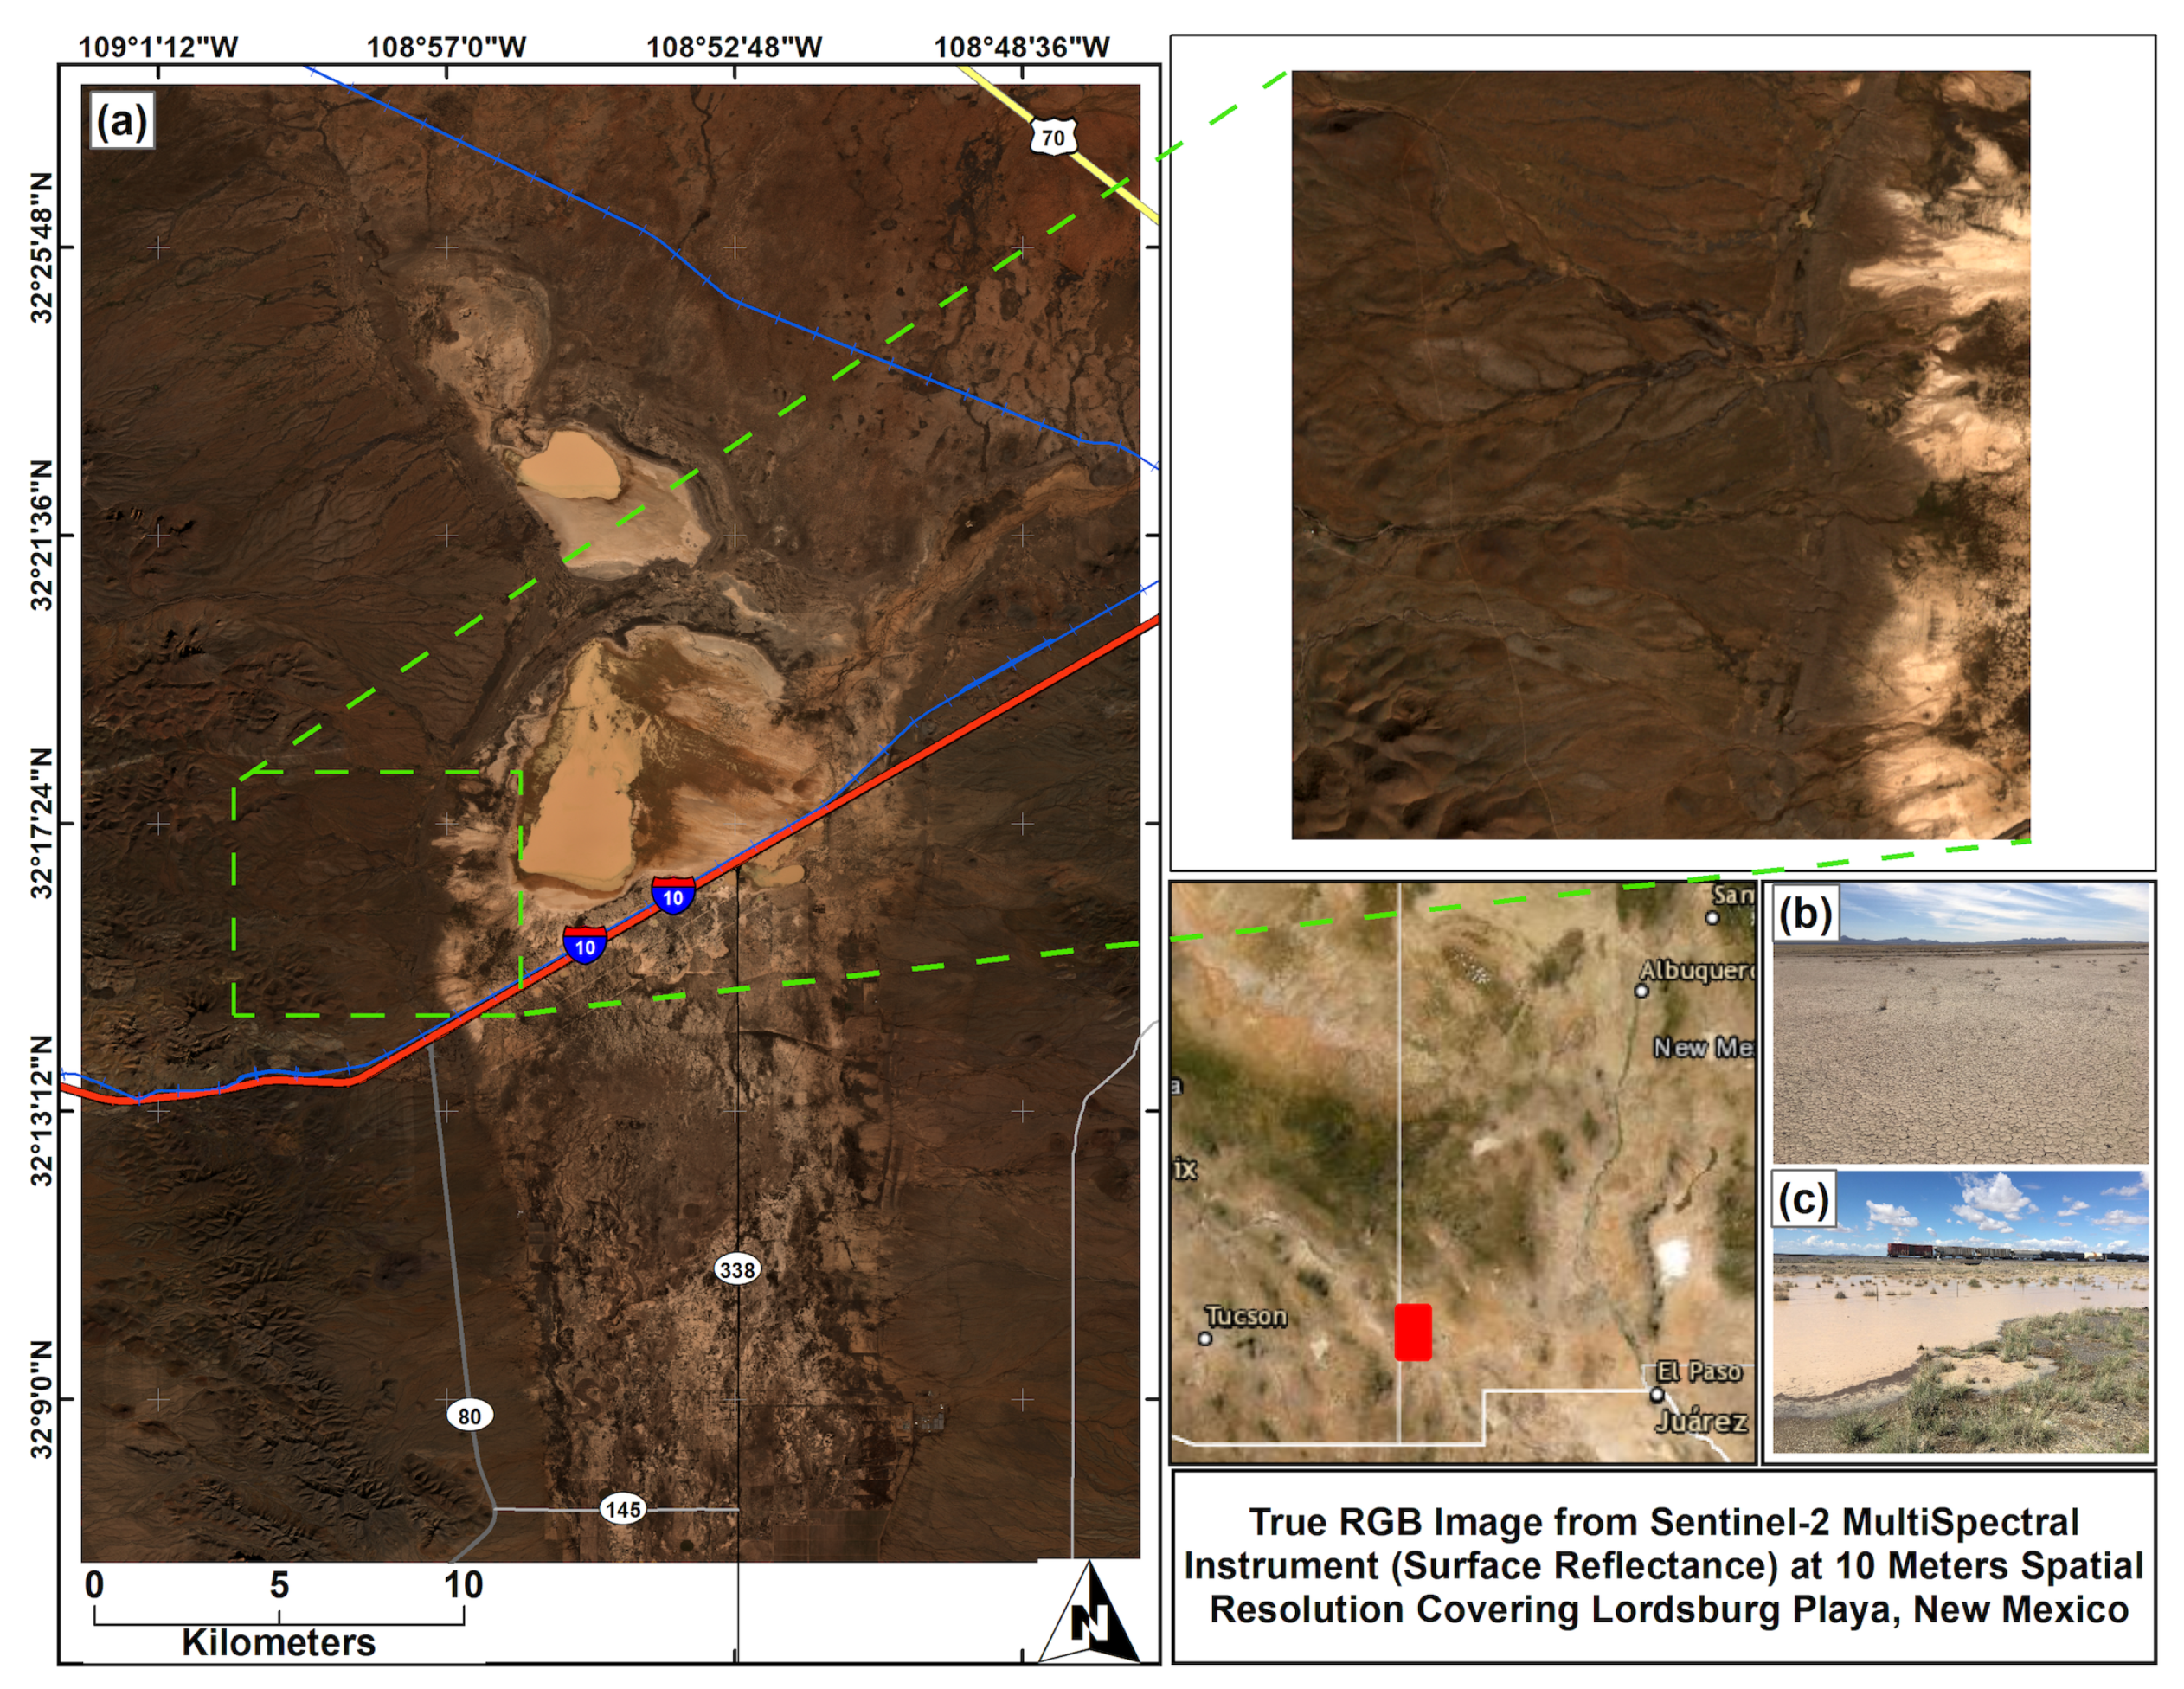
Being unvegetated, flat, rich with unlimited supply of sediments, susceptible to wind erosion, and sensitive to anthropogenic disturbances, Lordsburg Playa (Figure 1) in Hidalgo County, New Mexico, United States; has been hotspot of dust events. This playa is crossed by Interstate 10 (I-10) and Union Pacific Railroad, making it the only playa hotspot in the United States bisected by an interstate highway [39]. It is usually inundated by highly variable seasonal rainfall events, mostly during summer North American Monsoon season, loading sediment into the playa through water erosion of upstream breached tanks and berms [40]. Hard crust surfaces are developed in the inner part of the playa as a result of very fine sediments and evaporation. An increase in the availability of loose sediments on the playa through anthropogenic disturbances (livestock and vehicular traffic, alteration of surface hydrology, depleted vegetation, and presence of exposed saline-sodic soils) routinely intensify dust generation [41]. The dust events from this surface have been causing major risks to traffic safety [40,42], public health [43], and economy [44]. For example, the New Mexico Department of Transportation (NMDOT) reported that dust storm (poor visibility)-linked traffic accidents have killed 21 and caused 39 closures at the Lordsburg Playa’s I-10 corridor between 2012 and 2020 [40].
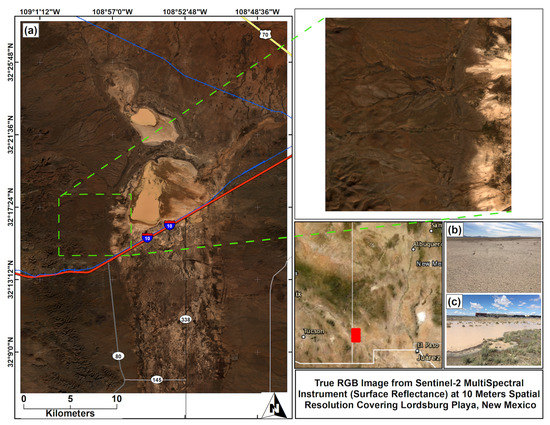
Figure 1.
(a) True RGB (Band 4—Red, Band 3—Green, and Band 2 Blue) image of the study area covering Lordsburg Playa from Seneinel-2 MSI (MultiSpectral Instrument) Level 2A at 10 m spatial resolution [71]. (b) Hard crusted surface from the inner part of the playa acquired on 7 March 2018. (c) Inundation of the playa acquired on 20 September 2018. The red line indicates the major highway of Interstate 10 (I-10). The gray and black lines indicate the minor highway systems. The blue lines indicate railroad transportation system. The dashed green box and lines highlights the network of channels on the edge of the playa that transport water and sediments from the watershed to the playa.
Remote sensing imagery products have been invaluable resources for analyzing and monitoring LULC changes, hydrological responses, water erosion, and wind erosion [45,46,47,48]. Given their high temporal coverage, optical satellite remote sensing products have been widely employed for investigating playas’ long-term variability of inundation [9,49,50,51], water surface extent and area [52,53,54], water level [55,56], evaporative water loss [57], and spectral reflectance parameters [58]. However, few studies have been conducted to link the impact of hydrological changes to dust generation from playa surfaces [8,18,59,60]. The performance of optical satellite remote sensing is usually hindered during cloudy days, rainfall events, and nighttime. Due to its capability to penetrate through these obstructions, radar satellite remote sensing in combination with optical satellite remote sensing can significantly improve the characterization of playa surface responses to hydrological and LULC changes. Moreover, the signal detected by optical sensors into a single pixel is frequently a mixture of numerous disparate signals from different land cover types. This spectral mixing can occur for two reasons: if the spatial resolution is low enough and if the distinct endmembers are combined into a homogeneous mixture [61,62]. This type of mixing is most common in arid environments that are typically a combination of vegetation and soil in different proportions [63], and it can be partly addressed using spectral unmixing techniques [64].
Given this paradigm, the present study combines optical and radar satellite remote imagery products to characterize long-term changes of surfaces properties of Lordsburg Playa as a case study. It examines the fractional abundance of soil, vegetation, and water endmembers of each pixel of images using a spectral unmixing algorithm. This was done using optical remote sensing imagery products of Landsat and Sentinel-2 at Google Earth Engine. The study used the Landsat 8 and 5 at 30 m spatial resolution, and the Sentinel-2 Multispectral instrument at 10–20 m spatial resolution. It also studied the playa’s water level changes and the possible sinks for sediment loading and hotspots for wind erosion by employing Interferometric Synthetic Aperture Radar (InSAR) techniques. In this data recipe, the study analyzed a pair of Sentinel-1 images that bracket a monsoon day with high rainfall events and a pair of images representing a dry day and the monsoon day.
2. Study Area
The Lordsburg Playa is located in the far northwestern portion of the Chihuahuan Desert, a few miles west of the City of Lordsburg, New Mexico, USA (Figure 1). The closed basin containing the Lordsburg Playa is bounded to the east by the Pyramid Mountains and to the west by the Peloncillo Mountains [65,66]. This pluvial ephemeral lake has a lake area of 374 km2, catchment area of 5670 km2, lake area/catchment area ratio of 0.066, annual precipitation of 25 cm, and annual evaporation of 184 cm [67]. Thus, it usually experiences high hydrological stresses, because the annual evaporation rate exceeds the overall inflow rate to the basin floors from precipitation, runoff, and groundwater [67]. As a result of hydrological and geological processes which occurred during the pluvial Pleistocene epoch, sediments were deposited and formed into fine-textured soil associations in the basin between the mountains [68]. As a result, the soils of the piedmont slopes (including the edges of the playa) and the inner part of the playa are dominated by highly fragile and erodible soil classes [69,70]. The playa is usually inundated by highly variable seasonal rainfall, mostly occurring during the summer North American monsoon season, loading sediments through water erosion and breached tanks and berms [40,42]. It develops crusts on its surfaces once the water evaporates because the outflow rate is greater than the inflow rate. Anthropogenic disturbances in the playa increases the availability of loose sediments leading to the generation of dust storms [42].
3. Data
This study employed a combination of optical and radar satellite remote sensing imagery products and spectral signatures of endmembers to characterize the surface properties of the Lordsburg Playa. Satellite remote sensors acquire information about the Earth system through a variety of basic physical principles, detecting and measuring the electromagnetic spectrum by the radiation reflected (optical sensors), emitted (thermal infrared or passive microwave sensors), or scattered (active radar sensors including radar) [72]. Given these properties and their different atmospheric penetration capabilities, optical and radar satellite remote sensing data were synthesized to cover wider portions of the electromagnetic spectrum and, in turn, to improve the monitoring performance of LULC changes and hydrological processes [73,74].
3.1. Optical Satellite Remote Sensing Imagery, Inventory, and Preprocessing
Optical satellite remote sensing utilizes the visible, near infrared, and short-wave infrared parts of the electromagnetic spectrum to rasterize the Earth’s surface by detecting the radiation (mainly solar) reflected from the target on the ground. From this category, Landsat mission (Landsat 5 and 8) and Sentinel-2 images were used. Landsat products were selected for their long-term data coverage and Sentinel-2 images for their finer spatial resolution. Landsat 7 images were excluded from this study due to the data loss of 22–25% in each image resulting from the mechanical failure of the Scan Line Corrector (SLC) on 31 May 2003 [75]. This study utilized the invaluable resources of Google Earth Engine (GEE) [76] to avoid the space required for big satellite data storage; minimize the time required for data acquisition, downloading, processing, and analyzing; and exploit its powerful algorithms. GEE is a cloud-based platform that provides multi-petabyte analysis-ready satellite remote sensing data, internet-accessible application programming interface, and an interactive development environment that enable rapid prototyping and visualization, powerful algorithms, and capabilities for disseminating results to other stakeholders [76]. It is in use across a wide range of disciplines, including flood mapping, global forest change, global surface water change, crop yield estimation, rice paddy mapping, urban mapping, fire recovery, and malaria risk mapping [76].
The NASA and USGS joint program of Landsat series of earth observation satellites has continuously acquired images of the Earth’s land surface since 1972 at a 30 m spatial resolution about once every two weeks, providing invaluable resources for agriculture, engineering, geology, forestry, regional planning, mapping, and global change research [77,78]. This study used the combination of Landsat 5 (ETM sensor) and Landsat 8 (OLI/TIRS Sensors) Surface Reflectance Tier 1 images for Worldwide Reference System (WRS) Row 38 and Path 34 covering the Lordsburg Playa. Landsat images include seven bands with four visible and near-infrared (VNIR) bands, two short-wave infrared (SWIR) bands, and one thermal infrared (TIR) band. On the other hand, Landsat 8 scenes contain nine bands with five visible and VNIR bands, two SWIR bands, and two TIR bands. Both datasets are corrected for atmospheric effects.
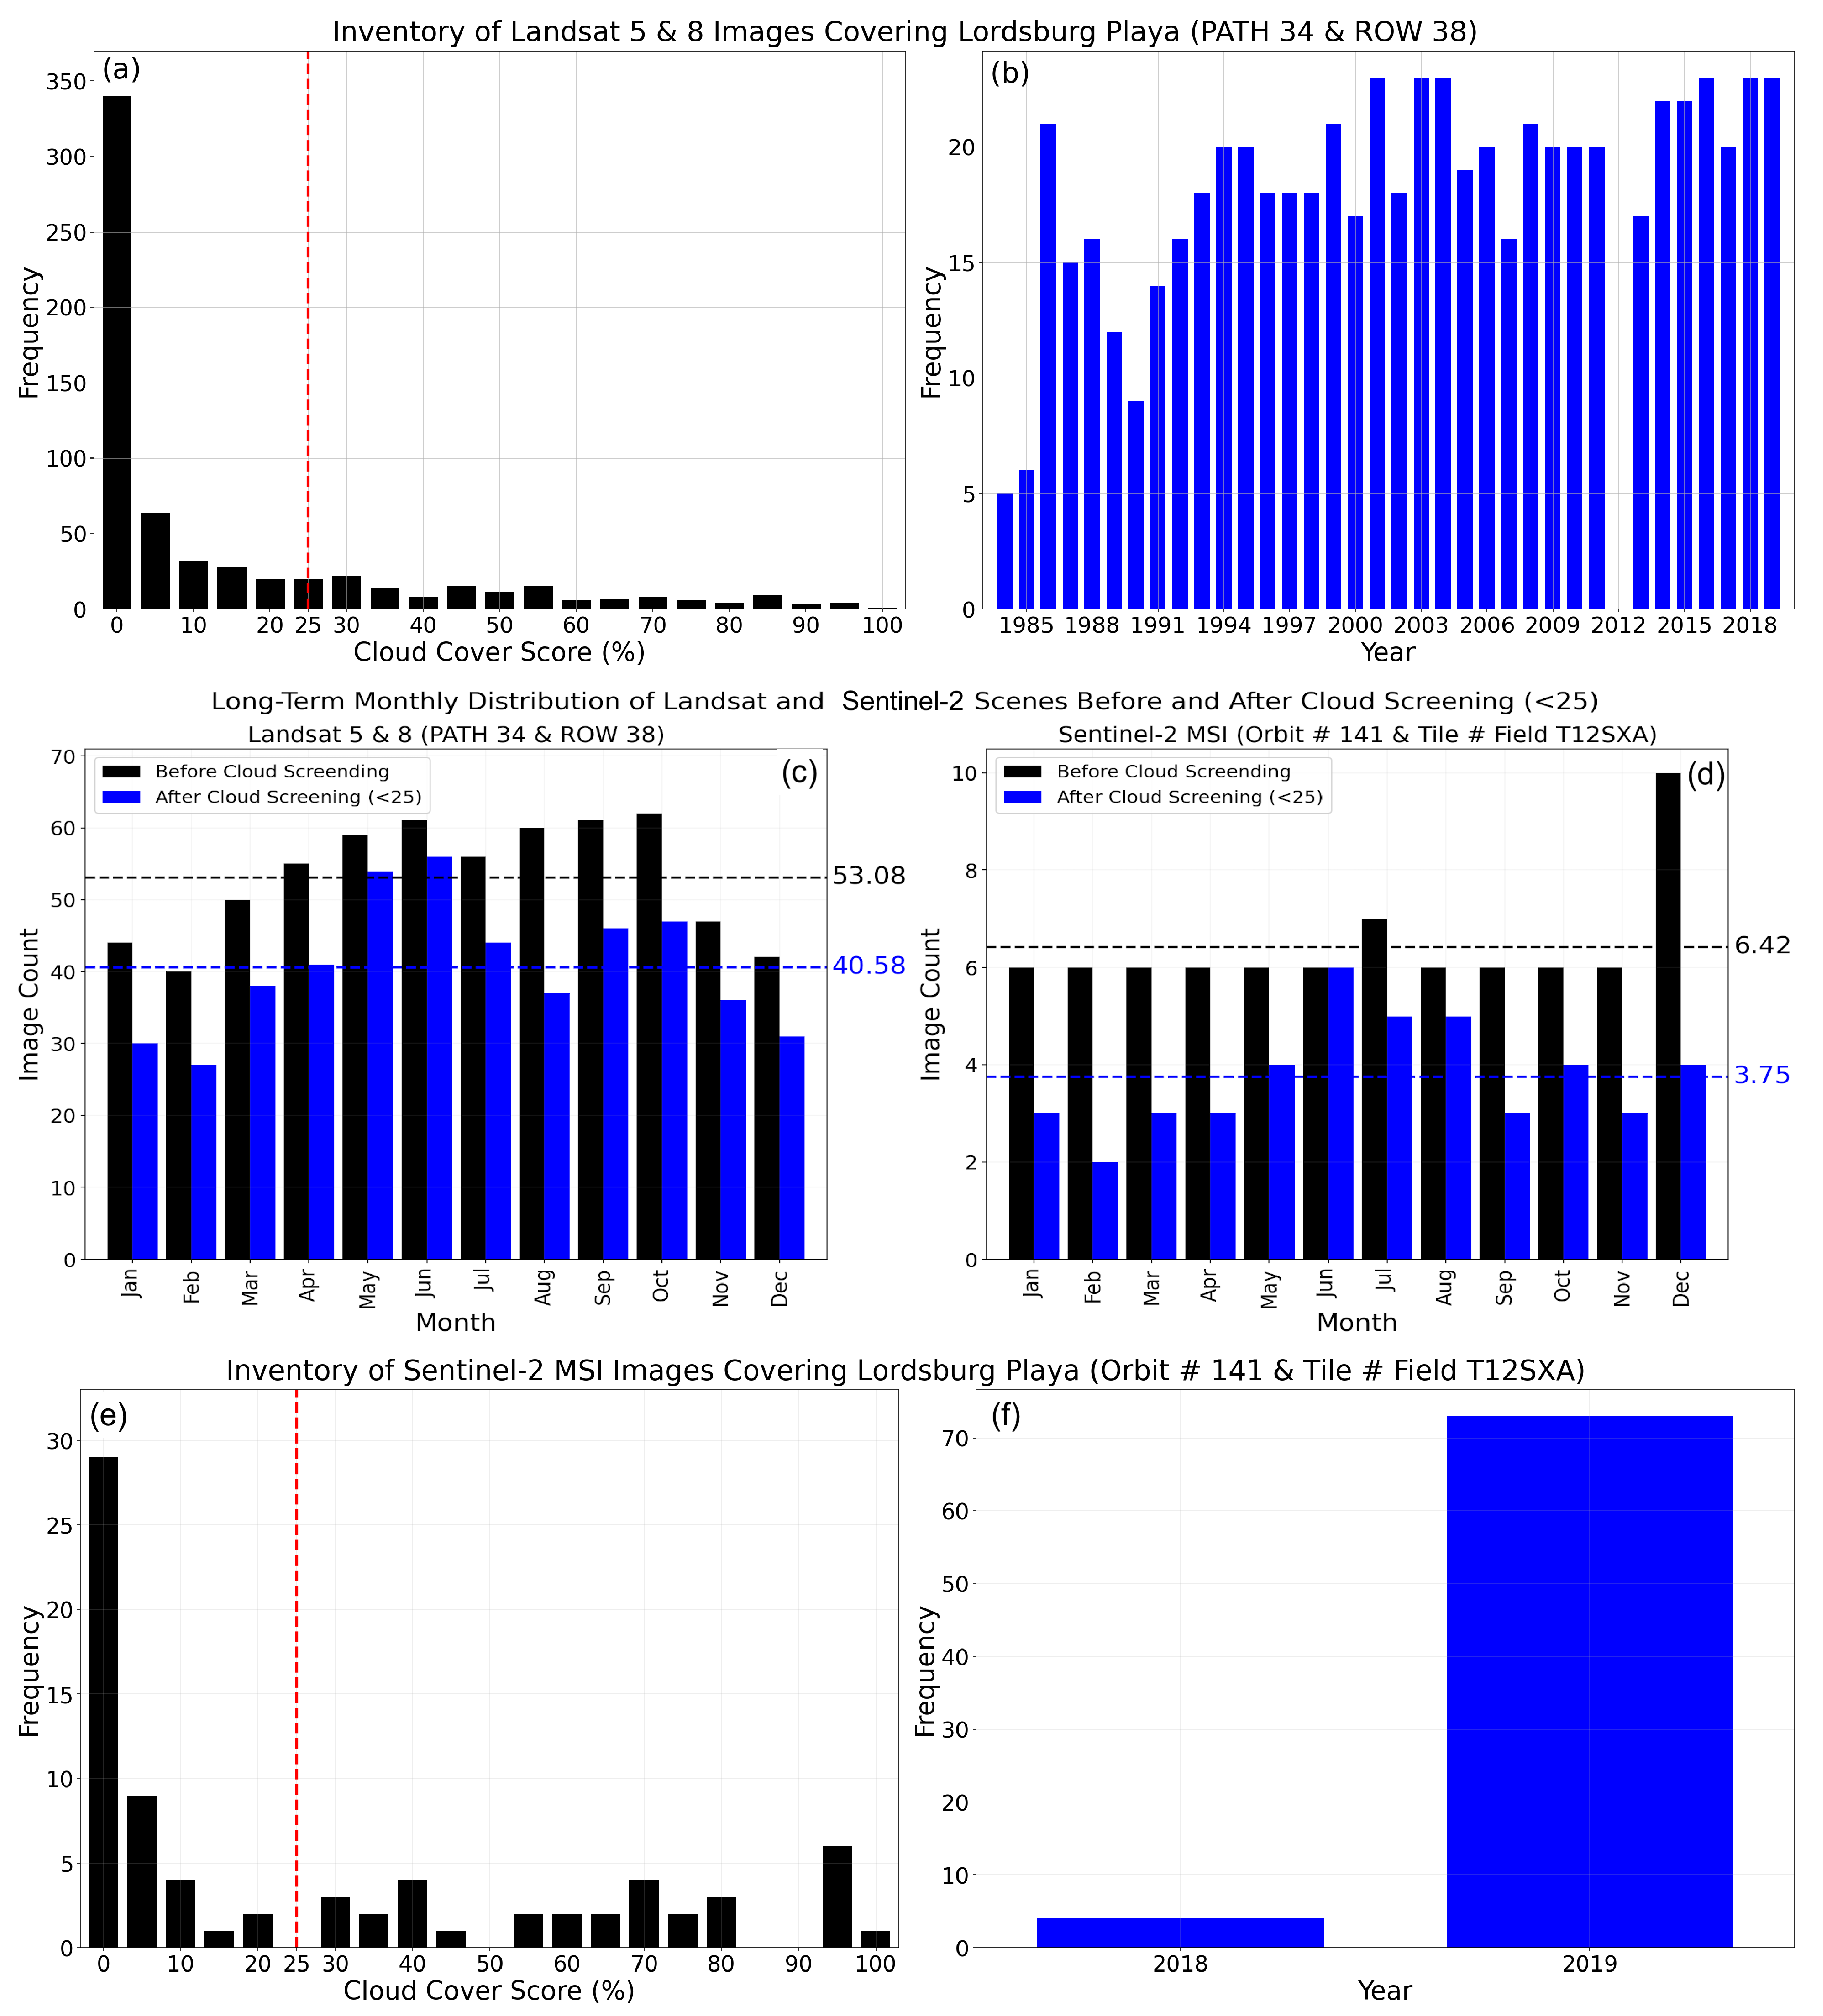
Combining Landsat 5 and 8, the images cover almost 37 years of data records, Landsat 5 extending from March 1984 to May 2012 and Landsat 8 from April 2013 to present. The satellite overpass time (sensing time) over the Lordsburg Playa was around 17:12 UTC (between 16:45:23 and 17:40:50 UTC) for Landsat 5 and 17:47 UTC for Landsat 8 (between 17:44:43 and 17:50:31 UTC). A total of 637 images were collected, 487 images from Landsat 5 between March 1984 and May 2012, and 150 images from Landsat 8 extending from April 2013 to December 2019. The majority of the images showed very low cloud cover score (Figure 2a). After the screening, the study was left with 487 images representing 76% of the total images. The long-term monthly sum of cloud cover score distribution exhibited the mean value of 40.58% after the cloud screening, decreased by around 12.5% from the before-cloud screening scenario, which was 53.08% (Figure 2c). August, affected by the monsoon season, encountered a large drop in the number of images after cloud screening. The months in winter and late autumn experienced slightly fewer retained images compared with the remaining months before and after cloud screening. The collection, processing (including cloud screening), scaling, merging, and visualization of the images were performed in Google Earth Engine.
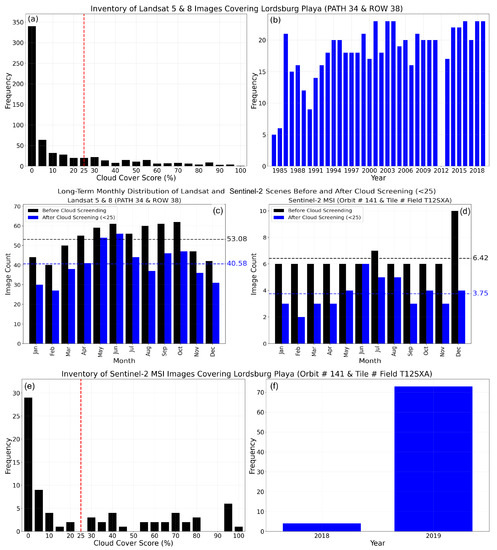
Figure 2.
Frequency of atmospherically corrected Landsat 5 and 8 surface reflectance images covering the Lordsburg Playa: (a) Cloud cover score and (b) years; number of images before and after data processing through cloud cover score screening (<25): (c) Landsat 5 and 8 images and (d) Sentinel-2 images; the number of atmospherically corrected Sentinel-2 MultiSpectral Instrument (MSI) Level-2A surface reflectance images at Orbit Number 141 and Tile Number Field T12SXA by: (e) Cloud cover score and (f) years. The red dashed line represents the threshold used for screening images with low cloud coverage (<25).
The European Space Agency (ESA)’s Multispectral Instrument (MSI) aboard two polar-orbiting Sentinel-2 satellites (Sentinel-2A and Sentinel-2B) provides global coverage (between latitudes 56°S and 84°N) at every 5 days with two satellites and 10 days with one satellite (European Space Agency, 2020). The MSI instrument detects the Earth’s surface using 13 spectral bands: four visible and NIR bands at 10 m spatial resolution, six red edge and SWIR bands at 20 m spatial resolution, and three atmospheric bands at 60 m spatial resolution. The current study used Level-2A images, which are atmospherically corrected Bottom of Atmosphere (BOA) surface reflectance derived from their corresponding Level-1C products [79]. This product temporally covers from 28 March 2017 to present, and each image consists of 12 bands (unlike in Level-1C, excluding cirrus band 10, as it does not contain surface information).
The study utilized Sentinel-2 images collected from March 2017 to December 2019 with the Orbit number of 141 and Tile Number Fields of T12SXA covering the Lordsburg Playa. A total of 77 images (39 images from Sentinel-2A and images from Sentinel-2B) images were acquired, 4 images during 2018 and 73 images during 2019 (Figure 2f). The satellite sensing time over the Lordsburg Playa was between 17:49:11 and 17:57:41 UTC for Sentinel-2A and between 17:49:09 and 17:57:39 UTC for Sentinel-2B. Majority of the images were not corrupted by clouds (Figure 2e). Before the cloud screening (<25%) the image counts were evenly distributed throughout the year, averaging at 6.42, except during December, in which all the 2018 images were acquired in December (Figure 2d). After the cloud screening, the number of images were reduced to 45, with the early and late months of the year showing a considerable drop. The collection of images from only 13 months (1 month from 2018 and 12 months from 2019) may have impacted the assessment of the cloud climatology. The collection and processing of all the images were performed in Google Earth Engine.
3.2. Spectral Signatures of Endmembers and Spectral Resampling
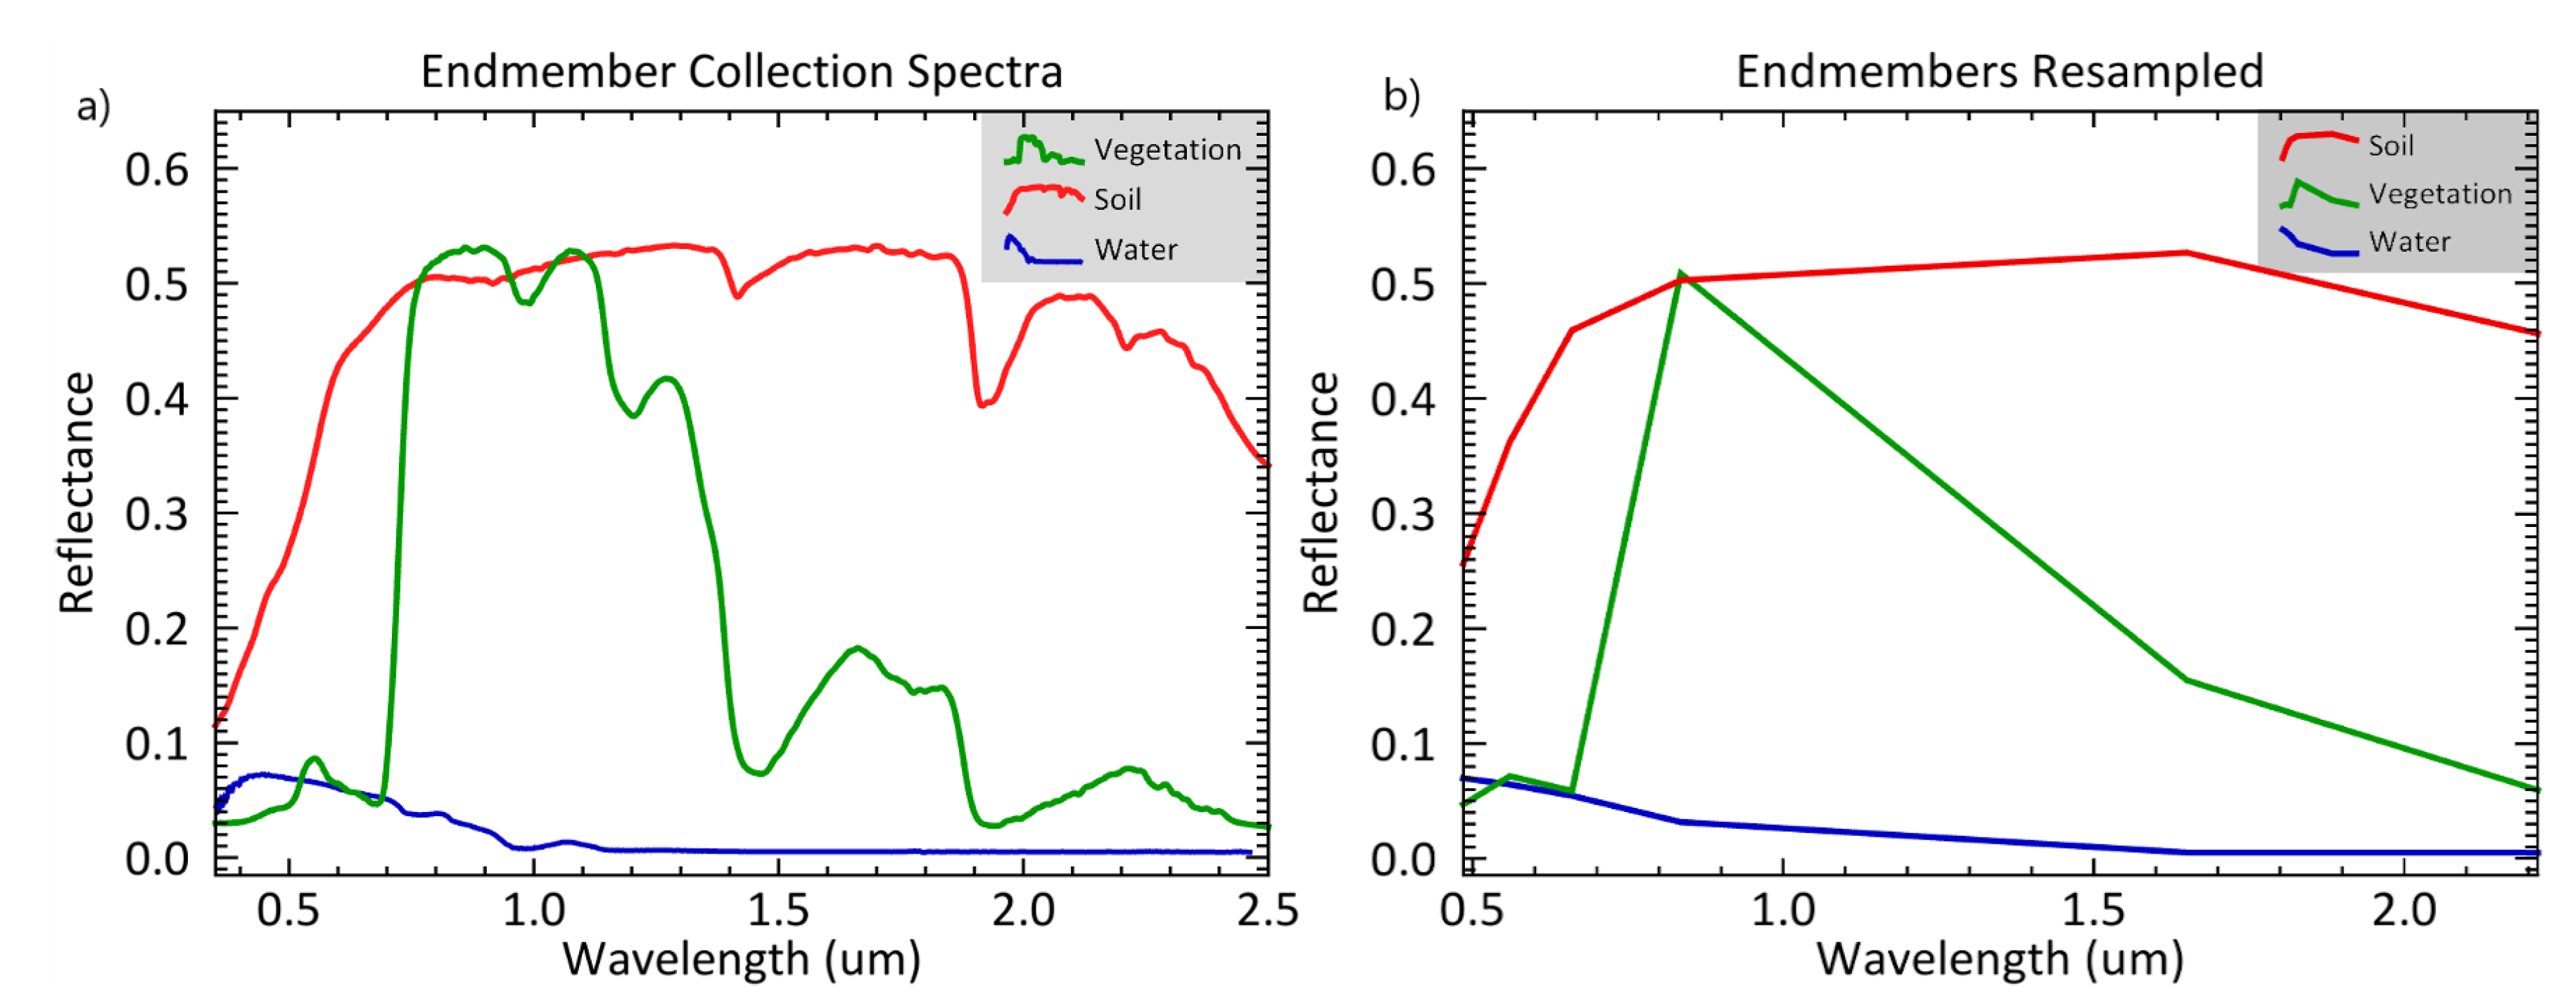
The spectral signatures of vegetation, soil, and water endmembers were acquired from the USGS spectral library with electromagnetic spectrum covering from the ultraviolet to the far infrared [80]. The measurements were acquired using laboratory, field, and airborne spectrometers for identifying and mapping materials on the earth and throughout the solar system through spectroscopic remote sensing. These measurements were already resampled to terrestrial multispectral sensors including Landsat 8 OLI and Sentinel-2 MSI. Thus, the resampled spectral signatures of the endmembers were directly applied to the linear spectral unmixing model. However, the original measurements were not resampled to the Landsat 5 ETM sensor wavelength spectrum. To fill this gap, we resampled the endmember spectra from Analytical Spectral Devices (which were convolved from the original measurements) to the wavelengths of the Landsat 5 ETM using ENVI version 5.3 (Exelis Visual Information Solutions, Boulder, Colorado) (Figure 3). In addition, the USGS spectral library does not include measurements from the Lordsburg Playa. To deal with this problem, we used spectral information of the endmembers from other playas across the southwestern United States (including Stonewall Playa, Cuprite, Nevada) with similar properties as endmembers from the Lordsburg Playa [80]. We used 6 bands from Landsat 5, 8 bands from Landsat 8, and 12 bands from Sentinel-2.
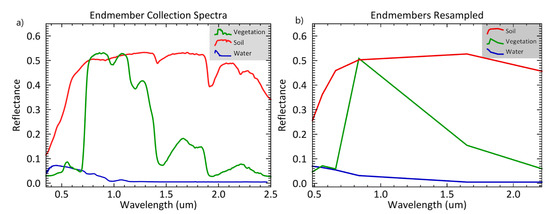
Figure 3.
Spectral resampling of land surface endmembers’ (vegetation, soil, and water) spectral signatures from (a) Analytical Spectral Devices (ASD) spectral resolution [80] to (b) Landsat 5 spectral resolution using ENVI version 5.3 (Exelis Visual Information Solutions, Boulder, Colorado).
3.3. Radar Satellite Remote Sensing Imagery and Preprocessing
During cloudy days, nighttime, and heavy precipitation, the performance of optical satellite remote sensors is impaired, creating noisy pixels in the sensed images and gaps in the continuity of information flow. Given this limitation, it is crucial to integrate other data products with the capability to penetrate through those obstructions. Thus, in this study we also employed radar images from Synthetic Aperture Radar (SAR) remote sensing instrument aboard Sentinel-1 satellite mission, which has a capability of operating in all weather and all time scenarios. European Space Agency’s Sentinel-1 mission comprises a constellation of two polar-orbiting satellites (Sentinel-1A and Sentinel-1B), operating at C-band SAR (at 5.4 GHZ frequency or 5.6 cm wavelength) imaging providing a revisit time of 6 days for two satellites and 12 days for a single satellite [81]. Sentinel-1 C-band SAR collects images at a variety of spatial resolutions and polarizations.
To investigate the deformation and displacement of the Lordsburg Playa surface due to the inflow of water and associated water erosion from a single rainfall event and monsoon season, four images were acquired from the Alaska Satellite Facility’s Vertex data portal [82]. A pair of Sentinel-1 images (pre-event from 24 July 2017 and post-event from 5 August 2017) bracketing a wet monsoon day (1 August 2017) characterized by a high rainfall event on the region. We used a pair of images representing a dry day (pre-event from 14 March 2017) from the spring (dry) season and a wet day (post-event from 5 August 2017) from the summer (wet) season. We used Level-1 Single-Look Complex (SLC) product type from Sentinel-1B acquired through the Interferometric Wide (IW) Swath mode implying the spatial resolution of 5 × 20 m and dual polarization of VV and VH.
4. Methods
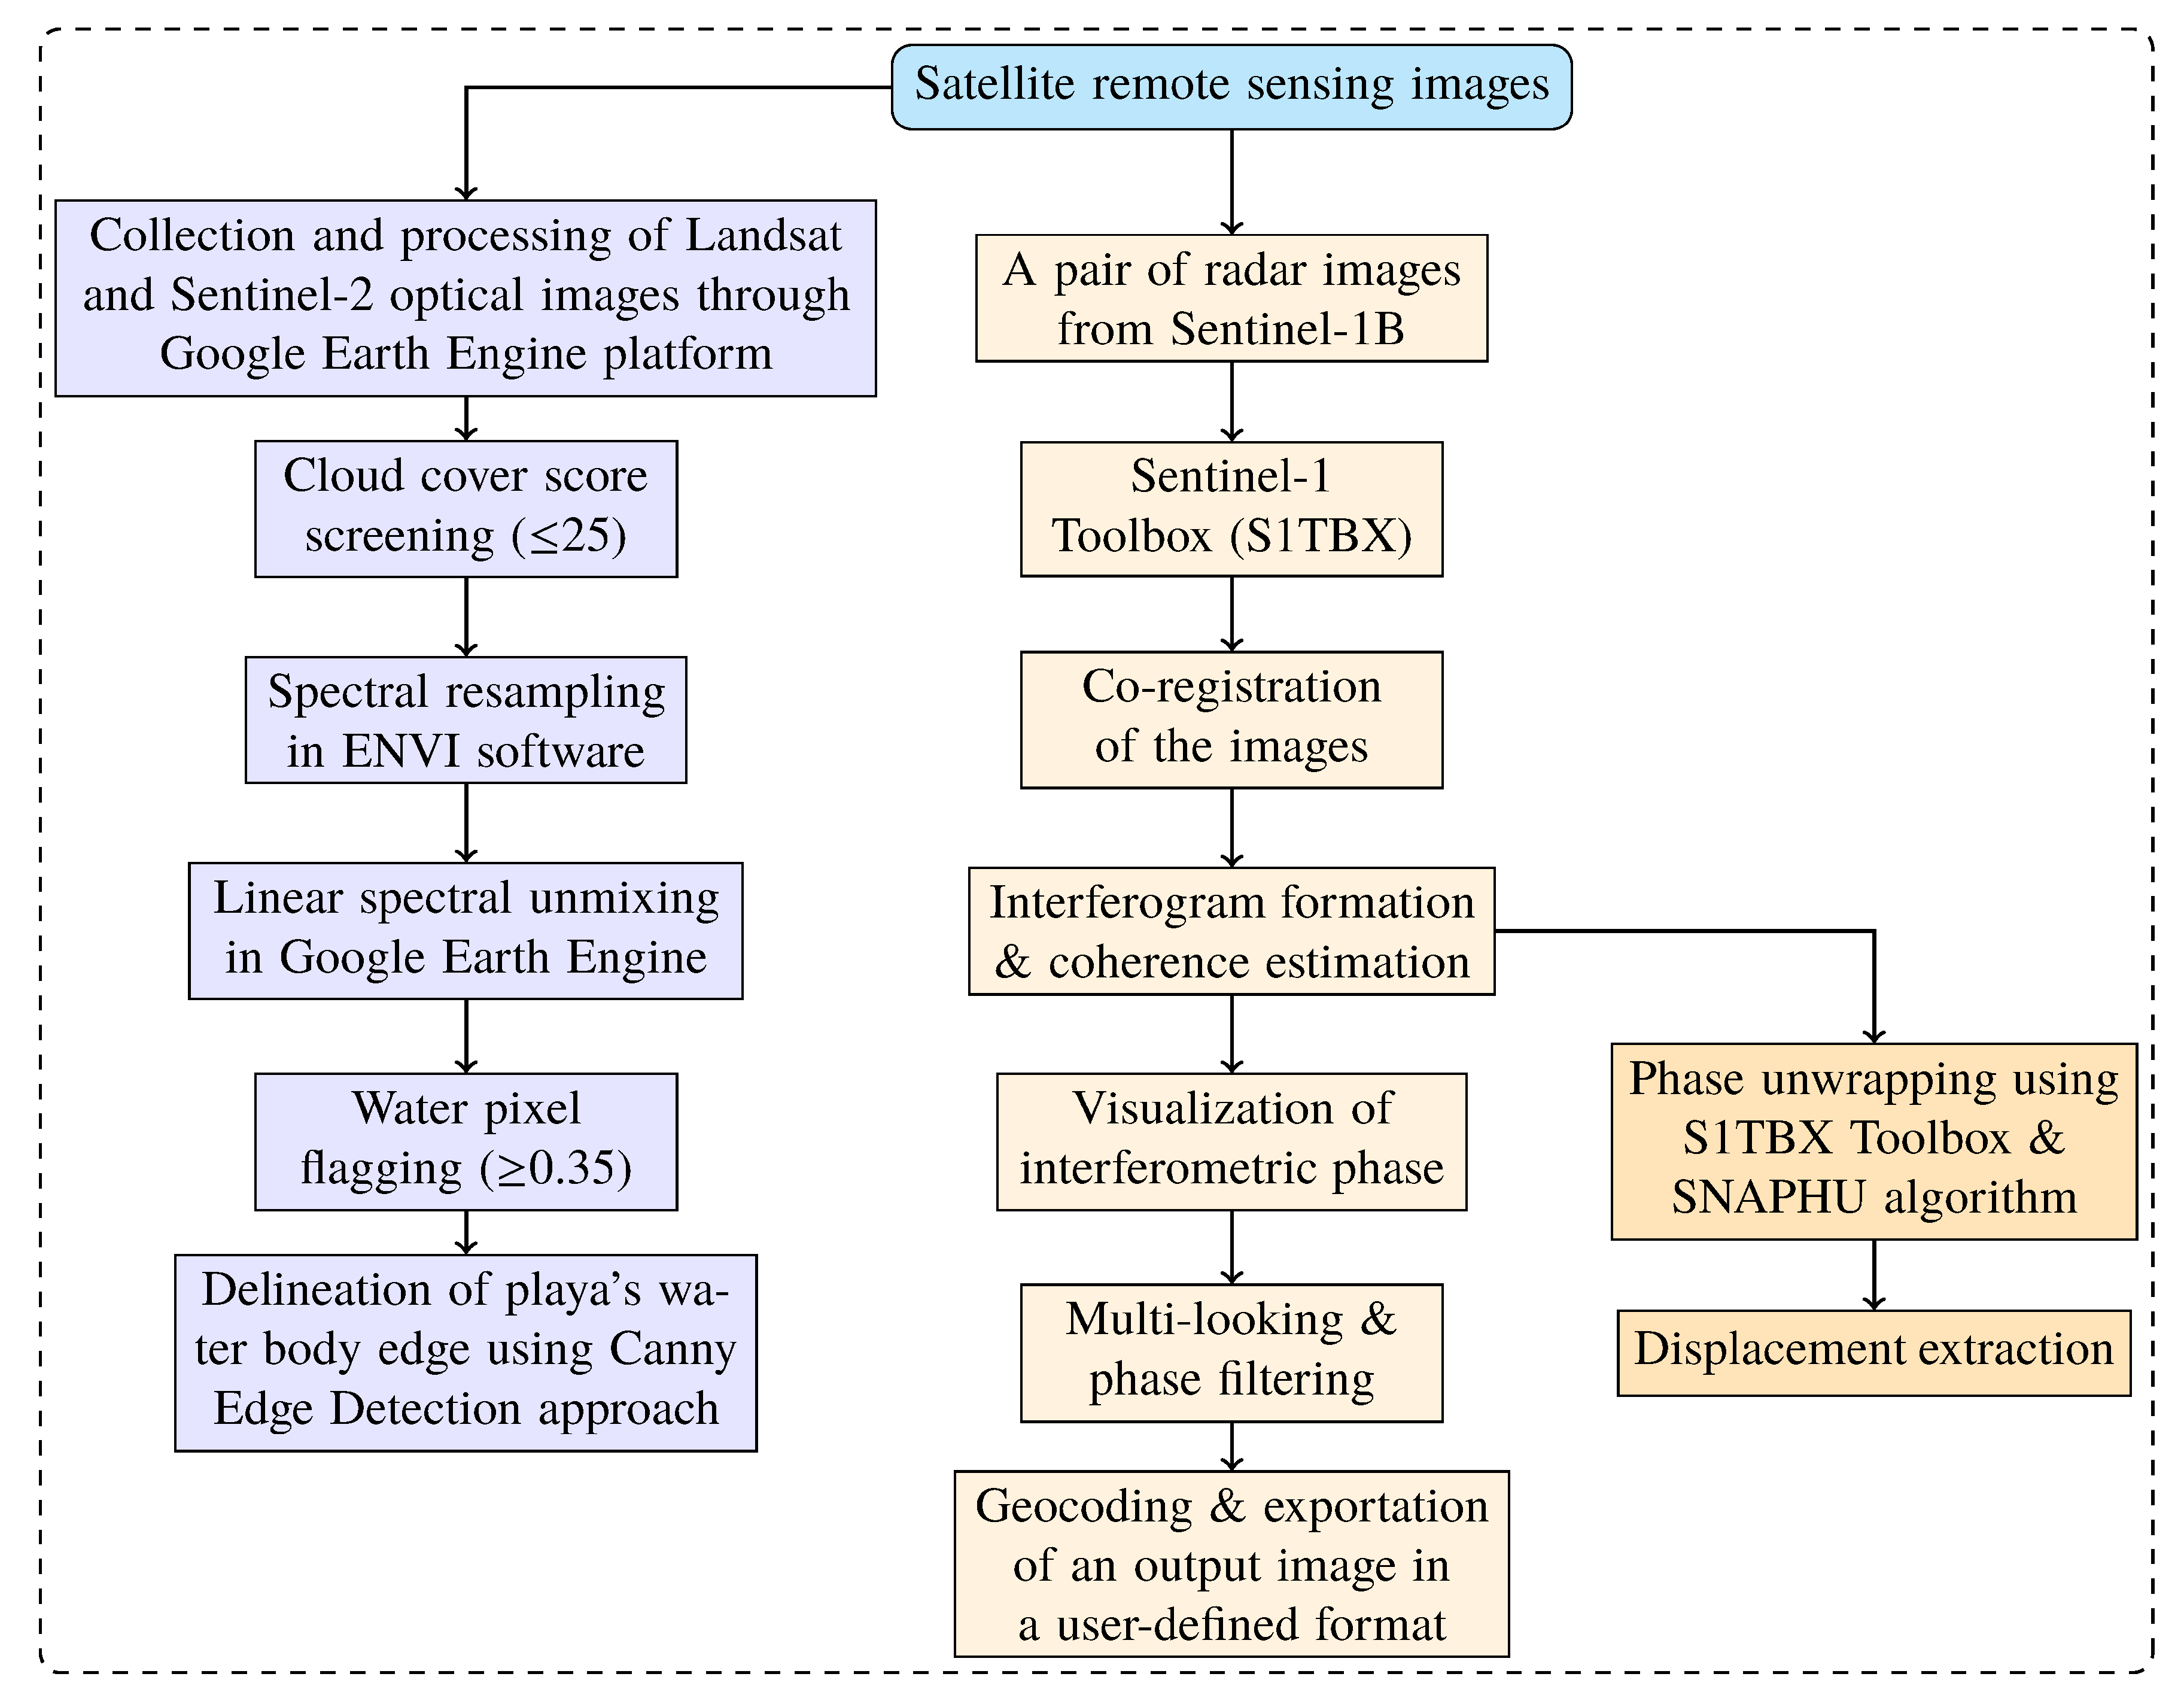
The methodologies utilized in this study are divided into two parts, the optical and radar satellite remote sensing imagery products (Figure 4). In the first part, we used the linear spectral unmixing model to identify the fractional abundance of endmembers in each pixel, water pixel flagging approach to estimate the areal extent of the water body, and Canny edge detection algorithm to delineate the edge of the water body in the playa. In the second part, we applied the Interferometric SAR (InSAR) technique to estimate the deformation and displacement of the playa due to changes in hydrology.
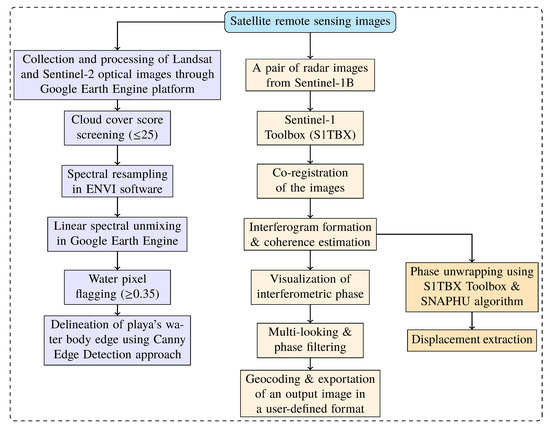
Figure 4.
Flowchart of the methodologies utilized in the linear spectral unmxing approach and radar image analysis.
4.1. Linear Spectral Unmixing, Water Pixel Flagging, and Edge Detection
To estimate the fractional abundance of the playa’s land surface endmembers, we used the linear spectral unmixing that decomposes mixed spectra into distinct endmembers. Equation (1) represents the linear unmixing model:
where denotes the spectrum mixture of each pixel at each ith spectral channel from the optical remote sensing imagery; denotes the spectral signature of endmember j at ith spectral channel from either laboratory, field, or airborne spectrometers or combinations of these instruments; denotes the fractional abundance of endmember at ith spectral channel; denotes the modeling residual error at ith spectral channel; j denotes the number of endmembers (in this case, 3 endmembers namely, vegetation, soil, and water); and i denotes the number of the spectral bands. In addition, because the fractional abundance parameter represents the fractional areal abundances shared by the endmember j, we constrained the fractional abundance values by the nonnegativity (Equation (2)) and sum-to-one (Equation (3)) conditions. The unknown parameters () can be estimated by using different linear algebra approaches, which minimizes the residual error term (). However, in this study, we used the spectral unmix algorithm provided by the Google Earth Engine. This approach decomposes each mixed pixel by computing the pseudo-inverse and multiplying it through each pixel. The fractional abundance of water was further used for the estimation of playa’s flooded water extent.
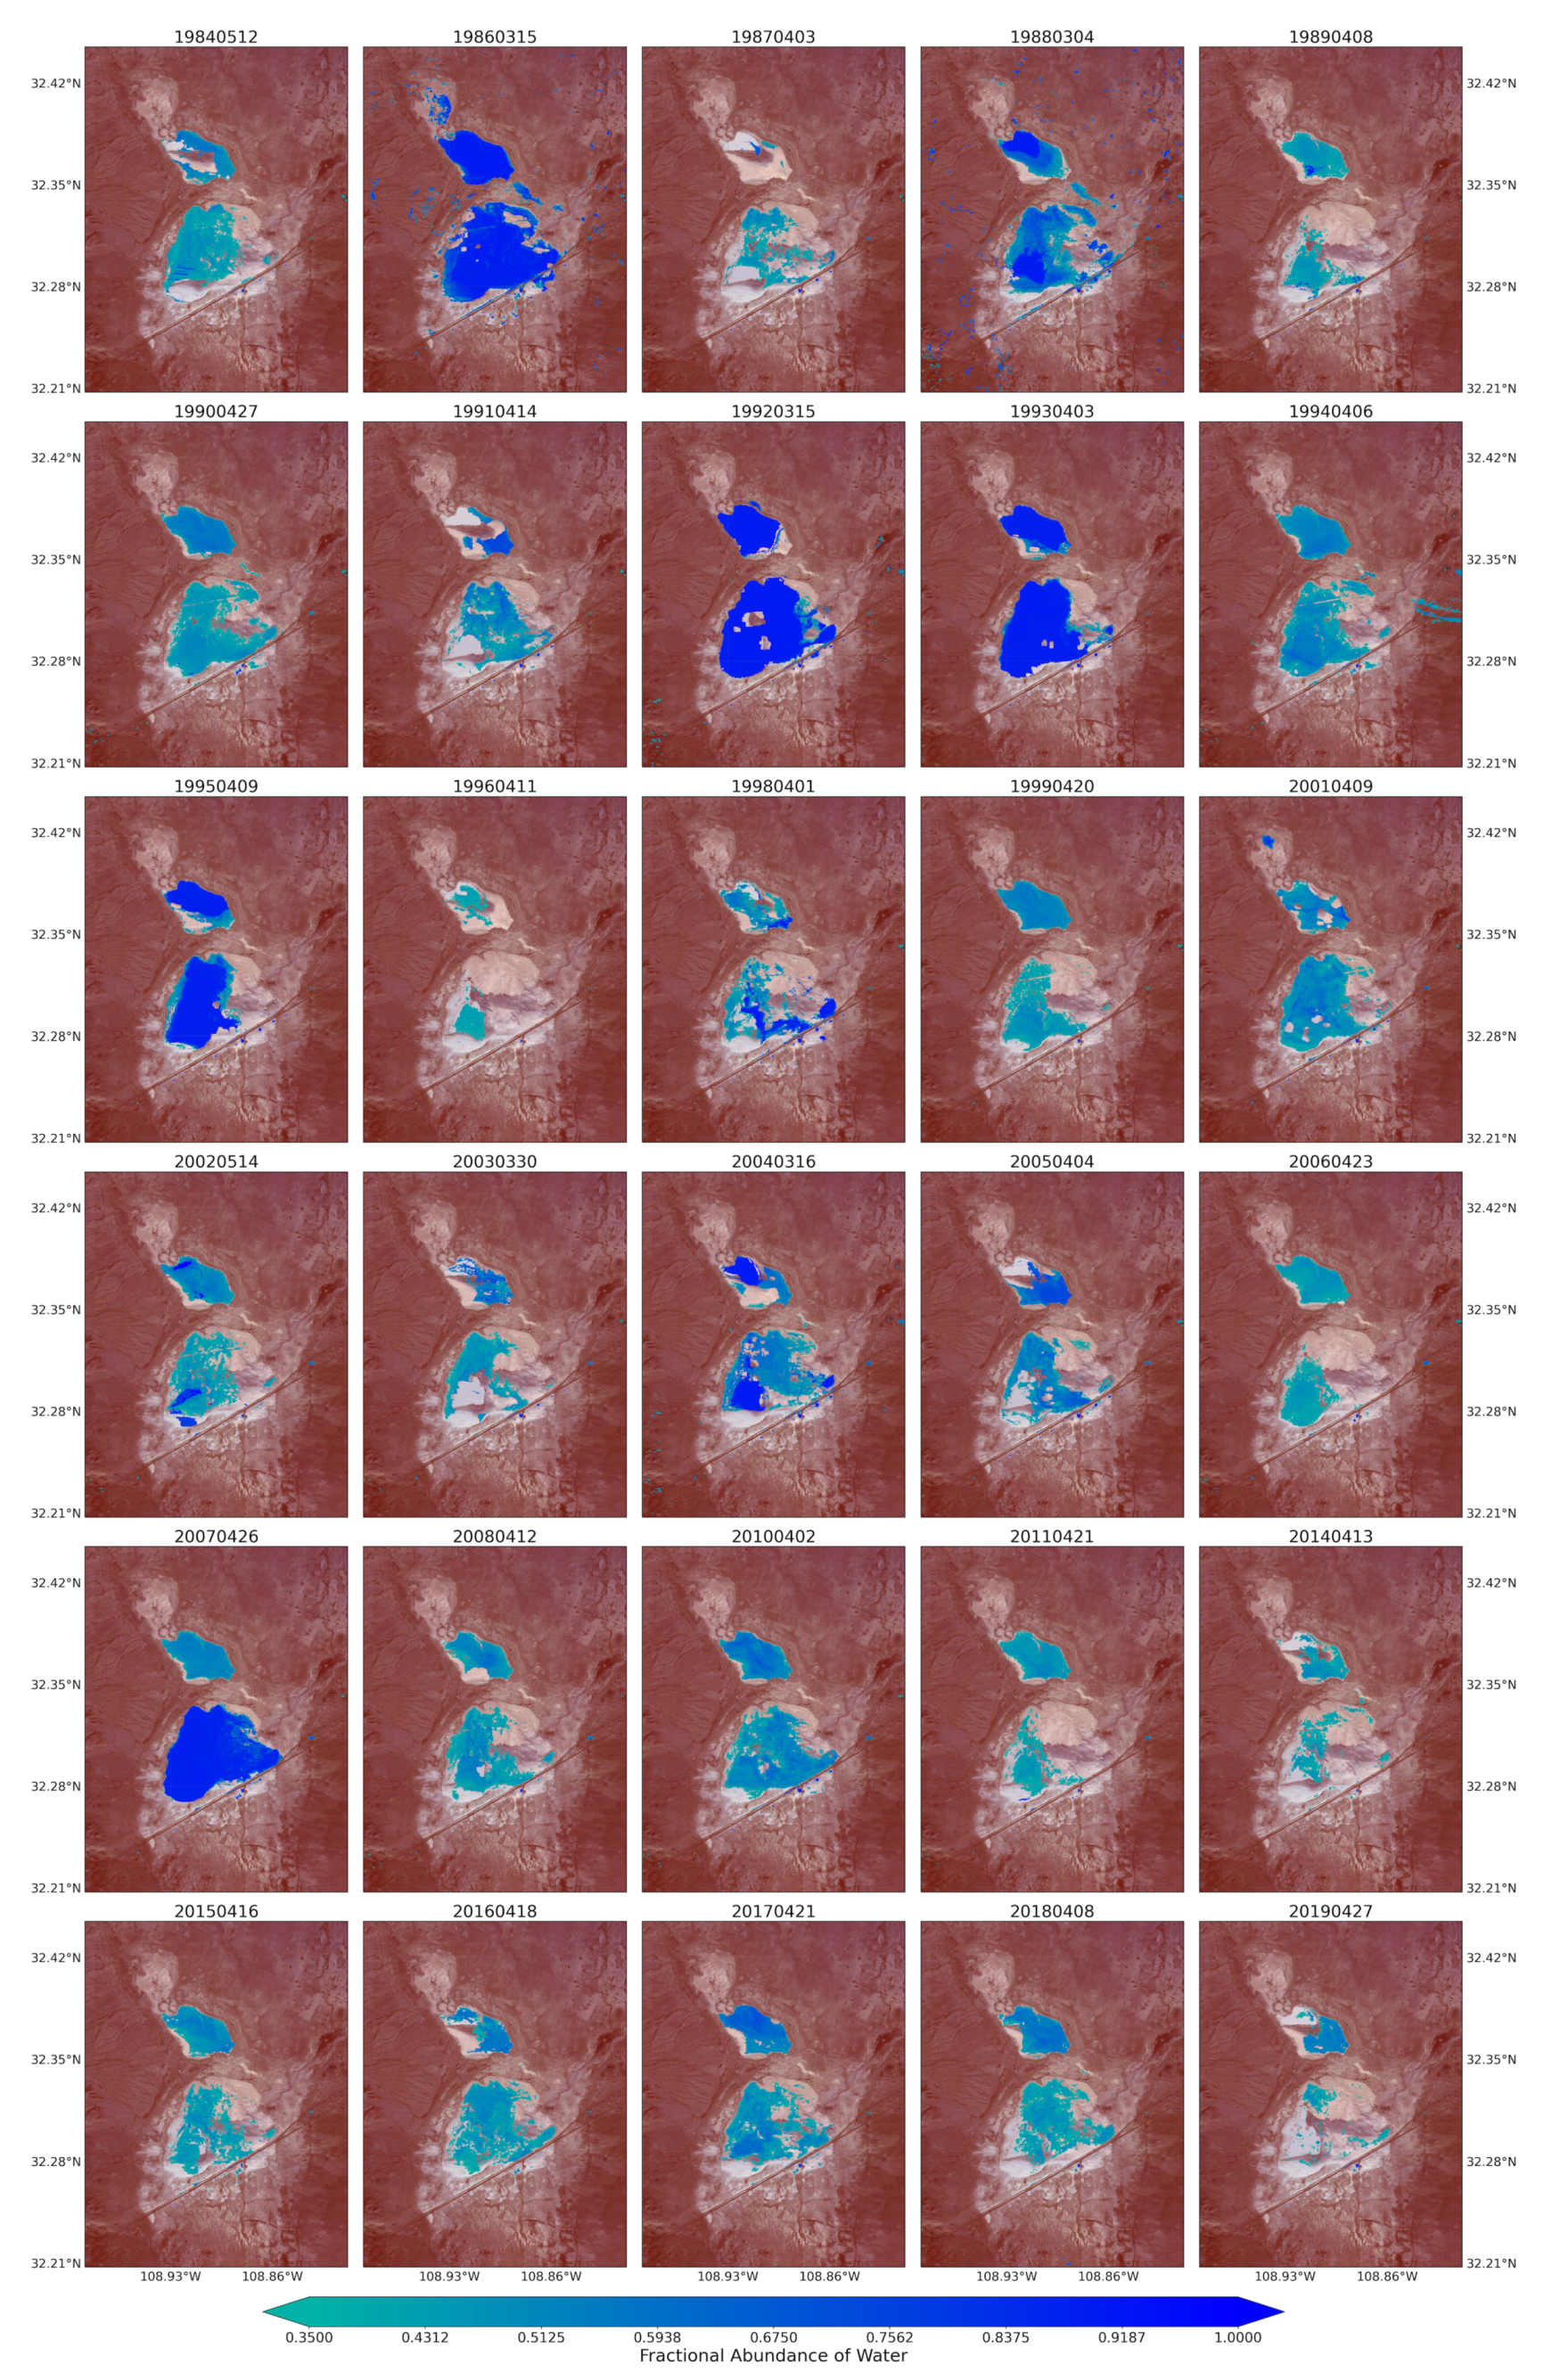
In order to estimate the areal extent of the flooded water in the playa, we applied the water flagging approach. The pixels were flagged as water when the fractional abundance threshold of water endmember was ≥ 0.35 [83]. For example, Du et al. [84] showed that the maximum water mapping threshold was between 0.35 and 0.4. Furthermore, we also used the Canny edge detection algorithm to locate the edge of playa’s water body due to direct rainfall and runoff from its watershed. This analysis was also performed in Google Earth Engine, in which the output is an image with non-zero value indicating edges of the water body, and the magnitude of the value is the gradient magnitude. This digital image processing algorithm has been widely employed in different edge detection studies and compared with other algorithms Canny approach showed better performance [85].
4.2. Deformation and Displacement Estimation
Using the Synthetic Aperture Radar (SAR) images from Sentinel-1B satellite, we investigated the deformation and displacement of the Lordsburg Playa surface. The analysis involves two steps as depicted in the flowchart (Figure 4). The first step employs InSAR technique to measure the changes in land surface deformation using a pair of SAR images from Sentinel-1B satellite. This imaging technique measures the topography of te land surface, its changes over time, and changes in the detailed characteristics of the surface [86]. It exploits such changes by measuring the difference between the phase signals of the SAR images. All the analysis stages in this step were accomplished in Sentinel-1 Toolbox (S1TBX).
As a pre-processing stage, duplicate SAR images were first co-registered into a stack in order to properly align the pixels of the images. Then, interferogram phases were created by cross-multiplying the pre-event image with complex conjugate of the post-event image. In order to perform interferometric processing, we used two pairs of images covering the Lordsburg Playa acquired at different satellite over pass times. One pair of images consisted of one pre-event image from 24 July 2017 and one post-event image from 5 August 2017, bracketing a wet monsoon day of 1 August 2017. Another pair of images represented a dry spring day of 14 March 2017 and a wet summer monsoon day of 5 August 2017. Following that, the noise introduced by the previous stage was minimized by applying multi-looking and phase filtering techniques. Finally, the processed images were geocoded (projected into a geographic coordinate system) and exported using a preferable file format. In the second step, using the SNAPHU algorithm [87], the generated interferogram phase images were unwrapped to extract displacement.
5. Results
5.1. Fractional Abundance of the Endmembers
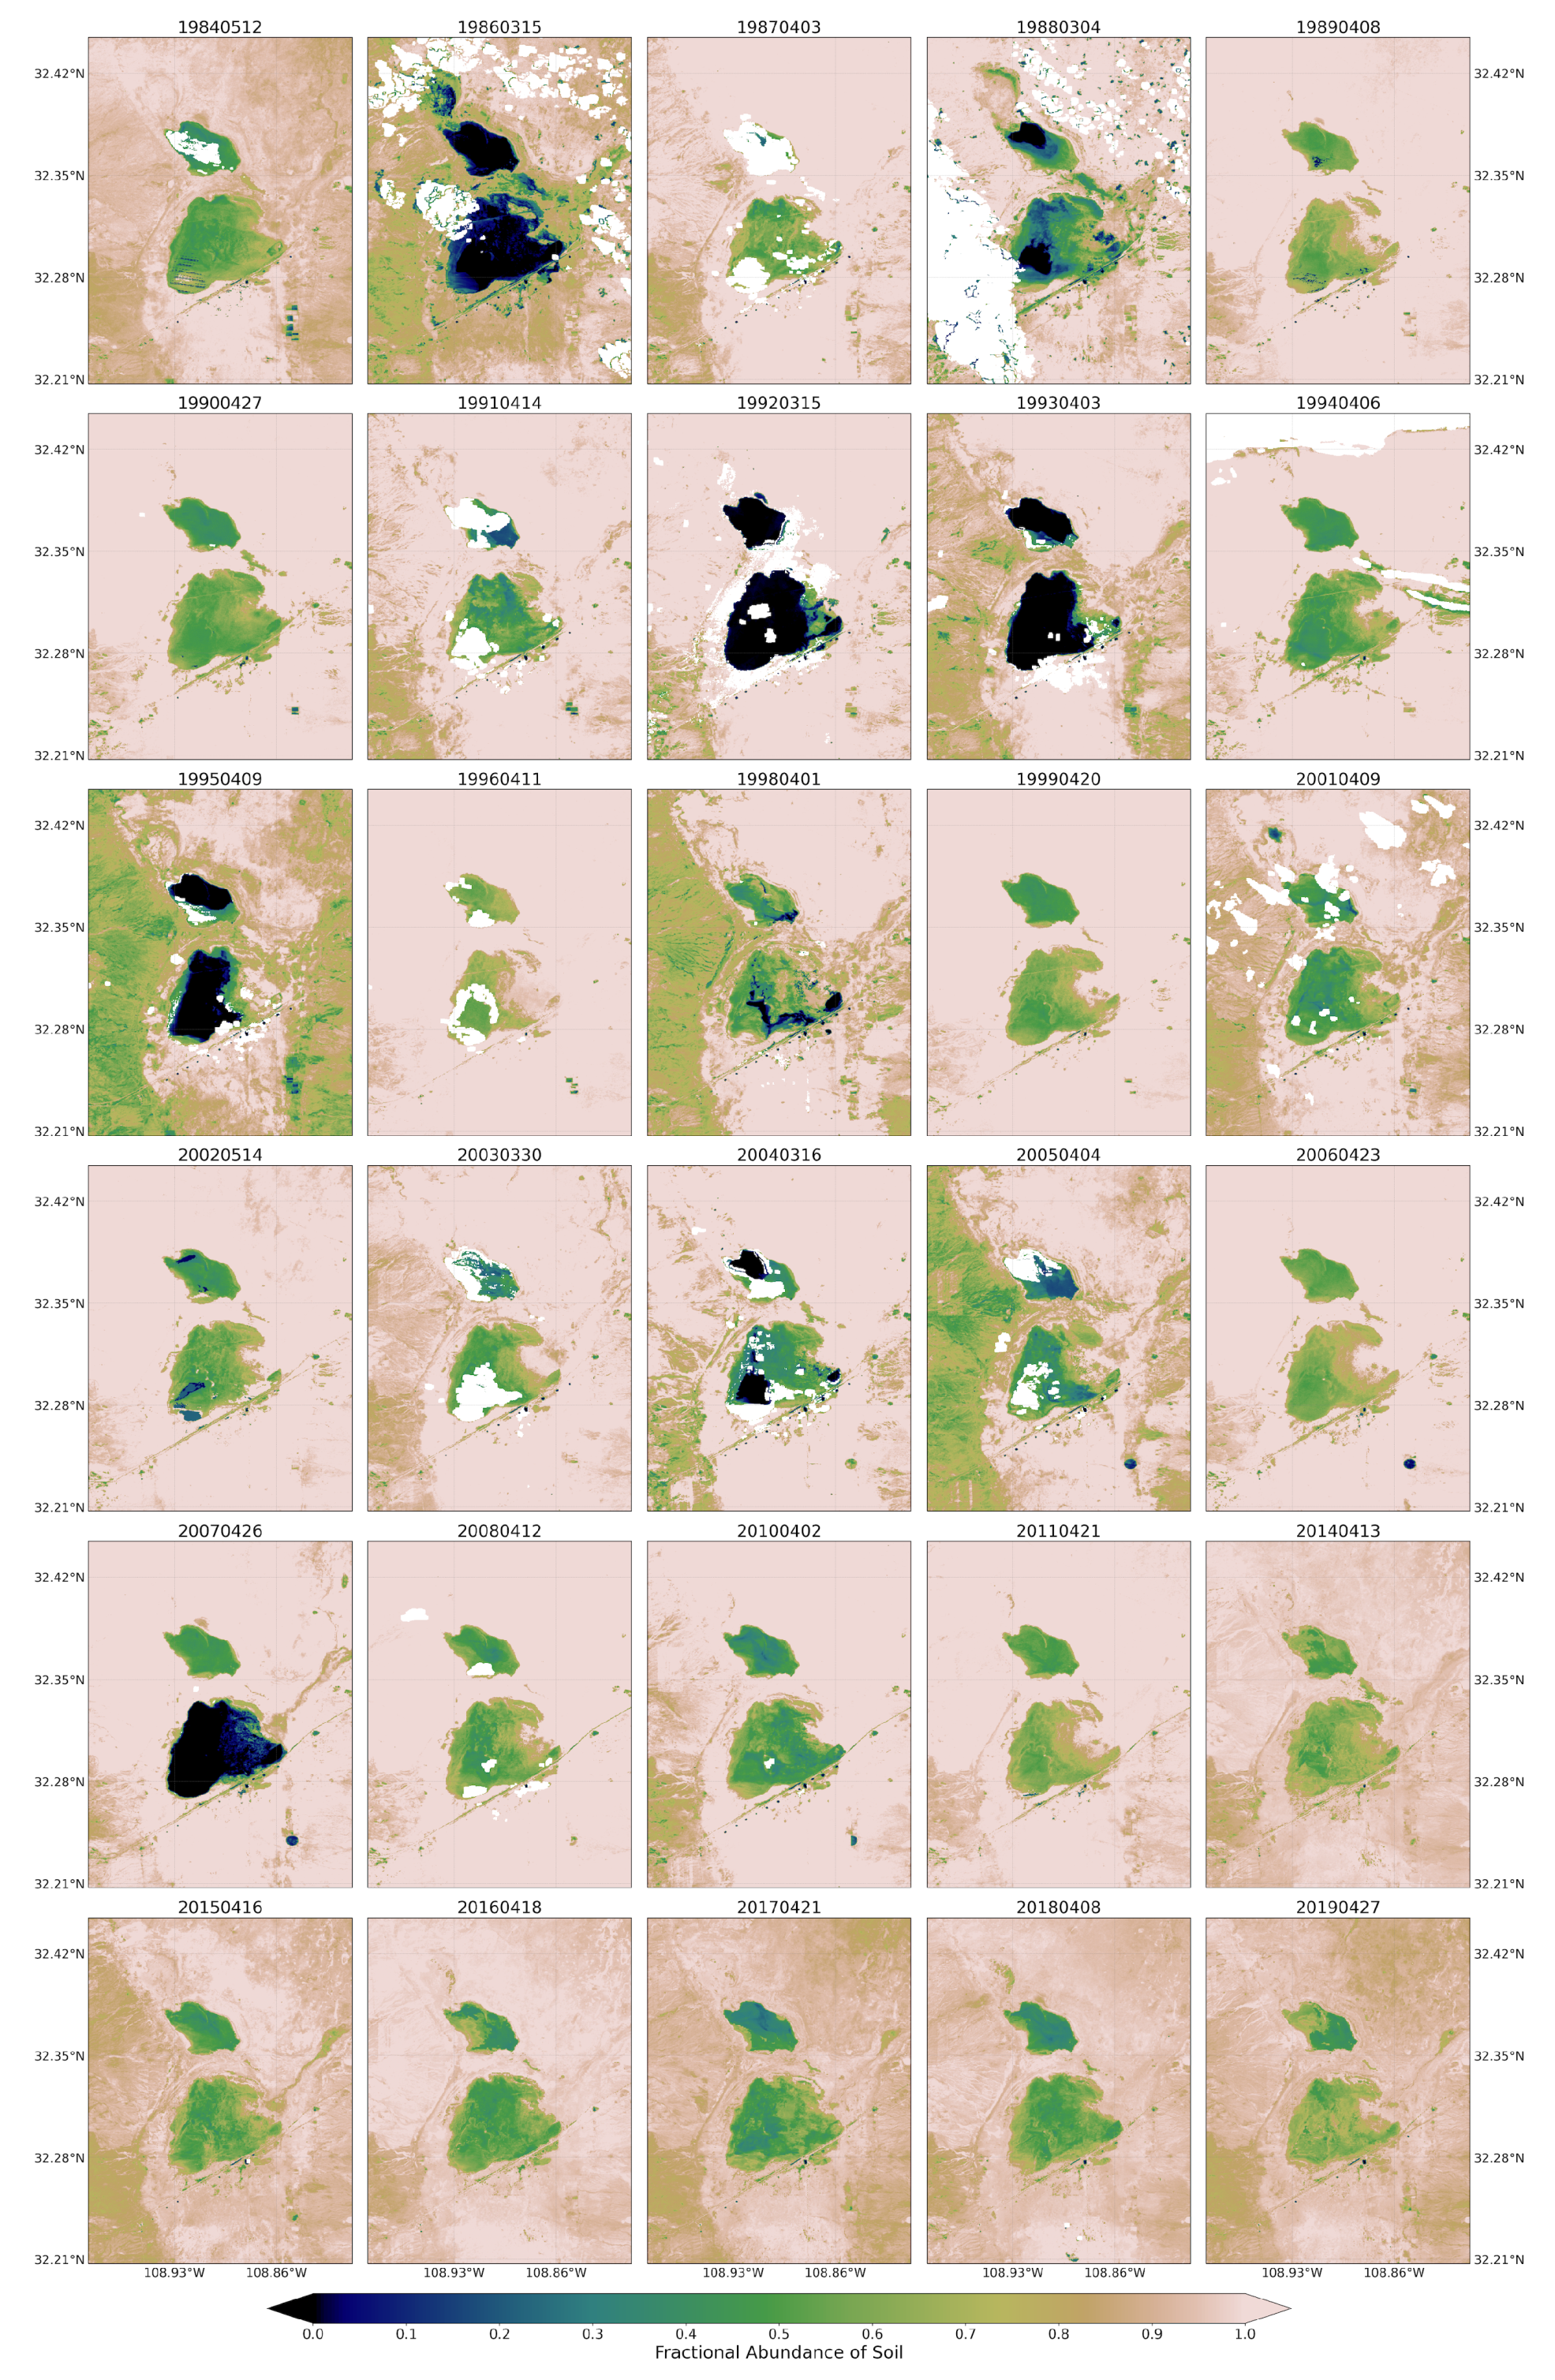
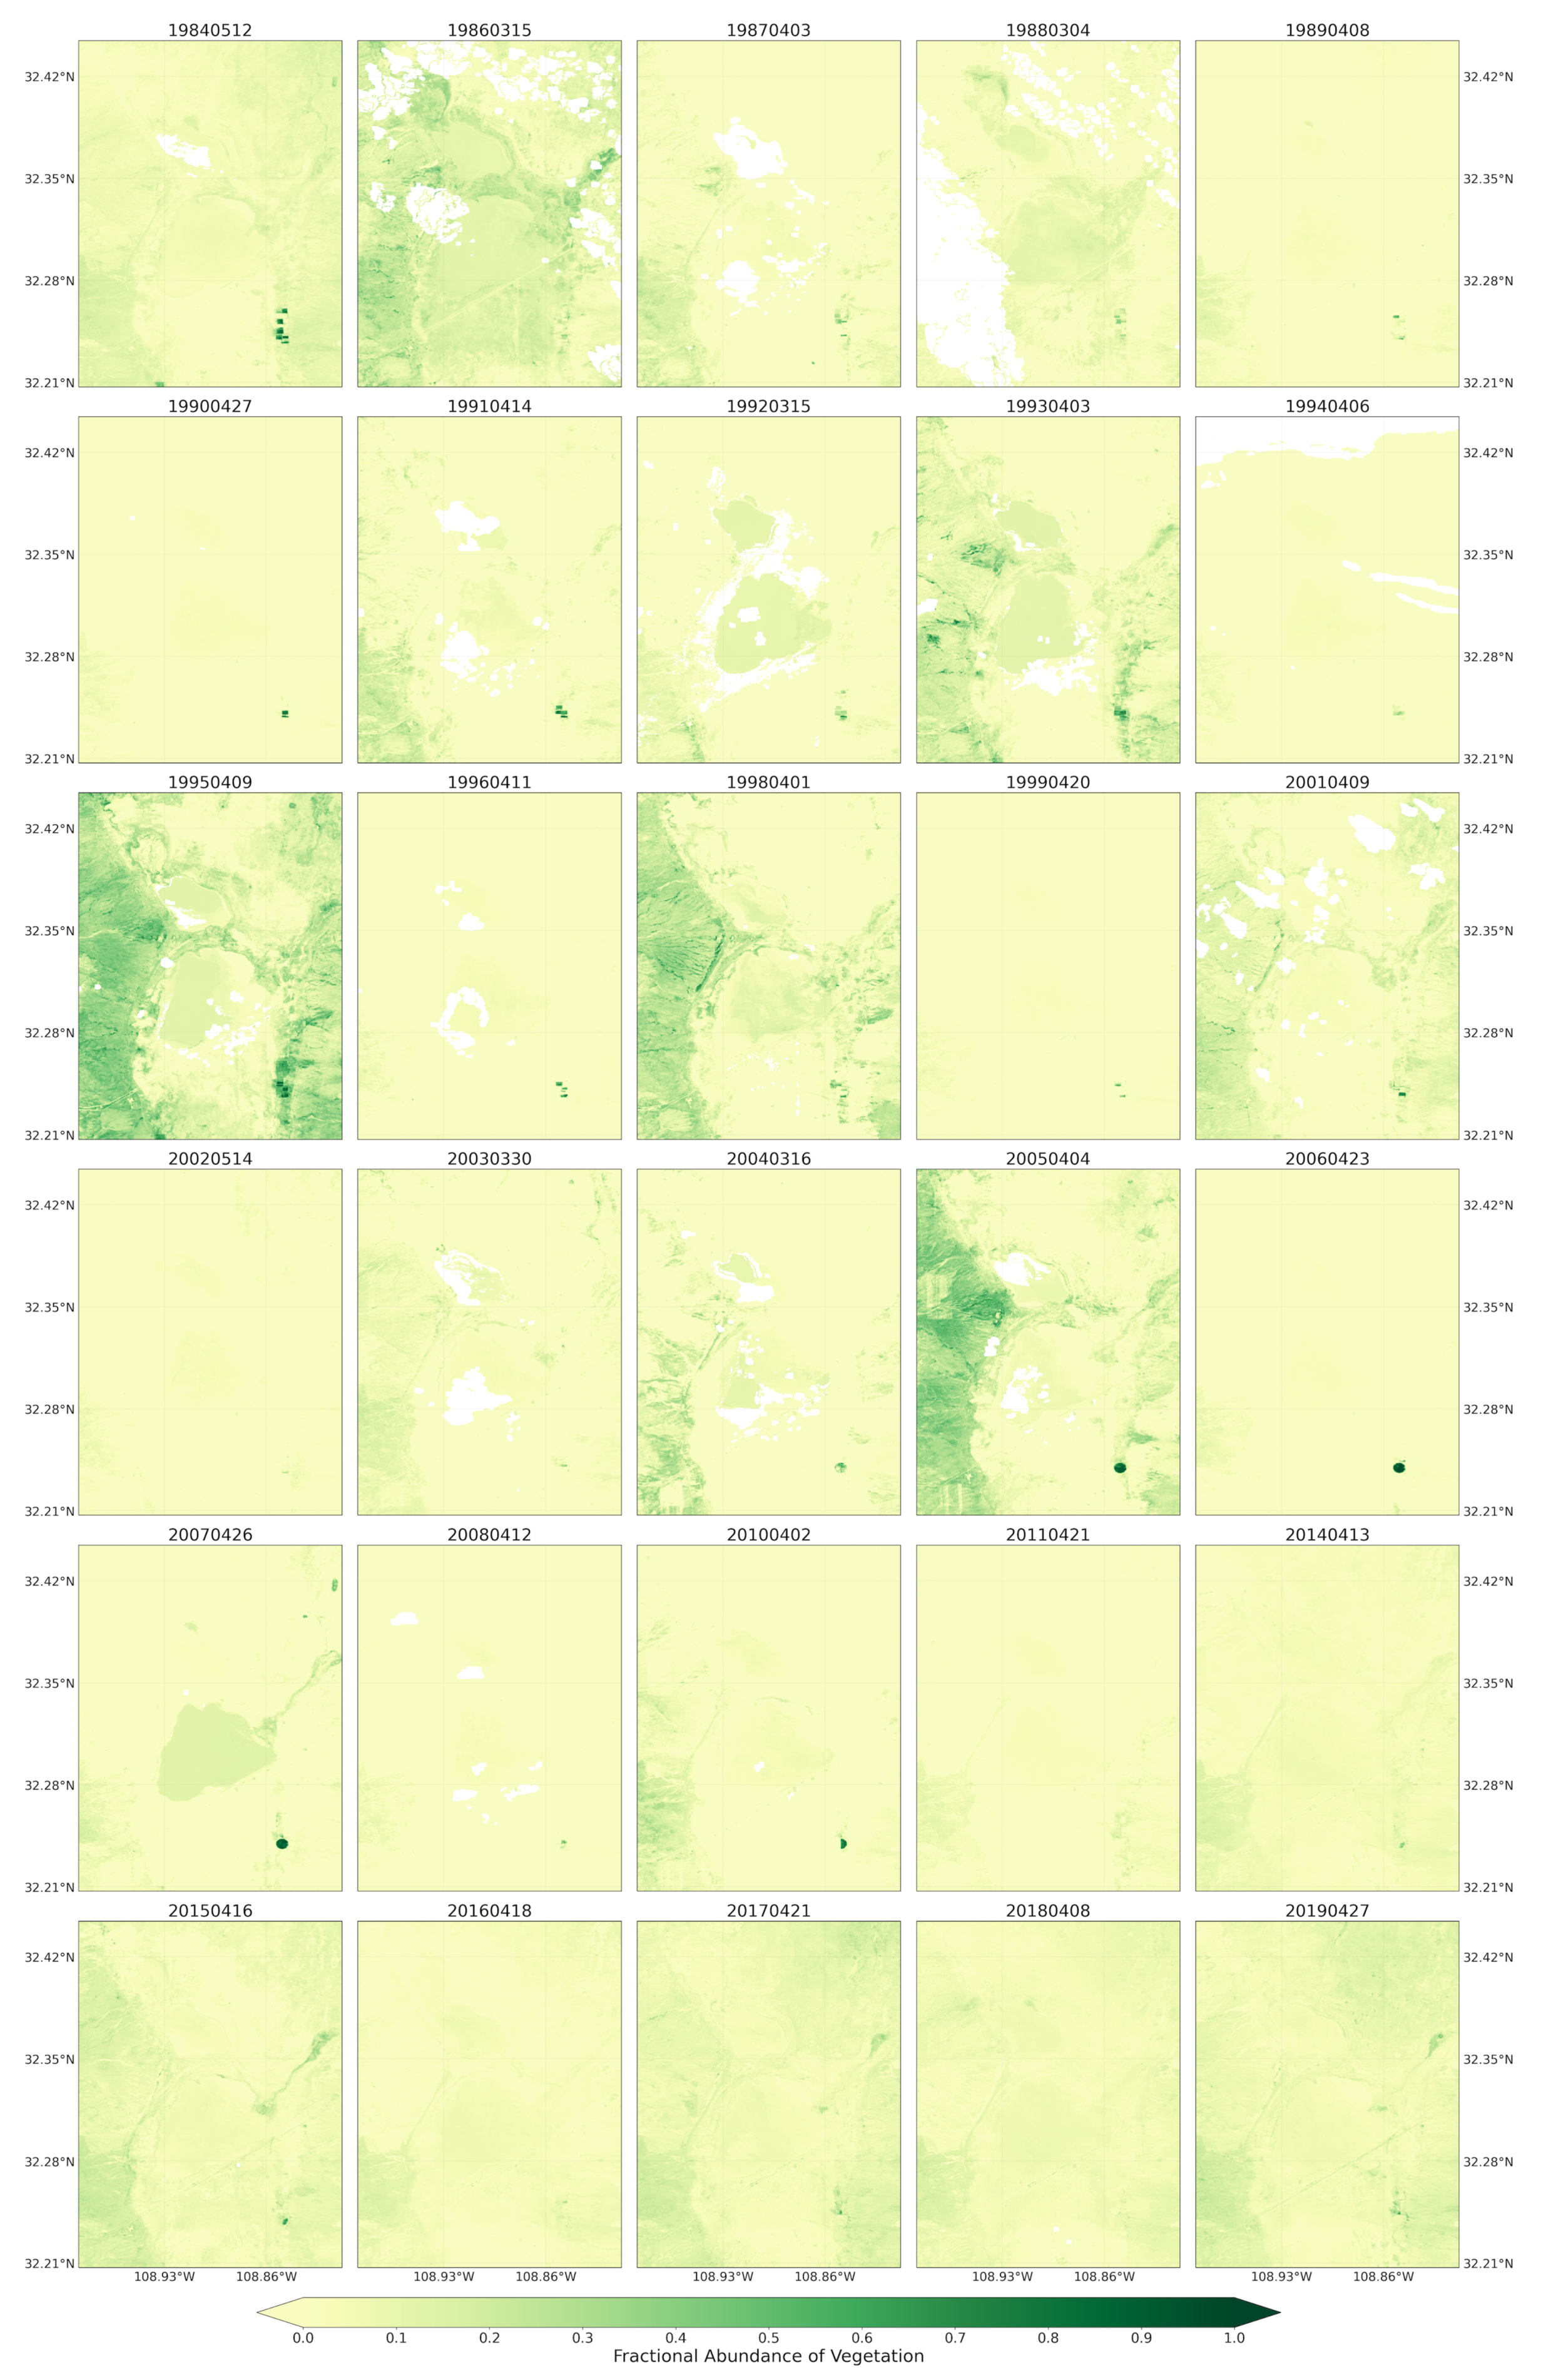
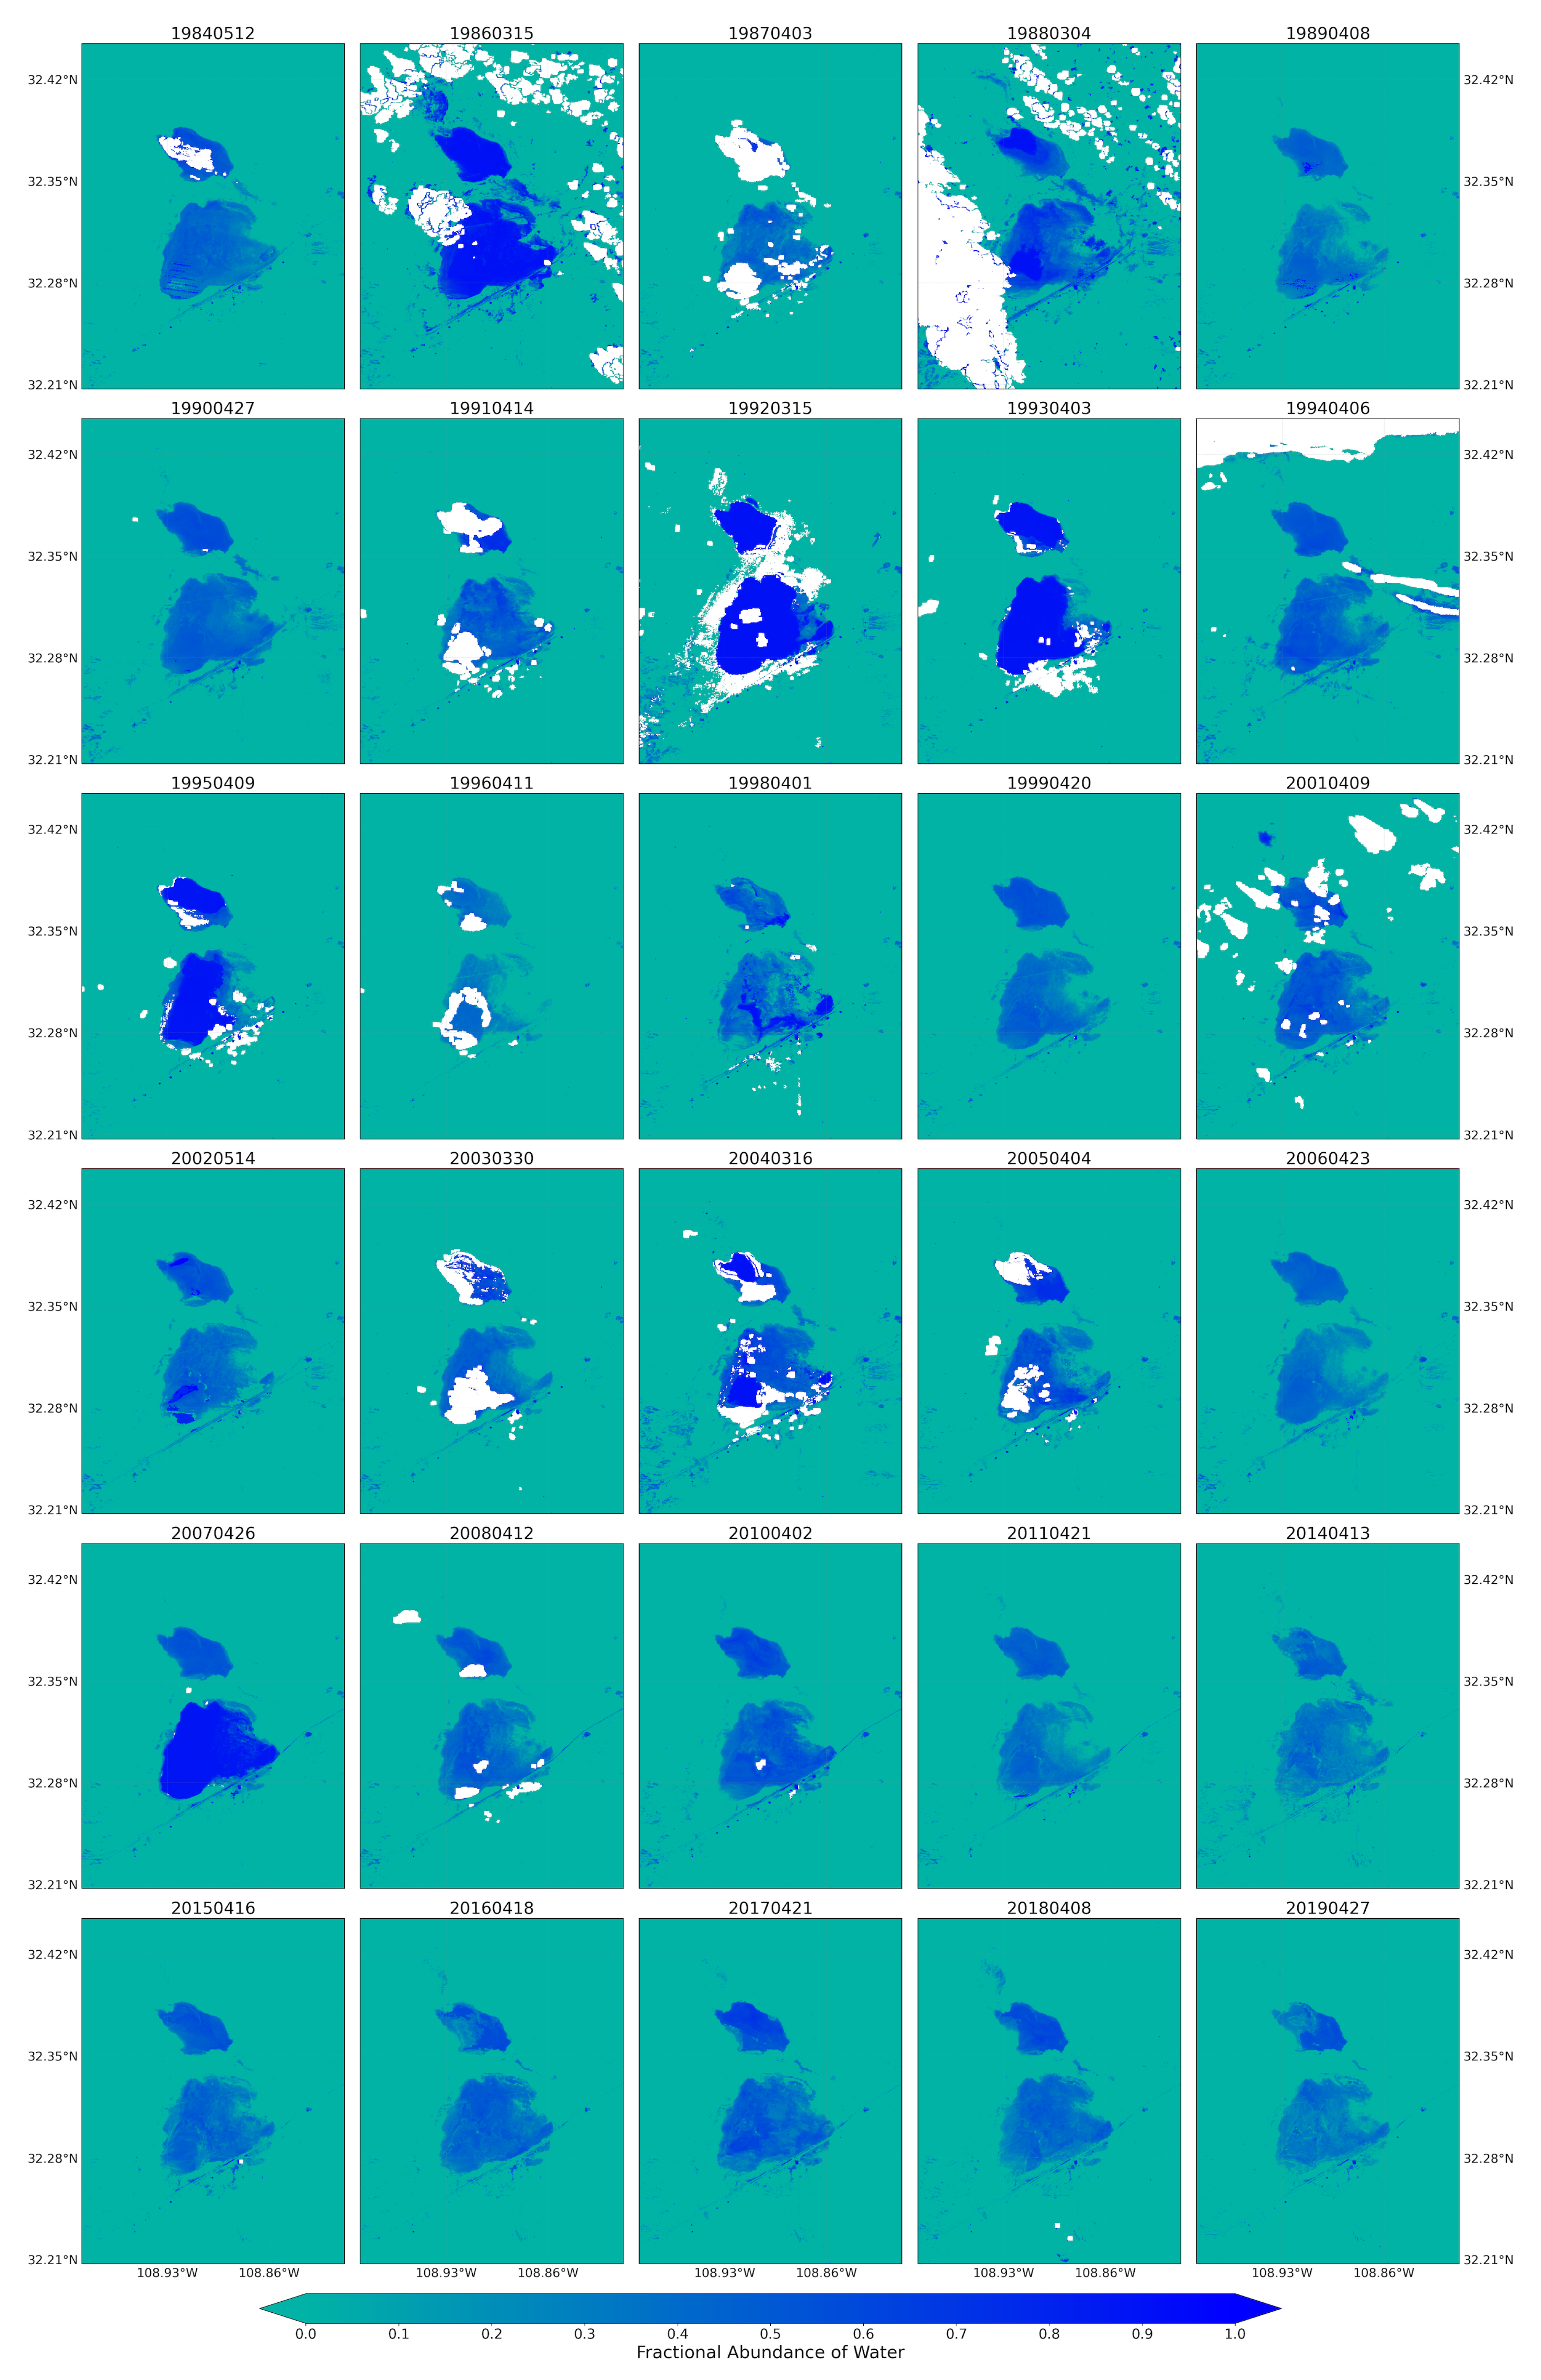
The maps for the fractional abundance of soil, vegetation, and water endmembers are presented in Figure 5, Figure 6 and Figure 7, respectively. These maps provided a means to discern surface cover proportions of each pixel. The maps captured the natural distribution of the land cover across the playa. These fractions were retrieved from Landsat 5 and 8 remotely sensed satellite images using linear spectral unmixing approach for the spring seasons of 1984 to 2019. Similar outputs for the summer/fall seasons from the Landsat images (Figure A1, Figure A2, Figure A3), and monthly maps of 2019 from Sentinel-2 images (Figure A4, Figure A5, Figure A6) are provided in the Appendix A.
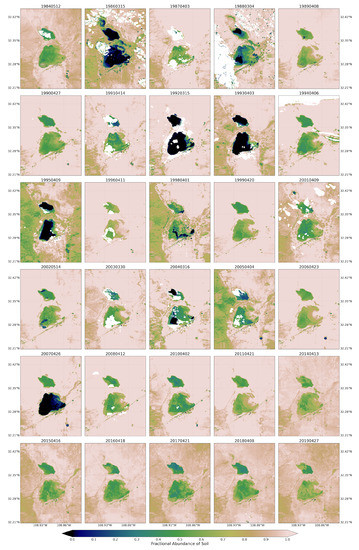
Figure 5.
Fractional abundance of soil endmember retrieved from Landsat 5 and 8 for spring season extending from 1984 to 2019.
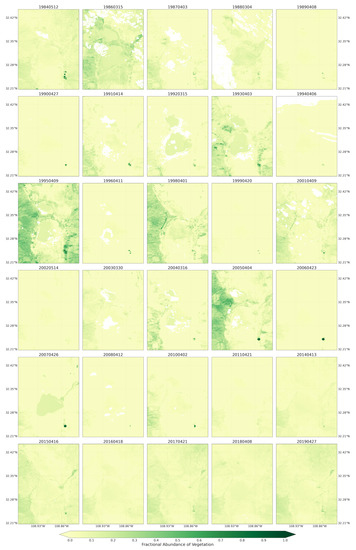
Figure 6.
Fractional abundance of vegetation endmember retrieved from Landsat 5 and 8 for spring season extending from 1984 to 2019.
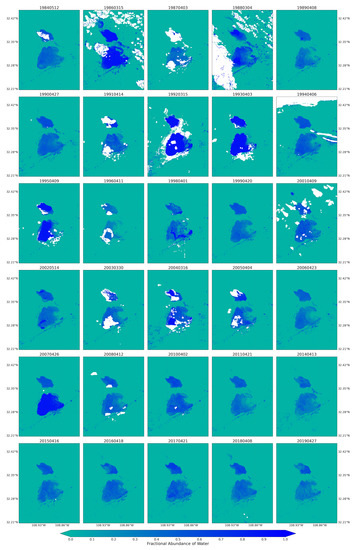
Figure 7.
Fractional abundance of water endmember retrieved from Landsat 5 and 8 for spring season extending from 1984 to 2019.
For the soil endmember map (Figure 5), the light brown areas represent higher fractions, and deep blue areas represent lower fractions of soil cover. White color indicates masked pixels due to cloud obstruction. The playa areas were dominated by highest fractions of soil endmembers during spring in the majority of years. This suggests that during these years, large parts of the playa surfaces, including the edge of the playa and its surroundings, could be exposed to wind erosion. For example, in spring 2011, a year with high number of traffic crashes due to dust emissions [69], the playa pixels were dominated by the highest fractions of soil endmember. Low fractions of soil were mainly exhibited in the inner and low-lying parts of the playa for a few years, primarily influenced by hydrological processes (monsoon inundations) during a current season and/or accumulated from the preceding seasons. In 2015 to 2019, soil cover in the majority of pixels exhibited a decrease in soil fractions. This decrease in exposed soil surface could contribute to the decrease in the number of traffic accidents in those years associated with a reduction in dust events on the playa [69]. On the other hand, summer/fall seasons experienced a decrease in the fractions of soil endmember across all years as compared to corresponding spring seasons. This is due to rainfall input to the hydrological system of the playa during the North American monsoon.
Vegetation endmember retrieved from the Landsat 5 and 8 images, in contrast to soil endmember, contributed low fractions to pixel mixtures across the playa and throughout the majority of spring seasons (Figure 6). Only the spring seasons from 1995, 1998, and 2005 experienced the highest fractions of vegetation cover. Those pixels with highest vegetation fractions were from the uplands bounding the playa on the west and east. For 1998 and 2005, the pixels were only from the Peloncillo Mountains to the west. Thus, during the majority of the years, the playa surfaces were not covered by active vegetation, potentially exposing the surface to wind erosion. In summer/fall seasons, the proportion of vegetation endmembers in the pixel mixtures were highest, giving the playa surface and surrounding some protection against erosion (Figure A2). The 2019 monthly vegetation fraction developed from the Sentinel-2 images was lowest from May to August and highest in September and October (Figure A5). Although in this region July and August are the wettest monsoon months, the phase lag in the response of vegetation to rainfall input influenced the vegetation cover availability across the summer and fall months.
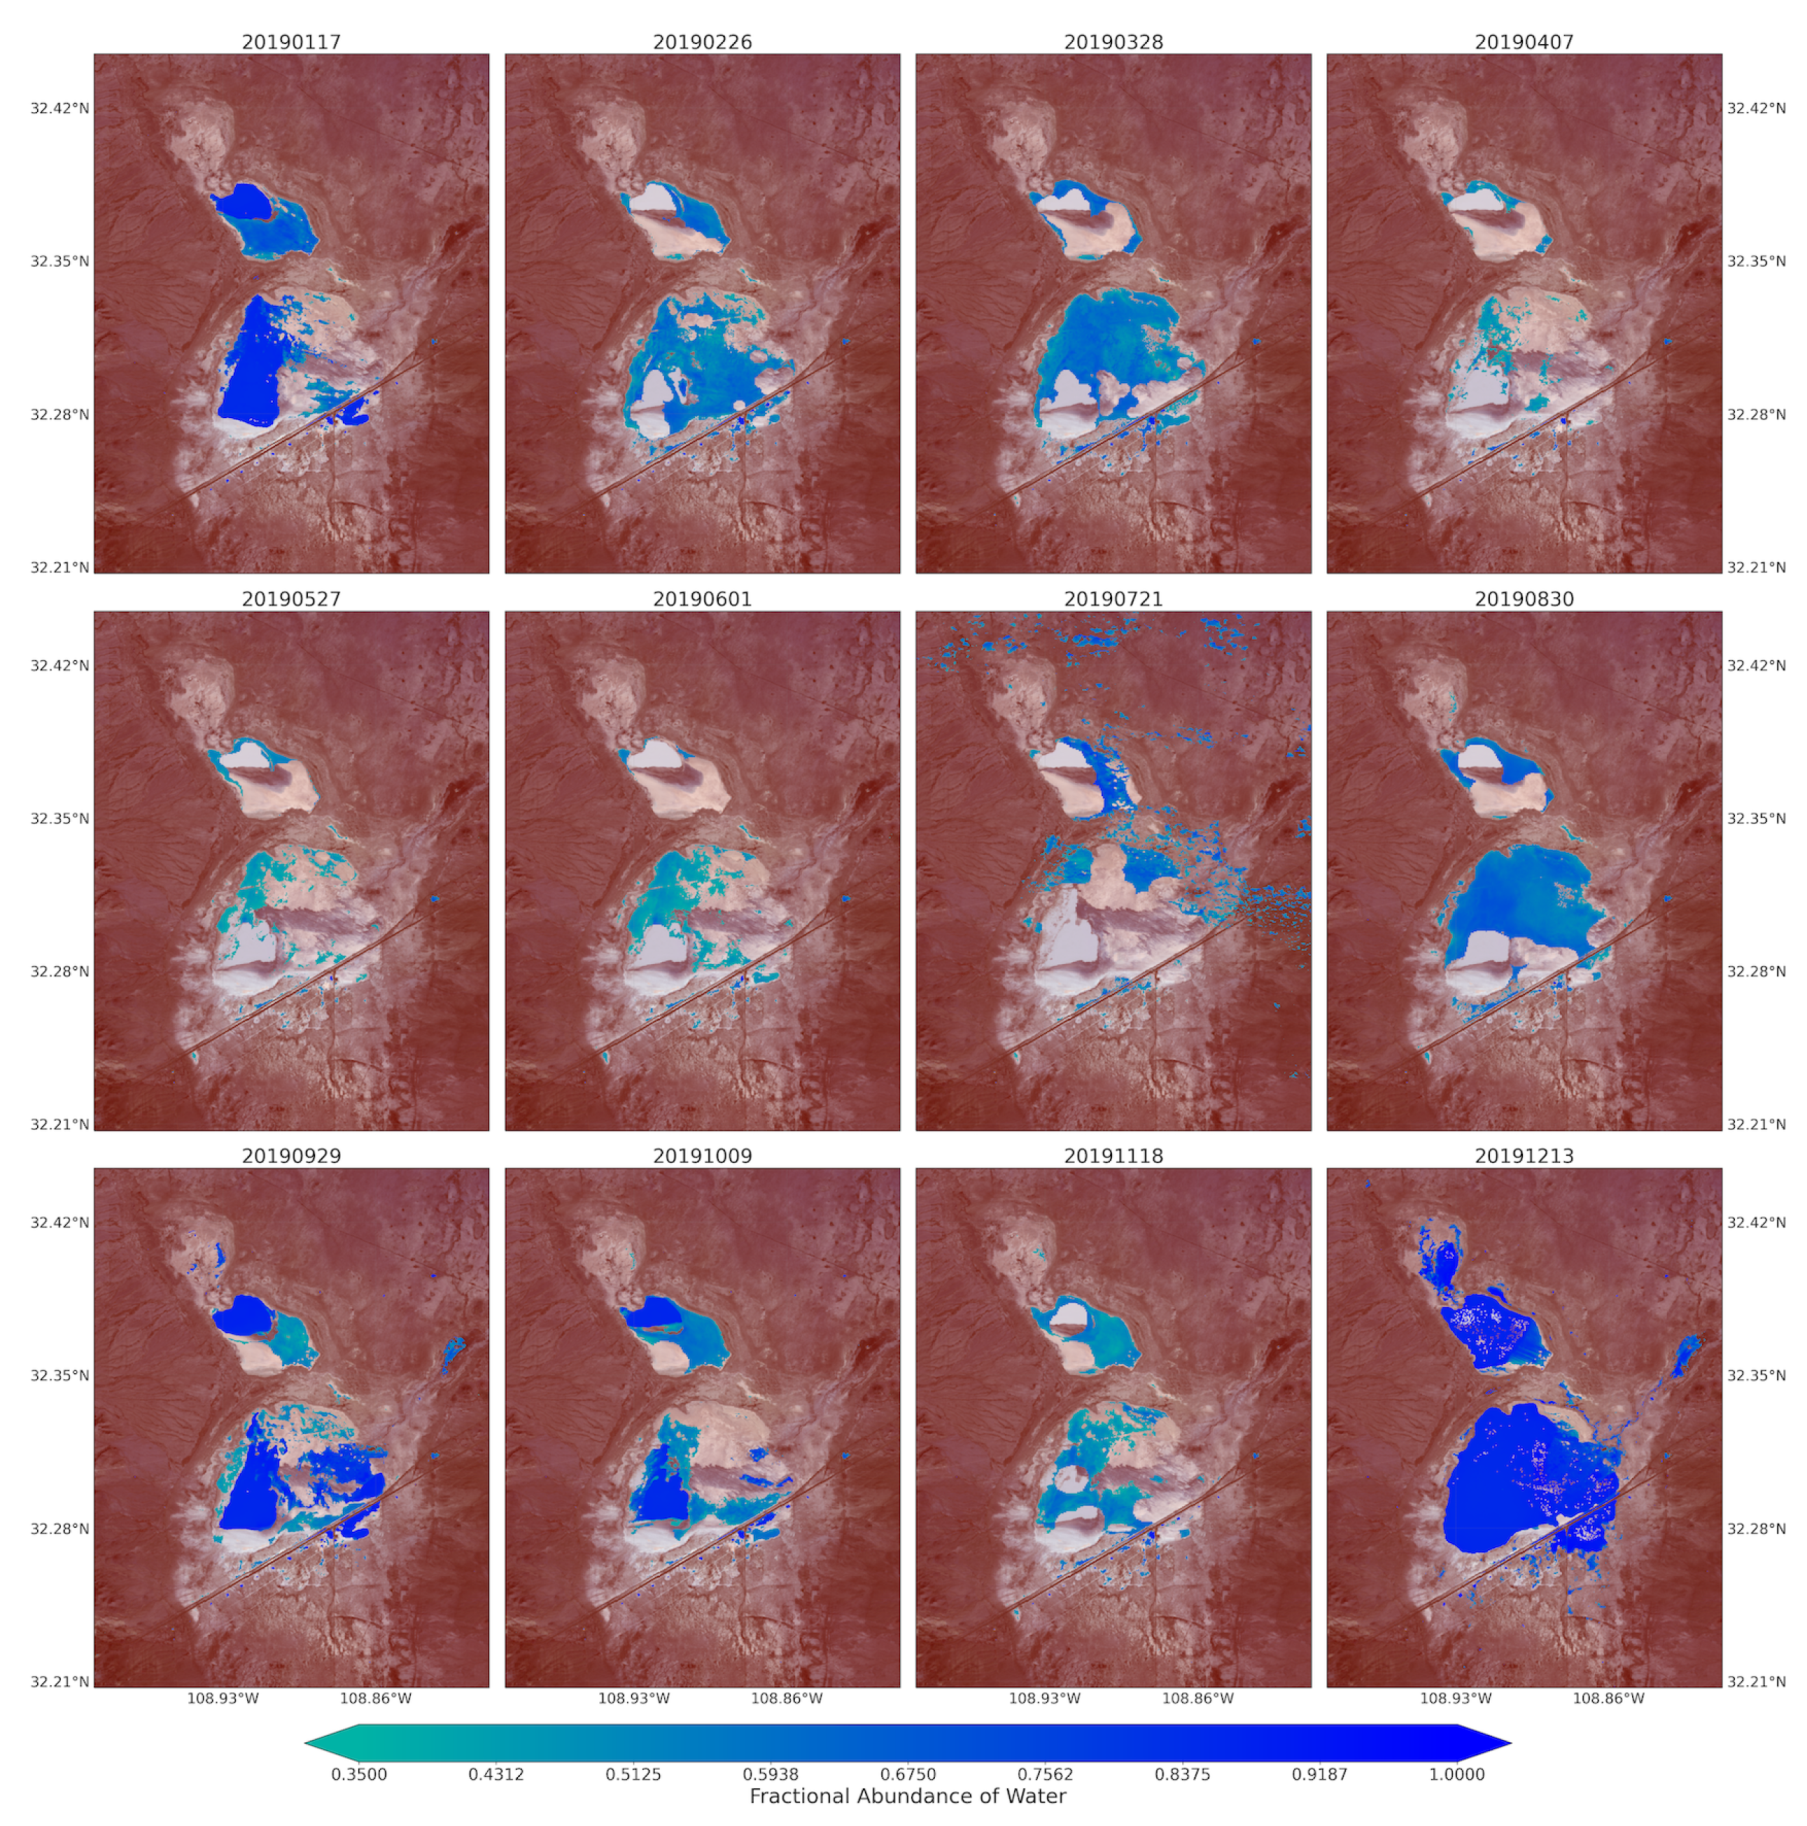
The fractional abundance of the water endmember for the spring seasons from the Landsat 5 and 8 images captured the playa’s water dominated pixels (Figure 7). The pixels from the inner and low-lying part of the playa showed higher fractions. The map was also able to successfully capture water-dominated pixels from the very small water bodies along the sides of the major transportation systems (ditches) from the spectral mixtures. Complementing these results, using the fractional abundance of water endmember as input, the areal extent of the flooded water within the playa was identified using the fractional abundance threshold of 0.35 (Figure 8). This approach aided the detection of very small, shallow, and turbid water bodies due to the coarse spatial resolution of the optical images used in this study. It would have been very difficult to detect these types of water bodies using the widely used spectral indices such as the Normalized Difference Water Index (NDWI) [53,88]. For example, Herndon et al. [53] documented the failure of NDWI to detect many smaller, more turbid water bodies in the study area of Tahoua Region of Niger. Supporting this finding, Acharya et al. [88] also pointed out that NDWI showed better results for only pure water pixels. In contrast, the highly seasonal water bodies in the Lordsburg Playa are shallow and turbid (Figure 1). The water bodies are usually created as a result of strong summer monsoon seasons and can sustain standing water until the following spring. Similarly, the maps from Landsat images for summer/fall seasons captured the flooding water with larger areal extent compared with those from spring seasons (Figure A3). The 2019 monthly fractional abundance maps from the Sentinel-2 images provided similar results to the Landsat image (Figure A6), although the corruption of the maps by clouds was higher in Senintel-2 images. Thus, the linear spectral unmixing algorithm demonstrated its potential for extracting different surface properties from pixel spectral mixtures of optical images.
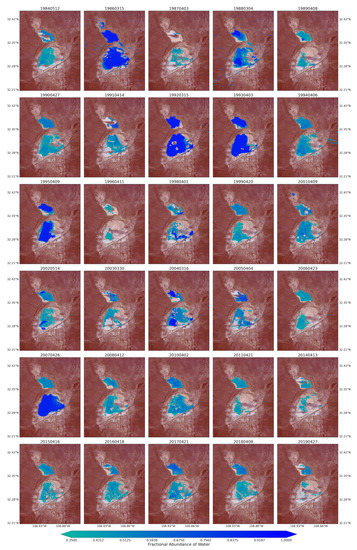
Figure 8.
Water coverage over the Lordsburg Playa processed from the fractional abundance of water that was retrieved from Landsat Images for spring season between 1984 and 2019.
5.2. Synthetic Aperture Radar (SAR) Images
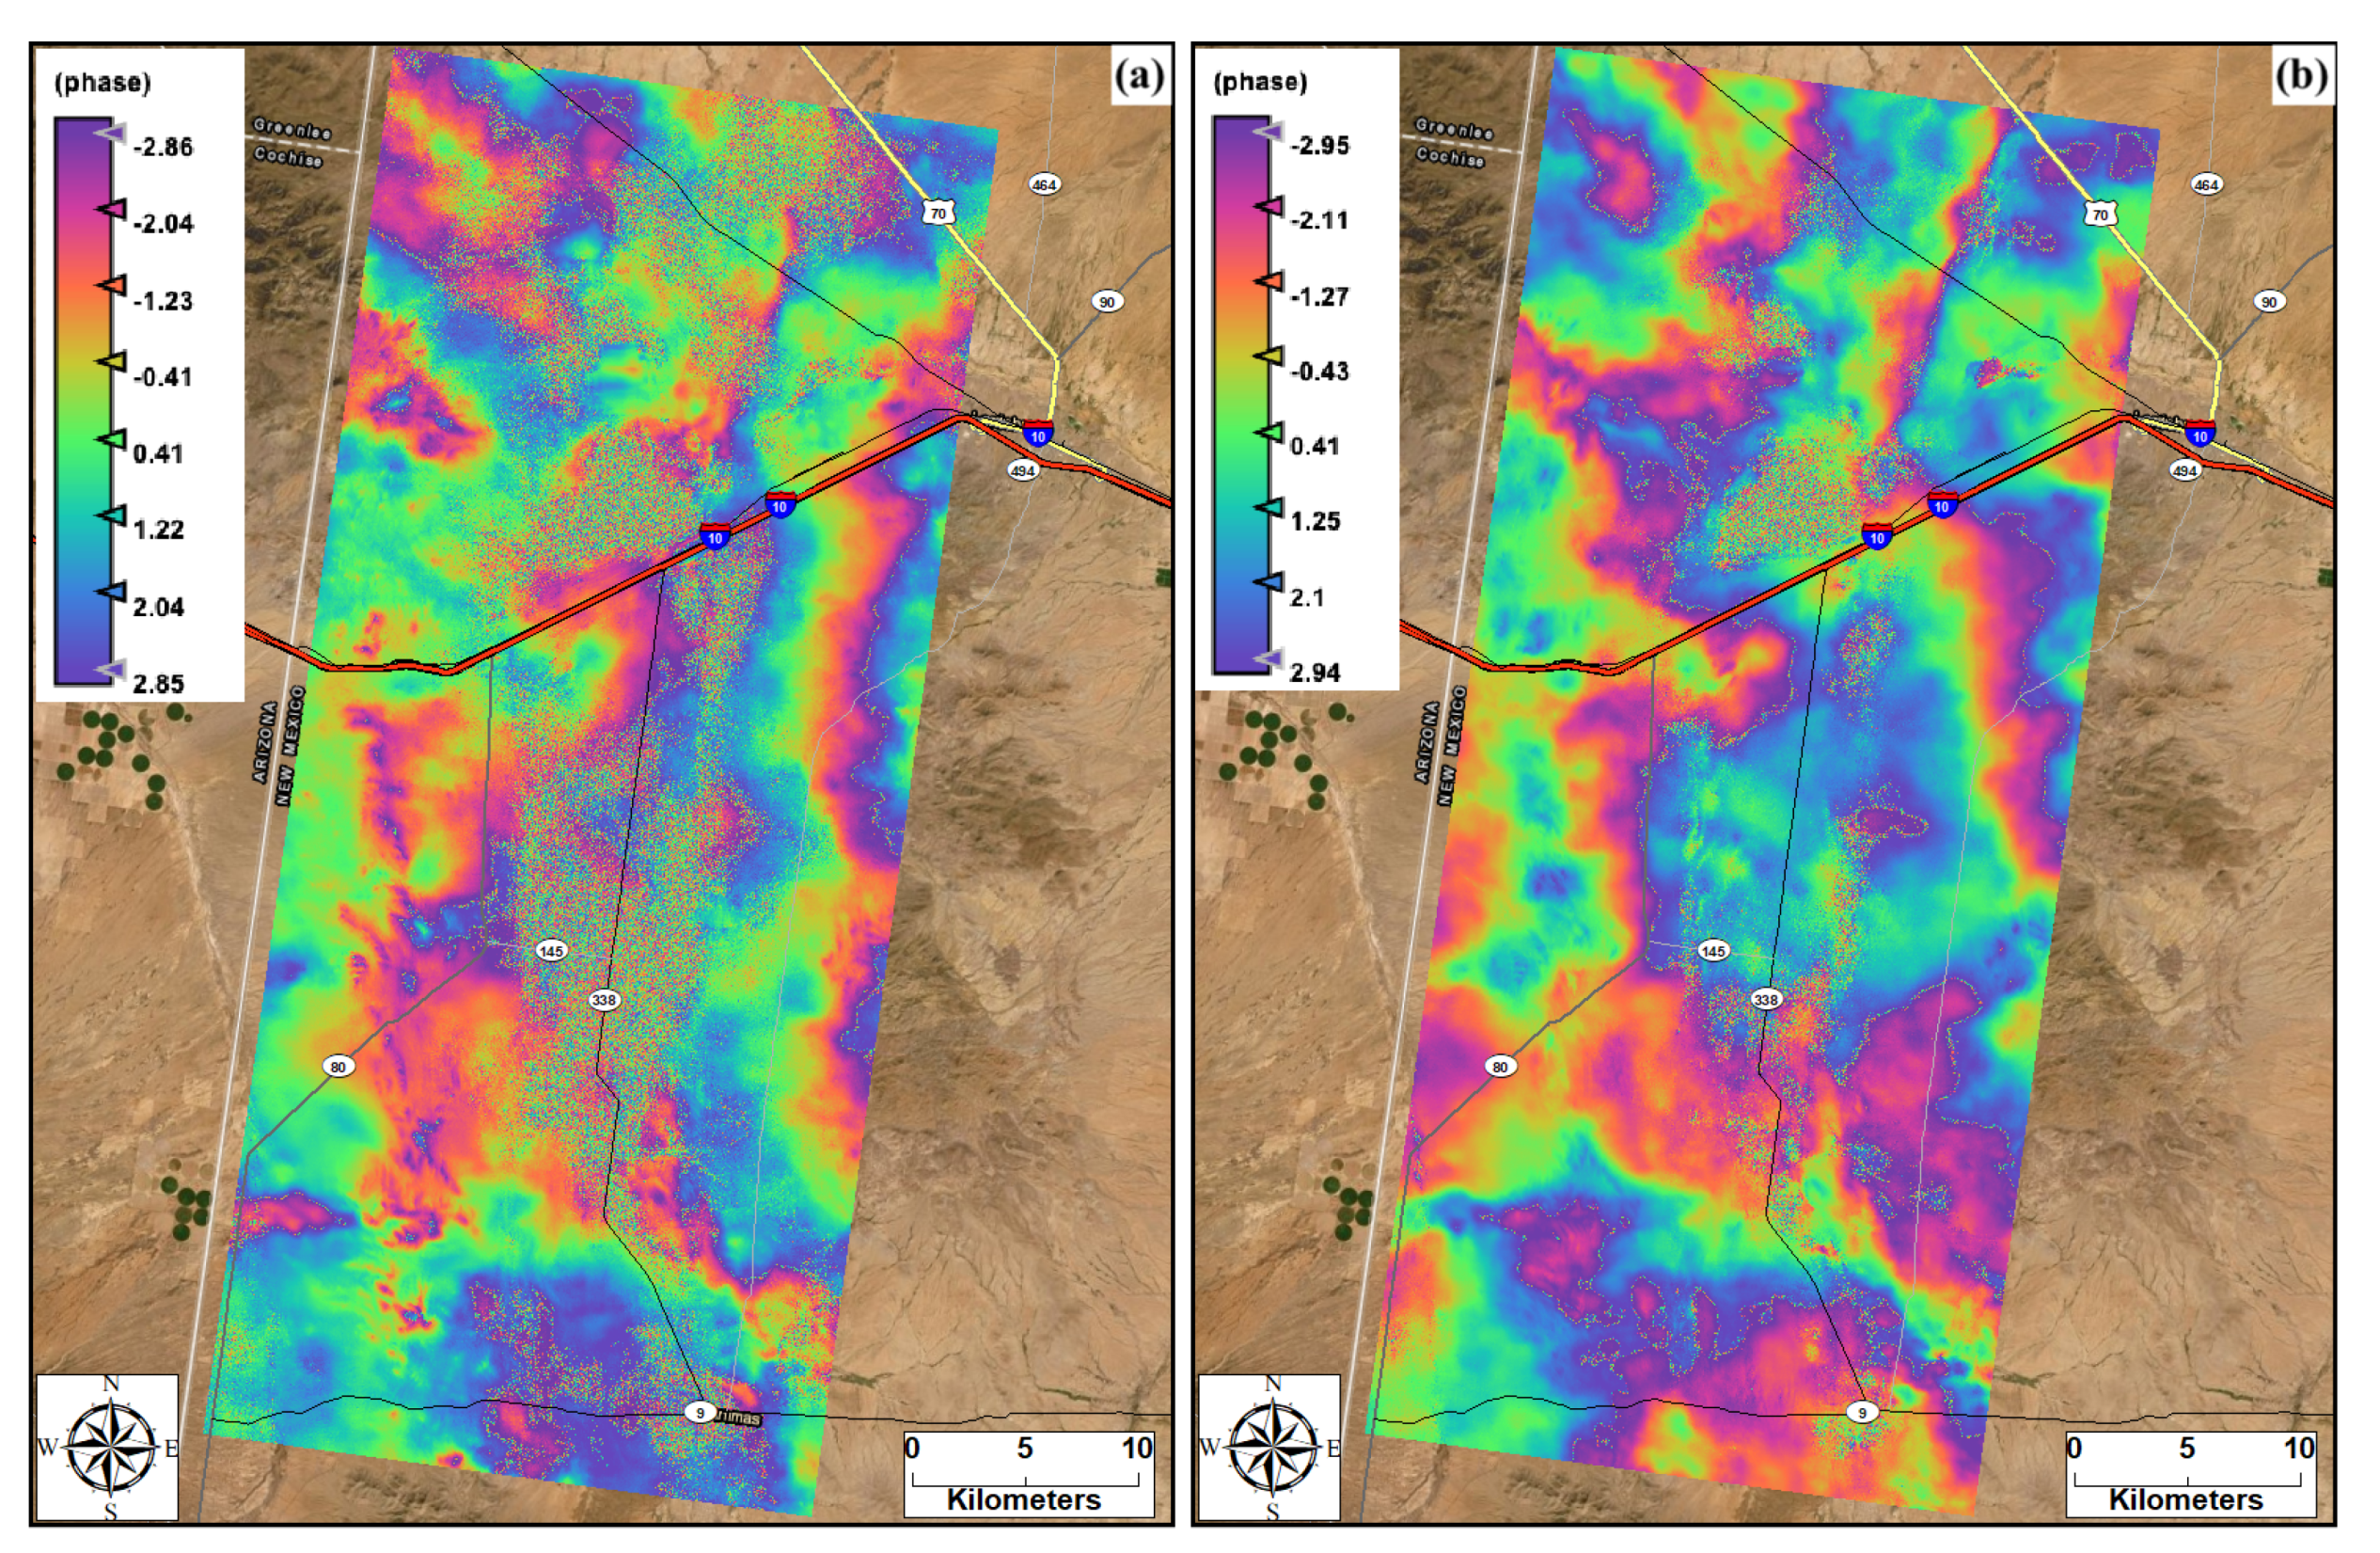
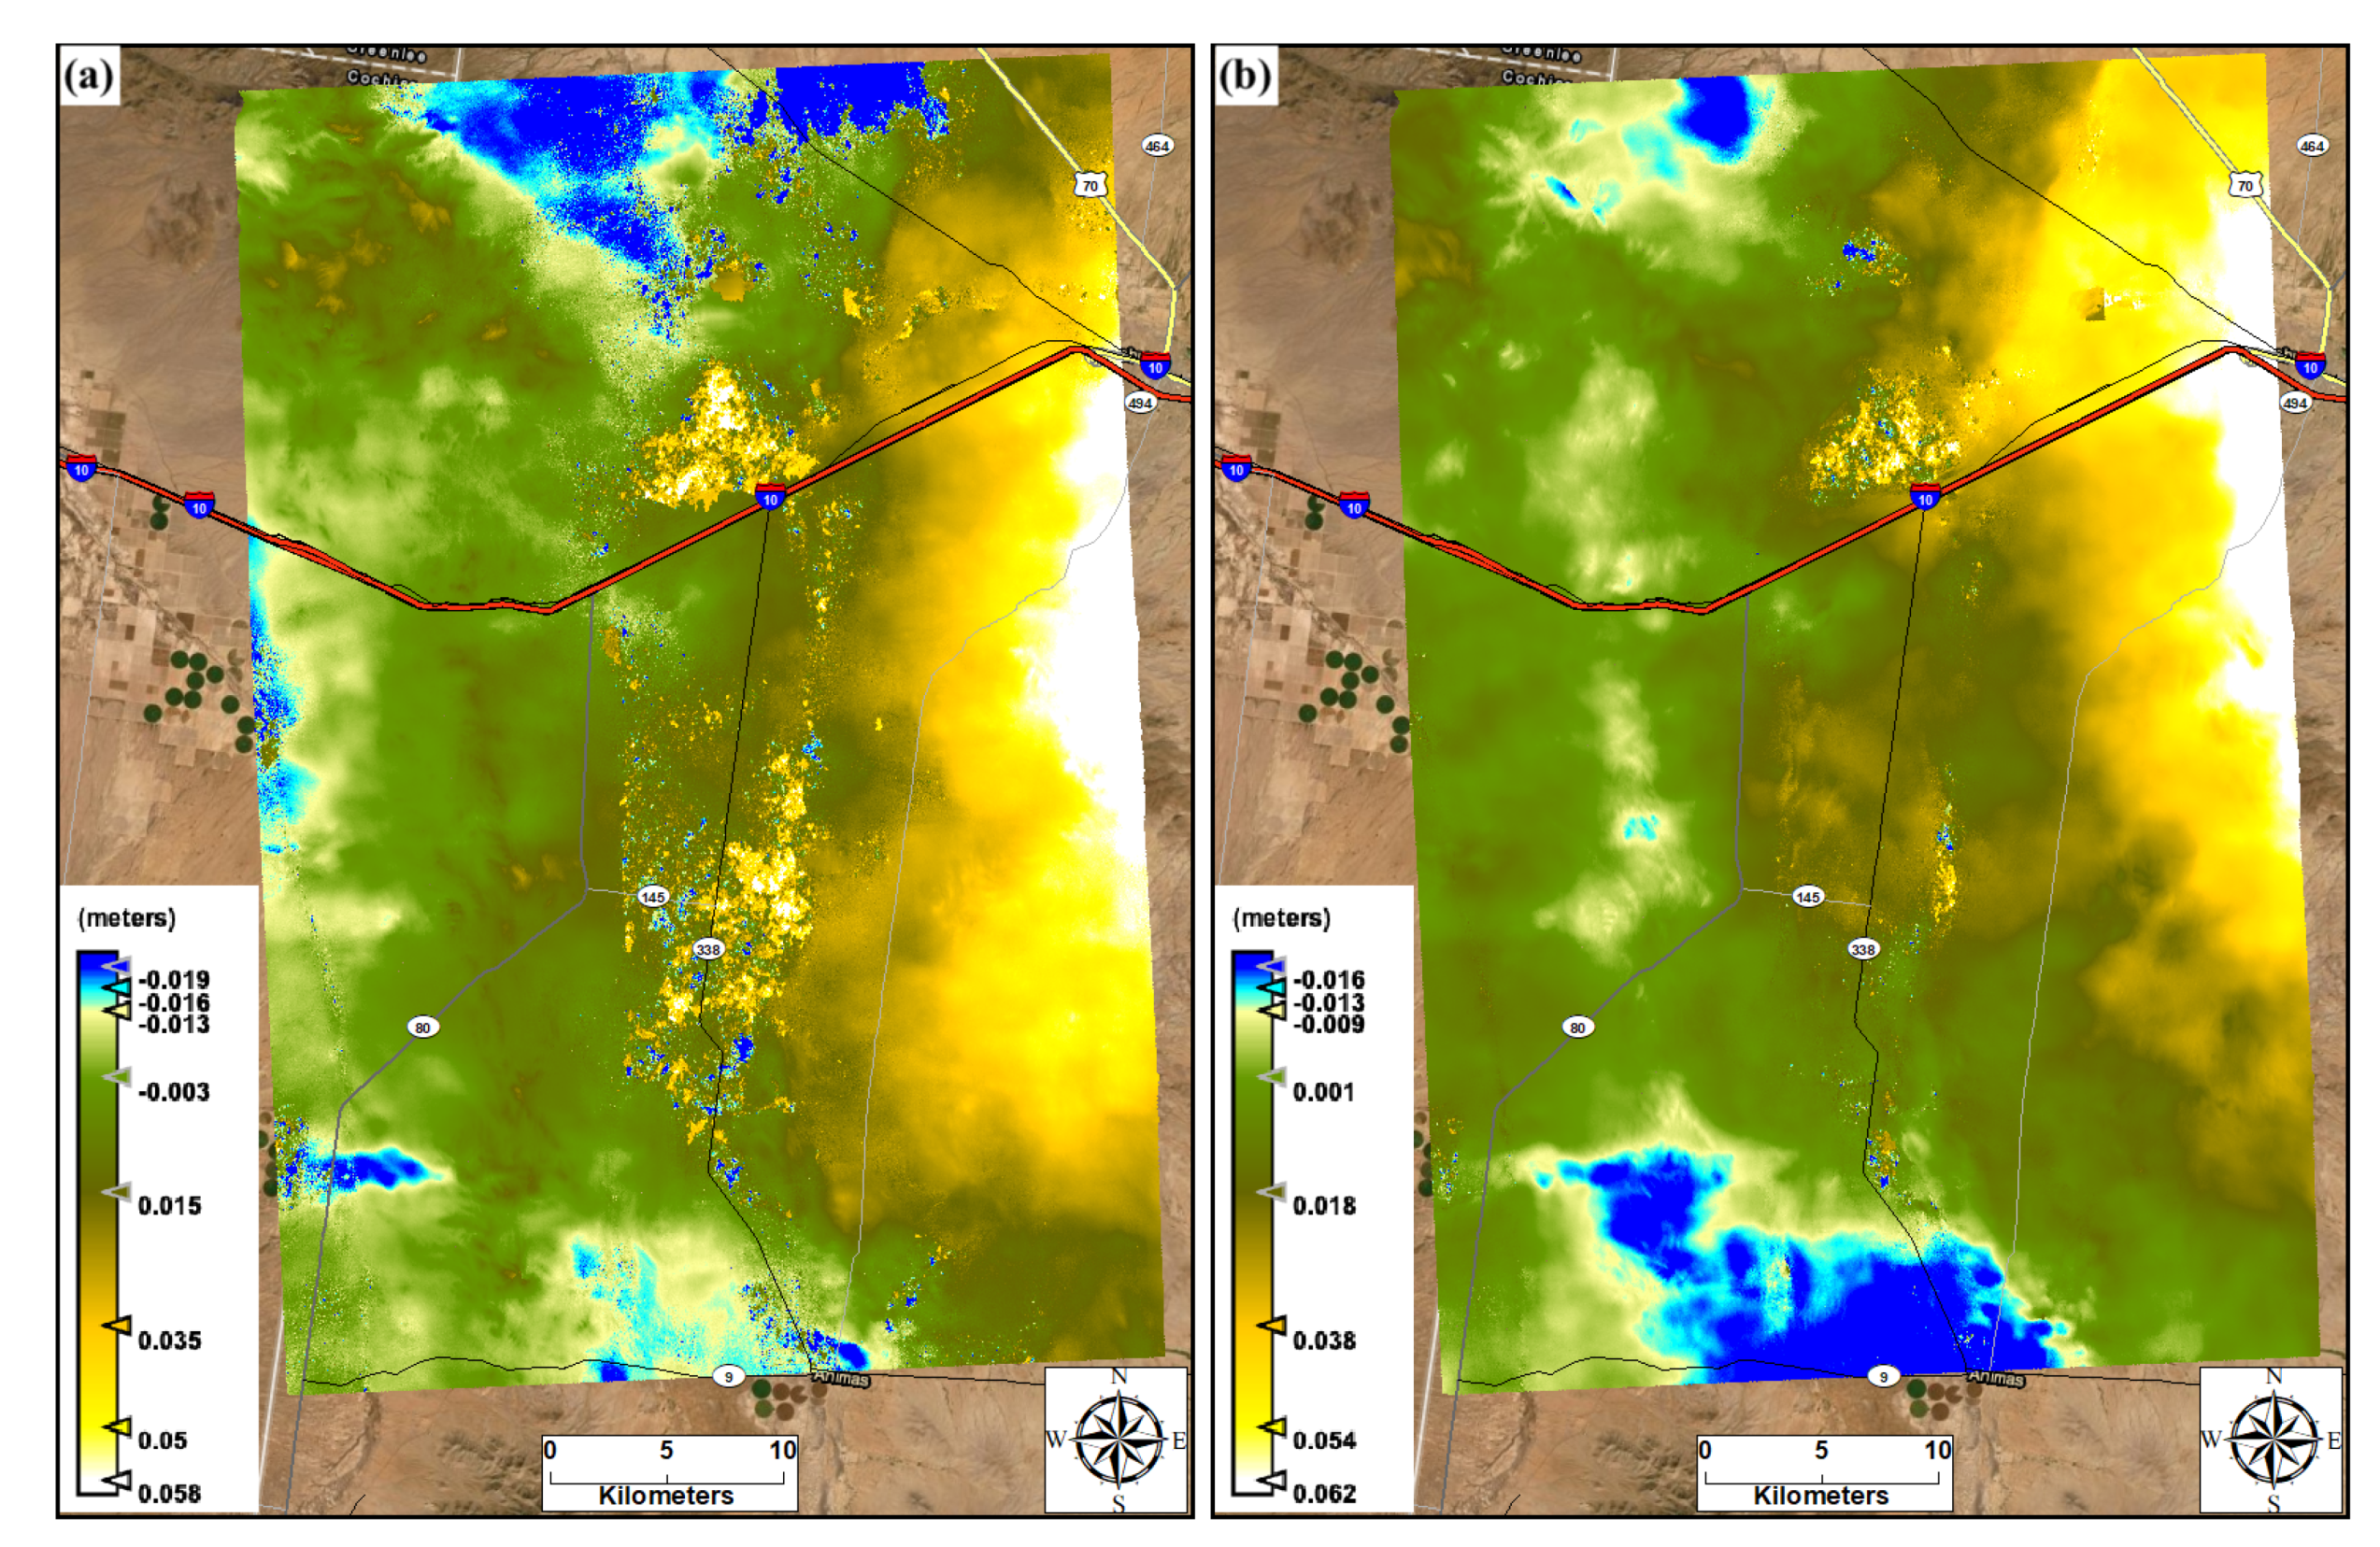
The results from the synthetic aperture radar (SAR) images from Sentinel-1 satellite products identified locations prone to phase and displacement changes via water level change. These locations may become hotspots of dust generation during dry seasons due to sediment availability. The output from the interferogram phase analysis revealed that the surface deformations extracted from pairs of images was primarily due to hydrological inputs. The deformation between the pair of images from spring (acquired on 14 March 2017) and summer (acquired on 5 August 2017) was due to the seasonal rainfall input and sediment loading transported from the watershed onto the playa through runoff (Figure 9a). The deformation between paired images of 24 July 2017 (pre-event) and 5 August 2017 (post-event), bracketing the rainfall event of 1 August 2017, was mainly due to the event’s rainfall and runoff causing sediment loading on the playa (Figure 9b). The movement of the edge of the playa’s water body between dry and wet seasons increases the availability of sediments for wind erosion along the edge of the playa [7,43]. The displacement maps (Figure 10) that were developed from the interferogram phase also highlighted the locations experiencing elevation change due to rainfall and sediment loadings. The highest positive elevation change reached approximately 5.0 cm between spring and monsoon seasons (Figure 10a) and up to around 5.4 cm due to a single monsoon rainfall event (Figure 10b) at the inner part of the playa. The lower elevation changes for the pair of images between the spring and summer than for the pair of images from summer indicates the intensity of evaporative loss in this region. Thus, the combination of optical and radar satellite remote sensing products aided us in assessing the horizontal and vertical changes within the playa and improved the mapping of hotspots susceptible to wind erosion as well as inundated areas, which would not be susceptible to erosion.
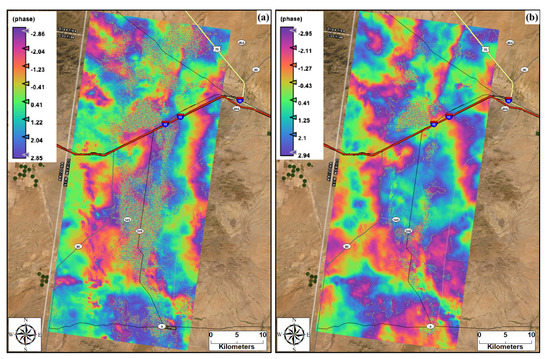
Figure 9.
Deformation fringes from interferogram phase analysis, (a) between spring day of 14 March 2017 and monsoon day of 5 August 2017, (b) between 24 July and 5 August 2017 bracketing rainy day of 1 August 2017.
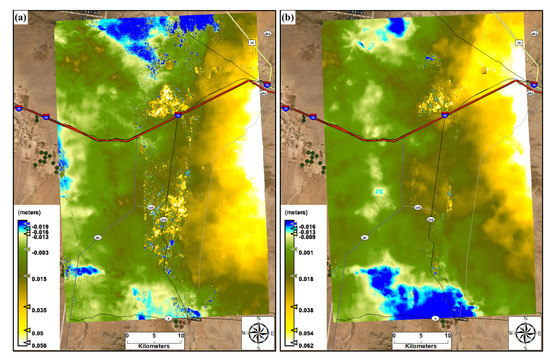
Figure 10.
Displacement maps processed from interferogram phase analysis output, (a) between spring day of 14 March 2017 and monsoon day of 5 August 2017, (b) between 24 July and 5 August 2017 bracketing rainy day of 1 August 2017.
6. Discussion
In summary, the assimilation of optical and radar satellite remote sensing imagery products improved discernment of playa surface changes in space and time. The identification of regions vulnerable to these fluctuations assisted the process of delineating hotspots susceptible to wind erosion. Based on these delineations, land managers can plan their strategy in controlling wind erosion and establish sustainable field-level conservation plans. The utilization of Google Earth Engine facilitated acquisition, processing, and analysis of the optical images by providing cloud computing platform, long-term satellite imagery, and powerful algorithms. The application of linear spectral unmixing algorithms to the Landsat and Sentinel-2 optical images discriminated the contribution of each endmember (soil, vegetation, and water) into the pixel mixtures. The hydrological processes (monsoon rains, dry seasons, and playa inundation) occurring during the specific season and the preceding seasons were the main factors influencing the composition of each pixel.
During the spring seasons, the playa pixels were dominated by high fractions of soil endmember, except for inner low-lying parts of the playa. Due to this dominance, the majority of the playa surface was potentially exposed to wind erosion. Vegetation endmember showed low fractions across the playa and throughout the majority of the spring seasons. However, during summer/fall seasons, the proportion of vegetation endmember in the pixel mixtures was improved, giving the playa surface some protection against wind erosion. Water endmember exhibited high fractions in the inner part of the playa. The linear spectral unmixing algorithm demonstrated its capability by capturing the water-dominated pixels from the very small water bodies (ditches) along the sides of major transportation systems crossing the playa. Using the water fractions as an input, the pixels with greater than or equal to 0.35 threshold were flagged as water, and thus the areal extent of the flooded water within the playa was determined. By using SAR images from Sentinel-1, land deformation and displacement due to hydrological processes were estimated. The locations prone to phase and displacement changes due to water level change were identified and related to possible dust hotspots. Therefore, assimilation of optical and radar satellite remote sensing products significantly improved information about the long-term evolution of the playa and mapping of hotspots susceptible to wind erosion.
Satellite imagery products have been invaluable for large-scale investigation of historical LULC and hydrological changes. However, spectral indices retrieved from moderate spatial resolution satellite imagery products such as Landsat and Sentinel-2 have limited applications in detecting small-scale changes in areas dominated by highly seasonal and shallow water bodies like the Lordsburg Playa [53,88]. This is because many those water bodies possess areal coverage finer than the spatial resolution of the satellite imagery considered in this study. These water bodies and vegetation cover are critical factors that determine the availability of soil particles for wind erosion in global playas such as Lordsburg, and identifying these land cover types is important for land managers and policy makers in mitigating dust emission. In addition, for assessing the vegetation health in semi-arid regions, the spectral unmixing approach showed better performance compared to the Normalized Difference Vegetation Index (NDVI) due to being less sensitive to soil background [89].
This study identified the locations within the playa exposed to long-term hydrological and LULC changes, which are critical parameters that determine the sediment supply for wind erosion. The application of linear spectral unmixing algorithm and InSAR technique helped us to identify patterns and features of changes buried in the optical and radar imagery products, which are reflected in the final results of this study. Accordingly, the seasonal hydrological inputs and changes have paramount importance in determining the Lordsburg Playa’s capacity in generating and emitting dust, and in turn traffic safety.
7. Conclusions
The results of this study illustrate how introducing cloud computing platforms and accompanying algorithms into able to on the Earth system over the past decade has facilitated and improved the mining of LULC and hydrological changes buried within large volumes of satellite remote sensing imagery products [90]. It explored the potential of spectral unmixing in addressing limitations of moderate spatial resolution optical remote sensing imagery and discriminating the contribution of surface endmembers into the spectral mixture.
This study took advantage of long-term records of optical imagery; cloud-, nighttime-, and precipitation-insensitive radar imagery, and cloud-based cyber infrastructure to discern LULC and hydrological changes in the dust-emissive Lordsburg Playa. While the linear spectral unmixing algorithm demonstrated its capability to discriminate the surface endmembers from spectral mixture, non-linear approaches, including machine- and deep learning methods could also be used to accurately identify the fractional abundance of endmembers, because the LULC and hydrological variables are non-linear in nature. The spectral unmixing approach detected numerous small, shallow water bodies, including those alongside major transportation systems which are difficult to detect with traditional spectral indices due to their coarser spatial resolution. The study also showed that vertical changes within the playa can be estimated using radar images, compensating for limitations of optical remote sensing. Complementing SAR images with optical images aided investigation of both horizontal and vertical changes within the playa. The application of field and airborne spectrometers for the measurement of spectral signature of the endmembers over highly dynamic land surfaces such as playas should be further explored for potential improvement of the performance of both linear and non-linear spectral unmixing models. The detection of seasonally exposed ephemeral lake surfaces in greater detail can significantly assist the quantification of potential soil loss from playas through erosion and the resulting dust emissions’ impact on air quality and nearby infrastructure. Identification of locations sensitive to seasonal land use/land cover changes and hotspots for aeolian processes are valuable findings for supporting the efforts towards erosion control plans.
Author Contributions
Conceptualization, I.G.E. and T.E.G.; Methodology, I.G.E. and T.E.G.; Software, I.G.E.; Validation, I.G.E., T.E.G., R.S.V.P. and D.Q.T.; Formal analysis, I.G.E. and T.E.G.; Investigation, I.G.E. and T.E.G.; Resources, I.G.E., T.E.G., D.Q.T. and R.S.V.P.; Data curation, I.G.E.; Writing—original draft preparation, I.G.E., T.E.G., R.S.V.P. and D.Q.T.; Writing—review and editing, I.G.E., T.E.G., R.S.V.P. and D.Q.T.; Visualization, I.G.E.; Supervision, T.E.G., R.S.V.P. and D.Q.T.; Project administration, T.E.G.; Funding acquisition, T.E.G. and D.Q.T. All authors have read and agreed to the published version of the manuscript.
Funding
This research was funded by Advancing Research in Transportation Emissions, Energy, and Health (CARTEEH) project UTEP-01-13, NASA grants 80NSSC19K0195 and NNX16AH13G.
Institutional Review Board Statement
Not applicable.
Informed Consent Statement
Not applicable.
Data Availability Statement
Refer to the DOI: https://doi.org/10.17632/ds4j2f3765.1 (accessed on 24 August 2021).
Acknowledgments
We thank the USGS for providing Landsat images and the European Space Agency (ESA) for supplying Sentinel-1 and Sentinel-2 images. Our acknowledgement also extends to Google for its Google Earth Engine platform. Funded by Center for Advancing Research in Transportation Emissions, Energy, and Health (CARTEEH) project UTEP-01-13, NASA grants 80NSSC19K0195 and NNX16AH13G.
Conflicts of Interest
The authors declare no conflict of interest. Use of brands or trade names is for information only and does not imply endorsement by or exclusion of similar products by USDA. USDA is an equal opportunity employer and provider.
Abbreviations
The following abbreviations are used in this manuscript:
| GEE | Google Earth Engine |
| LULC | Land Use/Land Cover |
| SAR | Synthetic Aperture Radar |
| InSAR | Interferometric Synthetic Aperture Radar |
| NMDOT | New Mexico Department of Transportation |
| USDA | United States Department of Agriculture |
| USGS | United States Geological Survey |
| NASA | National Aeronautics and Space Administration |
| ETM | Enhanced Thematic Mapper |
| OLI | Operational Land Imager |
| TIRS | Thermal Infrared Sensor |
| WRS | Worldwide Reference System |
| UTC | Universal Time Coordinated |
| ESA | European Space Agency |
| ENVI | Environment for Visualizing Images |
| S1TBX | Sentinel-1 Toolbox |
| SNAPHU | Statistical-Cost, Network-Flow Algorithm for Phase Unwrapping |
| NDWI | Normalized Difference Water Index |
| NDVI | Normalized Difference Vegetation Index |
Appendix A
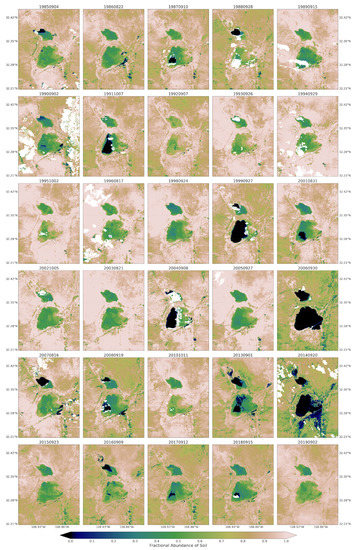
Figure A1.
Fractional abundance of soil endmember retrieved from Landsat 5 and 8 for summer/fall season extending from 1984 to 2019.
Figure A1.
Fractional abundance of soil endmember retrieved from Landsat 5 and 8 for summer/fall season extending from 1984 to 2019.
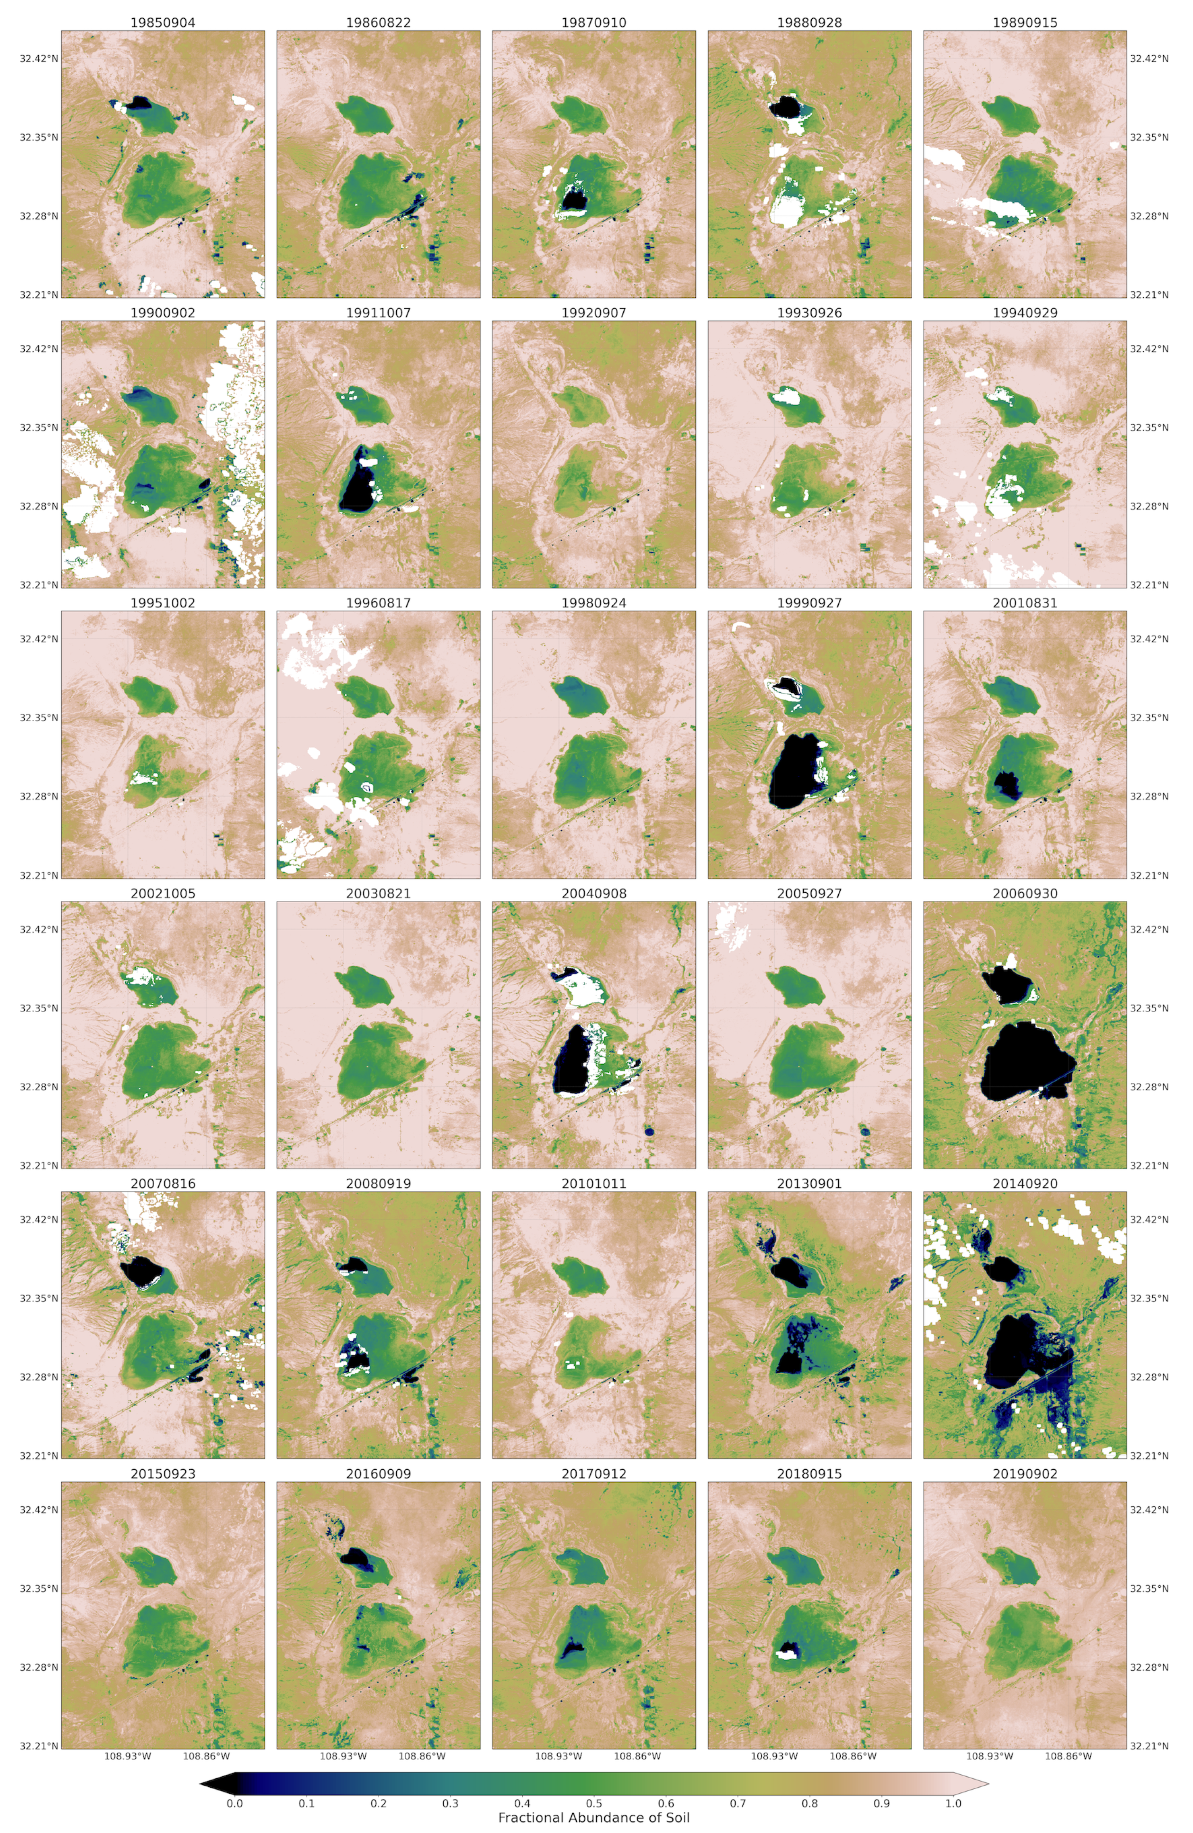
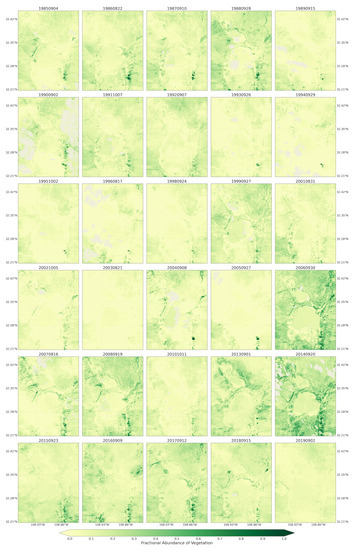
Figure A2.
Fractional abundance of vegetation endmember retrieved from Landsat 5 and 8 for summer/fall season extending from 1984 to 2019.
Figure A2.
Fractional abundance of vegetation endmember retrieved from Landsat 5 and 8 for summer/fall season extending from 1984 to 2019.
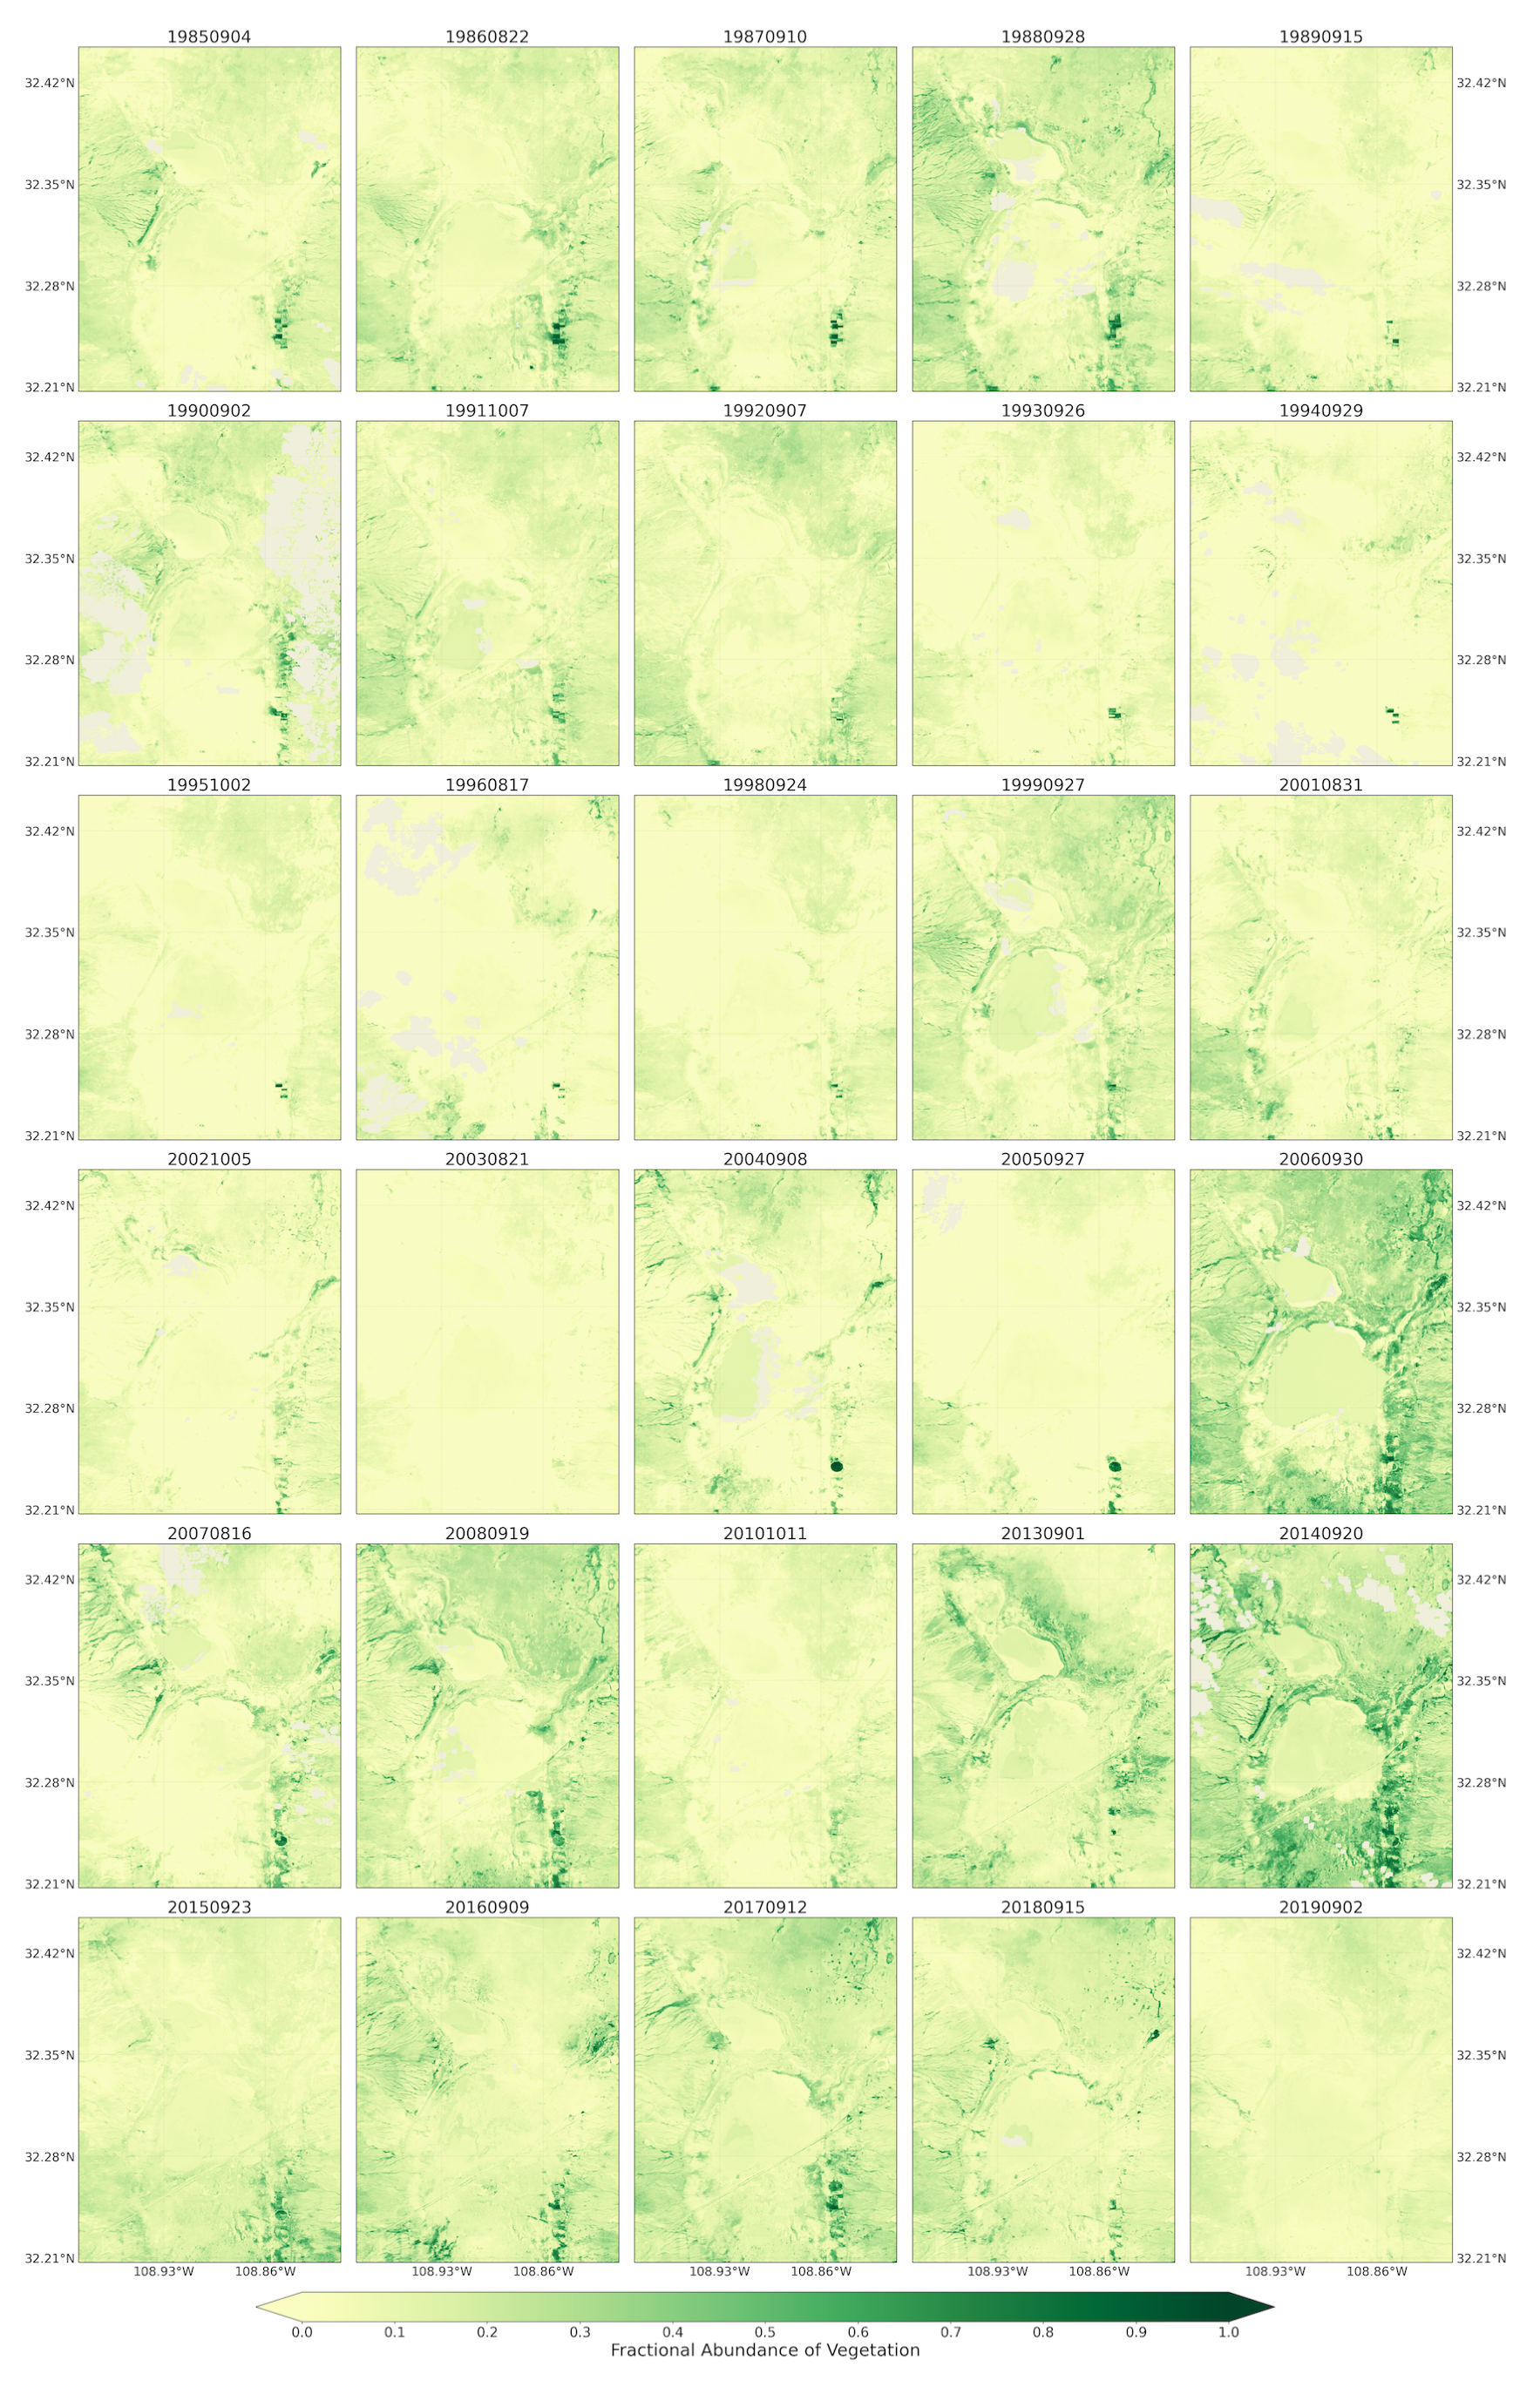
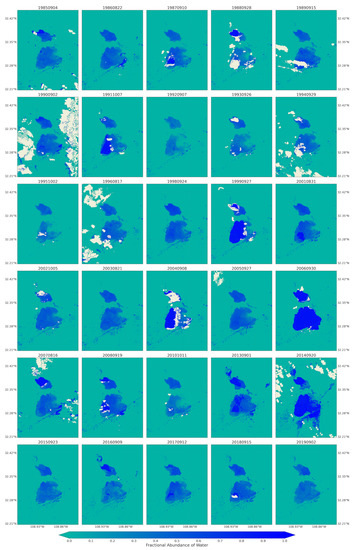
Figure A3.
Fractional abundance of water endmember retrieved from Landsat 5 and 8 for summer/fall season extending from 1984 to 2019.
Figure A3.
Fractional abundance of water endmember retrieved from Landsat 5 and 8 for summer/fall season extending from 1984 to 2019.
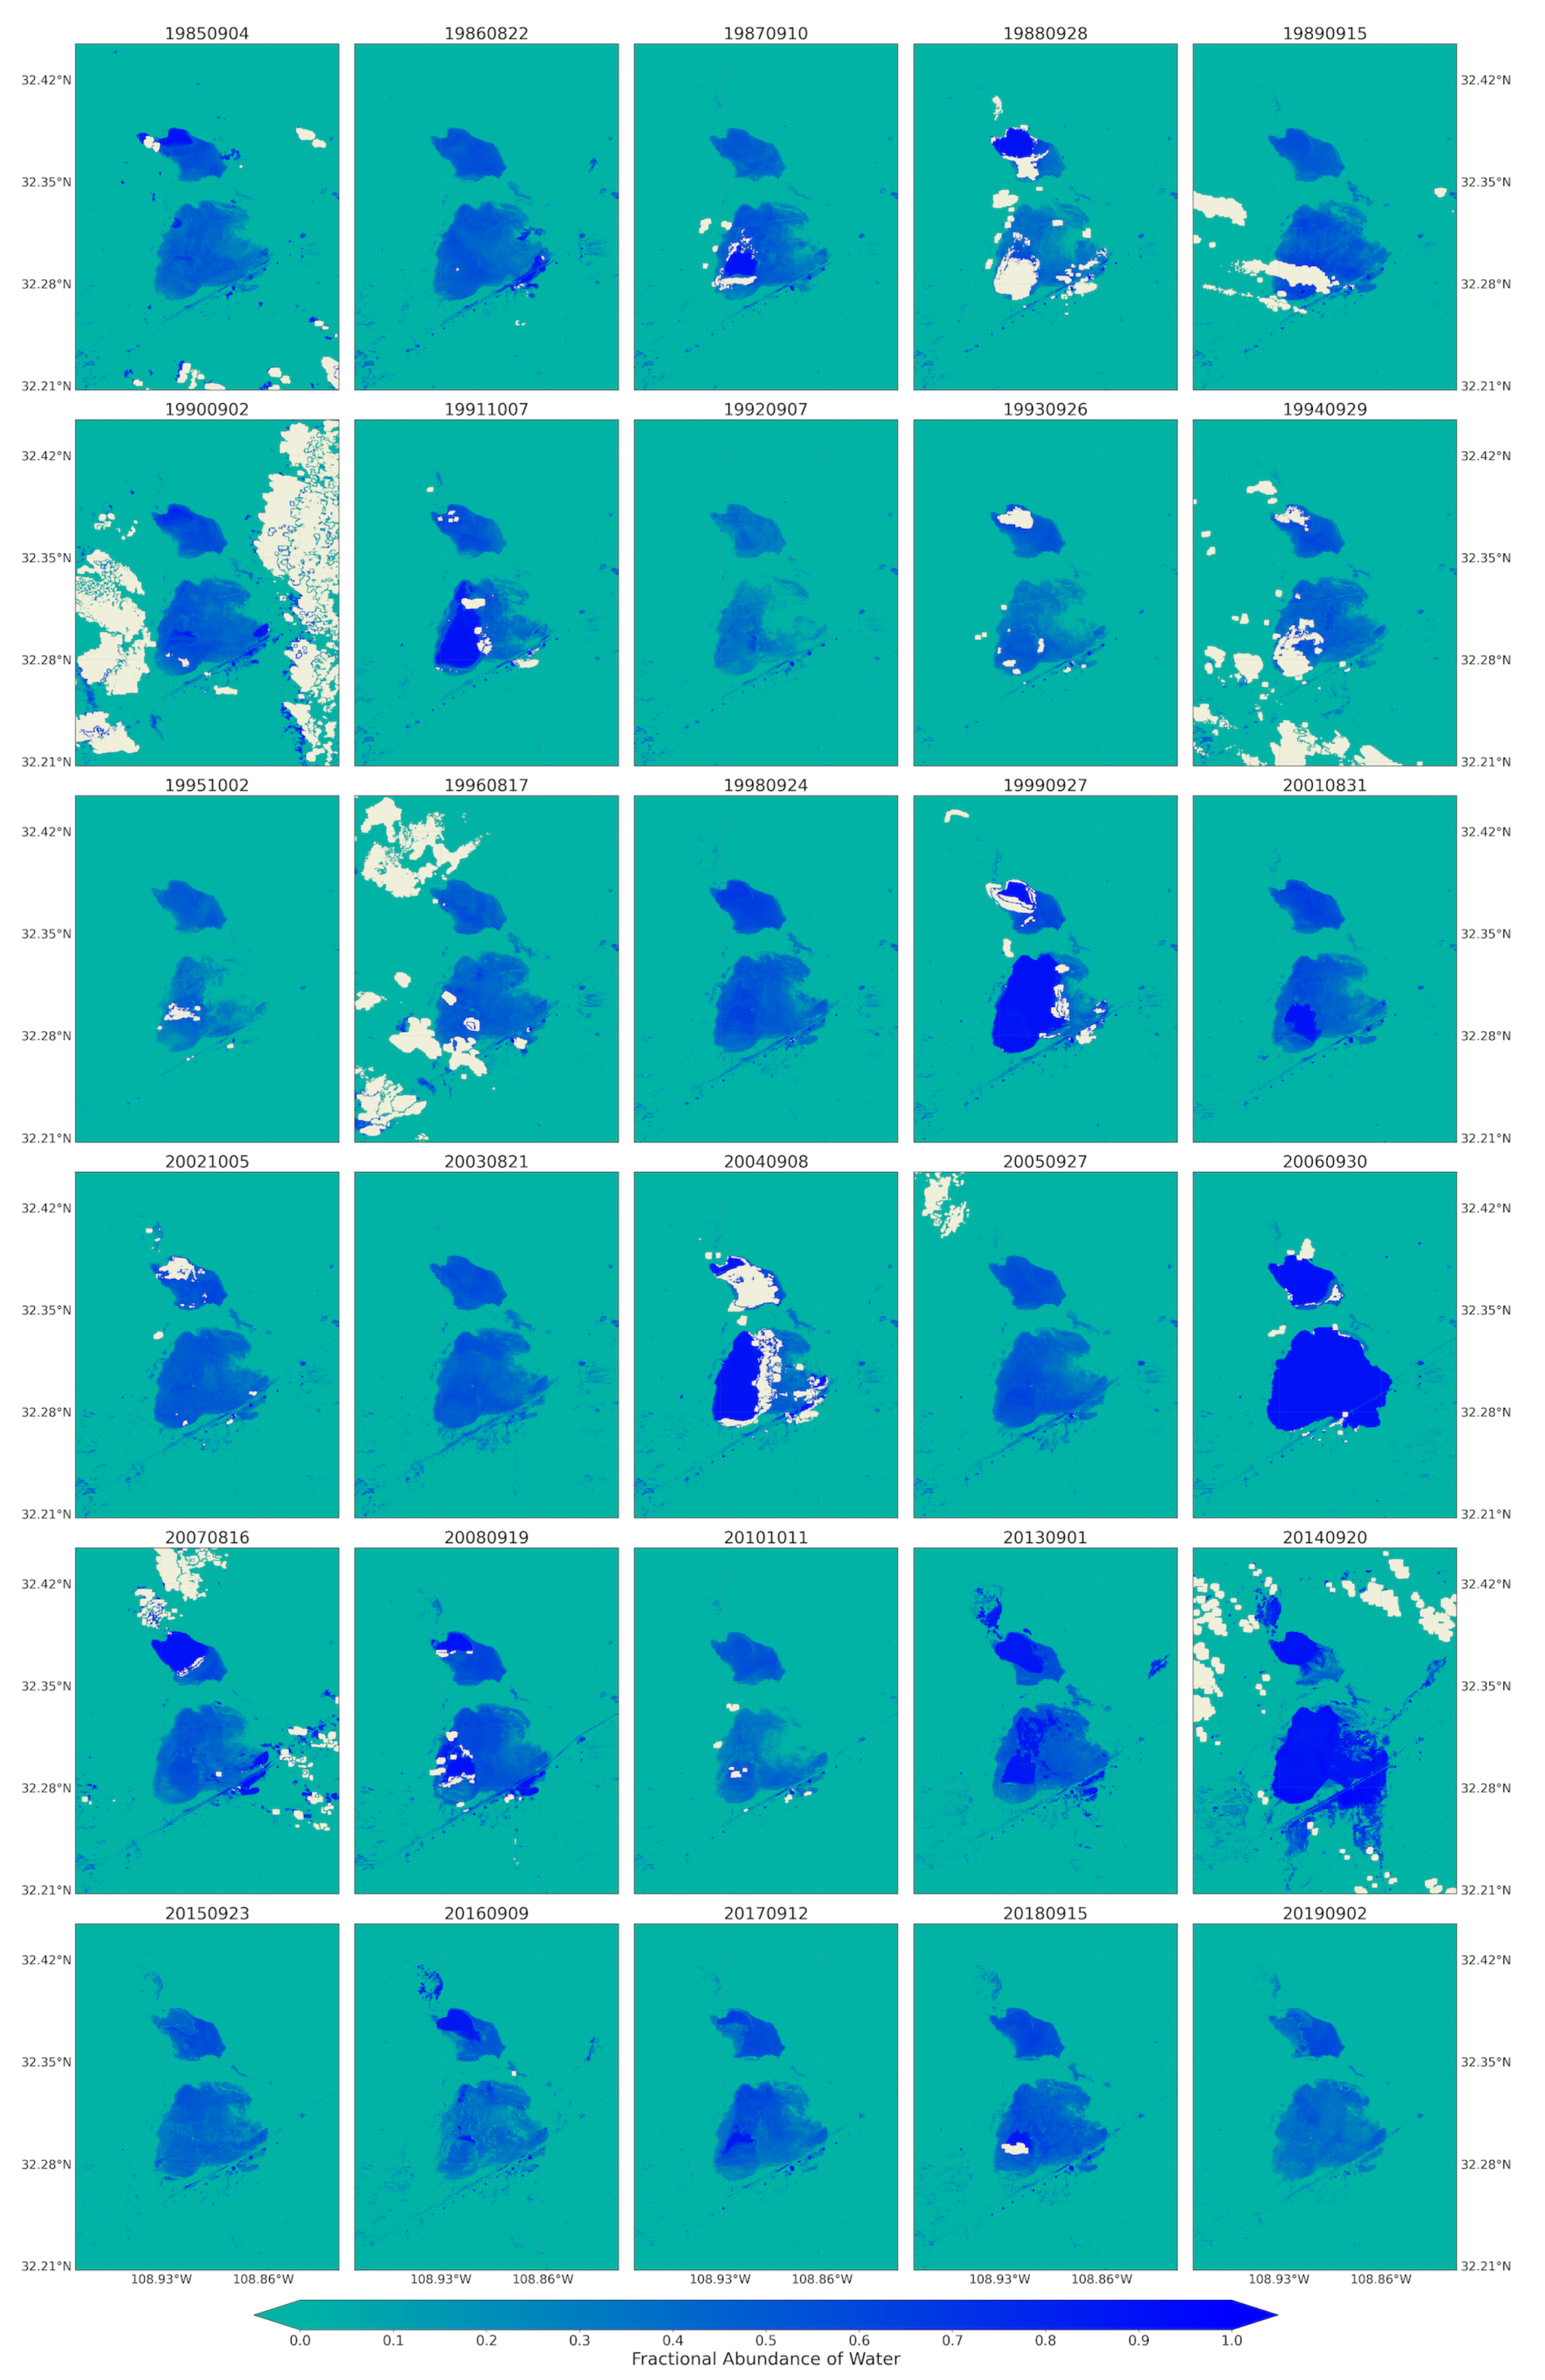
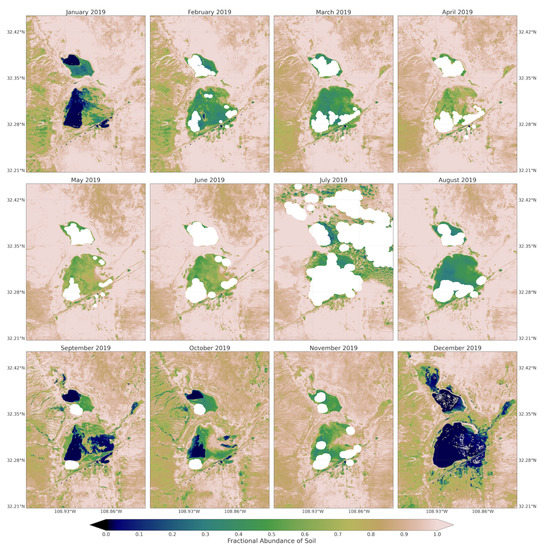
Figure A4.
Fractional abundance of soil endmember retrieved from monthly Sentinel-2 images from January to December 2019.
Figure A4.
Fractional abundance of soil endmember retrieved from monthly Sentinel-2 images from January to December 2019.
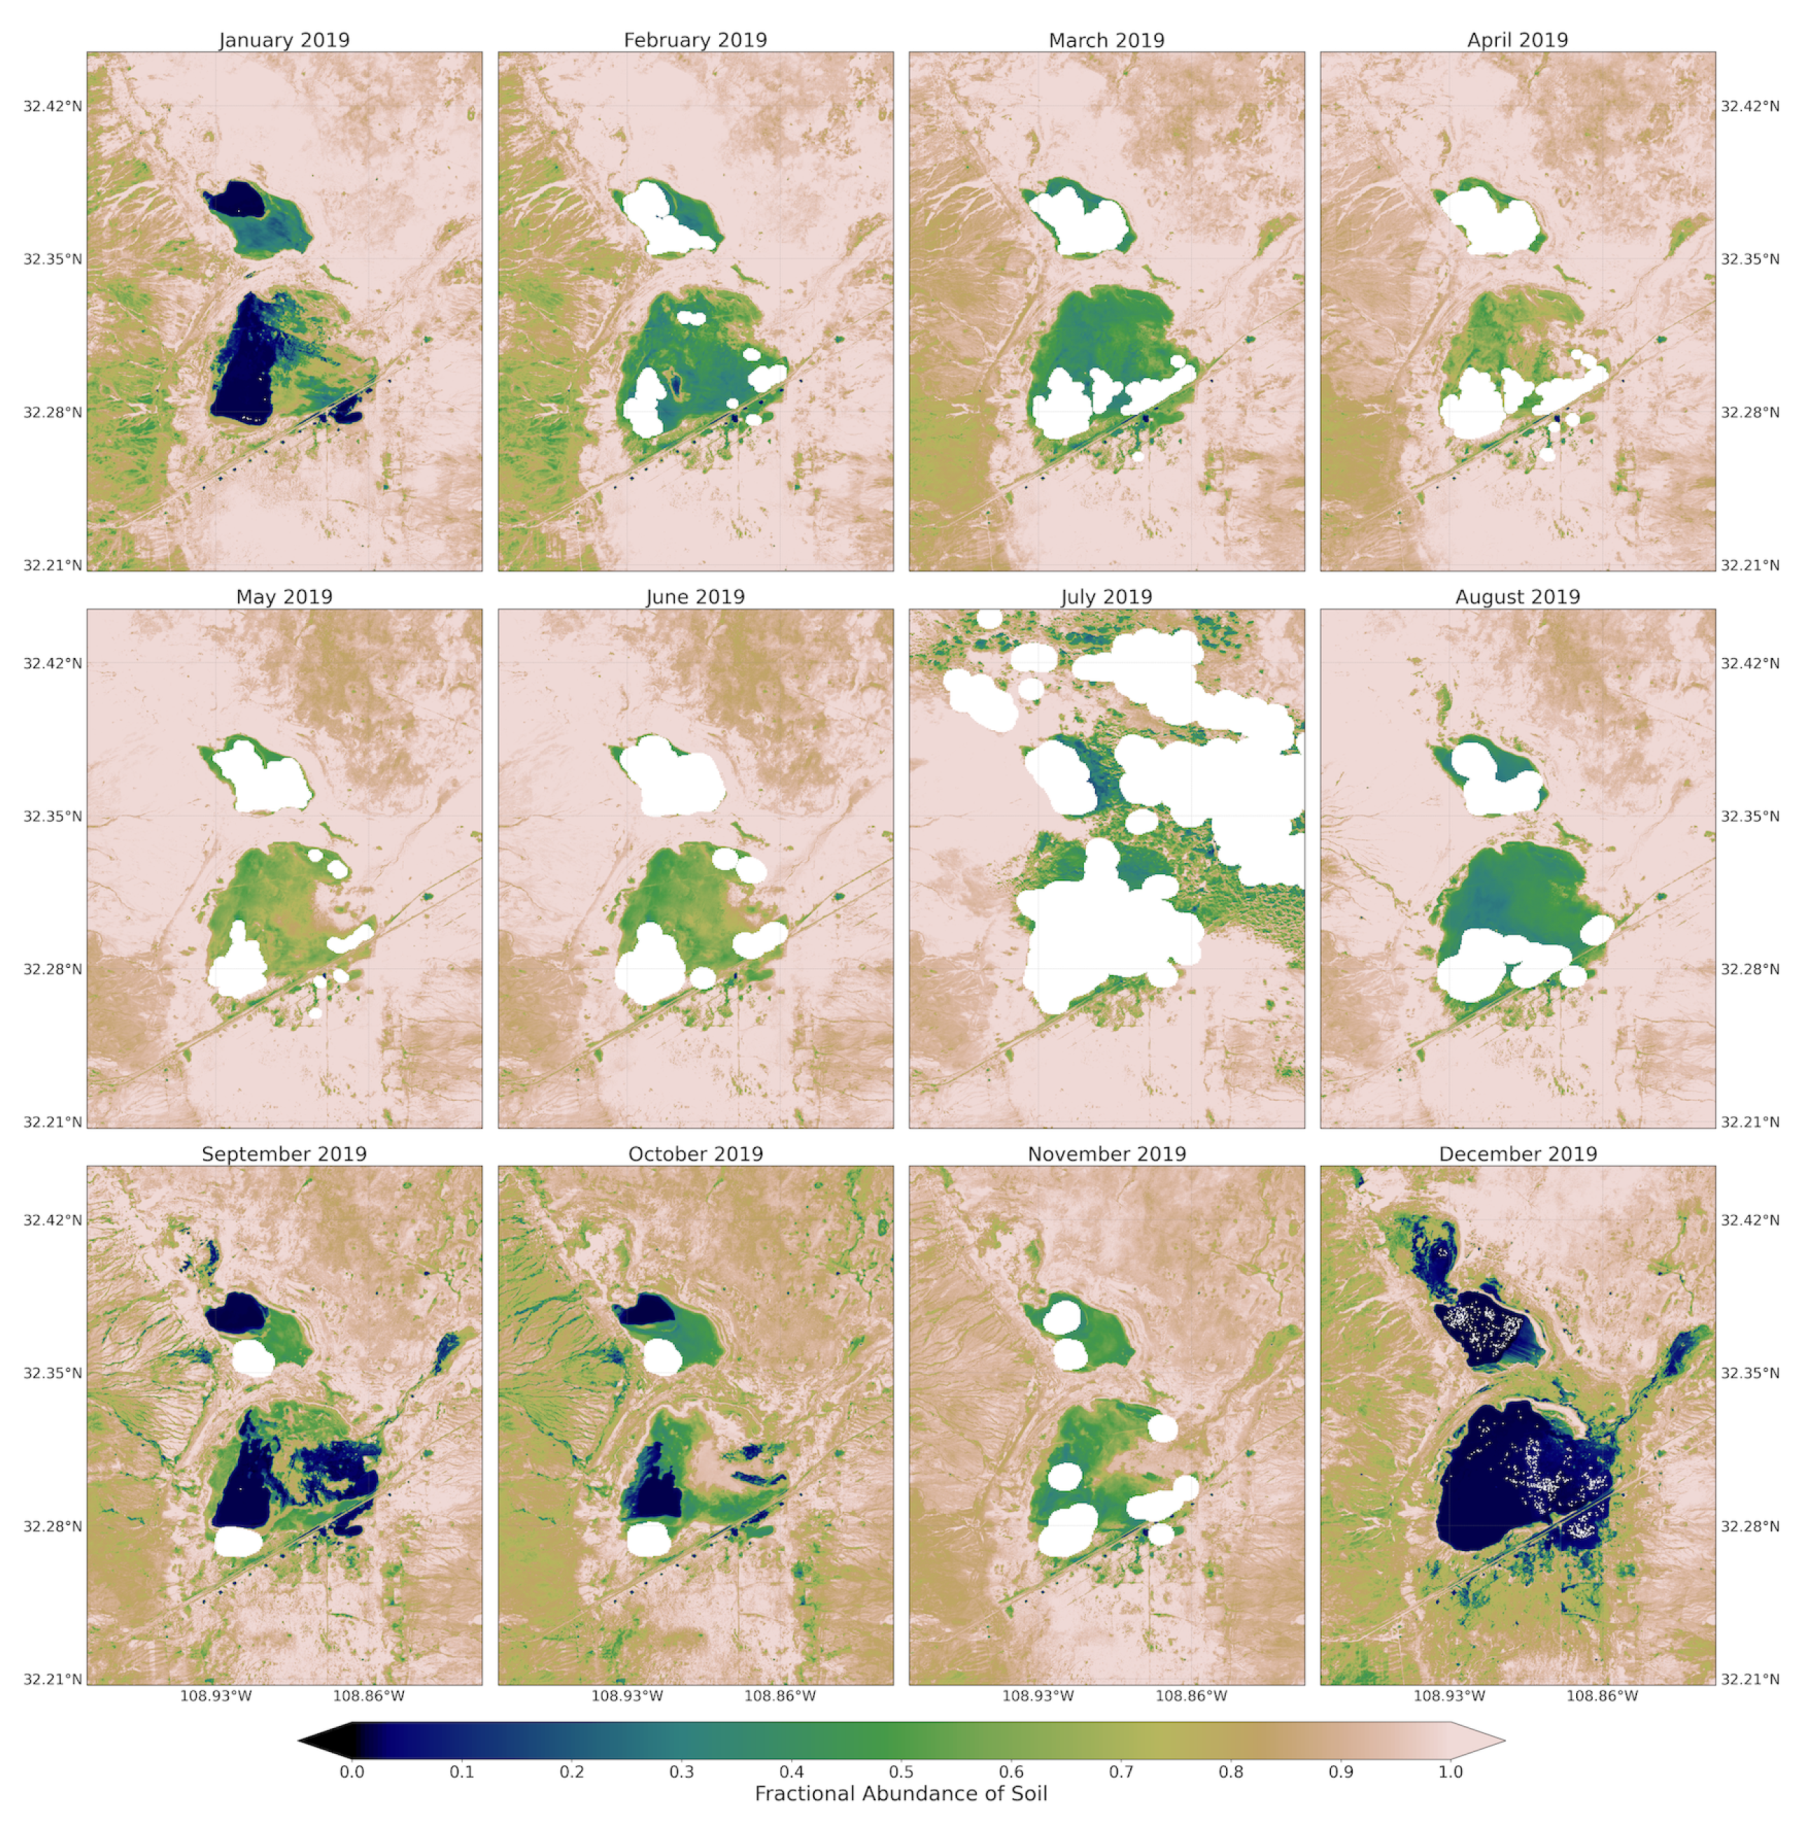
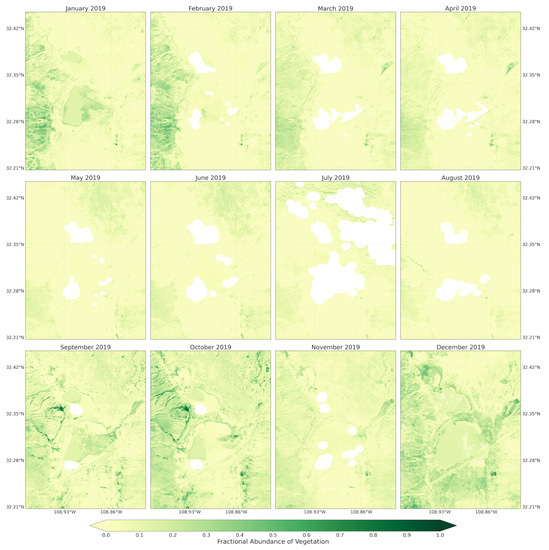
Figure A5.
Fractional abundance of vegetation endmember retrieved from monthly Sentinel-2 images from January to December 2019.
Figure A5.
Fractional abundance of vegetation endmember retrieved from monthly Sentinel-2 images from January to December 2019.
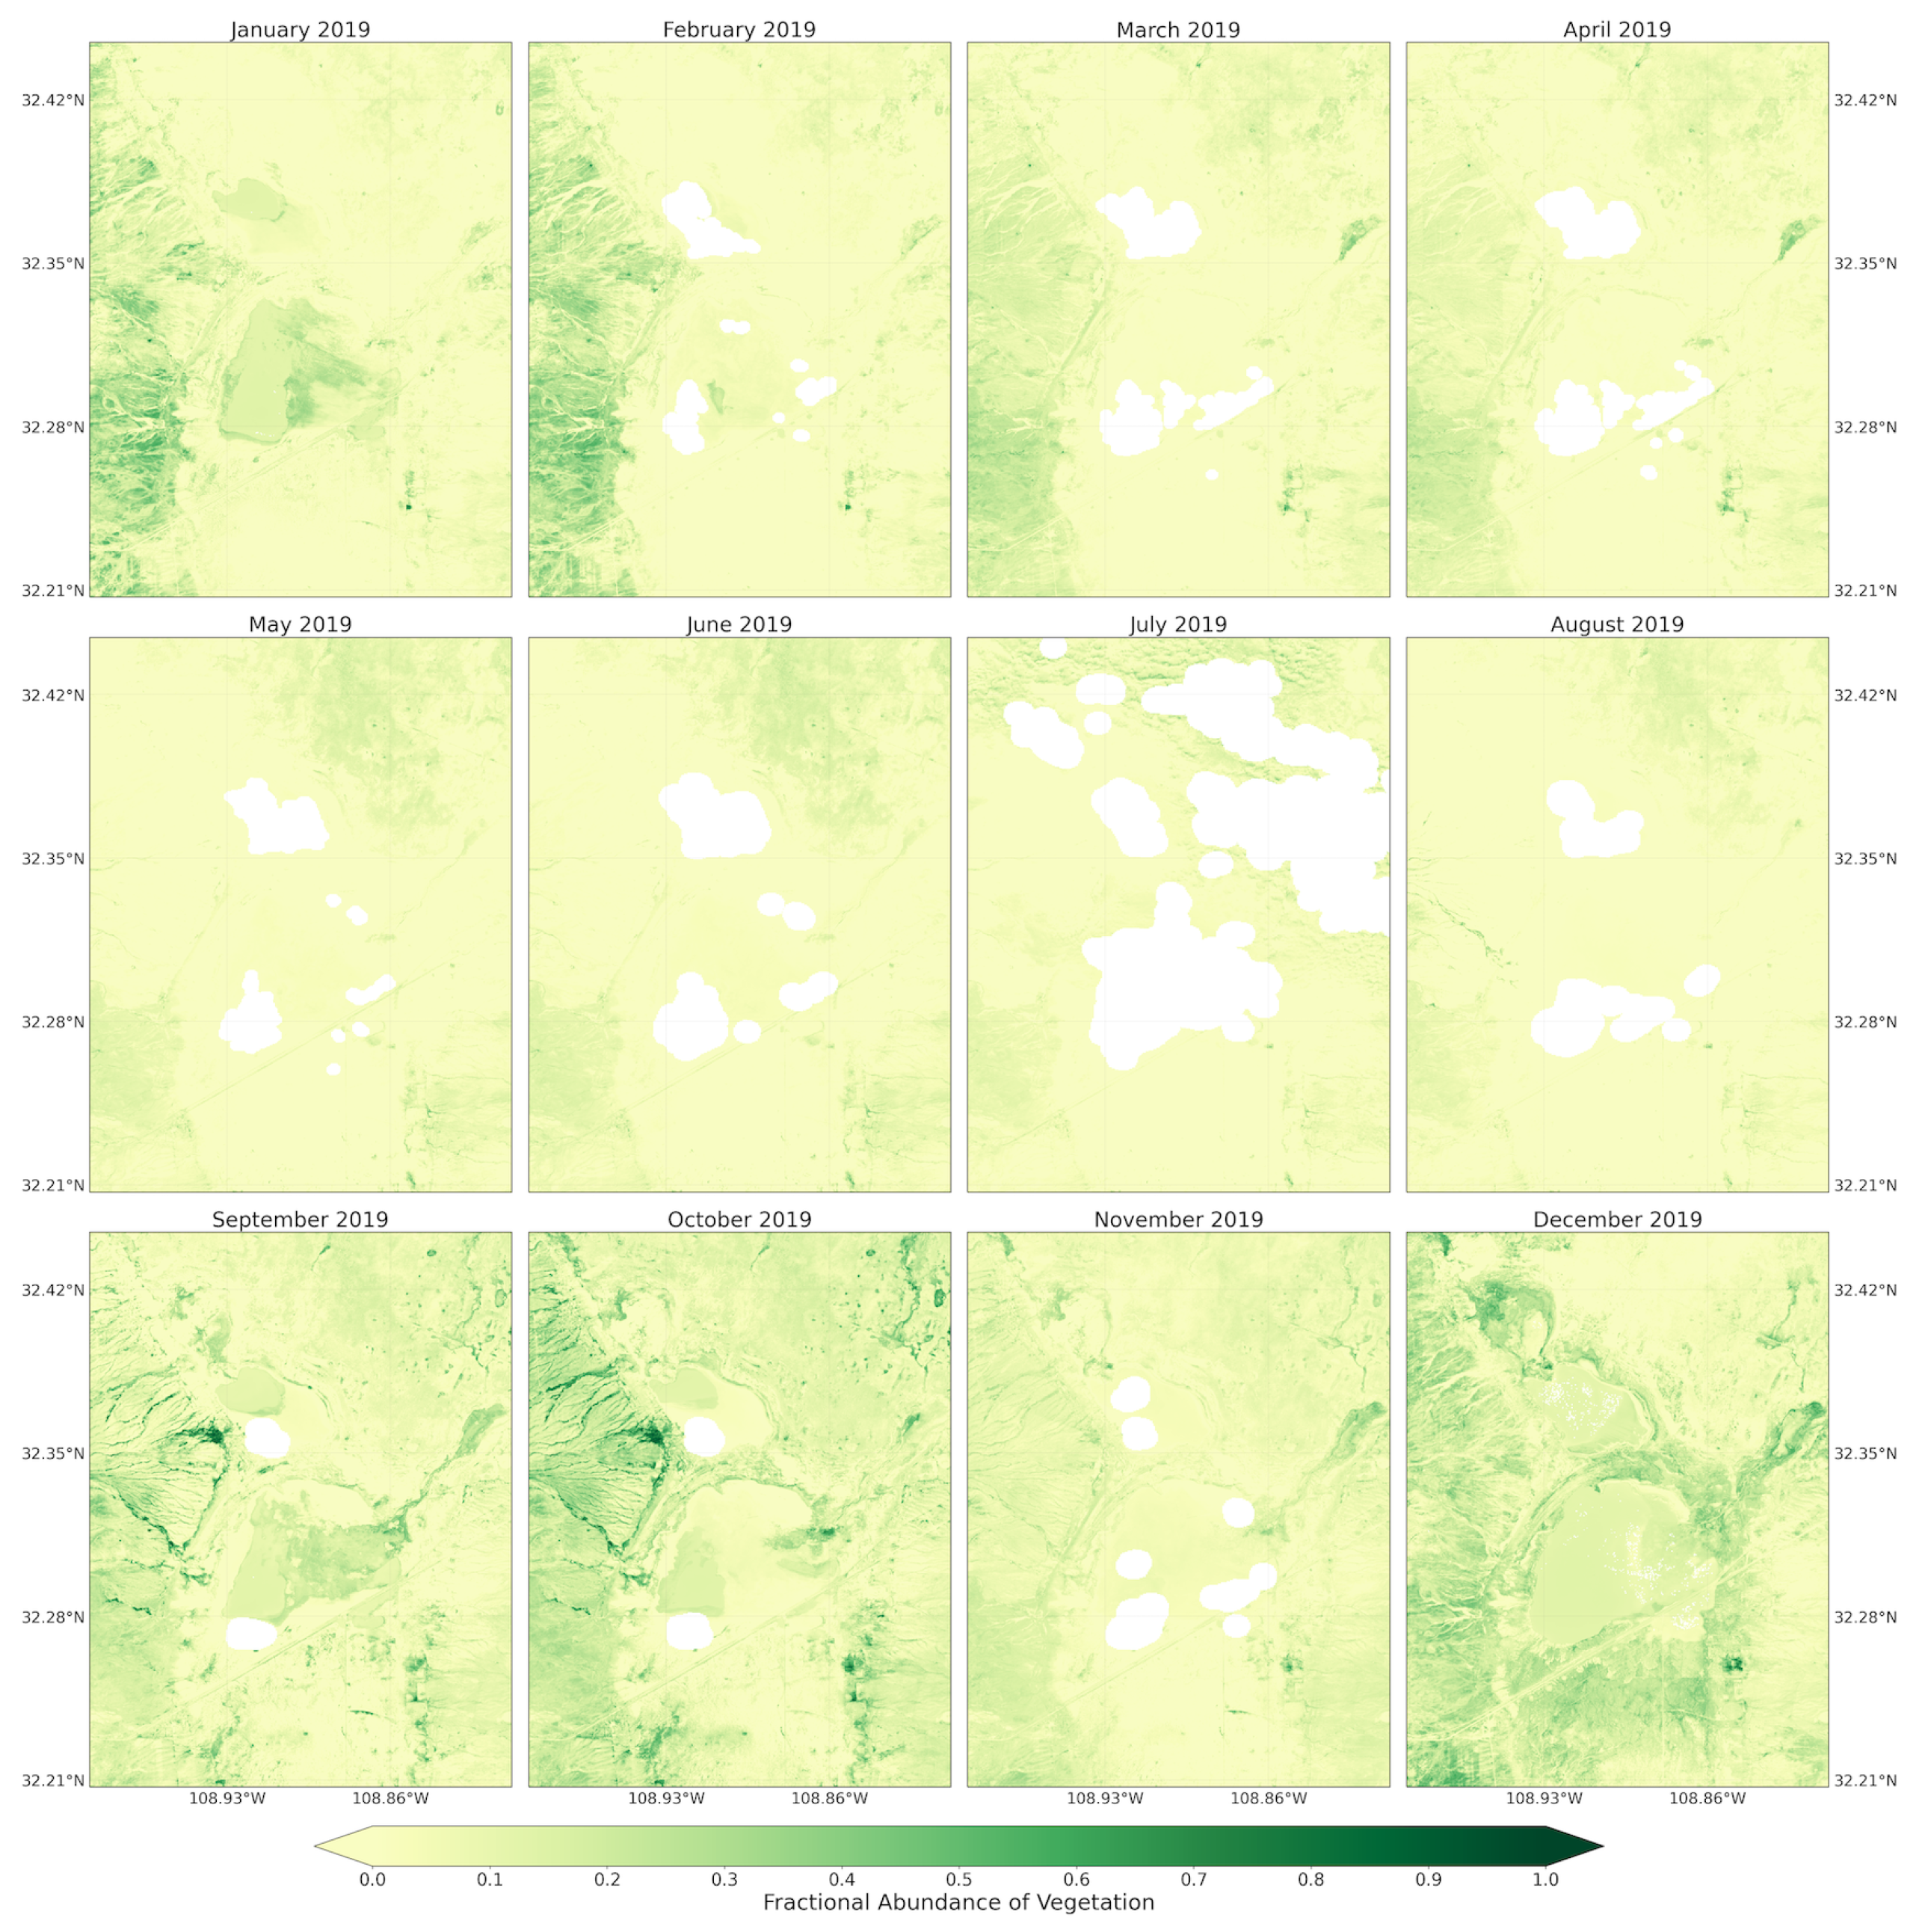
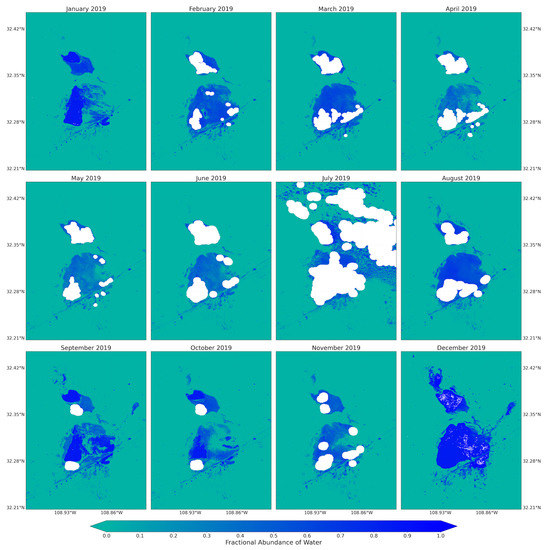
Figure A6.
Fractional abundance of water endmember retrieved from monthly Sentinel-2 images from January to December 2019.
Figure A6.
Fractional abundance of water endmember retrieved from monthly Sentinel-2 images from January to December 2019.
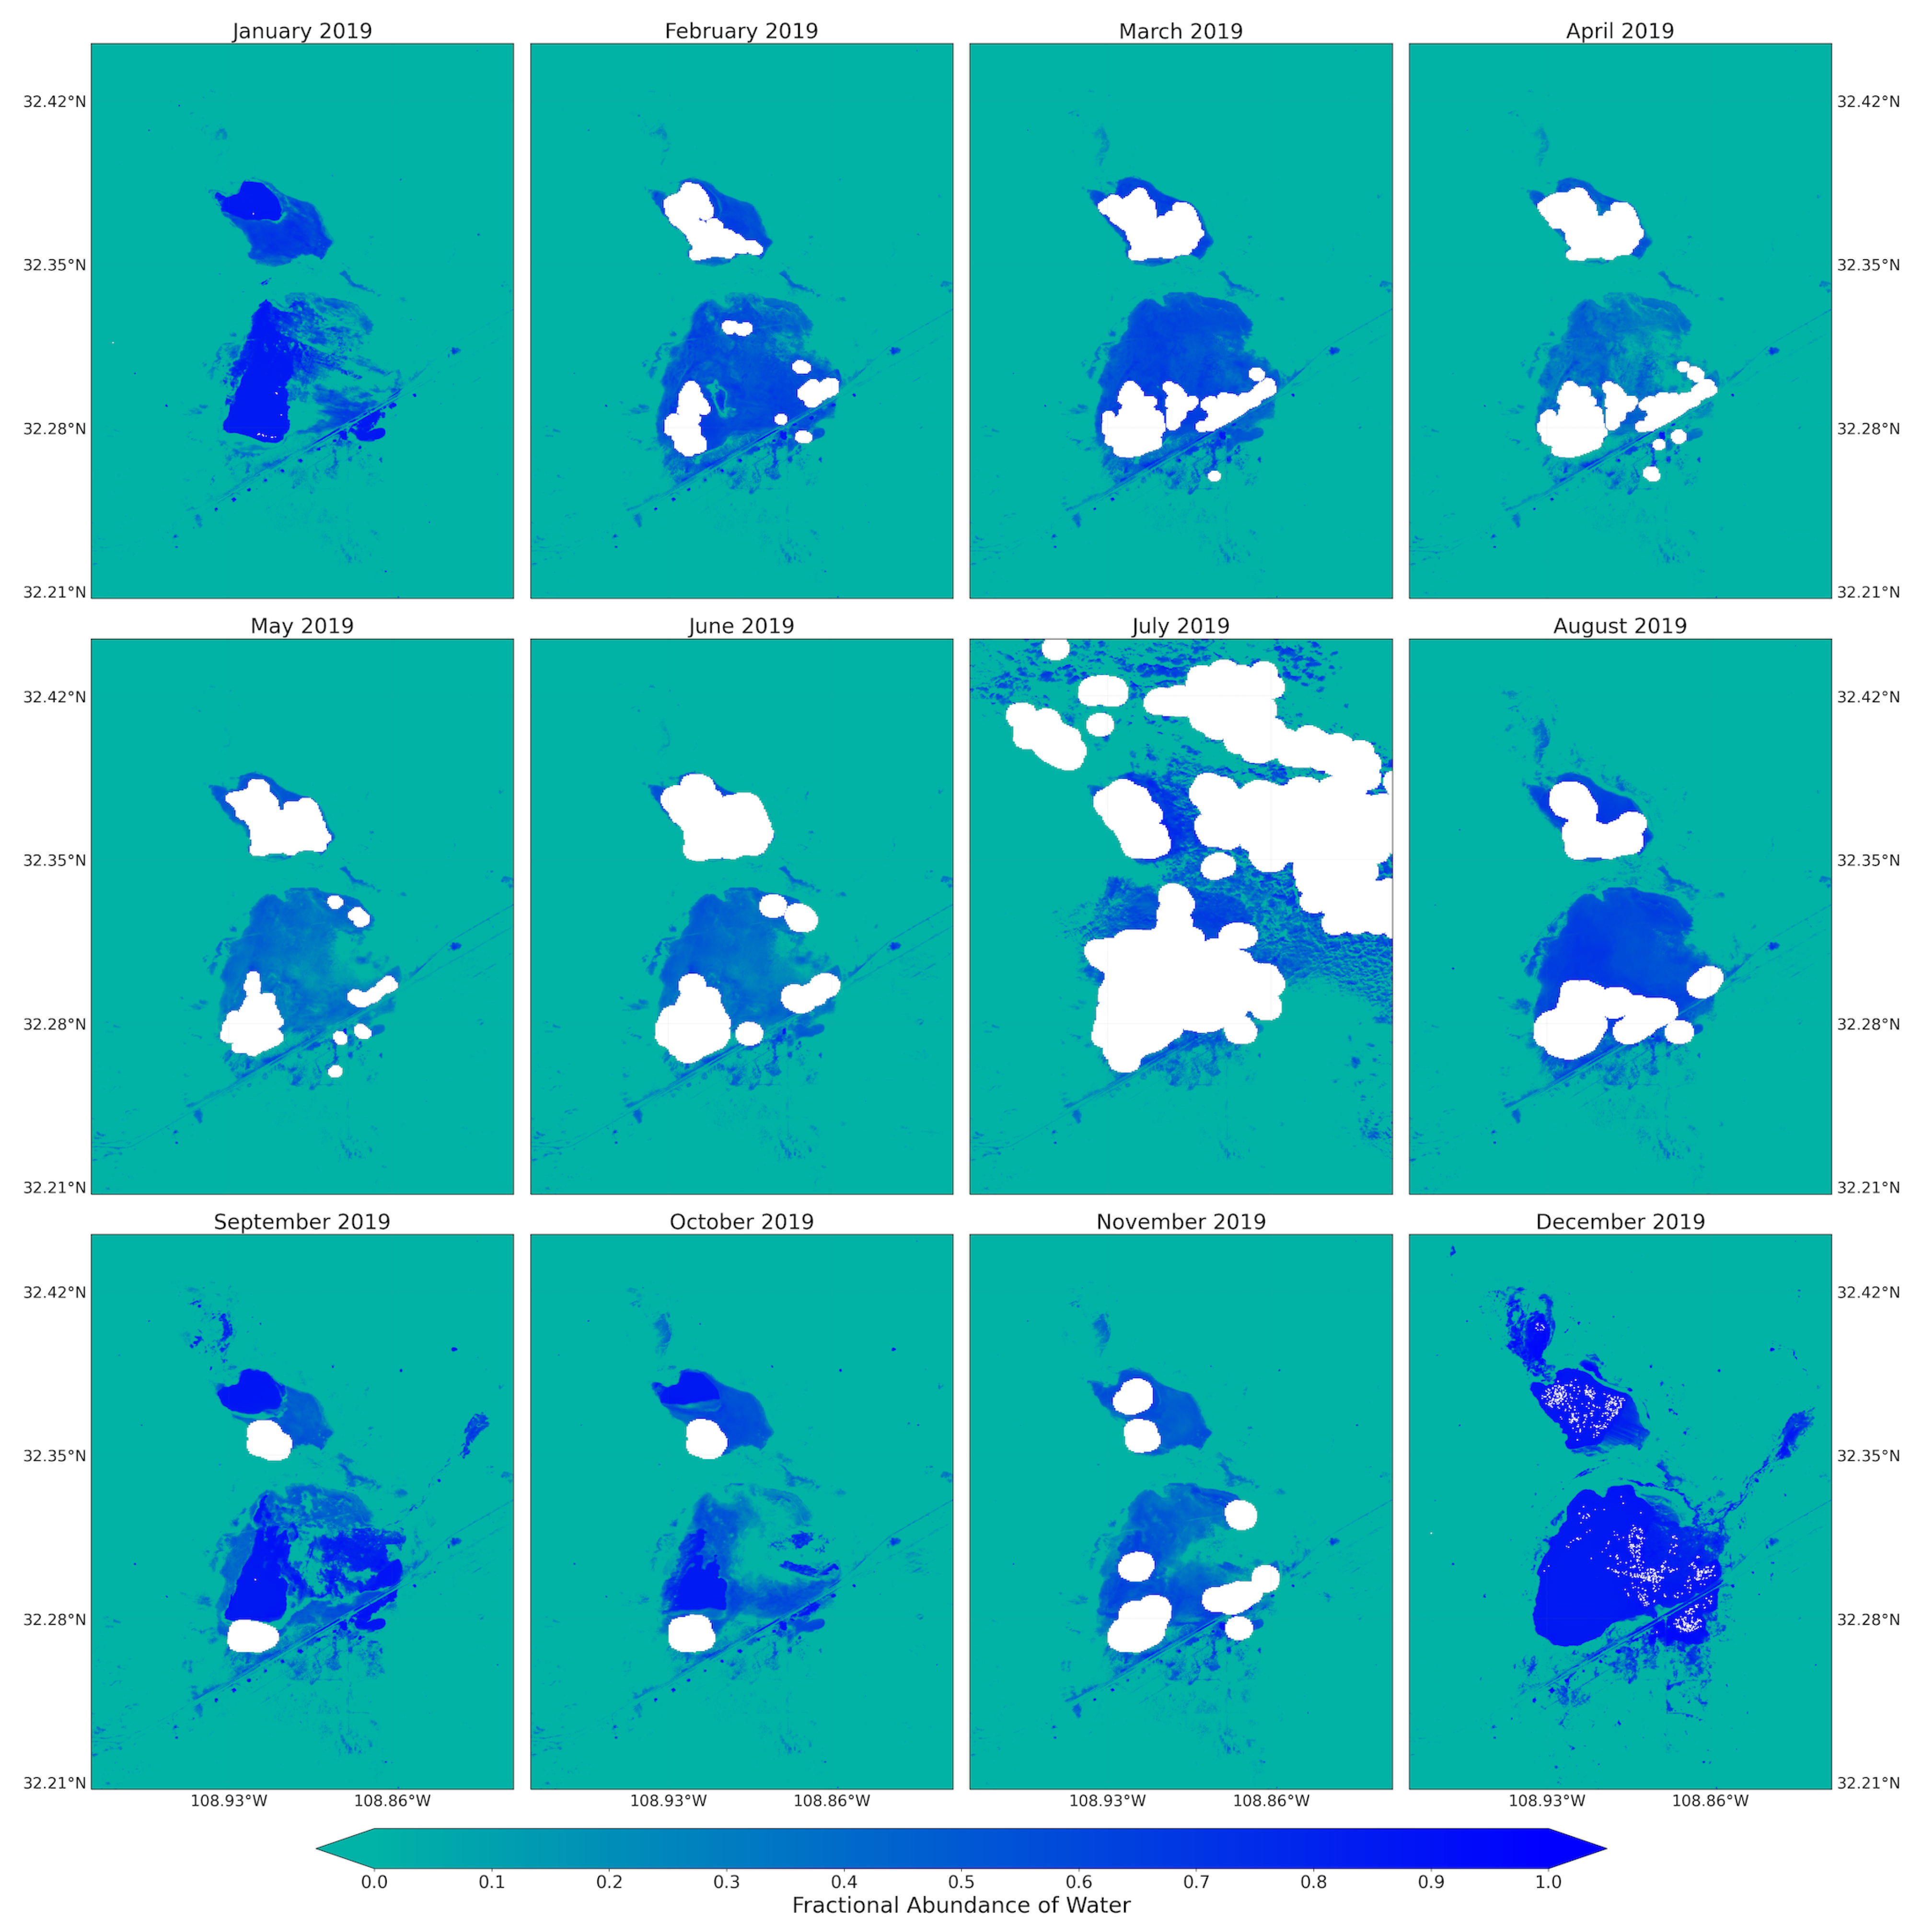
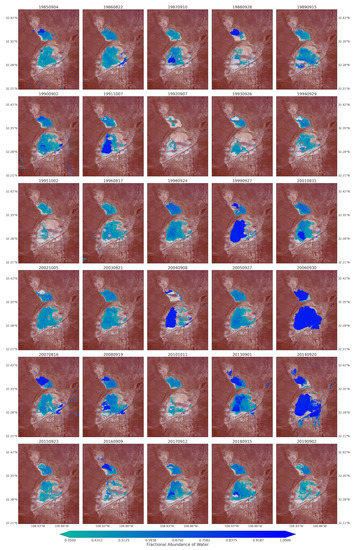
Figure A7.
Water coverage over the Lordsburg Playa processed from the fractional abundance of water that was retrieved from Landsat Images for summer/fall season between 1984 and 2019.
Figure A7.
Water coverage over the Lordsburg Playa processed from the fractional abundance of water that was retrieved from Landsat Images for summer/fall season between 1984 and 2019.
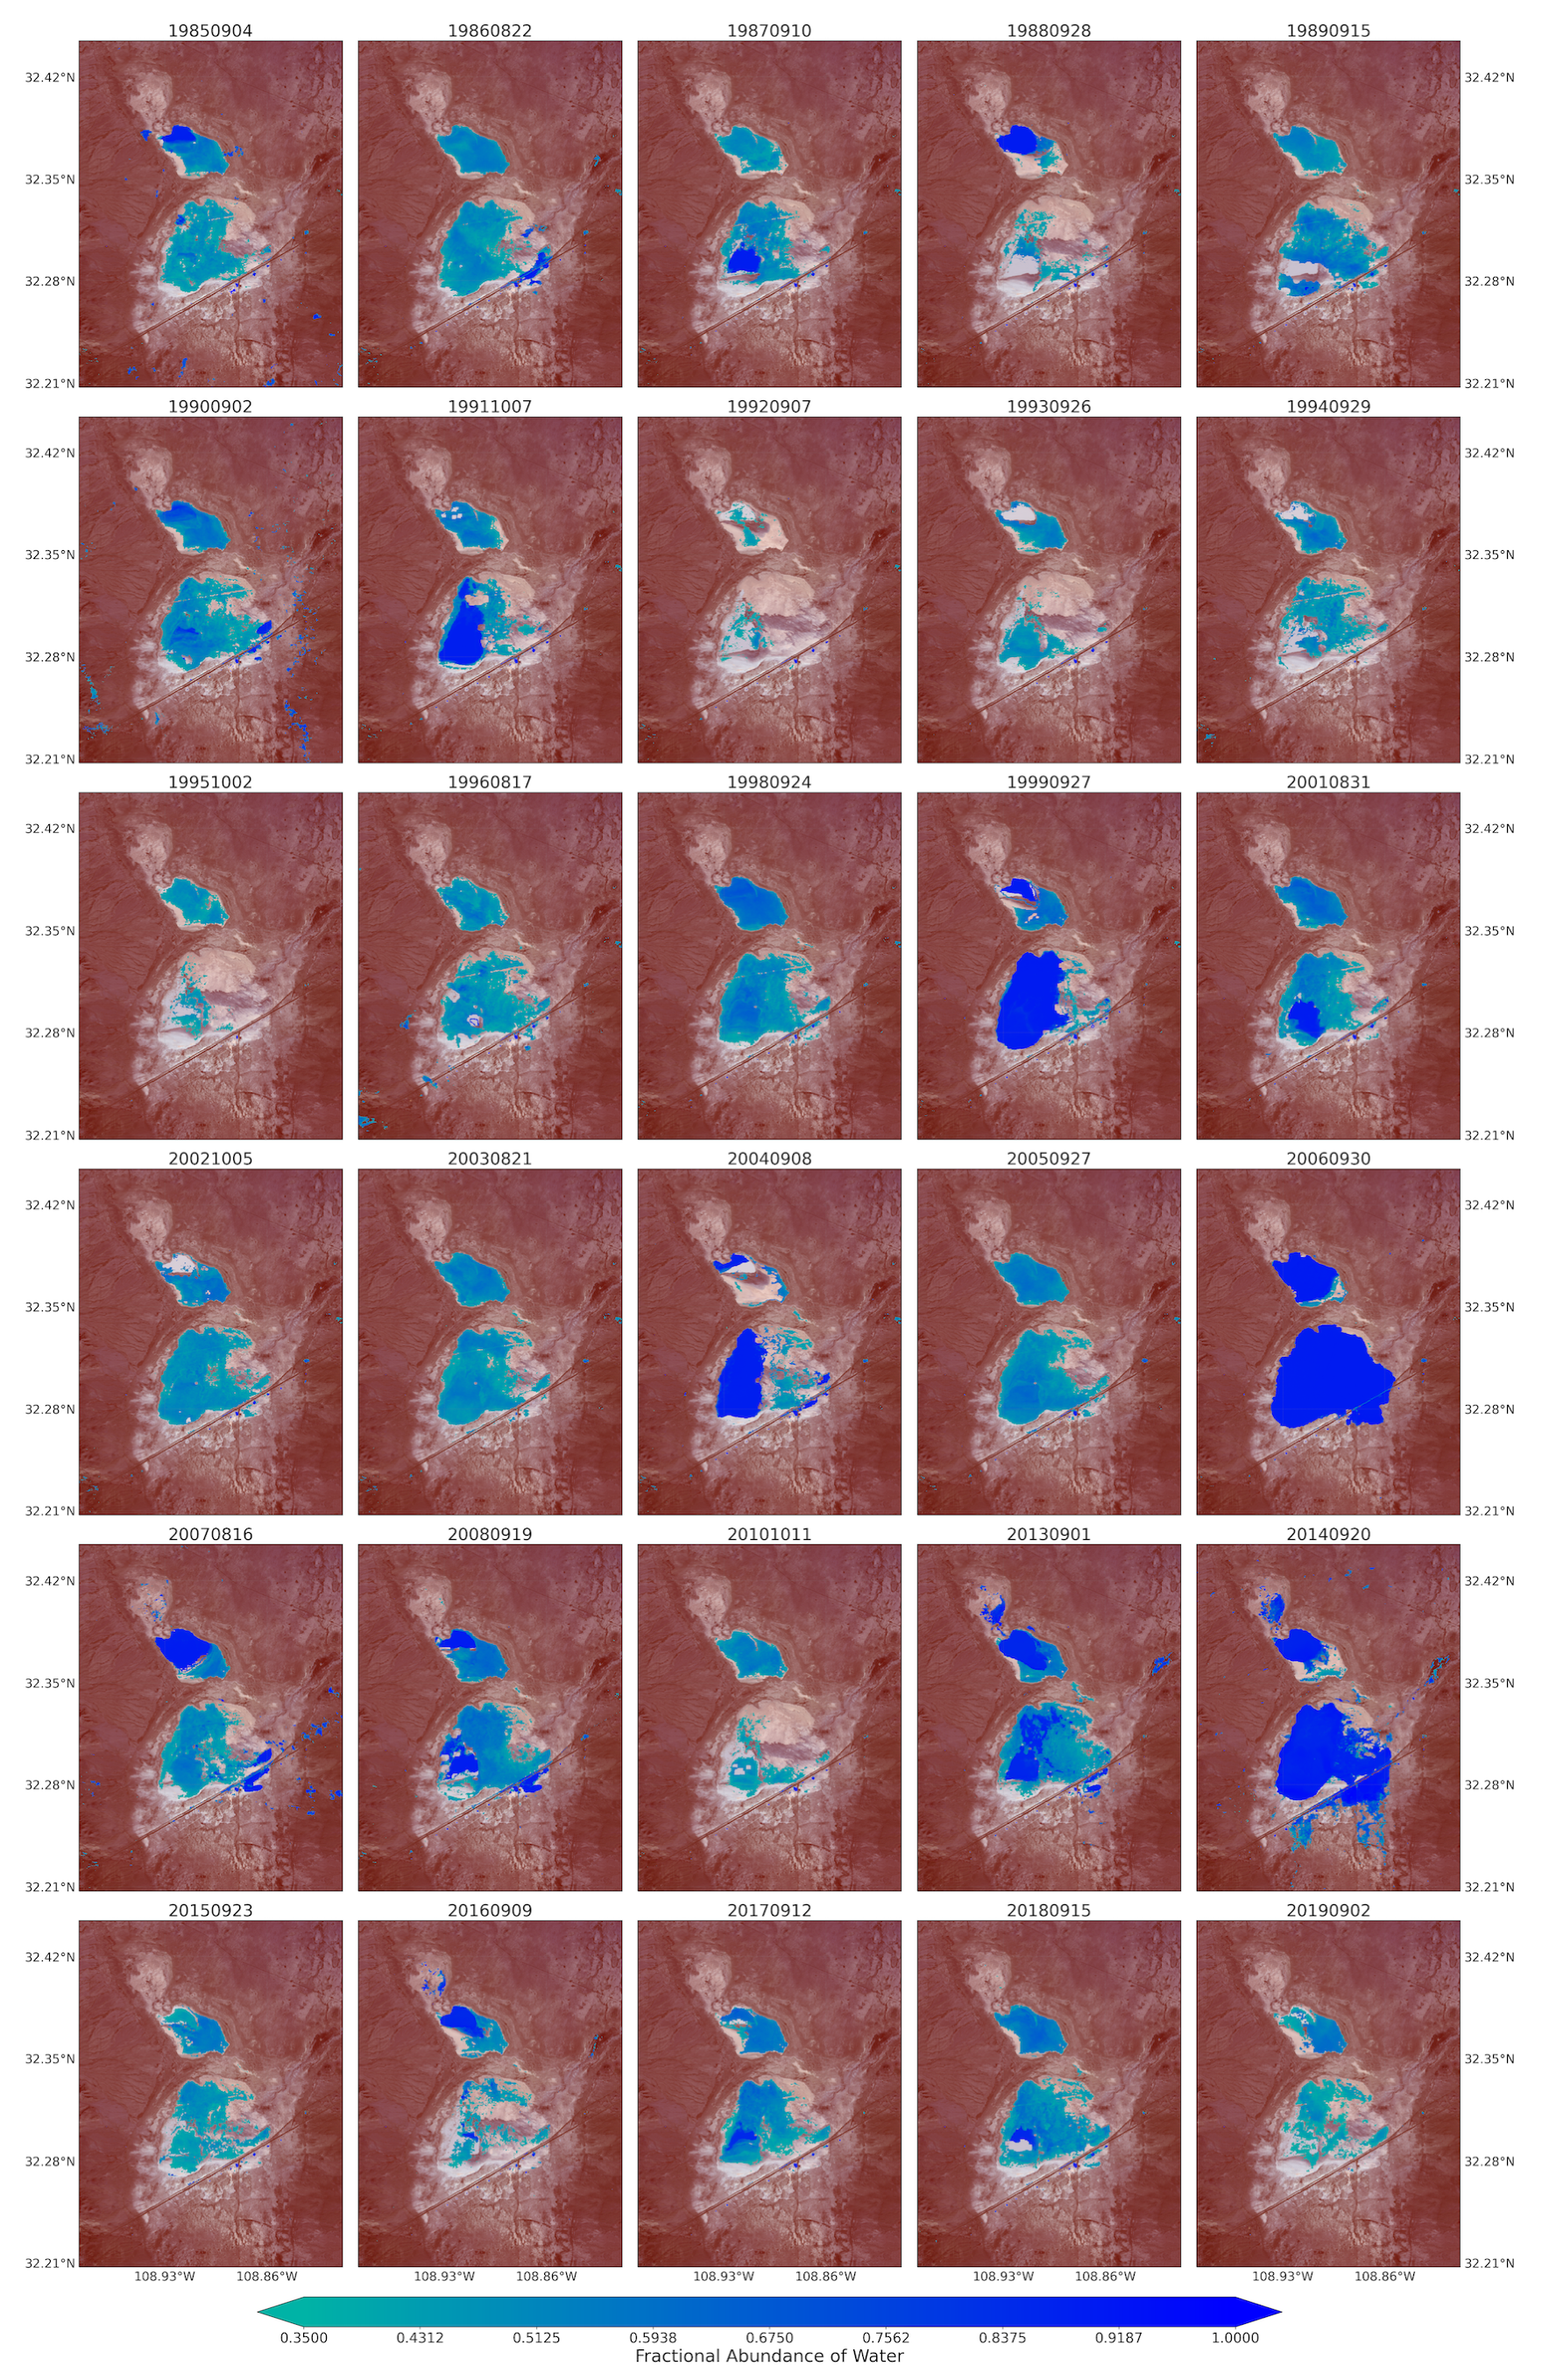
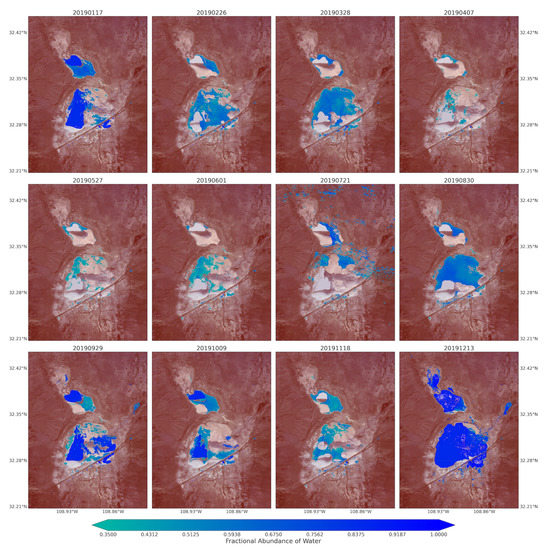
Figure A8.
Monthly water coverage over the Lordsburg Playa processed from the fractional abundance of water that was retrieved from Sentinel-2 Images between January and December 2019.
Figure A8.
Monthly water coverage over the Lordsburg Playa processed from the fractional abundance of water that was retrieved from Sentinel-2 Images between January and December 2019.
References
- Gill, T. Eolian sediments generated by anthropogenic disturbance of playas: Human impacts on the geomorphic system and geomorphic impacts on the human system. Geomorphology 1996, 17, 207–228. [Google Scholar] [CrossRef]
- Goudie, A. Dust storms and ephemeral lakes. Desert 2018, 23, 153–164. [Google Scholar] [CrossRef]
- Hahnenberger, M.; Nicoll, K. Geomorphic and land cover identification of dust sources in the eastern Great Basin of Utah, U.S.A. Geomorphology 2014, 204, 657–672. [Google Scholar] [CrossRef]
- Lee, J.A.; Baddock, M.C.; Mbuh, M.J.; Gill, T.E. Geomorphic and land cover characteristics of aeolian dust sources in West Texas and eastern New Mexico, USA. Aeolian Res. 2012, 3, 459–466. [Google Scholar] [CrossRef]
- Warren, A.; Chappell, A.; Todd, M.C.; Bristow, C.; Drake, N.; Engelstaedter, S.; Martins, V.; M’bainayel, S.; Washington, R. Dust-raising in the dustiest place on earth. Geomorphology 2007, 92, 25–37. [Google Scholar] [CrossRef]
- Prospero, J.M.; Ginoux, P.; Torres, O.; Nicholson, S.E.; Gill, T.E. Environmental characterization of global sources of atmospheric soil dust identified with the Nimbus 7 Total Ozone Mapping Spectrometer (TOMS) absorbing aerosol product. Rev. Geophys. 2002, 40, 2-1–2-31. [Google Scholar] [CrossRef]
- Floyd, K.W.; Gill, T.E. The association of land cover with aeolian sediment production at Jornada Basin, New Mexico, USA. Aeolian Res. 2011, 3, 55–66. [Google Scholar] [CrossRef]
- Rezaei, M.; Sameni, A.; Shamsi, S.R.F.; Bartholomeus, H. Remote sensing of land use/cover changes and its effect on wind erosion potential in southern Iran. PeerJ 2016, 2016, e1948. [Google Scholar] [CrossRef] [PubMed]
- Gitz, D.; Brauer, D. Trends in Playa Inundation and Water Storage in the Ogallala Aquifer on the Texas High Plains. Hydrology 2016, 3, 31. [Google Scholar] [CrossRef]
- Osterkamp, W.R.; Wood, W.W. Playa-lake basins on the Southern High Plains of Texas and New Mexico: Part I. Hydrologic, geomorphic, and geologic evidence for their development. GSA Bull. 1987, 99, 215–223. [Google Scholar] [CrossRef]
- Ginoux, P.; Prospero, J.M.; Gill, T.E.; Hsu, N.C.; Zhao, M. Global-scale attribution of anthropogenic and natural dust sources and their emission rates based on MODIS Deep Blue aerosol products. Rev. Geophys. 2012, 50. [Google Scholar] [CrossRef]
- Todd, M.C.; Washington, R.; Martins, J.V.; Dubovik, O.; Lizcano, G.; M’Bainayel, S.; Engelstaedter, S. Mineral dust emission from the Bodélé Depression nothern Chad, during BoDEx 2005. J. Geophys. Res. Atmos. 2007, 112, D06207. [Google Scholar] [CrossRef]
- Vickery, K.J.; Eckardt, F.D.; Bryant, R.G. A sub-basin scale dust plume source frequency inventory for southern Africa, 2005–2008. Geophys. Res. Lett. 2013, 40, 5274–5279. [Google Scholar] [CrossRef]
- Cahill, T.A.; Gill, T.E.; Reid, J.S.; Gearhart, E.A.; Gillette, D.A. Saltating Particles, Playa Crusts and Dust Aerosols at Owens (Dry) Lake, California. Earth Surf. Process. Landforms 1996, 21, 621–639. [Google Scholar] [CrossRef]
- Gillette, D.A. Sand flux in the northern Chihuahuan desert, New Mexico, USA, and the influence of mesquite-dominated landscapes. J. Geophys. Res. 2004, 109. [Google Scholar] [CrossRef]
- Baddock, M.C.; Gill, T.E.; Bullard, J.E.; Acosta, M.D.; Rivera Rivera, N.I. Geomorphology of the Chihuahuan Desert based on potential dust emissions. J. Maps 2011, 7, 249–259. [Google Scholar] [CrossRef]
- Lu, H.; Shao, Y. Toward quantitative prediction of dust storms: An integrated wind erosion modelling system and its applications. Environ. Model. Softw. 2001, 16, 233–249. [Google Scholar] [CrossRef]
- Rashki, A.; Kaskaoutis, D.G.; Goudie, A.S.; Kahn, R.A. Dryness of ephemeral lakes and consequences for dust activity: The case of the Hamoun drainage basin, Southeastern Iran. Sci. Total Environ. 2013, 463–464, 552–564. [Google Scholar] [CrossRef] [PubMed]
- Reynolds, R.; Bogle, R.; Vogel, J.; Goldstein, H.; Yount, J. Dust emission at Franklin Lake Playa, Mojave Desert (USA): Response to meteorological and hydrologic changes 2005–2008. Nat. Resour. Environ. Issues 2009, 15, 18. [Google Scholar]
- Sweeney, M.R.; McDonald, E.V.; Etyemezian, V. Quantifying dust emissions from desert landforms, eastern Mojave Desert, USA. Geomorphology 2011, 135, 21–34. [Google Scholar] [CrossRef]
- Webb, N.P.; Strong, C.L. Soil erodibility dynamics and its representation for wind erosion and dust emission models. Aeolian Res. 2011, 3, 165–179. [Google Scholar] [CrossRef]
- Scheidt, S.; Ramsey, M.; Lancaster, N. Determining soil moisture and sediment availability at White Sands Dune Field, New Mexico, from apparent thermal inertia data. J. Geophys. Res. Earth Surf. 2010, 115. [Google Scholar] [CrossRef]
- Whitney, J.W.; Breit, G.N.; Buckingham, S.E.; Reynolds, R.L.; Bogle, R.C.; Luo, L.; Goldstein, H.L.; Vogel, J.M. Aeolian responses to climate variability during the past century on Mesquite Lake Playa, Mojave Desert. Geomorphology 2015, 230, 13–25. [Google Scholar] [CrossRef]
- Raupach, M.R.; Gillette, D.A.; Leys, J.F. The effect of roughness elements on wind erosion threshold. J. Geophys. Res. 1993, 98, 3023–3029. [Google Scholar] [CrossRef]
- Webb, N.P.; Okin, G.S.; Brown, S. The effect of roughness elements on wind erosion: The importance of surface shear stress distribution. J. Geophys. Res. 2014, 119, 6066–6084. [Google Scholar] [CrossRef]
- Li, J.; Okin, G.S.; Alvarez, L.; Epstein, H. Quantitative effects of vegetation cover on wind erosion and soil nutrient loss in a desert grassland of southern New Mexico, USA. Biogeochemistry 2007, 85, 317–332. [Google Scholar] [CrossRef]
- Munson, S.M.; Belnap, J.; Okin, G.S. Responses of wind erosion to climate-induced vegetation changes on the Colorado Plateau. Proc. Natl. Acad. Sci. USA 2011, 108, 3854–3859. [Google Scholar] [CrossRef]
- Miri, A.; Dragovich, D.; Dong, Z. Vegetation morphologic and aerodynamic characteristics reduce aeolian erosion. Sci. Rep. 2017, 7. [Google Scholar] [CrossRef]
- Okin, G.S. A new model of wind erosion in the presence of vegetation. J. Geophys. Res. Earth Surf. 2008, 113. [Google Scholar] [CrossRef]
- Suter-Burri, K.; Gromke, C.; Leonard, K.C.; Graf, F. Spatial patterns of aeolian sediment deposition in vegetation canopies: Observations from wind tunnel experiments using colored sand. Aeolian Res. 2013, 8, 65–73. [Google Scholar] [CrossRef]
- Bryant, R.G. Monitoring hydrological controls on dust emissions: Preliminary observations from Etosha Pan, Namibia. Geogr. J. 2003, 169, 131–141. [Google Scholar] [CrossRef]
- Pelletier, J.D.; Cook, J.P. Deposition of playa windblown dust over geologic time scales. Geology 2005, 33, 909–912. [Google Scholar] [CrossRef]
- Mahowald, N.M.; Bryant, R.G.; del Corral, J.; Steinberger, L. Ephemeral lakes and desert dust sources. Geophys. Res. Lett. 2003, 30. [Google Scholar] [CrossRef]
- Stout, J.E. Seasonal variations of saltation activity on a high plains saline playa: Yellow lake, Texas. Phys. Geogr. 2003, 24, 61–76. [Google Scholar] [CrossRef][Green Version]
- Torgersen, T. Wind effects on water and salt loss in playa lakes. J. Hydrol. 1984, 74, 137–149. [Google Scholar] [CrossRef]
- Luo, H.R.; Smith, L.M.; Haukos, D.A.; Allen, B.L. Sources of recently deposited sediments in playa wetlands. Wetlands 1999, 19, 176–181. [Google Scholar] [CrossRef]
- Kok, J.F.; Parteli, E.J.R.; Michaels, T.I.; Karam, D.B. The physics of wind-blown sand and dust. Rep. Prog. Phys. 2012, 75, 106901. [Google Scholar] [CrossRef]
- Shao, Y.; Raupach, M.R.; Findlater, P.A. Effect of Saltation Bombardment on the Entrainment of Dust by Wind. Geophys. Res. Atmos. 1993, 98, 12719–12726. [Google Scholar] [CrossRef]
- Gill, T.; Dubois, D.; Eibedingil, I.; Fuentes, J.; Jin, L.; Li, J.; Mendez, M.; Tatarko, J.; Scott Van Pelt, R.; Webb, N. Assessing the Acute Safety Hazard to Highway Transportation from Blowing Dust at Lordsburg Playa, New Mexico. In Proceedings of the Transportation, Air Quality, and Health Symposium, Austin, TX, USA, 18–20 February 2019. [Google Scholar]
- Botkin, T.; Hutchinson, B. 2020 Lordsburg Playa Dust Storm Mitigation Update; In Proceedings of the Southern Arizona Dust Storm Workshop. Coolidge, AZ, USA, 3 March 2020. Available online: https://www.weather.gov/media/psr/Dust/2020/9_BOTKIN_DustMitigation_AZ_2020.pdf (accessed on 16 July 2021).
- U.S. Department of the Interior, Bureau of Land Management. Road Forks Dust Mitigation Project; Technical Report; U.S. Department of the Interior: Las Cruses, NM, USA, 2008.
- Van Pelt, R.S.; Tatarko, J.; Gill, T.E.; Chang, C.; Li, J.; Eibedingil, I.G.; Mendez, M. Dust emission source characterization for visibility hazard assessment on Lordsburg Playa in Southwestern New Mexico, USA. Geoenviron. Disasters 2020, 7, 34. [Google Scholar] [CrossRef] [PubMed]
- Rivera Rivera, N.I.; Gill, T.E.; Bleiweiss, M.P.; Hand, J.L. Source characteristics of hazardous Chihuahuan Desert dust outbreaks. Atmos. Environ. 2010, 44, 2457–2468. [Google Scholar] [CrossRef]
- Arizona Department of Transportation. U.S. 70, Safford to New Mexico State Line Interstate Detour Needs Study (Final Report); Technical Report; Arizona Department of Transportation: Phoenix, AZ, USA, 2019. [Google Scholar]
- Alexakis, D.D.; Hadjimitsis, D.G.; Agapiou, A. Integrated use of remote sensing, GIS and precipitation data for the assessment of soil erosion rate in the catchment area of “Yialias” in Cyprus. Atmos. Res. 2013, 131, 108–124. [Google Scholar] [CrossRef]
- El-Jazouli, A.; Barakat, A.; Ghafiri, A.; El Moutaki, S.; Ettaqy, A.; Khellouk, R. Soil Erosion Modeled with USLE, GIS, and Remote Sensing: A Case Study of Ikkour Watershed in Middle Atlas (Morocco). Geosci. Lett. 2017, 4, 25. [Google Scholar] [CrossRef]
- Garg, V.; Nikam, B.R.; Thakur, P.K.; Aggarwal, S.P.; Gupta, P.K.; Srivastav, S.K. Human-induced land use land cover change and its impact on hydrology. HydroResearch 2019, 1, 48–56. [Google Scholar] [CrossRef]
- Phinzi, K.; Ngetar, N.S. The Assessment of Water-Borne Erosion at Catchment Level Using GIS-Based RUSLE and Remote Sensing: A Review. Int. Soil Water Conserv. Res. 2019, 7, 27–46. [Google Scholar] [CrossRef]
- Birkett, C.M. Synergistic remote sensing of Lake Chad: Variability of basin inundation. Remote Sens. Environ. 2000, 72, 218–236. [Google Scholar] [CrossRef]
- Bryant, R.G.; Rainey, M.P. Investigation of flood inundation on playas within the Zone of Chotts, using a time-series of AVHRR. Remote Sens. Environ. 2002, 82, 360–375. [Google Scholar] [CrossRef]
- Johnson, W.P.; Rice, M.B.; Haukos, D.A.; Thorpe, P.P. Factors influencing the occurrence of inundated playa wetlands during winter on the texas high plains. Wetlands 2011, 31, 1287–1296. [Google Scholar] [CrossRef]
- Buma, W.G.; Lee, S.I.; Seo, J.Y. Recent surface water extent of lake Chad from multispectral sensors and GRACE. Sensors 2018, 18, 2082. [Google Scholar] [CrossRef]
- Herndon, K.; Muench, R.; Cherrington, E.; Griffin, R. An assessment of surface water detection methods for water resource management in the Nigerien Sahel. Sensors 2020, 20, 431. [Google Scholar] [CrossRef]
- Tulbure, M.G.; Broich, M.; Stehman, S.V.; Kommareddy, A. Surface water extent dynamics from three decades of seasonally continuous Landsat time series at subcontinental scale in a semi-arid region. Remote Sens. Environ. 2016, 178, 142–157. [Google Scholar] [CrossRef]
- Reis, S.; Yilmaz, H.M. Temporal monitoring of water level changes in Seyfe Lake using remote sensing. Hydrol. Process. 2008, 22, 4448–4454. [Google Scholar] [CrossRef]
- Zhu, W.; Jia, S.; Lv, A. Monitoring the Fluctuation of Lake Qinghai Using Multi-Source Remote Sensing Data. Remote Sens. 2014, 6, 10457–10482. [Google Scholar] [CrossRef]
- Bastawesy, M.A.; Khalaf, F.I.; Arafat, S.M. The use of remote sensing and GIS for the estimation of water loss from Tushka lakes, southwestern desert, Egypt. J. Afr. Earth Sci. 2008, 52, 73–80. [Google Scholar] [CrossRef]
- Chappell, A.; Strong, C.; McTainsh, G.; Leys, J. Detecting induced in situ erodibility of a dust-producing playa in Australia using a bi-directional soil spectral reflectance model. Remote Sens. Environ. 2007, 106, 508–524. [Google Scholar] [CrossRef]
- Chappell, A.; Webb, N.P.; Guerschman, J.P.; Thomas, D.T.; Mata, G.; Handcock, R.N.; Leys, J.F.; Butler, H.J. Improving ground cover monitoring for wind erosion assessment using MODIS BRDF parameters. Remote Sens. Environ. 2018, 204, 756–768. [Google Scholar] [CrossRef]
- Parajuli, S.P.; Yang, Z.L.; Kocurek, G. Mapping erodibility in dust source regions based on geomorphology, meteorology, and remote sensing. J. Geophys. Res. Earth Surf. 2014, 119, 1977–1994. [Google Scholar] [CrossRef]
- Ibarrola-Ulzurrun, E.; Drumetz, L.; Marcello, J.; Gonzalo-Martin, C.; Chanussot, J. Hyperspectral Classification Through Unmixing Abundance Maps Addressing Spectral Variability. IEEE Trans. Geosci. Remote Sens. 2019, 57, 4775–4788. [Google Scholar] [CrossRef]
- Villa, A.; Member, S.; Chanussot, J.; Member, S.; Atli Benediktsson, J.; Jutten, C. Spectral Unmixing for the Classification of Hyperspectral Images at a Finer Spatial Resolution. IEEE J. Sel. Top. Signal Process. 2011, 5, 521. [Google Scholar] [CrossRef]
- Orlovsky, L.; Kaplan, S.; Orlovsky, N.; Blumberg, D.; Mamedov, E. Monitoring land use and land cover changes in Turkmenistan using remote sensing Management of Natural Resources, Sustainable Development and Ecological Hazards 463. Trans. Ecol. Environ. 2006, 99, 1743–3541. [Google Scholar] [CrossRef]
- Keshava, N.; Mustard, J.F. Spectral unmixing. IEEE Signal Process. Mag. 2002, 19, 44–57. [Google Scholar] [CrossRef]
- Krider, P.R. Paleoclimatic significance of late Quaternary Lacustrine and alluvial stratigraphy, Animas Valley, New Mexico. Quat. Res. 1998, 50, 283–289. [Google Scholar] [CrossRef]
- Scuderi, L.A.; Laudadio, C.K.; Fawcett, P.J. Monitoring playa lake inundation in the western United States: Modern analogues to late-Holocene lake level change. Quat. Res. 2010, 73, 48–58. [Google Scholar] [CrossRef]
- Allen, B.D. Ice age lakes in New Mexico. New Mex. Mus. Nat. Hist. Sci. Bull. 2005, 28, 107–113. [Google Scholar]
- Cox, D.N. Soil Survey of Hidalgo County, New Mexico; US Soil Conservation Service: Washington, DC, USA, 1973. [Google Scholar]
- Botkin, T.; Hutchinson, B. Dust Storm Mitigation Update; In Proceedings of the Southern Arizona Dust Storm Workshop, Coolidge, AZ, USA, 5 March, 2019.
- Soil Survey Staff, Natural Resources Conservation Service, USDA. Web Soil Survey. 2019. Available online: http://websoilsurvey.sc.egov.usda.gov/ (accessed on 27 March 2020).
- Gascon, F.; Bouzinac, C.; Thépaut, O.; Jung, M.; Francesconi, B.; Louis, J.; Lonjou, V.; Lafrance, B.; Massera, S.; Gaudel-Vacaresse, A.; et al. Copernicus Sentinel-2A Calibration and Products Validation Status. Remote Sens. 2017, 9, 584. [Google Scholar] [CrossRef]
- Joshi, N.; Baumann, M.; Ehammer, A.; Fensholt, R.; Grogan, K.; Hostert, P.; Jepsen, M.; Kuemmerle, T.; Meyfroidt, P.; Mitchard, E.; et al. A Review of the Application of Optical and Radar Remote Sensing Data Fusion to Land Use Mapping and Monitoring. Remote Sens. 2016, 8, 70. [Google Scholar] [CrossRef]
- Dusseux, P.; Corpetti, T.; Hubert-Moy, L.; Corgne, S. Combined Use of Multi-Temporal Optical and Radar Satellite Images for Grassland Monitoring. Remote Sens. 2014, 6, 6163–6182. [Google Scholar] [CrossRef]
- Erasmi, S.; Twele, A. Regional land cover mapping in the humid tropics using combined optical and SAR satellite data—A case study from Central Sulawesi, Indonesia. Int. J. Remote Sens. 2009, 30, 2465–2478. [Google Scholar] [CrossRef]
- Wijedasa, L.S.; Sloan, S.; Michelakis, D.G.; Clements, G.R. Overcoming Limitations with Landsat Imagery for Mapping of Peat Swamp Forests in Sundaland. Remote Sens. 2012, 4, 2595–2618. [Google Scholar] [CrossRef]
- Gorelick, N.; Hancher, M.; Dixon, M.; Ilyushchenko, S.; Thau, D.; Moore, R. Google Earth Engine: Planetary-scale geospatial analysis for everyone. Remote Sens. Environ. 2017, 202, 18–27. [Google Scholar] [CrossRef]
- U.S. Geological Survey. Tracking Change Over Time-Understanding Remote Sensing Landsat Uses; Technical Report; U.S. Geological Survey: Reston, VA, USA, 2016.
- U.S. Geological Survey. Landsat Missions. 2020. Available online: https://www.usgs.gov/core-science-systems/nli/landsat/landsat-satellite-missions?qt-science_support_page_related_con=2#qt-science_support_page_related_con (accessed on 1 April 2020).
- European Space Agency. Sentinel-2 User Handbook Issue 1 Revision 1 SENTINEL-2 User Handbook; Technical Report; European Space Agency: Paris, France, 2013. [Google Scholar]
- Kokaly, R.F.; Clark, R.N.; Swayze, G.A.; Livo, K.E.; Hoefen, T.M.; Pearson, N.C.; Wise, R.A.; Benzel, W.M.; Lowers, H.A.; Driscoll, R.L.; et al. USGS Spectral Library Version 7; Technical Report; U.S. Geological Survey: Reston, VA, USA, 2017. [Google Scholar] [CrossRef]
- Torres, R.; Snoeij, P.; Geudtner, D.; Bibby, D.; Davidson, M.; Attema, E.; Potin, P.; Rommen, B.Ö.; Floury, N.; Brown, M.; et al. GMES Sentinel-1 mission. Remote Sens. Environ. 2012, 120, 9–24. [Google Scholar] [CrossRef]
- European Space Agency. Copernicus Sentinel Data. 2017. Available online: https://search.asf.alaska.edu/#/ (accessed on 9 April 2020).
- Bangira, T.; Alfieri, S.; Menenti, M.; van Niekerk, A.; Vekerdy, Z. A Spectral Unmixing Method with Ensemble Estimation of Endmembers: Application to Flood Mapping in the Caprivi Floodplain. Remote Sens. 2017, 9, 1013. [Google Scholar] [CrossRef]
- Du, Y.; Zhang, Y.; Ling, F.; Wang, Q.; Li, W.; Li, X. Water bodies’ mapping from Sentinel-2 imagery with Modified Normalized Difference Water Index at 10-m spatial resolution produced by sharpening the swir band. Remote Sens. 2016, 8, 354. [Google Scholar] [CrossRef]
- Rong, W.; Li, Z.; Zhang, W.; Sun, L. An improved Canny edge detection algorithm. In Proceedings of the 2014 IEEE International Conference on Mechatronics and Automation, Tianjin, China, 3–6 August 2014; pp. 577–582. [Google Scholar] [CrossRef]
- Rosen, P.A.; Hensley, S.; Joughin, I.R.; Li, F.K.; Madsen, S.N.; Rodriguez, E.; Goldstein, R.M. Synthetic aperture radar interferometry. Proc. IEEE 2000, 88, 333–382. [Google Scholar] [CrossRef]
- Chen, C.W.; Zebker, H.A. Two-dimensional phase unwrapping with use of statistical models for cost functions in nonlinear optimization. JOSA A 2001, 18, 338–351. [Google Scholar] [CrossRef] [PubMed]
- Acharya, T.D.; Subedi, A.; Lee, D.H. Evaluation of water indices for surface water extraction in a landsat 8 scene of Nepal. Sensors 2018, 18, 2580. [Google Scholar] [CrossRef]
- García-Haro, F.J.; Gilabert, M.A.; Meliá, J. Linear spectral mixture modelling to estimate vegetation amount from optical spectral data. Int. J. Remote Sens. 1996, 17, 3373–3400. [Google Scholar] [CrossRef]
- Boukabara, S.A.; Krasnopolsky, V.; Penny, S.G.; Stewart, J.Q.; McGovern, A.; Hall, D.; Hoeve, J.E.T.; Hickey, J.; Huang, H.L.A.; Hoffman, R.N.; et al. Outlook for Exploiting Artificial Intelligence in the Earth and Environmental Sciences. Bull. Am. Meteorol. Soc. 2021, 102, E1016–E1032. [Google Scholar] [CrossRef]
Publisher’s Note: MDPI stays neutral with regard to jurisdictional claims in published maps and institutional affiliations. |
© 2021 by the authors. Licensee MDPI, Basel, Switzerland. This article is an open access article distributed under the terms and conditions of the Creative Commons Attribution (CC BY) license (https://creativecommons.org/licenses/by/4.0/).

