Review

A Review of Voxel-Based Computerized Ionospheric Tomography with GNSS Ground Receivers

1
National Astronomical Observatories, Chinese Academy of Sciences, Beijing 100101, China
2
School of Astronomy and Space Science, University of Chinese Academy of Sciences, Beijing 100049, China
*
Author to whom correspondence should be addressed.
Remote Sens. 2021, 13(17), 3432; https://doi.org/10.3390/rs13173432
Submission received: 19 July 2021 / Revised: 15 August 2021 / Accepted: 25 August 2021 / Published: 29 August 2021
(This article belongs to the Special Issue Environmental Research with Global Navigation Satellite System (GNSS))

Abstract

:
Ionized by solar radiation, the ionosphere causes a phase rotation or time delay to trans-ionospheric radio waves. Reconstruction of ionospheric electron density profiles with global navigation satellite system (GNSS) observations has become an indispensable technique for various purposes ranging from space physics studies to radio applications. This paper conducts a comprehensive review on the development of voxel-based computerized ionospheric tomography (CIT) in the last 30 years. A brief introduction is given in chronological order starting from the first report of CIT with simulation to the newly proposed voxel-based algorithms for ionospheric event analysis. The statement of the tomographic geometry and voxel models are outlined with the ill-posed and ill-conditioned nature of CIT addressed. With the additional information from other instrumental observations or initial models supplemented to make the coefficient matrix less ill-conditioned, equation constructions are categorized into constraints, virtual data assimilation and multi-source observation fusion. Then, the paper classifies and assesses the voxel-based CIT algorithms of the algebraic method, statistical approach and artificial neural networks for equation solving or electron density estimation. The advantages and limitations of the algorithms are also pointed out. Moreover, the paper illustrates the representative height profiles and two-dimensional images of ionospheric electron densities from CIT. Ionospheric disturbances studied with CIT are presented. It also demonstrates how the CIT benefits ionospheric correction and ionospheric monitoring. Finally, some suggestions are provided for further research about voxel-based CIT.

Graphical Abstract

1. Introduction

The ionospheric electron density (IED) is one of the essential parameters to characterize the upper atmosphere of the earth and manifest the solar–terrestrial relation. It also has practical importance in systems related to ionospheric or trans-ionospheric radio wave propagations. For several decades, the measurement of the IED has mainly relied on ionosondes which utilize ionospheric reflections of different wavelengths and can only observe the bottom side ionosphere. The full-height IED profiles can be reconstructed with the measurements of a set of total electron content (TEC) values from satellite beacons. As the ionospheric TEC is an integrated value of the IED along the ray path from a satellite to a receiver, this is analogous to computerized tomography (CT), which has been intensively studied for applications in various fields [1,2].
In computerized ionospheric tomography (CIT), the ionosphere is divided into three-dimensional voxels, and some voxels are not traversed by any satellite-receiver rays. Therefore, CIT is basically an ill-posed inverse problem. The discrete approximation to the integral leads to a solution of IED being highly sensitive to the errors contaminated in TEC data, which is known as an ill-conditioned problem. The early efforts of CIT were made toward solving these thorny problems. Austen et al. (1986) [3] produced the first two-dimensional image of the IED by applying the algebraic reconstruction technique (ART) to the modeled TEC data from the polar-orbiting satellite with computer simulation. The first experimental result of CIT was the latitude-altitude IED profile over the ionospheric trough based on radio signals from Soviet/Russian Parus [4]. With American navy navigational satellite system (NNSS), Fremouw et al. (1992) [5] and Kunitake et al. (1995) [6] reconstructed two-dimensional ionospheric distribution by incorporating prior information to complement non-uniform path integral data or incomplete measurements. With the advent of global navigation satellite system (GNSS), three-dimensional ionospheric reconstruction from high orbital satellites was demonstrated in [7]. While GNSS observation on a low earth orbit (LEO) satellite was used to inverse the ionospheric profiles at the tangent point [8], Hernández-Pajares et al. (1998) [9] developed a method to reconstruct the three-dimensional IED distribution on a global scale by using both receivers on ground and LEO satellites. This added horizontal satellite-receiver rays and increased the altitudinal resolution of IED. Instead of using LEO GNSS observations, Garcia-Fernandez et al. (2003) [10] first proposed a method to estimate the IED by combining the ionosonde measurements and the ground GNSS data. Meanwhile, three-dimensional IED reconstruction with high spatial-temporal resolution has been studied with regional GNSS networks [11]. A detailed report of the early research on CIT can be found in the comprehensive review by Bust and Mitchell (2008) [12].
In recent years, the development of CIT has proceeded rapidly with its applications in ionospheric studies. Wen et al. (2007) [13] investigated the temporal and spatial variations in IED during a magnetic storm. Thampi et al. (2011) [14] investigated the correlations between the electron density enhancements and equatorial ionospheric anomaly (EIA) as well as summer nighttime anomaly. Chen et al. (2016) [15] analyzed medium-scale traveling ionospheric disturbances (MSTIDs) and Nesterov et al. (2017) [16] proposed some ionospheric perturbation indexes based on tomography results. Andreeva et al. (2017) [17] analyzed the position, geometry and depth of the ionization trough in different space weather conditions.
Since the last review of CIT in 2008 [12], many investigations in this research field have been accomplished. Despite the capability and significance of available CIT techniques, it is still difficult to solve the ill-conditioned problem even with the densest GNSS network [15]. In addition, new problems have also been posed on CIT with the progress of ionospheric research. Restricted to voxel-based CIT with GNSS ground receivers, this paper tries to revisit the problems and classifies them into improvements in voxel-based models, equation constructions and algorithms. The voxel-based models are about the variabilities in the voxels, including geometry, size, and homogeneity. The equation constructions mainly focus on the increase of the condition number from empirical models, virtual observations, and multi-source data. The algorithms include the mathematical algorithms classified into non-iterative reconstruction methods and iterative reconstruction methods in [18]. With the development of the tomographic techniques, voxel-based CIT provides a new insight to identify vertical ionospheric structures and their variations. Moreover, ionospheric morphology and dynamics have been perceived over various temporal and spatial scales.
This paper is organized as follows: Section 2 describes the principle of CIT, from the extraction of TEC to the establishment of the tomography equation. Section 3, Section 4 and Section 5 review the improvements of CIT in voxel-based models, equation constructions and algorithms, respectively. In Section 6, the representative ionospheric height profiles and images from CIT are provided, and the main applications are presented. In Section 7, the future development trends of CIT are discussed. Finally, a summary is conducted in Section 8.

2. Statement of Tomography Problem

The ionosphere is a dispersive medium and its refraction effect is proportional to the ionospheric TEC along the radio signal. For GNSS, we have:
I = 40.3 f 2 S T E C ,
where I is the ionospheric delay and f is the frequency of the satellite signal, STEC, symbolizing slant TEC, is the line integral of the electron density along the propagation path from the satellite to the receiver:
S T E C = r s n e d l
where n e is the electron density expressed in e l / m 3 and r s d l is the line integral of the distance expressed in meters from the receiver to the satellite. Because the ionospheric refraction effect has the same magnitude, whereas opposite signs in pseudorange and carrier phase measured by a GNSS dual frequency receiver, the STEC can be extracted from the linear combination of different frequency observations:
S T E C P = f 1 f 2 2 40.3 f 1 2 f 2 2 P 2 , j i P 1 , j i + d 1 , j i d 2 , j i ,
S T E C L = f 1 f 2 2 40.3 f 1 2 f 2 2 c L 1 , j i f 1 c L 2 , j i f 2 + c N 1 , j i f 1 c N 2 , j i f 2 + c b 1 , j i f 1 c b 2 , j i f 2 ,
where S T E C P and S T E C L are extracted from pseudorange and carrier phase observations, respectively. Subscripts 1 and 2 represent the first and second frequencies of the GNSS signals, and P and L are pseudorange and carrier phase observations, respectively. Superscript i and subscript j represent the number of satellites and receivers, respectively. The symbol c is the speed of light, and N is the integer ambiguity of L . The symbols d and b are the code delay and phase advance inherent in satellite and receiver hardwares. Their differences between two frequencies are related with the inter-frequency instrumental bias. Because S T E C P contains large observation noises and S T E C L includes unknown integer ambiguities, carrier phase smoothing pseudorange is utilized to extracted STEC [19]:
S T E C t = ω t S T E C P t + 1 ω t S T E C t 1 + S T E C L t S T E C L t 1     ( t > 1 ) ,
where t stands for the epoch and ω t is the weight related to the elevation angle. S T E C is equal to S T E C P when t = 1 . The instrumental biases of satellites and receivers between different frequency observations should be eliminated by parameter estimation in tomography problems [11] or estimated in two-dimensional ionospheric derivation or precise point positioning (PPP) [20]. It is also workable to extract STEC by only using S T E C L to avoid the larger noise in pseudorange measurement. In this case, the instrumental biases and the integer ambiguities are combined [21].
Although mathematically and physically different ionospheric models bring inconsistency in the results, the priority is given to solve the ill-conditioned problem. Based on the ionospheric single layer model in Figure 1, the instrumental biases can be estimated by the grid method or the polynomial method such as the spherical harmonic polynomial and the generalized trigonometric series function [22,23,24]. In addition, the ionospheric two-layer model is an alternative method to estimate the instrumental biases [25].
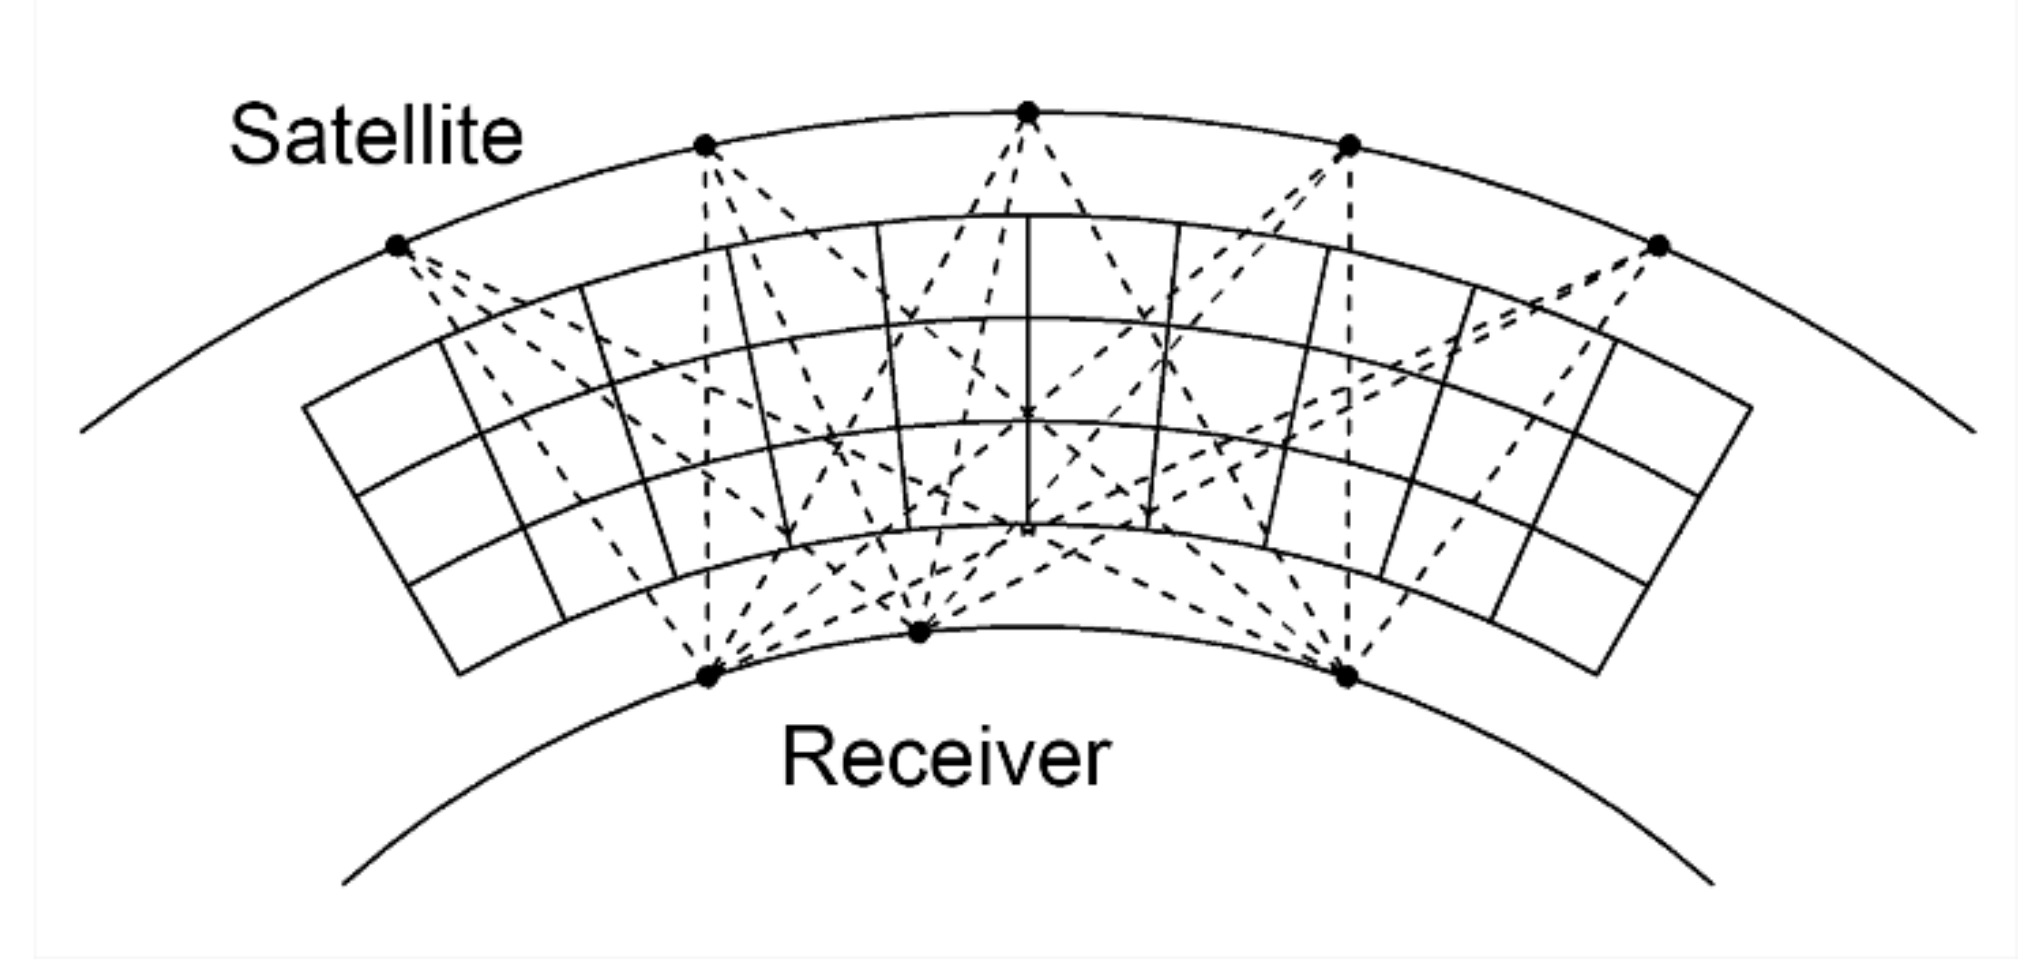
The tomography problem requires the line integral through the medium of the unknown parameter to be taken as the measured data. With a multi-station GNSS network, trans-ionospheric TEC extracted from the observations fulfills this requirement. In CIT, a day is divided into a series of time periods, and a time period is usually 30 min. The ionosphere is divided into a few three-dimensional voxels as depicted in Figure 2. The electron density value in a voxel is assumed to be identical during a time period and has a potential change over different time periods. Therefore, the STEC obtained from Equation (5) can be regarded as the line integral of the IED along the propagation path i and represented as a finite sum over the voxels j :
S T E C i = j = 1 n A i j I D E j + ε i     i = 1 , 2 , , m ,
where n and m are the numbers of voxels and STEC measurements, respectively; A i j is the intercept matrix of the rays in the voxels; ε i is the error including the instrumental biases and other discretization errors. Combined with all the observations, Equation (6) can be formulated as:
S T E C m × 1 = A m × n I D E n × 1 + ε m × 1 ,
However, limited by the quantity of the satellite-receiver rays, some voxels are not traversed by any rays and the coupling of the rays is weak. Equation (7) is ill-posed and ill-conditioned. To solve it, various methods were proposed and are presented in the following Section 3, Section 4 and Section 5.

3. Voxel-Based Models

In voxel-based CIT, the ionosphere is discretized with a determined voxel geometry and size. This discretization is based on the spatial correlation of the ionosphere. When the ionosphere is quiet adequately and the voxel is small enough, the variation of the IED in the voxel can be ignored. Therefore, the IED within a voxel is customarily assumed to be identical. Some studies have been conducted on the variable voxel geometry, size, and homogeneity to improve the result of CIT.

3.1. Variable Voxel Geometry

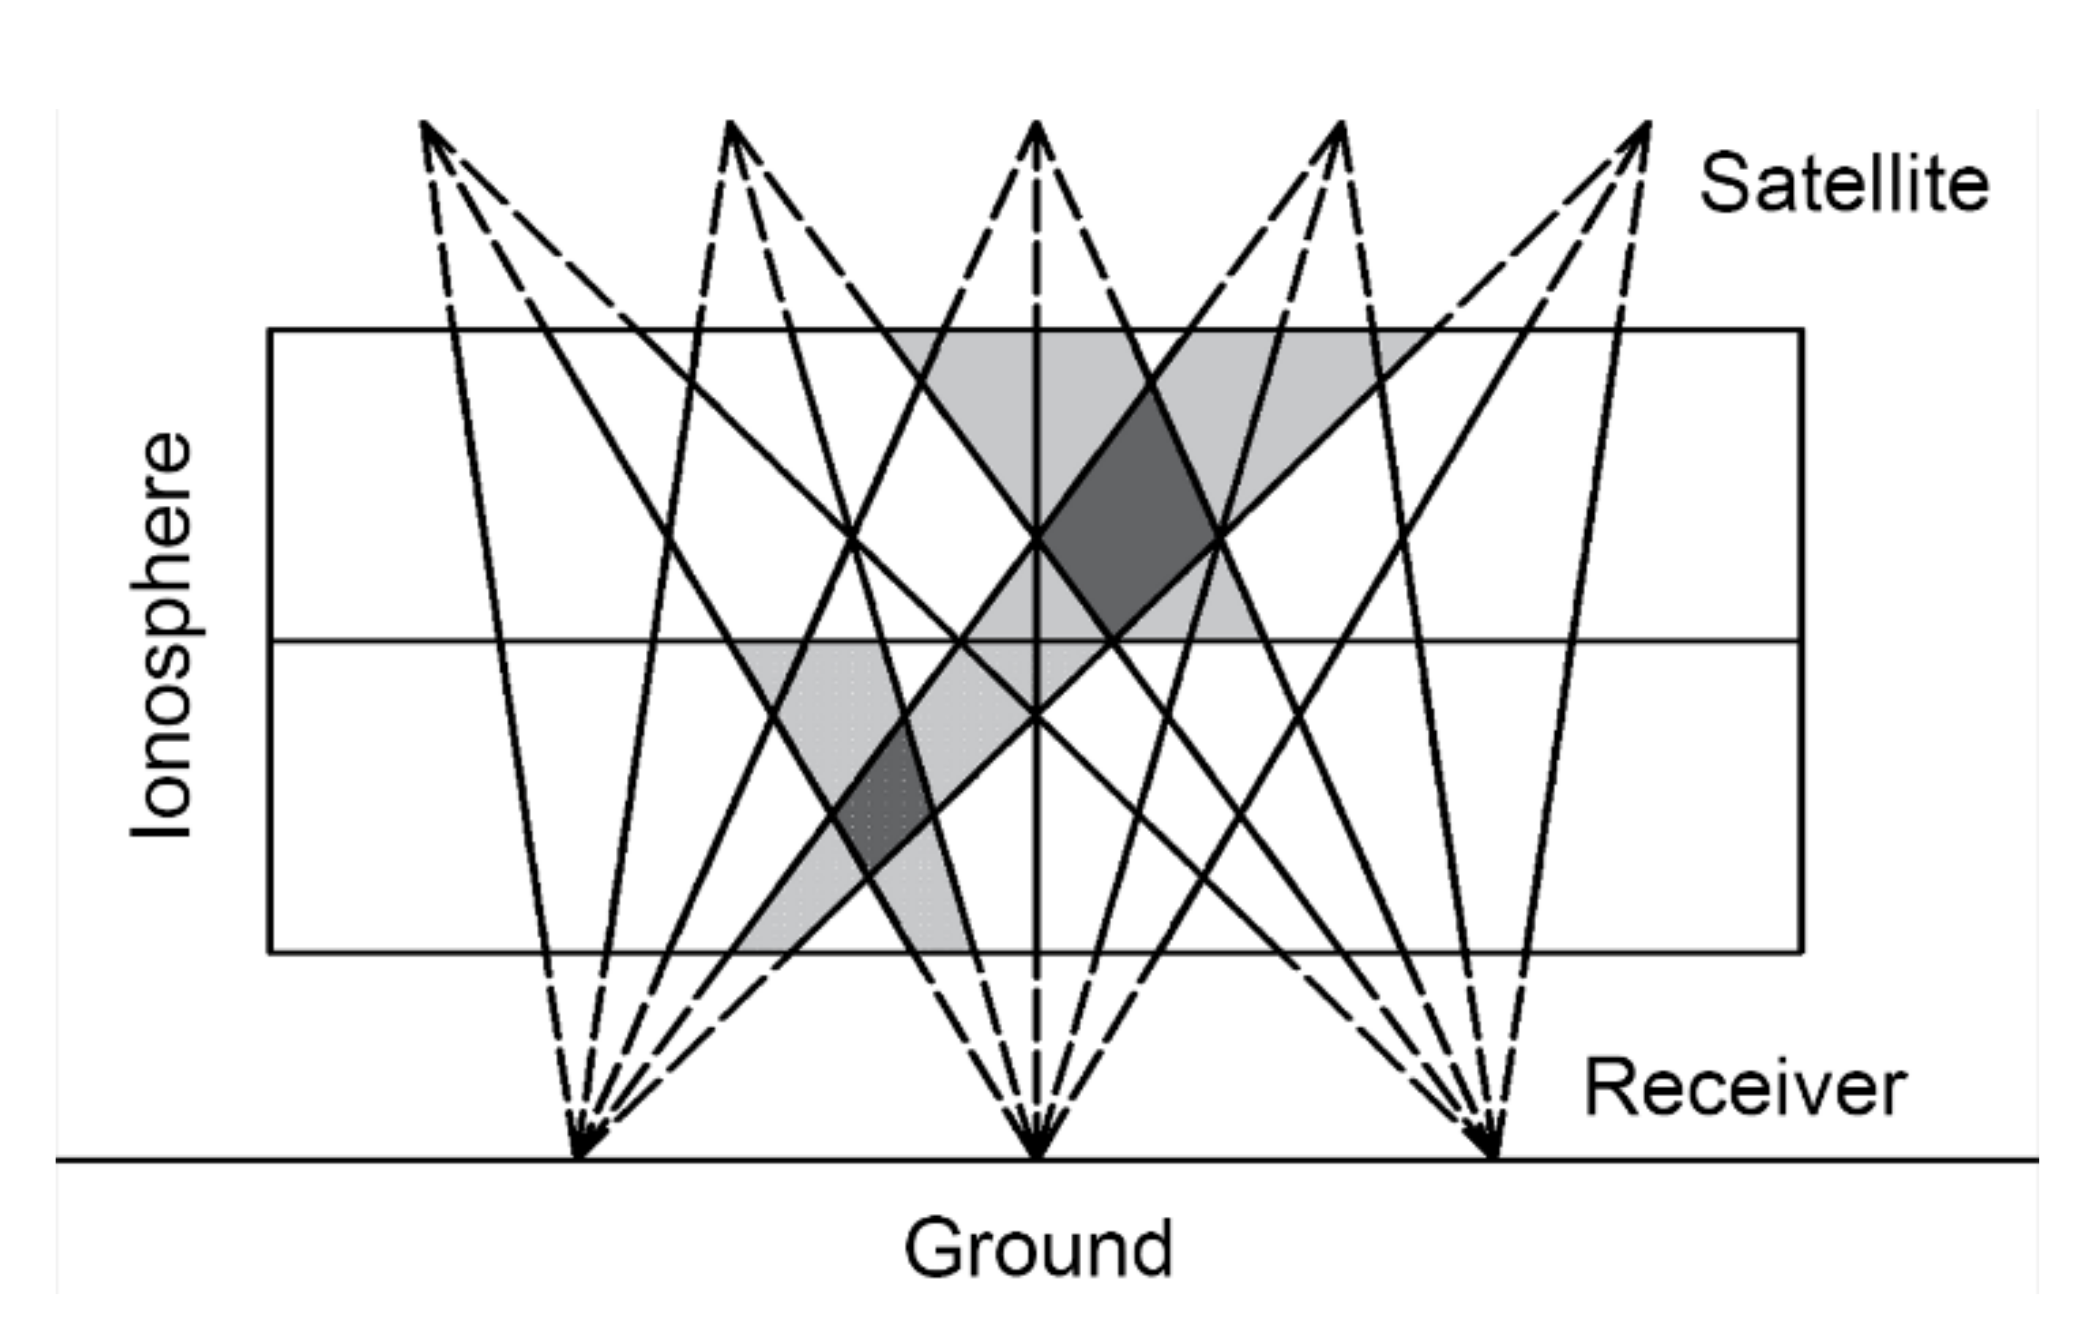
Sutton and Na (1995) [26] investigated three different geometries as shown in Figure 3. Geometry 1 is a rectangle containing the annular region. Geometry 2 is a rectangle within the annular region. Geometry 3 is an annular region. With the analyses of the ability to incorporate prior information and solve for the radial distribution based on the orthogonal decomposition, they demonstrated that Geometry 3 had the best ability to incorporate prior information into the model and improve the radial distribution. Therefore, the intercepts in the regular voxels should be computed based on the spherical surface to adopt the optimum geometry. However, reconstructions using Geometry 3 were sensitive to the exact choice of basis functions. When the distribution of GNSS stations is very sparse, a model with natural voxel decomposition can be applied to CIT [27]. In Figure 4, the ionosphere is divided into several layers and here only double layers are shown. The region between two adjacent rays is a natural voxel. With different natural voxels intersecting, the IED can be derived. For data with extremely limited angles, the model provides better solvability over the conventional models. The model requires no prior assumption because the natural voxel decomposition is closely connected to the measurement geometry and the natural spatial resolution supported by the data is embedded in the solution. However, for the uniquely constrained CIT geometry, the results of the model sometimes contain significant negative values because of the ill-conditioned problem. An entropy regularization method can be further adopted to enforce positivity. Therefore, this model is suitable for the sparse GNSS networks because it can decrease the unknown voxels. However, for a dense network, the voxels excessively overlap which results in a low resolution and a large error.

3.2. Variable Voxel Size

The voxel size in CIT is a significant parameter. With a small voxel size, the spatial resolution is high while numerous voxels may be unilluminated. In contrast, the reconstructed IED has a good solvability while the resolution is low. By determining an optimum voxel size according to the measurements, the solvability and the precision can reach an optimal balance. Supriadi et al. (2018) [28] confirmed that the increase of the voxel size could improve the distributions of the satellite-receiver rays and hence supported CIT with limited data. They utilized insufficient data (see Figure 1 in [28]) to investigate the optimum voxel size. By a designed test called checkerboard resolution test (see Figure 5 in [28]), they set the latitudinal voxel size as 2° and found the optimum voxel size in longitude and altitude should be enlarged to 4° and 100 km for the used data, respectively. Das and Shukla (2011) [29] analyzed the TEC computed by IED integral with the voxel size varying from 1° to 6° in latitude, respectively. By the cross validation, a comparison was made on root mean square error (RMSE). They found the optimum voxel size was 5° in latitude and 50 km in altitude for the test. Therefore, the optimum voxel size varies from different cases, and an optimum voxel size can improve the result of CIT.
Combining the advantages of different voxel sizes, Zheng et al. (2015) [30] proposed a multiscale CIT model that simultaneously applied several overlapping single-scale CIT models with different voxel sizes. The final model was a post-inversion superposition of all sub-models. In comparison with the conventional single-scale CIT models, the multiscale CIT model contained the same number of voxels because of the superposition. The reconstructed IED by the multiscale model was much smoother and the model achieved faster convergence within 20 iterations. A further validation revealed better reconstruction quality with a decrease RMSE of 15% could be achieved. Therefore, the model has feasibility, high efficiency, and rationality over the conventional model. Nevertheless, the difficulty of this model is the determination of the multiple sizes and the contribution of each single-scale model. Another model with variable voxel size presented by Zheng et al. (2017) [31], who reconstructed the IED by a decomposition of the lower and upper ionosphere with different voxel sizes (see Figure 3 in [31]). According to the IED profile, the bottom part was parameterized to a smaller voxel size. By adjusting the quantitative proportion of the voxel sizes, the model reduces the uncertainty in an ill-posed problem for the data with irregular coverage or deficient amount. Meanwhile, efficiency and fidelity can also be ensured. Similar validation on the reliability and superiority as in [30] was performed, and the data of an ionosonde were further taken as references. With the statistical analysis and quantitative comparison, the proposed method offers a decrease of 8% RMSE compared with conventional constant voxel size tomography models. In CIT, more rays with low elevation angles can be used with the reconstructed area enlarged, while the marginal rays are sparse. In order to balance the voxel size and the scale of the reconstructed area, Saito et al. (2017) [32] presented a combination of voxel sizes that vary in altitude, latitude and longitude. In the central region, the horizontal size was 1° × 1°, and the size expanded to 2° × 2° and even 5° × 5° in the marginal region. In the vertical direction, the voxel size varied from 20 km to 10,000 km according to the altitude (see Figure 2 in [32]). The model with variable voxel size has an advantage in solving the ill-posed problem and improving the accuracy of the region of interest (ROI) with the resolution ensured. In ROI, the voxel size can be smaller, and some voxels with larger size can be designed in the marginal area to increase the utilization of observations. They utilized this model to build a real-time ionospheric tomography system. The tomography results were found to be in good agreement with both the electron density profiles obtained by radio occultation measurements and the ionospheric peak densities obtained by ionosondes. Nevertheless, for the selection of the voxel size in various models with variable voxel size, both the mathematical optimization and the physical rationality should be considered based on the utilized data and expected results.

3.3. Variable Voxel Homogeneity

Although the IED within a voxel is customarily assumed to be identical, it varies in the voxel space in fact, especially in the vertical direction. Because higher resolution may mitigate the adverse effects brought by the assumption, decreasing the voxel size is a reasonable solution. However, higher resolution may increase the computational costs and influence the inter voxel constraints on the results. Based on the fact above, Chen et al. (2019) [33] assumed the IED values of any point within a voxel were determined by vertically exponential interpolation and horizontally inverse distance weighted interpolation from the IED values at each corner of the voxel. In this model, the horizontal variation in a voxel is easy to be described by the distance. Considering the variation trend of IED varied from different altitudes, an exponent coefficient varying in altitude was used. Therefore, an initial model such as international reference ionosphere (IRI) is necessary to determine the coefficient. With this assumption, the new parameterized model outperformed the traditional nonparametric model by 12%, 10%, 5% and 2% for vertical resolutions of 25 km, 50 km, 75 km and 100 km, respectively, in the self-consistency validation by global positioning system (GPS) data. Such improvements were 20%, 24%, 22% and 16%, respectively, with the reference of the Swarm in situ IED. For IED, besides the spatial variation in a voxel, the temporal variation also exists between the epochs. Because of the ill-conditioned problem in CIT, IED is usually assumed to be a constant during a time period to expand the data volume. Watermann et al. (2002) [34] have already recognized this limitation in CIT that the moving structures and changing layer heights may result in imaging artifacts. Mitchell and Spencer (2003) [35] improved this assumption with linear variation in each voxel over the time-window. By using the model, the reconstructed IED was displayed in a three-dimensional movie rather than a static image. They demonstrated the potential of the technique to use GPS data for the analysis of a moving trough and the increasing electron concentration. Furthermore, the adverse effects of the temporal variation of IED can be mitigated by using dense GNSS data. Saito et al. (2017) [32] performed CIT in real-time with instantaneous STEC data from the dense GNSS network of Japan. These advances are significant in the study of ionospheric variation, while the premise is sufficient data being available to separate the spatial and temporal variations.

4. Equation Constructions

Because voxel-based CIT is an ill-conditioned problem, the condition number of the intercept matrix is very large. Some additional information should be supplied in the tomography equation to decrease the condition number. The additional information can be added by constraints, virtual data assimilation and multi-source observation fusion, which make the coefficient matrix of the tomography equation less ill-conditioned.

4.1. Condition Constraint

With the constraint condition, the tomography equation can be reformed as follows:
J I E D n × 1 = || S T E C m × 1 A m × n I E D n × 1 || 2 + λ || W m × n I E D n × 1 || 2 ,
where λ || W · I E D || 2 is the constraint term; λ is constraint parameter and W is constraint condition. The solution of Equation (8) is equivalent to that of Equation (6) when J I E D is the smallest.
A constraint condition usually comes from initial models, spatial smoothing or measurements of other instruments. Giday et al. (2016) [36] utilized IRI to obtain empirical orthogonal functions (EOFs) as constraints. In addition to the empirical models, they also pointed out that physics-based functions, such as Chapman function, can be used as the initial models. They compared the NmF2 and hmF2 derived by CIT with those by an ionosonde. The good agreement persisted in diurnal and seasonal trends with minimum and maximum coefficients of determination between 0.84 and 0.96. Nevertheless, IRI may have a discrepancy with the disturbed ionosphere. The spatial smoothing is based on the spatial correlation of the ionosphere. Wen et al. (2010) [37] used a popular two-dimensional multi-point finite difference approximation based on the second-order Laplace operator to provide the constraint condition. The principle of this constraint is the smoothness of neighboring voxels. They devised test cases to validate the effects of smoothness constraint in comparison with only IRI as the constraint condition. The results revealed that with the added constraint, both internal and external coincidence accuracies were greatly improved. The spatial smoothing constraints can improve the solvability in CIT, but some precise structures with small scales may be eliminated. In addition to the smoothness, the measurements of other instrumentals can also be taken as the constraint condition. Fehmers et al. (1998) [38] presented a constraint condition from the measurements of ionosonde and low-orbiting satellite and they successfully reconstructed the IED profiles. Bruno et al. (2020) [39] evaluated CIT with the constraints of EOFs calculated by ionosonde measurements. They demonstrated that when the region was well covered by receivers, the errors in VTEC were smaller than 1 TECU (2–4%). In regions with fewer and more sparsely distributed receivers, the errors could be as high as 20–40%. However, the additional measurements bring new errors. Besides the EOFs, Na and Lee (1990) [40] presented Fourier orthonormal basis functions, each of which was derived from a different frequency component and orientation, to conduct a limited-angle tomography, and Panicciari et al. (2015) [41] utilized wavelet basis functions to permit sparsity in the reconstruction coefficients. It should be realized that the prior model-based constraints may reduce the accuracy of the result because of the deviation between the prior value and reality.
In Equation (8), the constraint parameter determines the degree of dependence on the constraint condition, which is significant in finding a compromise to balance the data fitting and penalty item. The constraint parameter can be fixed as an empirical constant or adjusted with the observations. Saito et al. (2017) [32] utilized a constraint condition by the coupling of the IED in a voxel with six neighboring voxels. The constraint parameter was adjusted by the NeQuick model, namely an empirical model (see Figure 3 in [32]). The topside IED profile tended to be smooth, while that in the E and F regions could be more variable. Therefore, the constraint parameter at the topside ionosphere was determined to be larger, and that in the E and F regions was smaller. Similarly, because the IED around the equatorial ionization anomaly (EIA) crest was more variable, the constraint parameter was determined to be smaller for lower latitudes. It should be noted that a too small constraint parameter may lead to an invalid constraint. Since the resolutions of GNSS observations in horizontal and vertical directions are different, dual constraint conditions in different directions can be combined. Wang et al. (2018) [42] presented a dual parameter regularization method. In the horizontal direction, the constraint was based on the second-order Laplace operator, and Gaussian correlation was adopted as the constraint in the vertical direction. The dual parameters were determined by the linear model function method in the framework of the damped Morozov discrepancy principle. The dual parameter regularization method was tested by both the ideal cases and real cases on the reconstructed relative and absolute error. Comparing with the single parameter regularization method, the presented method can significantly improve the background model outputs. Because Tikhonov regularization tended to smooth IED structures while total variation regularization effectively resisted noise and preserved discontinuities of the IED, Yao et al. (2013) [43] combined both to present a hybrid regularization method. The dual parameters were chosen according to the noise level. A simulation test and an experimental test demonstrated the effectiveness and illustrated the validity and reliability.
Some improved regularization methods were used as constraint conditions. To avoid over-smoothing in the marginal voxels, nonconvex regularization was used to capture potential localized ionospheric density structures [44]. The method could effectively locate and reconstruct the sharp edges of the equatorial-originating depletions even in areas with few GNSS ray-path angles. The sparse regularization promoted the sparsity in the reconstruction and was tailored for wavelet representation due to the localization properties, and it showed higher reliability of reconstructed ionospheric structures and robustness to observational inconsistencies compared to a more standard approach [45]. The maximum entropy regularization could solve the discrete ill-posed problems and improved the resolution in altitude [46].

4.2. Virtual Data Assimilation

Data assimilation aims to combine the GNSS observation data with the background models in an optimal way. The background models can come from other measurements or initial models. The data assimilation needs a reasonable framework that is self-consistent in terms of various input data and can provide spatial-temporal extrapolations. The framework can be a physical model or an empirical model to provide initial estimations [47]. Bust and Mitchell (2008) [12] have comprehensively reviewed the data assimilation approaches proposed before 2008.
Chen et al. (2012) [48] utilized two-dimensional ionospheric derivation to produce sufficient satellite-receiver rays in data assimilation. They assimilated virtual TEC with IRI-2007 model (see Figure 1 in [48]) and proceeded to use the results as the initial values to solve the IED. Experimental results showed that the RMS of the reconstructed IED decreased by nearly 50% and the imaging quality of CIT was improved effectively. Yao et al. (2015) [49] added virtual observations by simulating station locations, satellite positions and STEC in n-dimensional space instead of three-dimensional space. Therefore, a ray from the satellite can pass through two arbitrary voxels to reach the receiver in the n-dimensional space (see Figure 2 in [49]). In case the constraints from these virtual observations were too tight, the virtual observations were added in the altitudinal and horizontal direction with different weights. Compared with the traditional method, their assimilation method could reconstruct the IED closer to the ionosonde measurements. The strategy ensures that each voxel is traversed by virtual rays and increases the horizontal constraints among the voxels. Although all the voxels in the reconstructed area are illuminated with the virtual rays added, the results of CIT may be limited by the precision of the virtual TEC. Yao et al. (2018) [50] utilized the NeQuick 2 model to repair the TEC with partial rays beyond the boundary (see Figure 1 in [50]). Therefore, the unavailable observations were converted into virtual observations on the edge or bottom side. The results were closer to ionosonde measurements, and the accuracy was improved up to 56.3% with the distribution of rays effectively improved by the side rays. More noticeable improvements were in the edge region and during the magnetic storm. Nevertheless, the precision of IED on the edge depends on the initial model which contributes to the errors in the virtual observations.

4.3. Multi-Source Observation Fusion

In addition to ground-based GNSS measurements, the observations from other instrumentals can be simultaneously used in CIT, such as observations from satellite-borne receivers and beacons, as well as oblique and vertical sounders, incoherent scatter radar (ISR), optical observations, in situ measurements, etc. These instrumentals can also observe the ionosphere although with different observation noises. The biggest advantage of these instrumentals is that they can bring in numerous rays with different directions and supply the information with different aspects (see Figure 3 in [51]). For instance, space-based GNSS data provide the rays with low elevation angles to solve the ill-conditional problem in CIT. The standard technique for converting radio occultation measurements to vertical profiles of IED relies on the Abel transform. Because of the limitation of the bending angle, the profiles have a very high vertical resolution but a poor horizontal resolution [52]. Rius et al. (1997) [8] demonstrated that the vertical resolution of CIT could be improved with the occultation observations utilized. The ionosonde data provide IED of the bottom side ionosphere, and topside structure is enabled observability through implicit correlation of TEC with the bottom side characterization [53]. Chartier et al. (2012) [54] incorporated the ionosonde observations with GNSS observations to improve the vertical resolution of the results in the vicinity of the ionosonde. The experiment results were validated with Jicamarca ISR and independent GPS STEC observations. With the fusion of ionosonde data, mean NmF2 error dropped from 0.27 × 10¹¹ to −0.07 × 10¹¹ and RMSE dropped from 1.0 × 10¹¹ to 0.5 × 10¹¹. The mean error in hmF2 dropped from 40 km to −3.9 km while RMSE was 40 km in both cases. The mean error of TEC was −0.36 TECU, dropping from 0.64 TECU, and RMSE was 3.55 TECU down from 4.02 TECU. Ssessanga et al. (2021) [55] revealed that assimilating ionosonde data to regional GNSS CIT can improve the peak height estimation and avoid physically unrealistic negative densities. In their final solution, the NmF2 and hmF2 by CIT were improved by more than 60% on average.
Because the observation noise varies from different instrumentals, the most important problem in multi-source observation fusion is to balance the weights of different measurements by the noise levels. Bust et al. (2001) [56] combined beacon data with GNSS data in CIT. The fusion was based on the statistical minimization method. An initial forecast was obtained from IRI, and an improved estimate of the electron density field was obtained from a weighted estimate of the data and the model. The weights were obtained by the data variance and the covariance matrix of the model, where the data were assumed to be uncorrelated. Schunk et al. (2004) [51] used the ionosphere-plasmasphere model and a Kalman filter as a basis for assimilating a diverse set of real-time (or near real-time) measurements that came from various observation tools. The Kalman filtering algorithm will be reviewed in Section 5.2.

5. Algorithms

In voxel-based CIT, besides supplement of additional information in equation construction, the ill-conditioned problem can be mitigated by the algebraic method, statistical approach and artificial neural networks in equation solving or result estimation. These mathematical algorithms aim to minimize the mean square error or reduce the redundant information. Some improvements in the algorithms are proposed continuously.

5.1. Iterative Reconstruction

Iterative reconstruction is an improvement of the least square method for the tomography problem since it can better incorporate initial estimations. The initial estimations are provided by empirical models or other sources and supply additional information to solve the ill-conditioned problem. Because the initial estimations have discrepancies with the actual ionosphere, the measurements by instruments are still necessary for the iteration process. Austen et al. (1986, 1988) [3,57] first applied the ART in CIT. With the initial estimations and the GNSS observations, the k th iteration computes X k + 1 by ART as follows:
X k + 1 = X k + λ k y i j = 1 n a i j X j k j = 1 n a i j 2 a i ,
where a i is the i th row of intercept matrix A in Equation (6); λ k is the relaxation parameter with 0 < λ k < 1 ; y i is the result of the previous iteration. In a simulation study, Austen et al. (1988) [57] utilized ART to produce a two-dimensional image of IED. Then, Andreeva et al. (1990) [4] successfully implemented experimental CIT. They produced a two-dimensional image of IED by relative TEC data from three receivers.
Based on ART, Raymund et al. (1990) [58] utilized multiplicative ART (MART) to ensure the reconstructed IED be non-negative in a simulation study similar to that of Austen et al. (1988) [57]. MART is implemented as follows:
x j k + 1 = x j k ( y j j = 1 n a i j X j k ) λ k a i j / || a i || ,
where x j k + 1 is the IED of j th voxel in k + 1 step iteration. Compared to ART, MART has faster convergence. Prol and Camargo (2016) [59] demonstrated that MART estimated the electron density peak with similar accuracy as IRI with adequate receivers. MART estimated STEC with lower RMSE than STEC calculated by ionospheric maps from IGS. MART described the daily variations better than IRI and IGS maps, while MART overestimated IED due to the plasmasphere. Nevertheless, MART remains to be a classical algorithm and IRI is still a common initial model in iterative reconstruction of CIT. The early developing theory on ART and MART and corresponding experimental results have been reviewed by Bust and Mitchell (2008) [12].
In iterative reconstruction, the initial model is very significant. The larger condition number of the intercept matrix results in more dependence on the initial model. In order to improve the accuracy of CIT, some scholars improved the initial models. Considering the topside ionosphere was not well specified by IRI, Yang et al. (2017) [60] removed the contribution of the plasmasphere in TEC by employing the NeQuick 2 model. This improvement can avoid the overestimation of the IED in the topside ionosphere. Based on this strategy, they analyzed the performance of CIT in the topside ionosphere and found an overestimation at an altitude of 830–880 km with respect to defense meteorological satellite program (DMSP) measurements. Therefore, the initial estimations with non-uniform error distribution may change the error distribution of reconstructed IED and result in unreal performances in some regions. Jin and Li (2018) [61] updated the IRI-2012 using the ground-based GNSS observations. The NeQuick 2 was used to provide the vertical ionospheric profile, and foF2 and M(3000)F2 derived from CCIR model in NeQuick 2 were improved by the B-spline modeling methods. The test results demonstrated the feasibility and superiority with the standard deviations of TEC residual errors decreasing by at least 20%. Li et al. (2016) [62] updated the IRI-2012 ionospheric profile in the reconstructed area using the dense ground-based GNSS observations and ionosonde data. The CIT results were evaluated by comparing them with the independent ionosonde measurements, which showed good reliability and high accuracy. In order to make the initial model closer to the actual ionosphere, Wen et al. (2012) [63] obtained the initial model by the Phillips smoothing method with only GNSS observations to replace IRI. The results of numerical simulations and real data experiments indicated the reliability and superiority especially could prevent large bias in the solutions as a result of noise during the reconstruction process. Prol et al. (2018) [64] estimated the initial model based on ionosonde and radio occultation measurements to overcome the lack of initial estimations provided by climatological models in low-latitude regions. Numerical simulations and real data experiments proved that this algorithm offered better performance in the physical study of the anomaly, particularly under storm events when its morphology deviated from normal. Additionally, the constraint condition can be combined with iterative reconstruction algorithms, such as constrained ART (CART) and constrained MART (CMART) [37,65].
In addition to the initial estimations, the relaxation parameter is also significant because it determines the degree of dependence on the initial model. Generally, the relaxation parameter is determined by experience. In order to optimize the relaxation parameter, Zheng et al. (2018) [66] proposed an automatic search technology to train the relaxation parameter by the RMSE of STEC in each step of the iteration. A numerical simulation experiment showed the strategy could decrease the absolute error and RMSE, and a real data experiment demonstrated that more reliable IED images were produced with the strategy. Wen et al. (2015) [67] utilized an adaptive method to adjust the relaxation parameter by intercept matrix and reconstructed IED instead of only the intercept matrix, which is shown as follows:
λ k = γ a i j x j k i = 1 m a i j · j = 1 n a i j x j k ,
where γ is the relaxation factor and a constant with 0 < γ < 2 . With the optimum relaxation parameter, IED can be obtained with higher fidelity and efficiency as compared to the conventional iterative reconstruction.
In addition to ART and MART, there are some other improved iterative reconstruction algorithms. The simultaneous ART (SART) is a refinement of ART toward a column normalized method and better suited for real-time applications. Contrary to ART, SART considers all the available measurements simultaneously. The major advantage of SART is that even in tomography with high resolution, the unknowns can be solved with less computational load. Therefore, Nandi and Bandyopadhyay (2015) [68] applied it to investigate the IED at low-latitudes and revealed the fast convergence irrespective of the geometry. SART can be implemented as follows:
x j k + 1 = x j k + λ k r = 1 m a r j i = 1 m y i j = 1 n a i j X j k j = 1 n a i j a i j ,
Similarly, SART can be combined with the constraint condition. According to Liu et al. (2010) [69], the mean reconstruction error decreased by 12.4% and the maximum decreased by 15.3% with a Laplacian constraint. Furthermore, simultaneous multiplicative ART (SMART) is also a column normalized method that can automatically guarantee the x components to be non-negative [70]. SMART can be implemented as follows:
x j k + 1 = x j k λ k r = 1 m a r j i = 1 m y i j = 1 n a i j a i j ,
Gerzen and Minkwitz (2016) [70] further combined SMART with a successive correction method described in [13], and revealed that the algorithm decreases the median of the absolute STEC error up to 15%, 22%, 46% and 67% compared to SMART, SART, ART and NeQuick, respectively.
In iterative reconstruction, a thorny problem is that the voxels without satellite-receiver ray traversing cannot be reconstructed directly. Yao et al. (2013) [71] presented the COMBI method which combined the voxel-based model and function-based model to fit the IED of unilluminated voxels by three-dimensional spherical harmonic function after iterative reconstruction. The method can reconstruct the IED distribution with fewer parameters, and can better describe the refined structure of ionosphere with higher solvability. Except for fitting, the unilluminated voxels can be reconstructed by smoothing (Wen et al. 2012) [63]. However, these methods may result in unreasonable values in the marginal voxels and the area with many unilluminated voxels. Lu et al. (2021) [72] presented an algorithm based on virtual reference stations (VRSs) to decrease the number of unilluminated voxels. The virtual observations of VRSs were generated with the observations from nearby stations. Therefore, the solvability and accuracy were both improved, and the IED distribution was reconstructed more reasonably.

5.2. Singular Value Decomposition

With additional information supplemented, the condition number decreases and the ill-conditioned problem can be solved. The solution can be fixed simply by some methods for solving linear equations such as least square fitting [12]. The constrained least squares method can obtain the IED for illuminated voxels without iteration and initial guess [15,32]. Moreover, the singular value decomposition (SVD) is a desirable choice since it gives a numerically stable solution in a compact and self-contained expression [73]. In voxel-based CIT, the combination of satellite and receiver produces numerous rays, while a part of observations is redundant. Usually, only the subset of the intercept matrix is linearly independent and the rest is linearly dependent. Since some linearly dependent equations may contain more noises than information, the SVD can be used to remove the redundant information. By SVD, m × n matrix A is decomposed as follows:
A = U D V T ,
where U is a m × L column-orthogonal matrix, V is a n × L column-orthogonal matrix of eigenvectors, D is a L × L diagonal matrix with positive elements and sorted in decreasing order, and L is the number of independent equations. Because smaller singular values considerably amplify the numerical error in the inversion process, a truncation is better to be performed. With the equations containing small singular values truncated, the pseudoinverse A k + is written as follows:
A k + = i = 1 k V i D i 1 U i T ,
Nevertheless, by SVD and truncation, matrix A k + maybe still rank deficient. Therefore, SVD is usually combined with other algorithms to solve the ill-conditioned problem. Bhuyan et al. (2004) [74] applied a generalized SVD (GSVD) to combine SVD with regularization, and IRI was taken as an initial model. The GSVD solution was found to be less affected by some considerations, such as voxel size and number of ray paths. The capability of SVD was validated by the observation of the ionospheric density irregularities in EIA and mid-latitude ionosphere. Wen et al. (2008) [75] proposed a hybrid reconstruction algorithm for CIT. First, a truncated SVD was used to partly solve the ill-posed problem. Then, an iterative improvement process on the solution was implemented by ART. Therefore, a more reasonable initial approximate was chosen for ART and to improve the quality of the final reconstructed image. The simulated experiment demonstrated the superiority over truncated SVD and ART alone, and the real data test indicated a better agreement with the ionosonde measurements. Erturk et al. (2009) [76] formed a basis function by SVD for the required location, as well as the time of interest, and converted CIT into a weighted least squares estimation problem of the basis coefficients. With a truncated SVD, a more significant regularization was provided to CIT with limited projections. The cross-validation approach indicated that the reconstruction error was about 1.50 TECU. It should be noted that for small size voxels the truncated SVD may remove the small-scale ionospheric irregularities manifested as noises or errors.

5.3. Kalman Filtering

The Kalman filter is a recursive estimator for minimizing the mean square error and obtaining the best model state at a time by all the information prior to this time. This algorithm combines the measurement data with the prior data based on the corresponding statistical description of the uncertainties. Consequently, Kalman filtering performs a recursive least squares inversion of the observations for the model variables using a dynamical model as a constraint.
The Kalman filtering equations are shown in Table 1 and implemented as follows: The model state and corresponding error covariance are forecasted by the previous parameters with Equations (K1) and (K2). Then, the measurements are represented by Equation (K3). The model state and corresponding error covariance proceed to be updated by current parameters with Equations (K5) and (K6), where Kalman gain is computed with Equation (K4). The current step ends and the next step begins until the last observation is completed [77].
With the covariance of the model error updated constantly with consideration of all the observations and the initial values, Kalman filtering is a widely used data assimilation algorithm. Since the Kalman gain is dynamic, the model evolves with time and hence Kalman filtering can be implemented in real-time. Scherliess et al. (2004) [78] presented a physics-based data assimilation model of the ionosphere performed by Kalman filtering. Their model can provide an improved specification and forecast on the global ionosphere. In a simulation test, the encouraging results demonstrated the proper performance of the algorithm. Tuna et al. (2018) [79] developed an algorithm to provide a physically admissible three-dimensional ionospheric model by using both STEC and IRI-Plas model based on Kalman filtering. The algorithm was extended to provide reconstructions both in space and time, and this extension exploited the temporal continuity of the ionosphere to provide more reliable reconstructions. Therefore, initiating the optimization search in the problem space from the predicted values of perturbation surface parameters provided a computational saving of about 16–20%. In conclusion, with real-time ability from Kalman filtering, this method became four-dimensional CIT and provided robust reconstructions of the IED distribution even in stormy days and with only a sparse set of measurements. The Kalman filtering algorithm is efficient in the studies on ionospheric dynamics and is attractive in the development of four-dimensional CIT. Importance of choices of the state transition matrix ( L ) and model error covariance matrix ( P ) in Kalman filtering should be noted. An accurate L and P can accelerate convergence and improve the accuracy of results. For real-time CIT, the error of state vector needs dynamic adjustment according to the statistical characteristics of observation error. When the ionosphere changes rapidly or irregularly, the rationality of the results should be paid attention to.

5.4. Neural Network

A residual minimization training neural network utilized for CIT is shown in Figure 5. The artificial neural network (ANN) consists of many neurons. These neurons constitute an input layer, several hidden layers and an output layer. Usually, one hidden layer is sufficient. An error back propagation-based multilayer feed-forward network can approximate a continuous real function with arbitrary precisions. The values of the output layer are summed with adjusted weights which are fixed to unity from input to output layer. The weights are adjusted by the gradient descent algorithm with an objective function that can be defined by the residual. The conventional objective function E is given as:
E = s = 1 S N O N E 2 ,
where S denotes the total number of the observations; N O and N E are the observations and estimated values, respectively.
As a recursive algorithm, the ANN has an advantage in estimating the difference of the variables between time steps based on the observations. Granat and Na (2000) [80] utilized ANN to estimate the IED at each time step and reconstructed the time-varying IED. Experimental results on synthetic data demonstrated that this algorithm is capable of detecting short-term localized disturbances in the ionosphere without an initial model, but the information prior to this time is necessary. The precision of the results relies on the initial estimations and hence a bad estimation may result in overfitting. Ma et al. (2005) [11] presented a residual minimization training neural network in CIT. With the ANN, the smoothing and interpolation of the observation data are automatically included, and the algorithm can reconstruct the IED almost in real-time (every 15 min). The reliability of the algorithm was validated by numerical experiments and real observation data tests with the independent ionosonde observations as references. Ghaffari Razin and Voosoghi (2017) [81] utilized a wavelet neural network to reconstruct IED with a prior model. With both vertical and horizontal objective functions minimized, they found the proposed approach was superior to both IRI-2012 and spherical cap harmonic method. Although an ANN can approximate a continuous real function by arbitrary precisions, the different noise levels of various observations should be estimated in advance.

5.5. Bayesian Estimation

The Bayesian estimation can provide estimates of IED according to the uncertainty of the measurements, leading to credible intervals for all quantities of interest. With the Bayesian framework, the required additional information in CIT can be given by prior probability distributions. Simultaneously, the covariance of the initial values and observations can be considered [82]. In the Bayesian framework, the error vector ε and the prior unknown matrix X follows a multivariate normal distribution:
ε ~ N 0 , Σ ε ,
X ~ N X p r , Σ p r ,
where X p r is the prior mean of the ionosphere and additional parameters. Σ ε is the covariance representing the uncertainties of ε , and Σ p r is the covariance representing the related prior uncertainties of X . Following the Bayes theorem, the posterior distribution for X is also a multivariate normal distribution:
X | m ~ N X M A P , Σ p o s t ,
where X M A P is the maximum a posteriori (MAP) estimator and Σ p o s t is the posterior covariance estimator. With matrix inversion lemma, X M A P and Σ p o s t can be computed as follows:
X M A P = X p r + Σ p r A T A Σ p r A T + Σ ε 1 m A X p r ,
Σ p o s t = Σ p r Σ p r A T A Σ p r A T + Σ ε 1 A Σ p r ,
Based on Bayesian inference, Norberg et al. (2015) [83] presented an algorithm with the use of Gaussian Markov random field priors. They constructed the priors as a system of stochastic partial differential equations. Numerical approximations of these equations could be represented with linear systems with sparse matrices, hence providing computational efficiency. The algorithm enables an interpretable scheme to build the prior distribution based on physical and empirical information on the structure of the ionosphere. Norberg et al. (2018) [84] then demonstrated the advantage of Bayesian estimation in CIT with multi-source data containing different noise levels (see Figure 1 in [84]). The performance was validated with results from simulated and real multi-instrument data with comparisons to an ISR and vertical TEC mapped from the original data. The operative performance depends on how the prior parameters can be fixed or selected dynamically to different ionospheric conditions.

6. CIT Results and Applications

With the development of CIT, various techniques have been proposed and some key problems in CIT have been solved or mitigated. Voxel-based CIT has become an indispensable technique to reconstruct the IED profile. The ionospheric morphology and dynamics have been perceived over various temporal and spatial scales. Moreover, the applications of CIT have been extended to ionospheric correction and monitoring.

6.1. Ionospheric Height Profile and Image

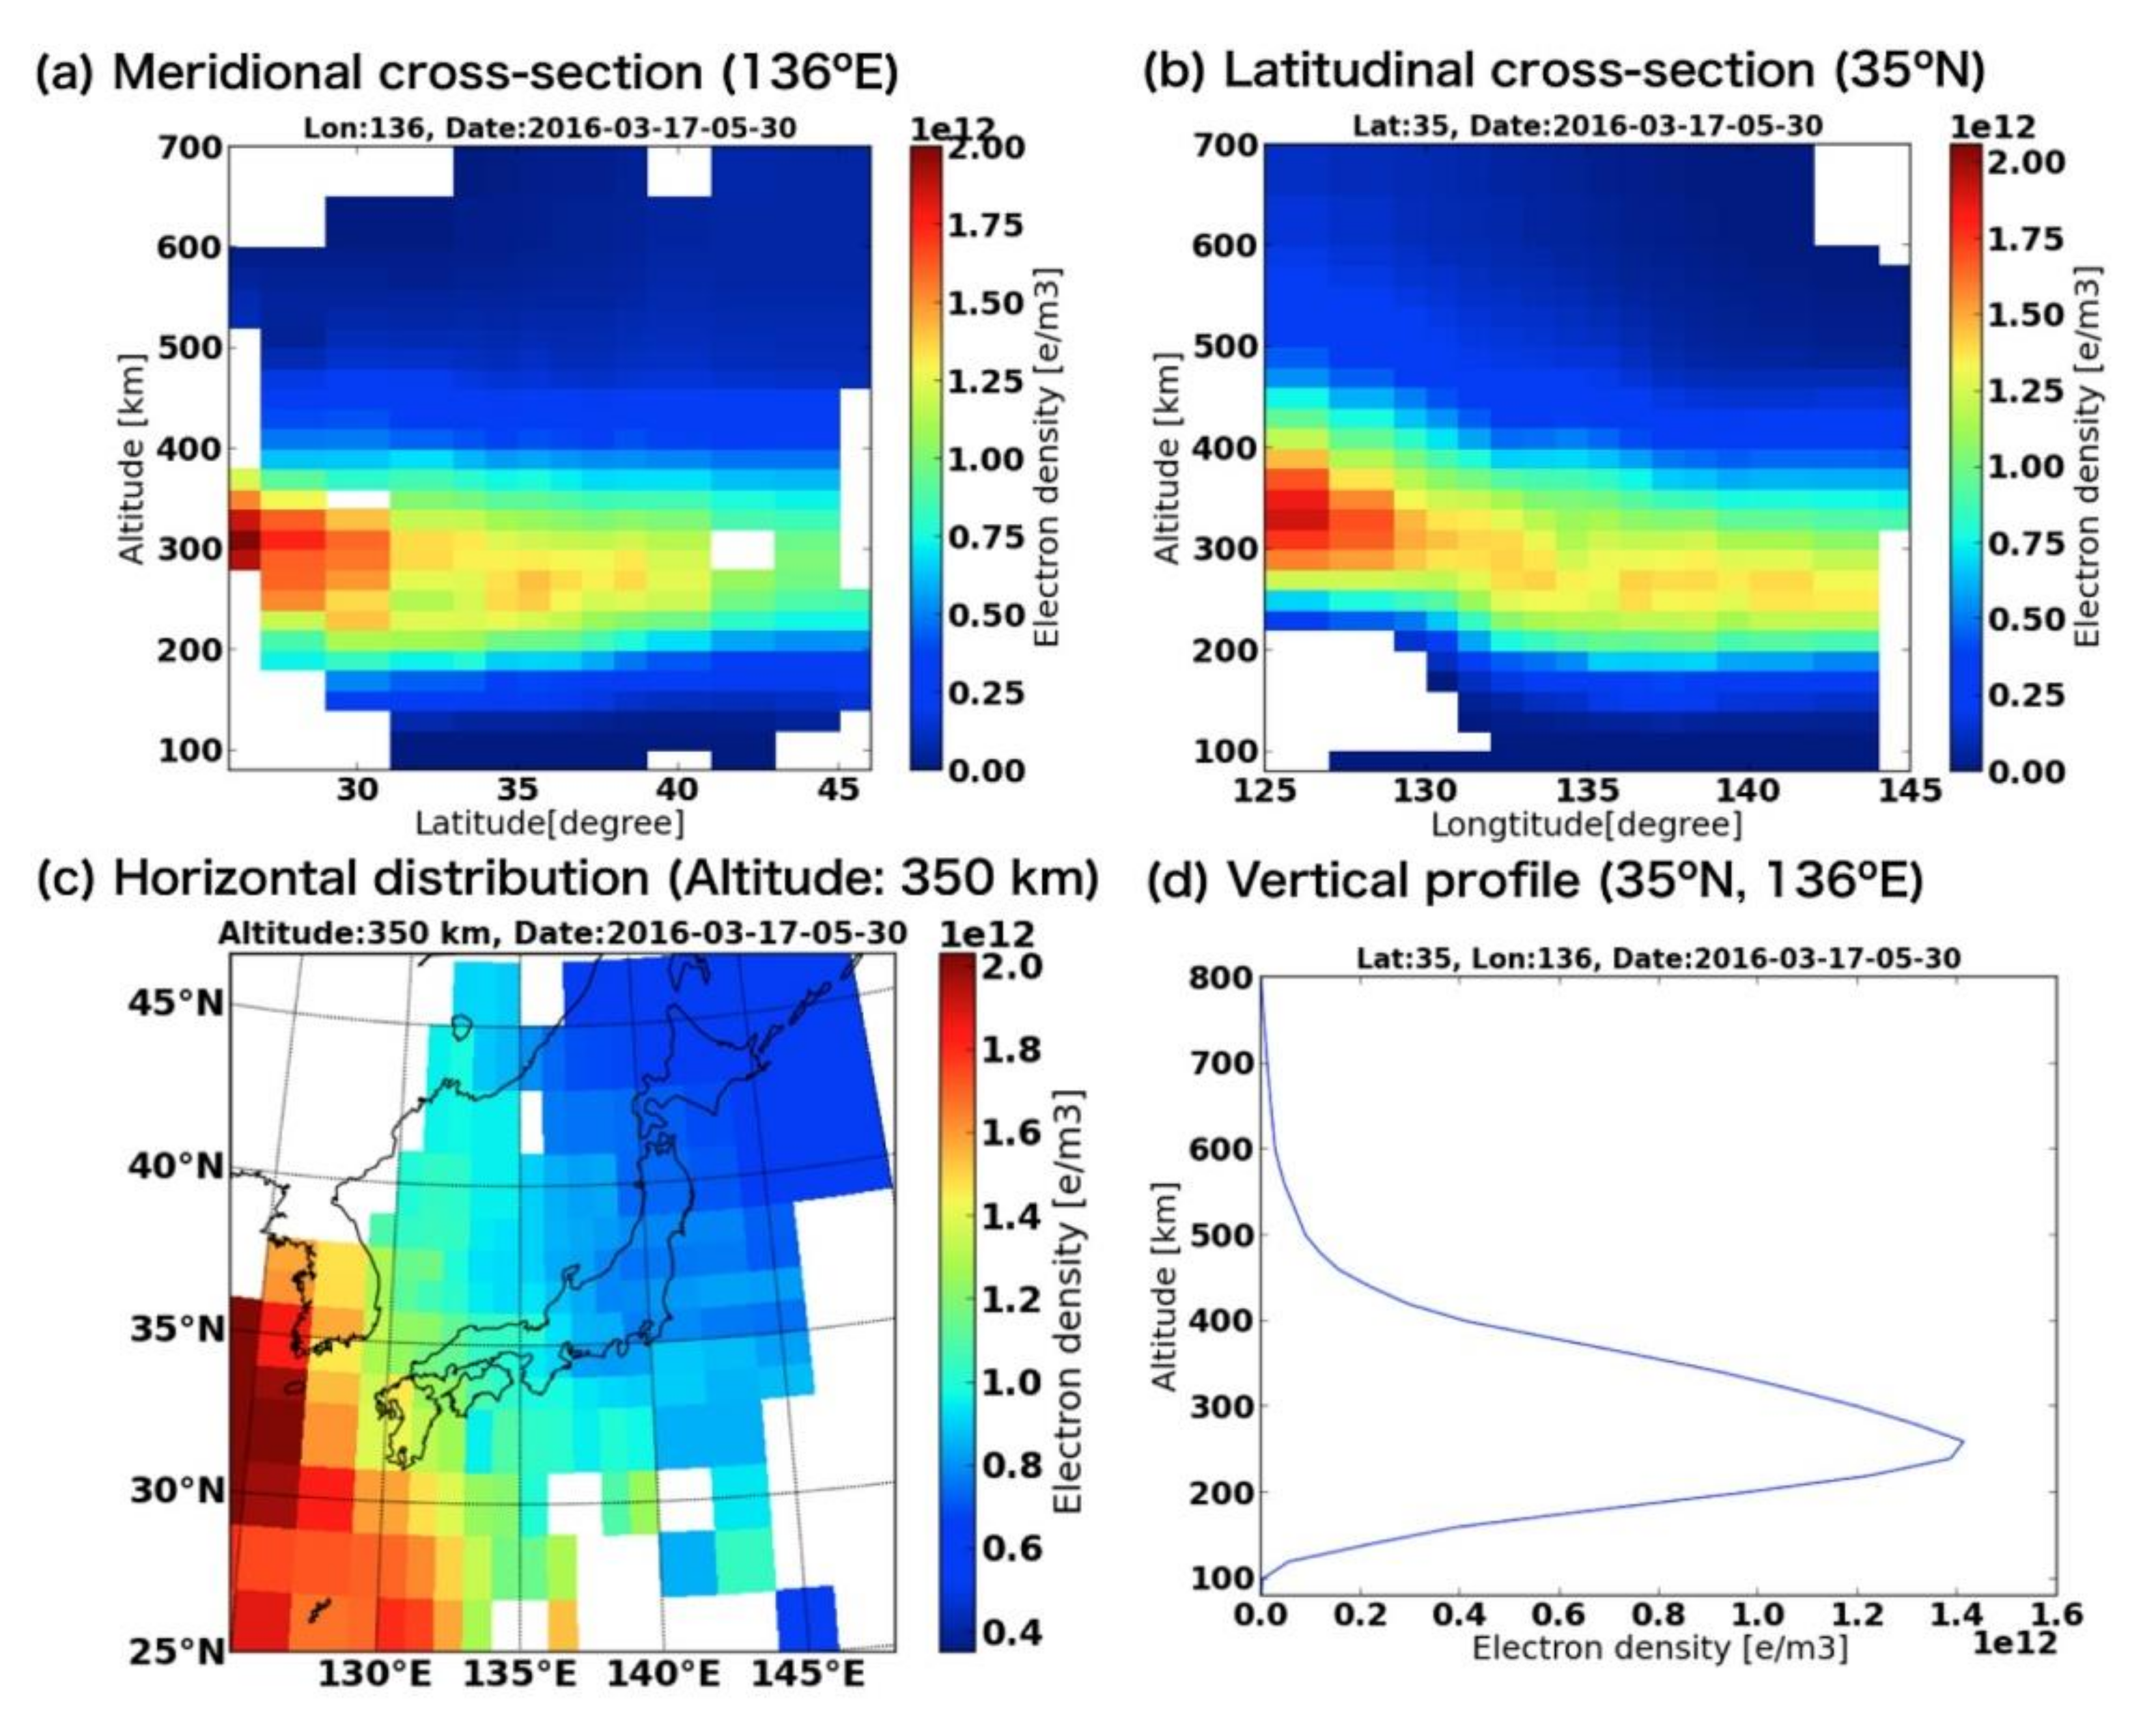
The vertical profiles and two-dimensional images from CIT inform vertical structures or spatial variations. Figure 6 shows the tomographic results with the variable voxel size model. A clear feature of the EIA is visible in Figure 6a as the increasing F region peak electron density with decreasing latitude. In Figure 6b, the F region peak electron density in the western part is higher than that at the eastern part. Meanwhile, the horizontal distribution near the peak height in Figure 6c demonstrates the phenomenon in Figure 6b. The vertical profile in Figure 6d manifests the F region peak electron density and height. The D and E regions are not very well defined because the contribution of these regions to the TEC is small and the lack of oblique satellite-receiver rays. Thus, accurate constraints or additional data for these lower ionospheric regions are necessary. On the other hand, the resolution in Figure 6a–c is variable. The variable voxel size can improve the results in ROI and help to mitigate the contradiction between resolution and accuracy, which is a key problem in CIT.
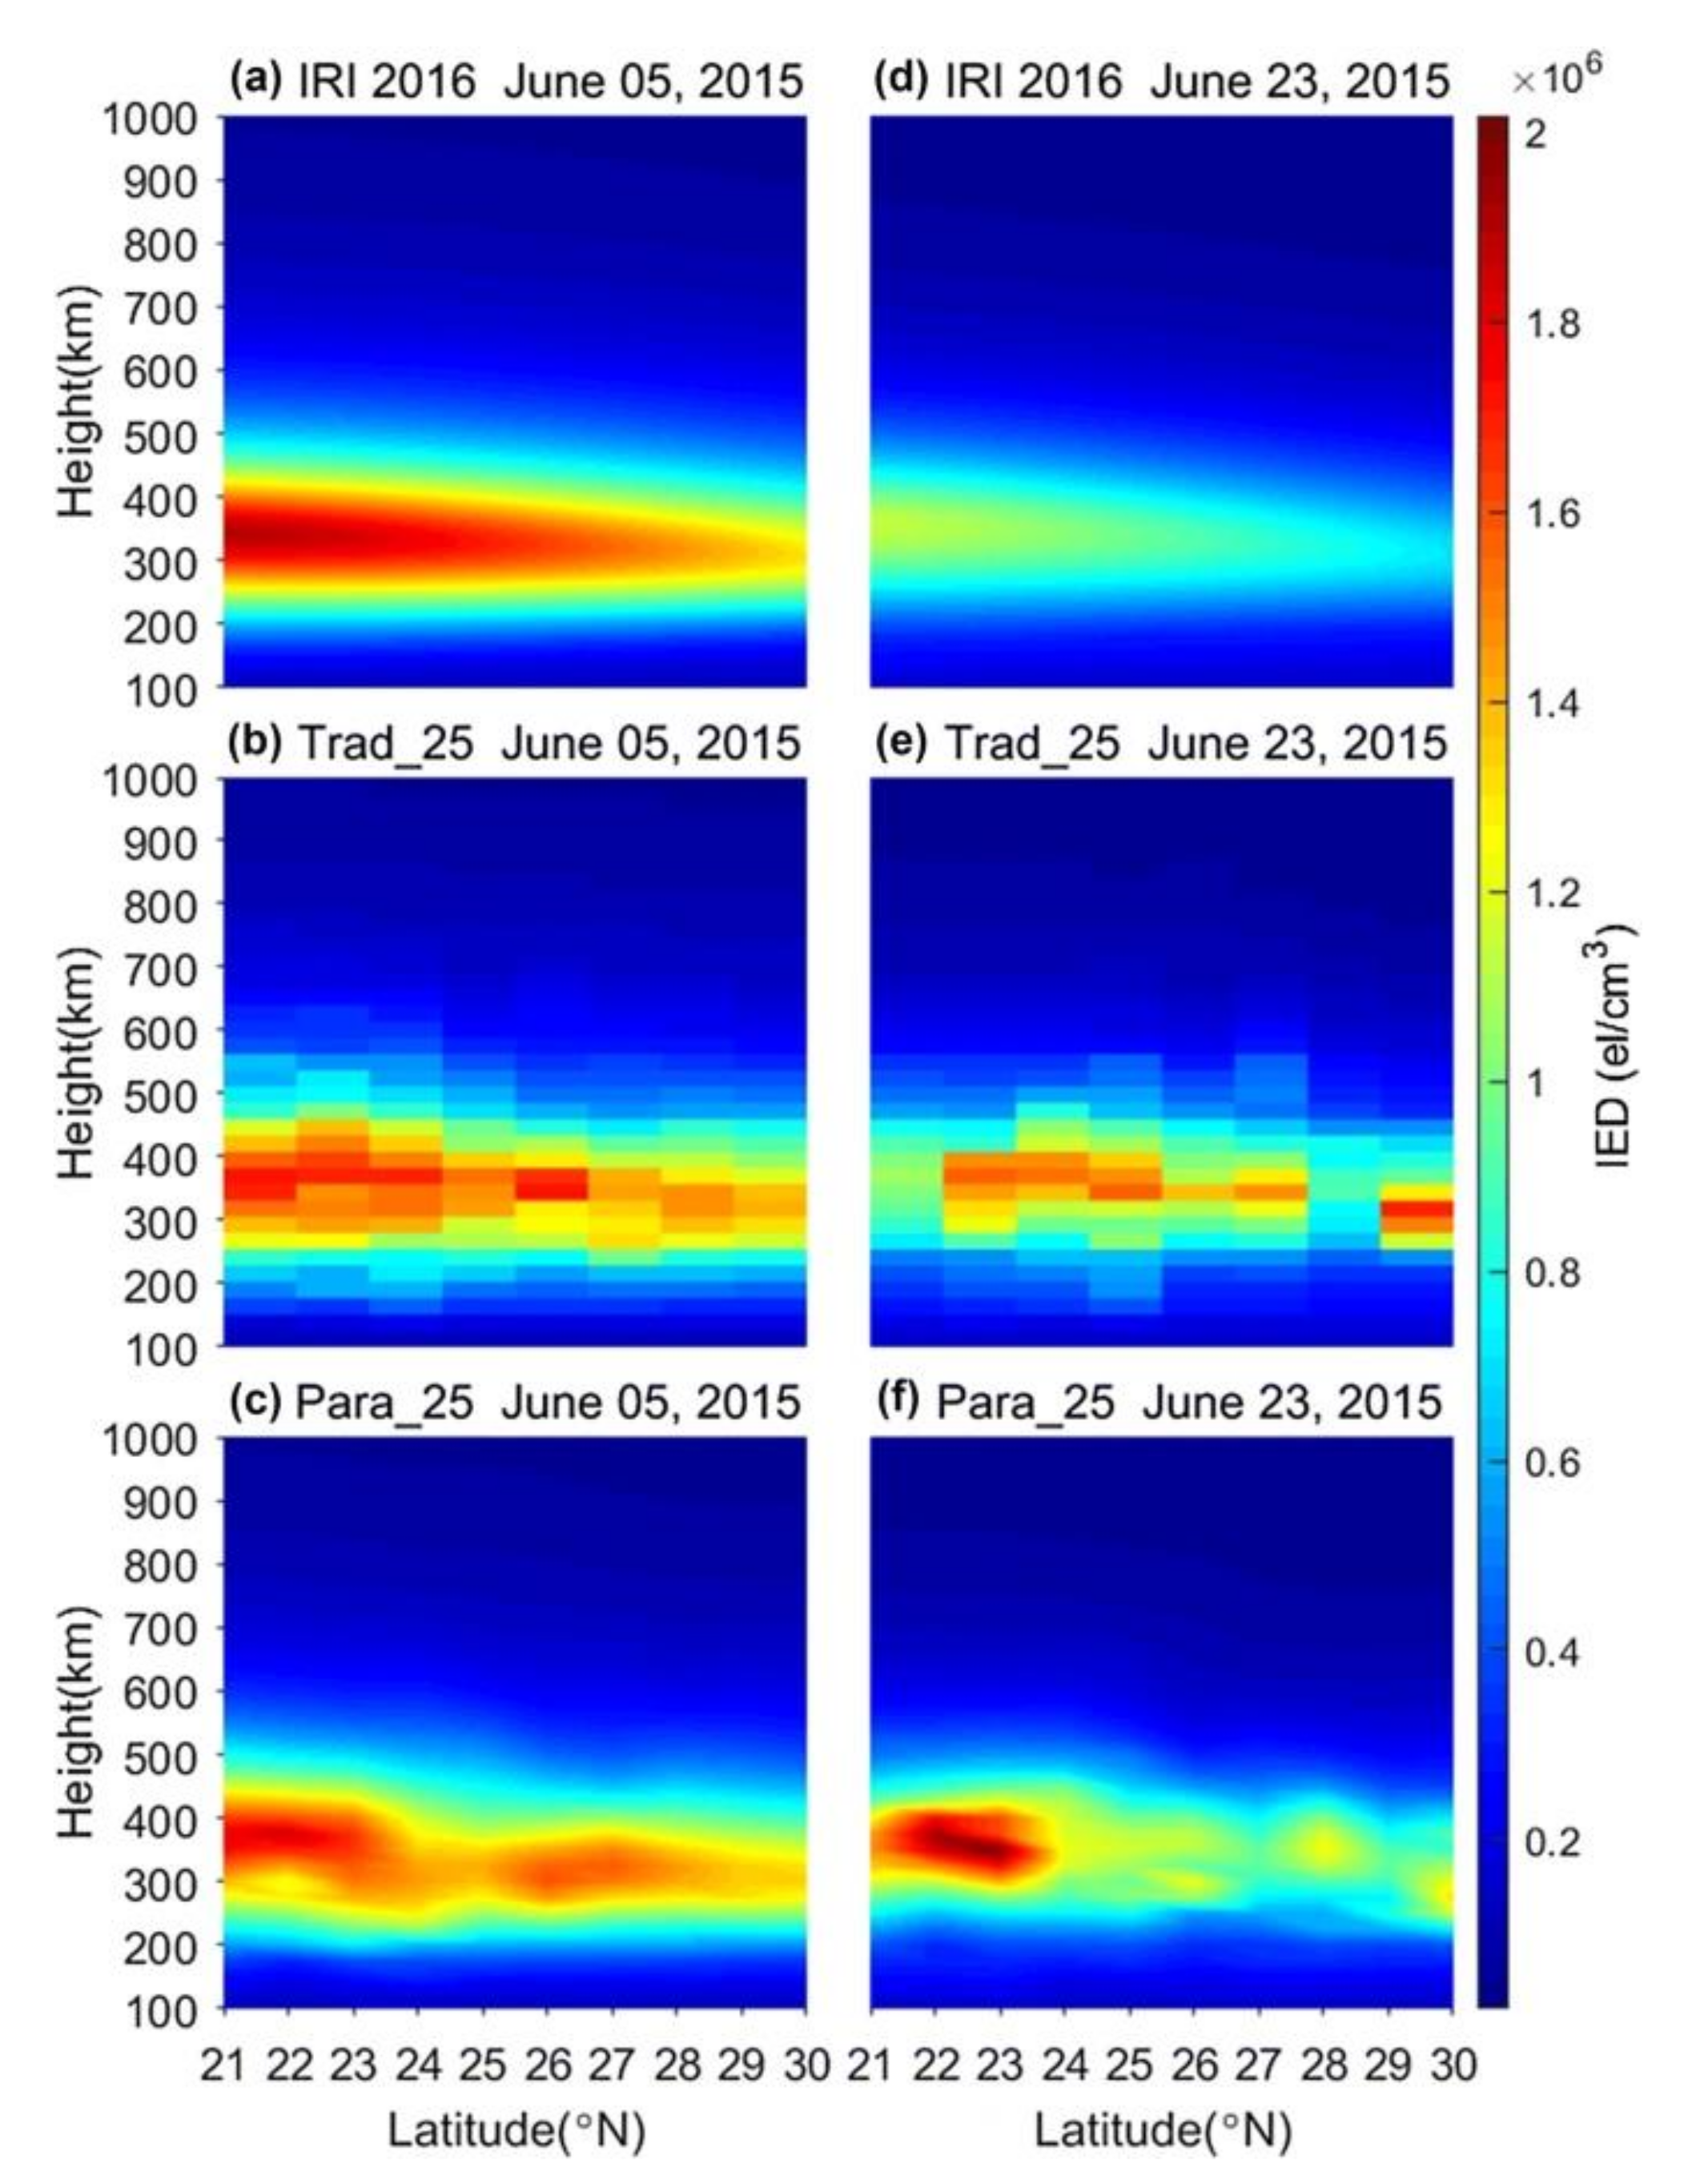
Compared with the estimation from IRI, the tomographic image can specify the ionospheric structures more precisely. Although the fineness of the tomographic image is limited by the ill-conditional problem, it can be improved by the variable voxel homogeneity model. In Figure 7, the reconstructed ionospheric variation (Figure 7b,e) is much more complex than the initial estimations from IRI (Figure 7a,d). Although conventional tomographic images in Figure 7b,e are easy to confuse with the manifestation of MSTIDs because of the wave-like structures, the improved tomographic images clearly illustrate some medium and small-scale disturbances with adjusted voxel homogeneity, as shown in Figure 7c,f. This shows the potential of tomographic images in the study of medium- and small-scale ionospheric variations.
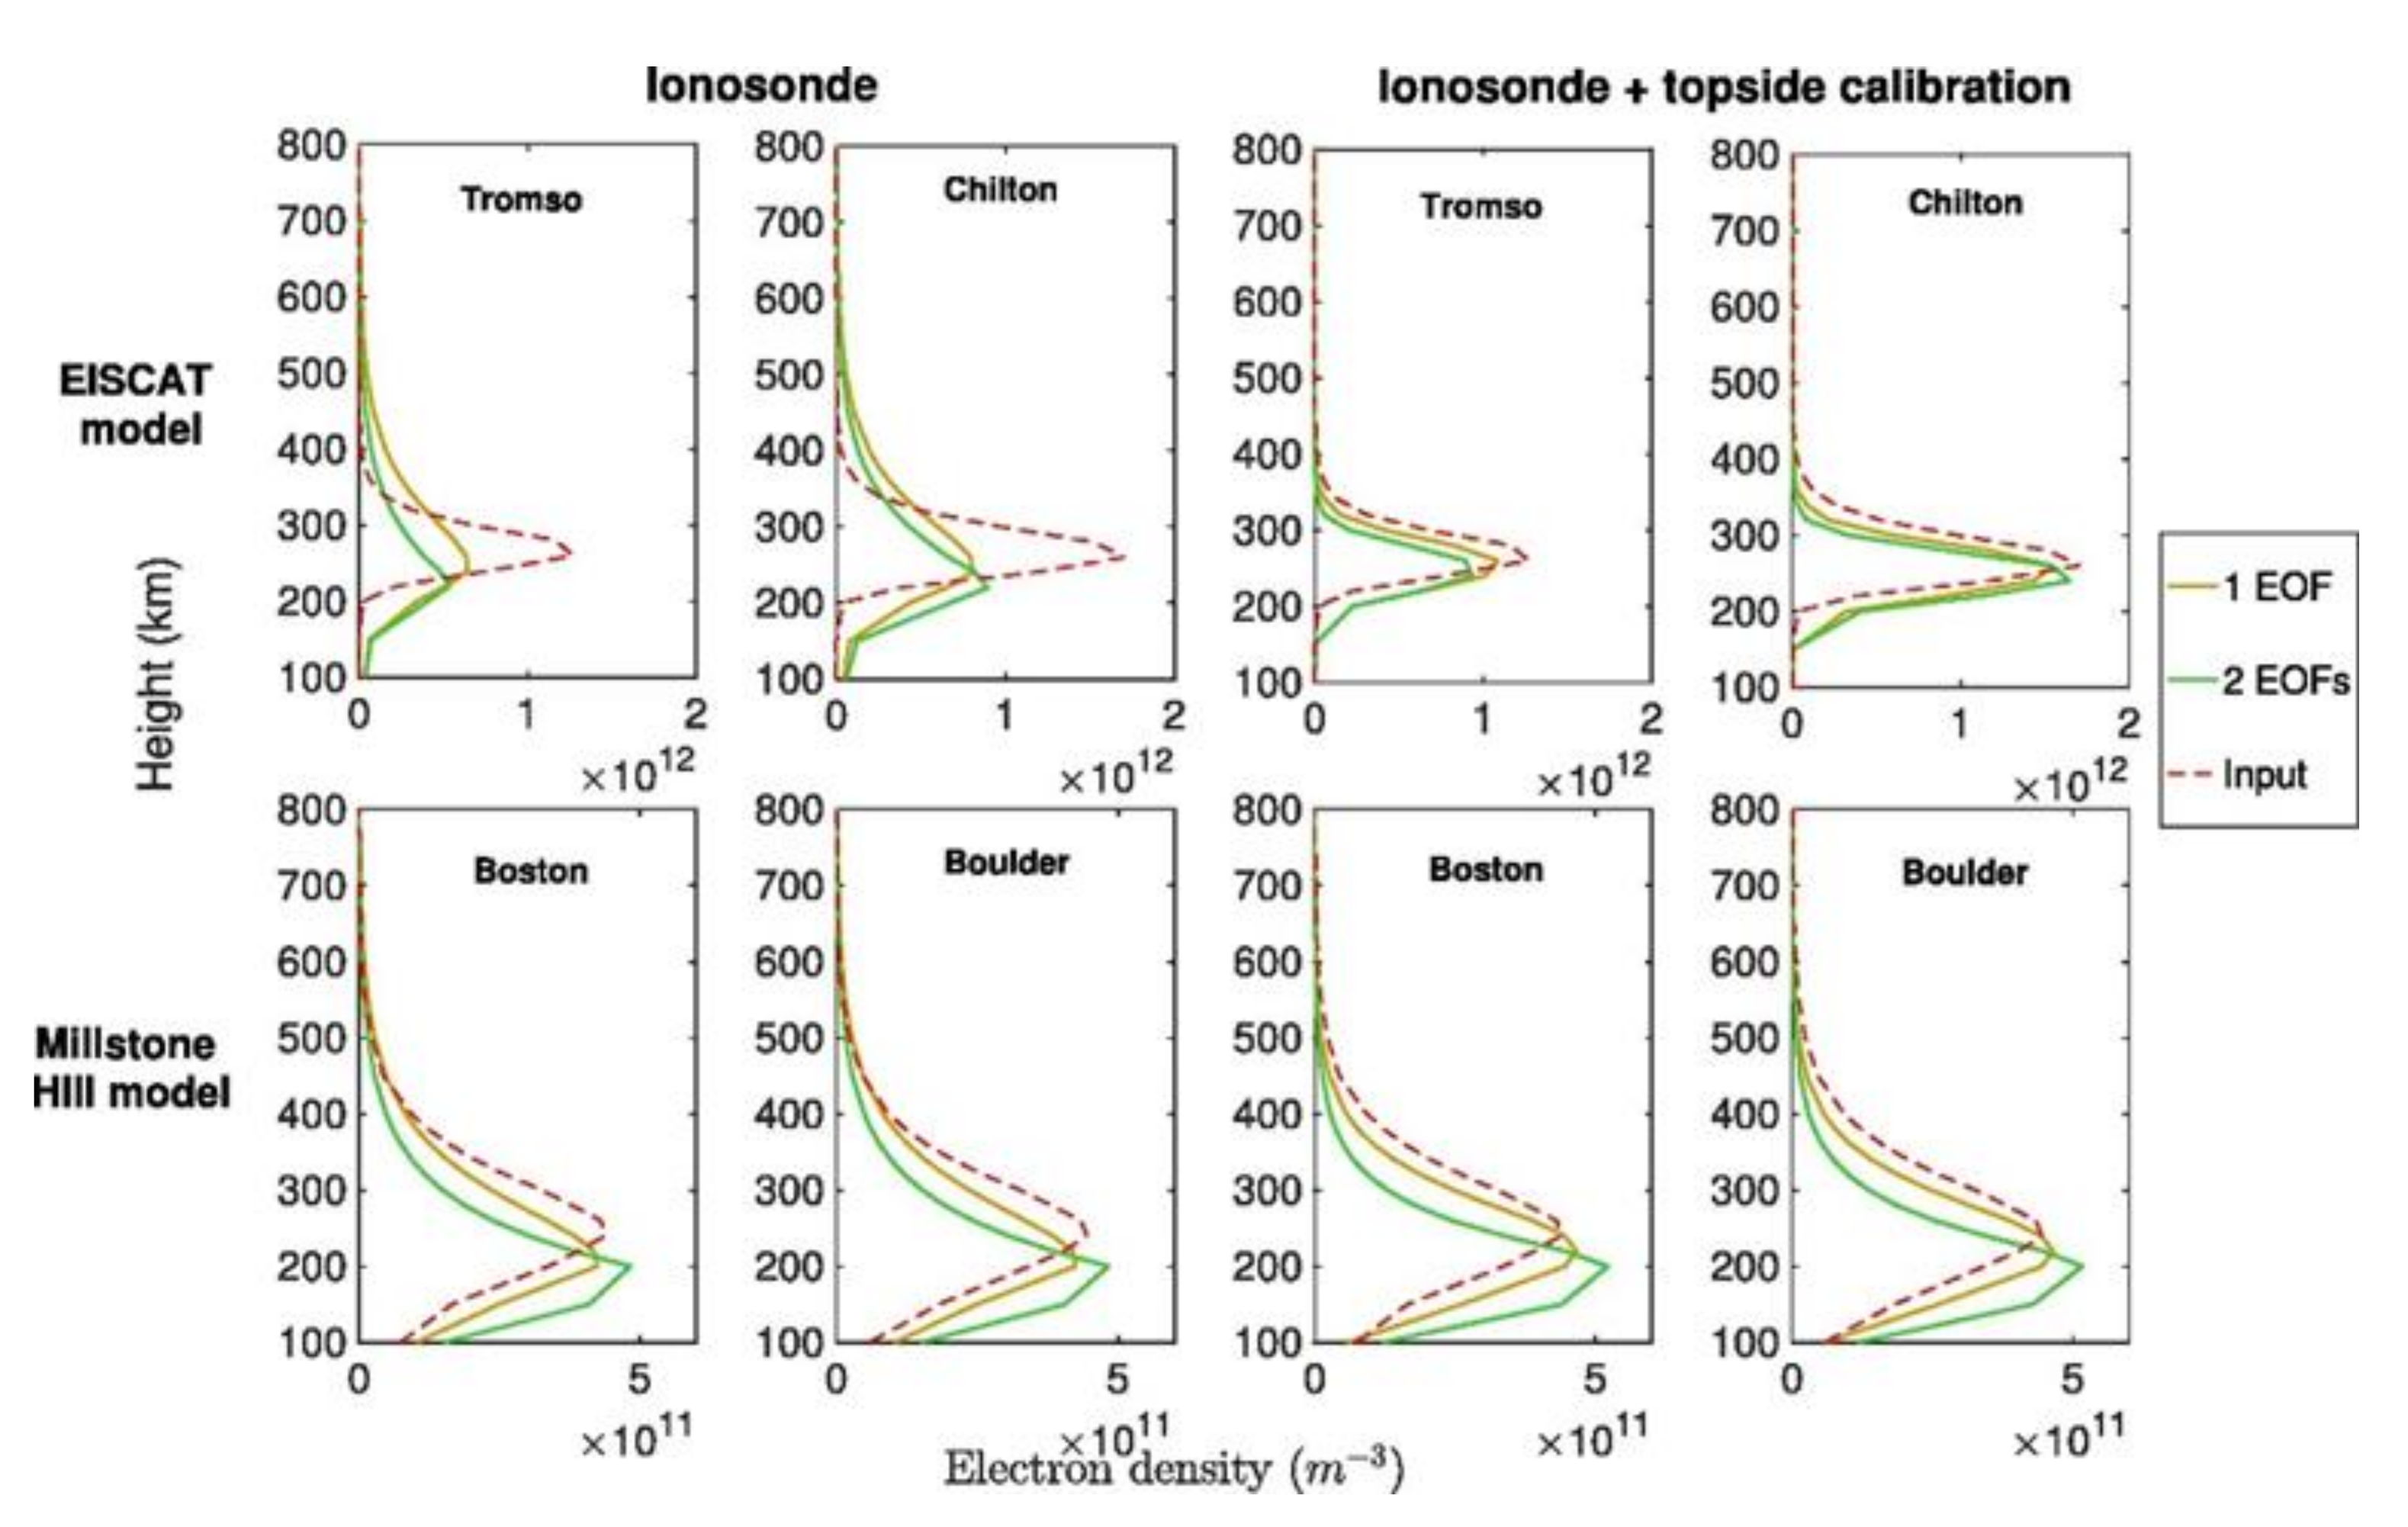
With the ill-conditioned problem mitigated by the constraint, the height profile of IED at any location in the observation area can be reconstructed. Figure 8 gives the IED profiles from CIT by using local ionosonde observations as constraints and ionospheric profiles from ISRs as the input initial estimations. In the two top-left panels of Figure 8, the reconstructed IED peaks are seriously underestimated compared with the inputs. When the constraints were improved by topside calibration, the reconstructed profiles show closer agreement to the input profiles even at the location far from the ionosonde as shown in the two top-right panels. On the other hand, in the bottom panels, because the constraints from ionosonde data are close to the input model, the improvement from topside calibration is not obvious and one EOF is adequate [39]. Therefore, the accuracy of the constraint has a significant effect on the tomographic images, especially around the IED peak height.
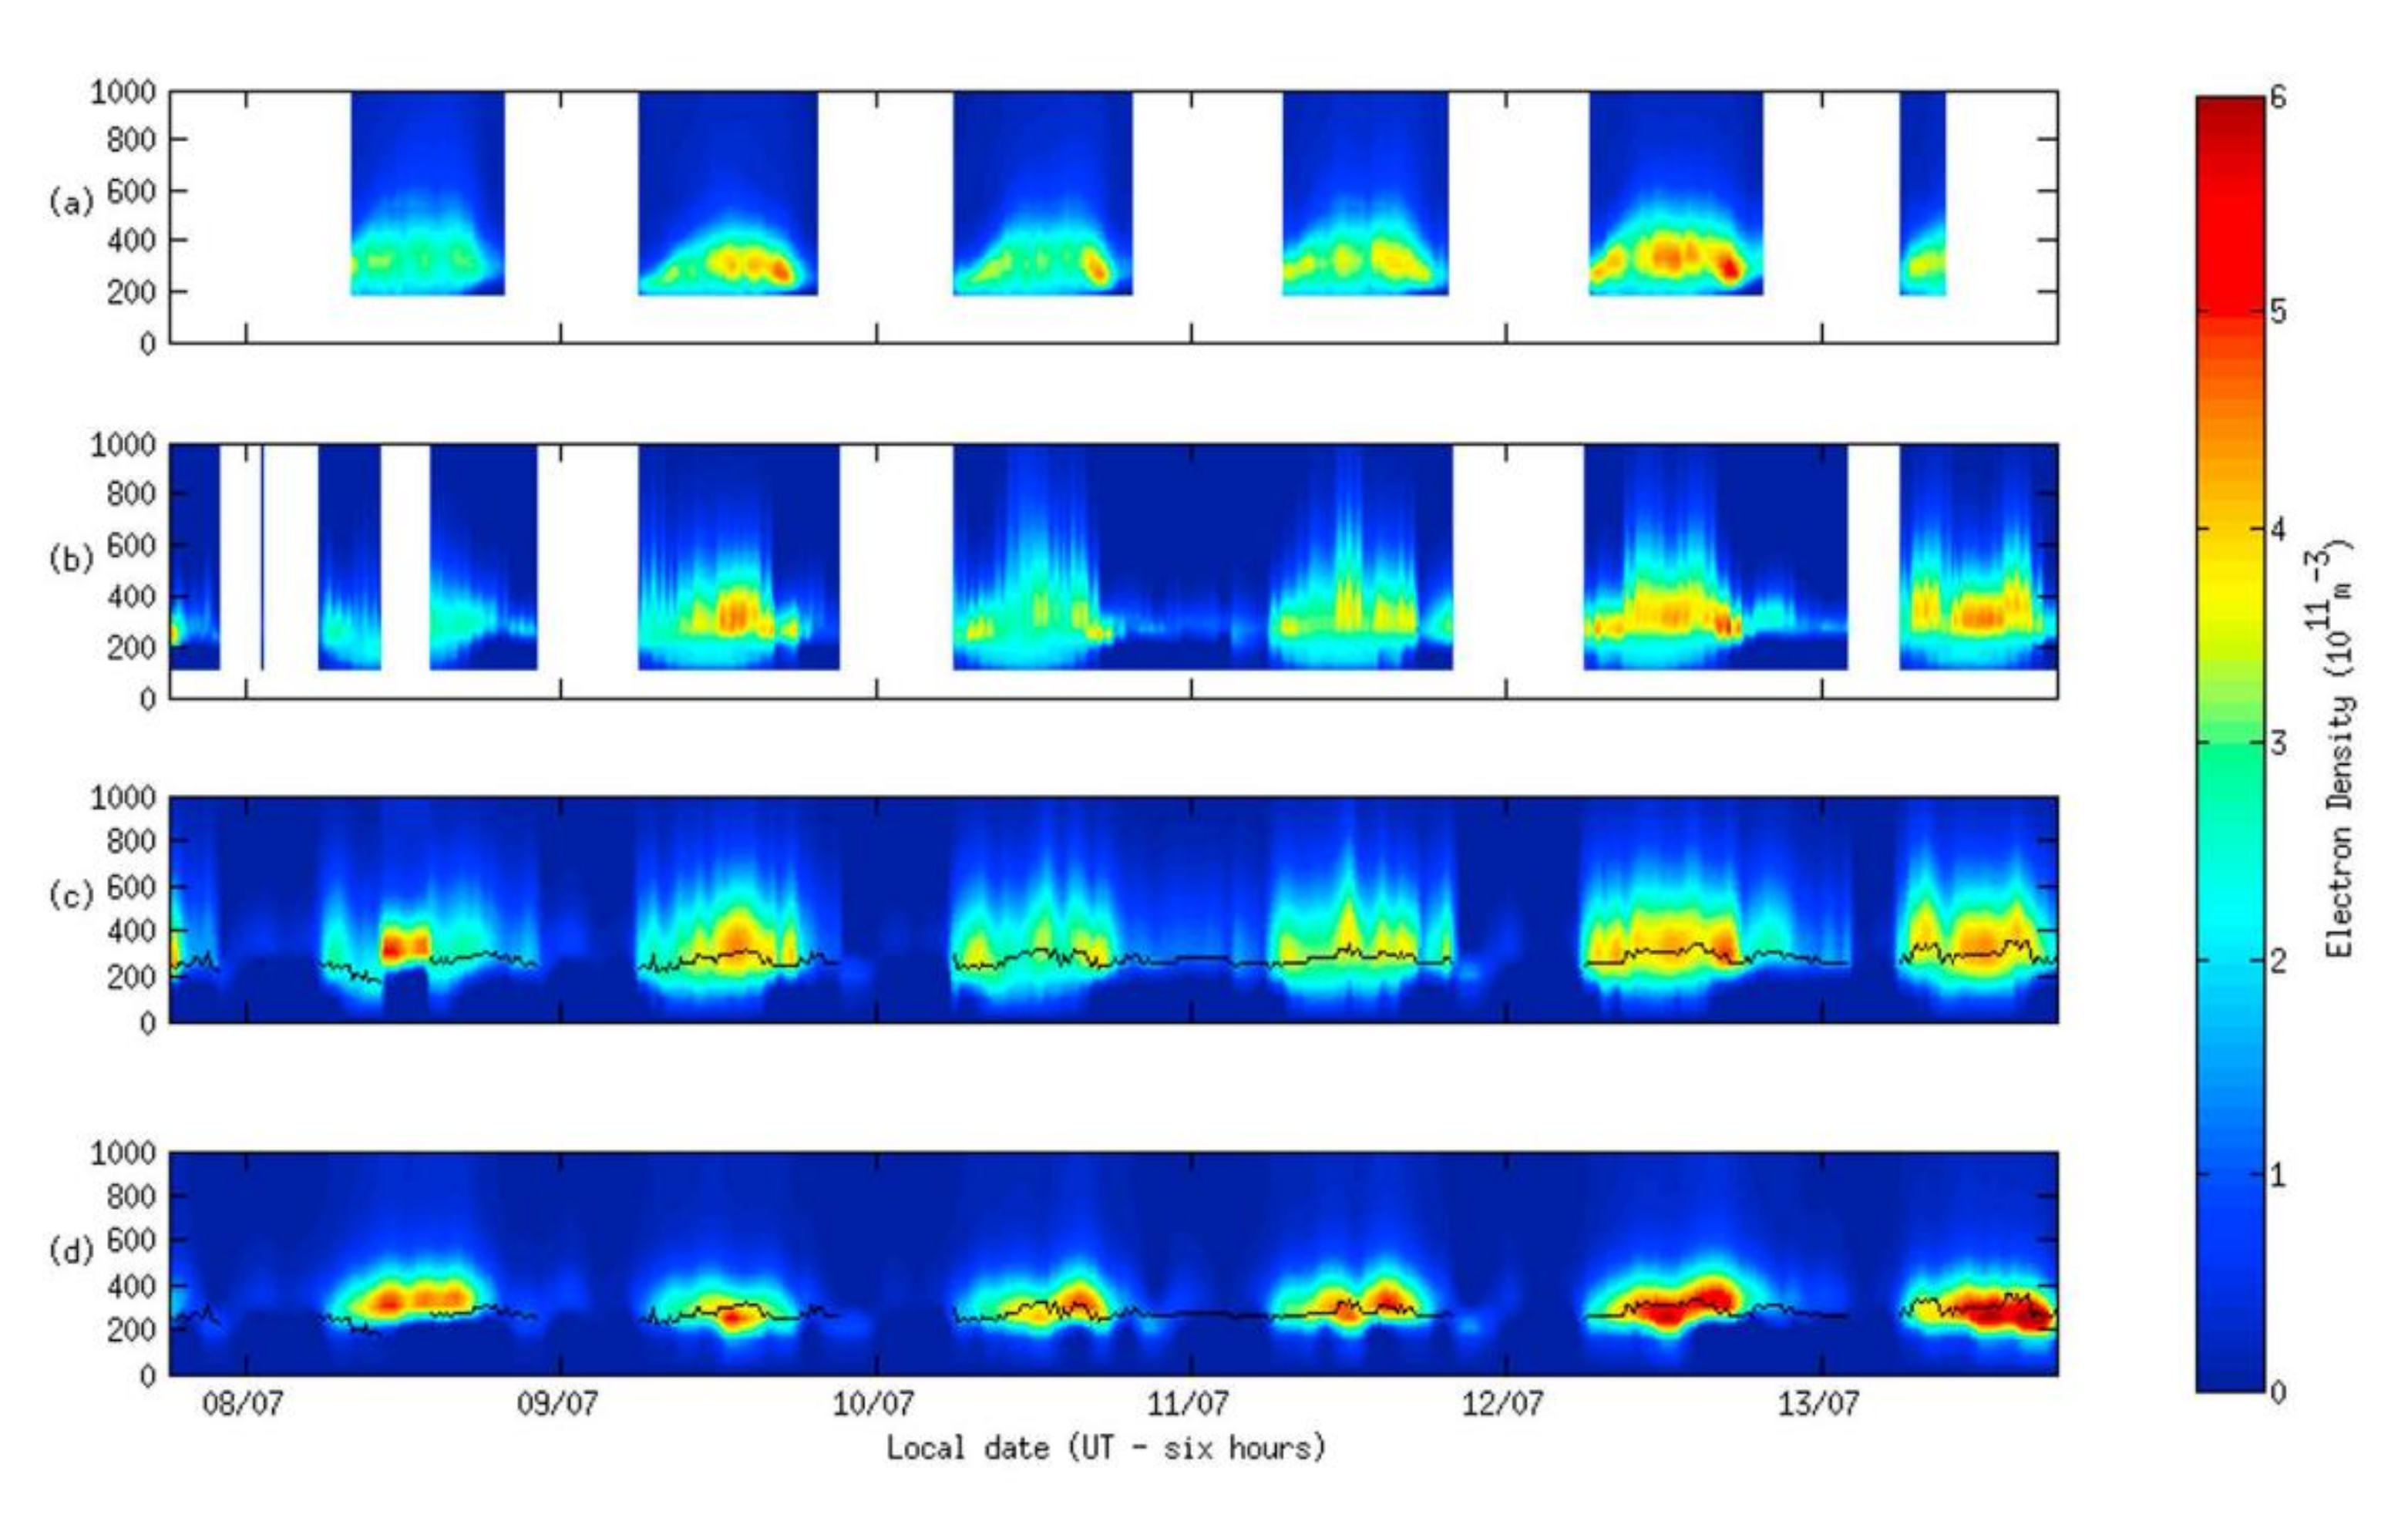
In Figure 9, the tomographic images are verified by ISR observations (Figure 9a). Combined with the ionosonde data (Figure 9b), the reconstructed images in Figure 9c are close to the ISR images. On the other hand, in Figure 9d, the IED peaks of the tomographic images with only GNSS observations are overestimated compared to the ISR images, especially at the IED peak height. This comparison implies the precision of tomographic images can be further improved by data fusion even though the ionospheric empirical models and physical models are significantly different from the actual disturbing structures.
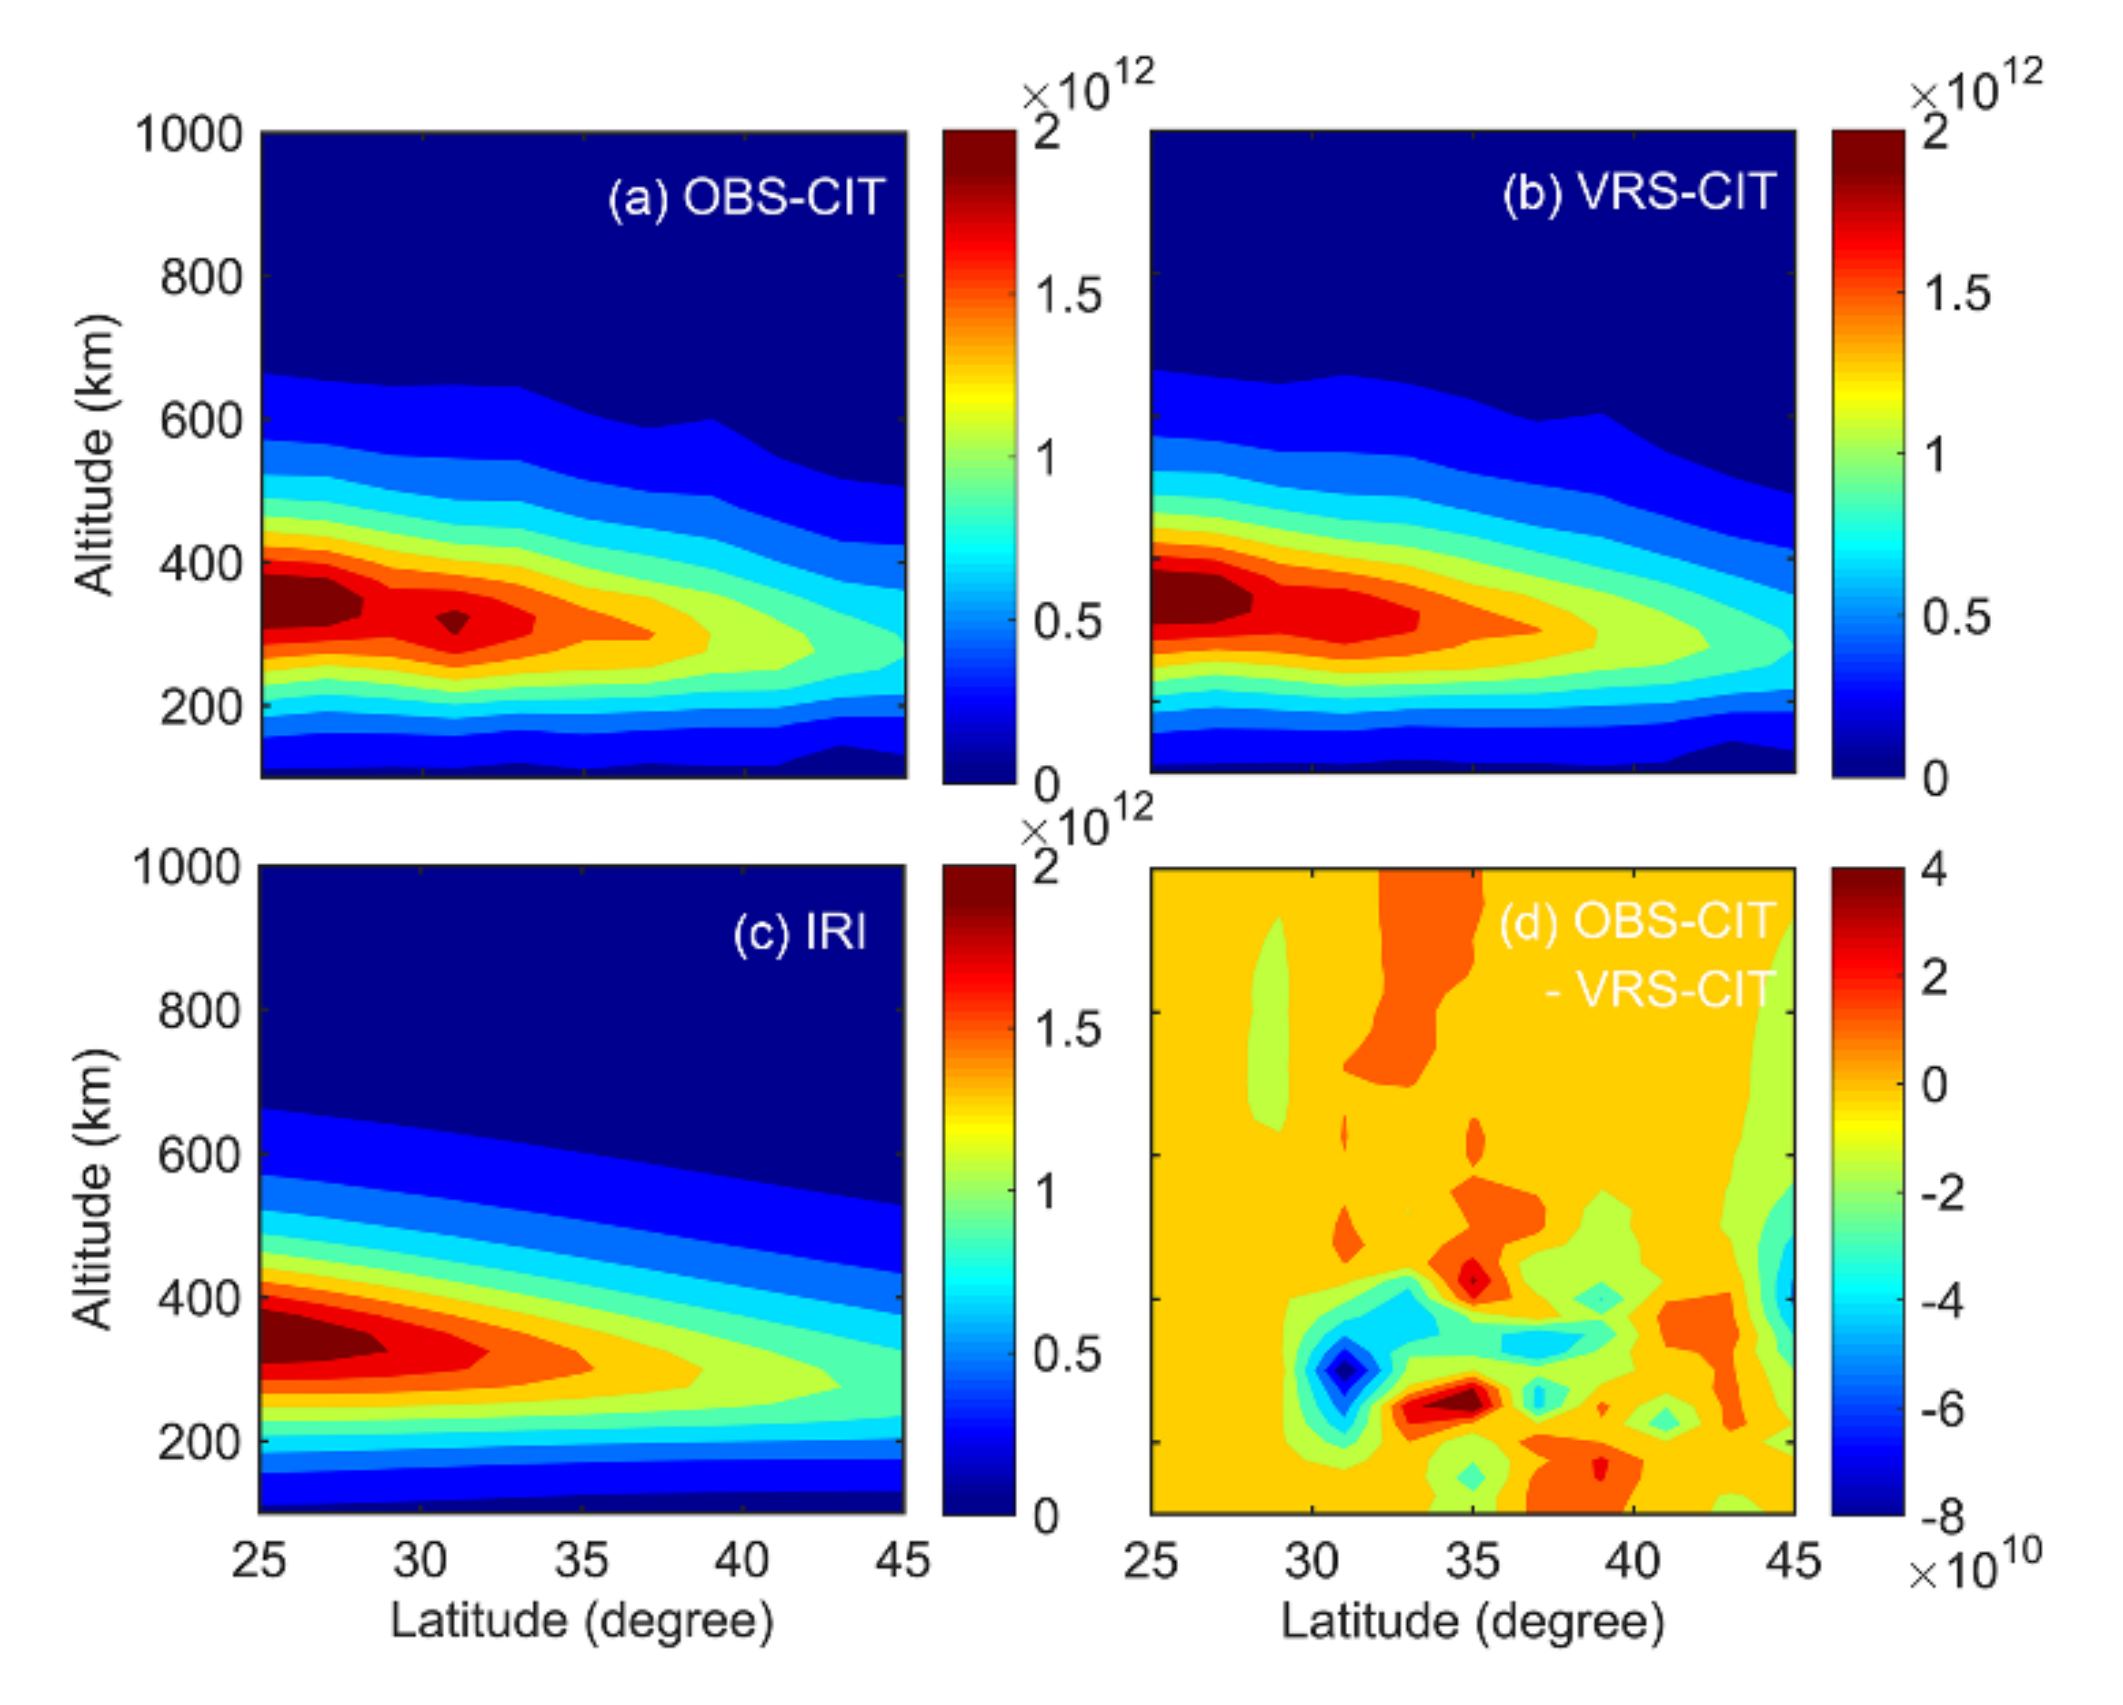
Figure 10 shows a typical CIT with MART and the comparison of tomographic image with IRI. With only observation stations, an abnormal IED peak appears around 31°N and 300 km in Figure 10a because of the ill-posed problem. The IED values at the abnormal peak are equal to the initial estimations from IRI (Figure 10c). With the VRSs added, the corresponding voxels are traversed by the virtual rays and hence the abnormal peak disappeared. The IED images become more reasonable (Figure 10b) and the variation is obvious (Figure 10d). Besides the supplement of the virtual observations from VRSs, the ill-posed problem can be mitigated by smoothing and fitting. With the unilluminated voxels coupled with the illuminated voxels, the IED of different locations in the observation area can be determined.
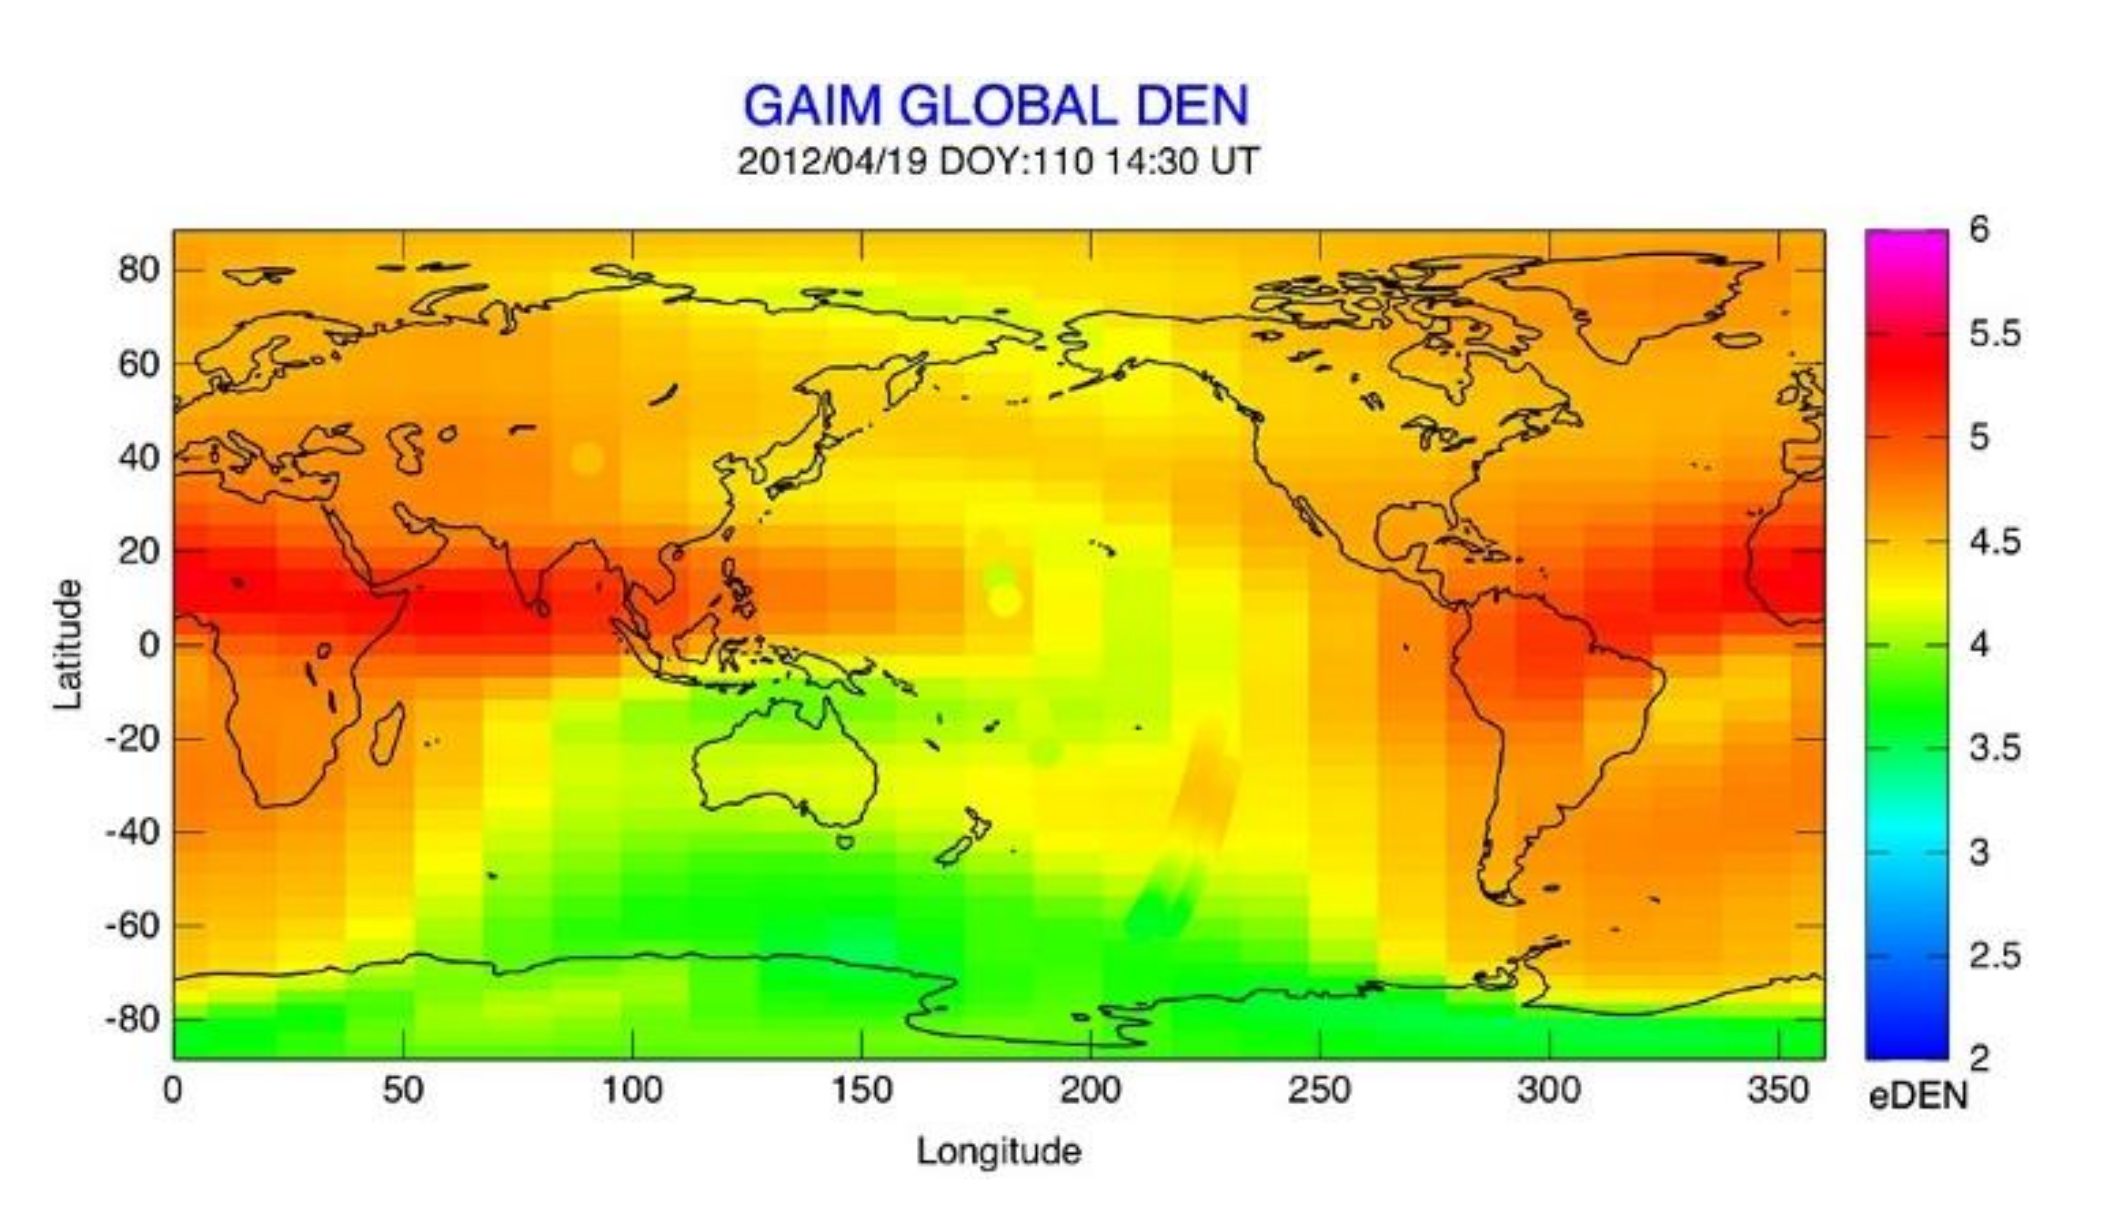
Figure 11 shows the global IED results at 800 km altitude from global assimilation of ionospheric measurements (GAIM)-Gauss Markov algorithm. The electron densities from DMSP and radio occultation are overlaid for comparison. In the southern hemisphere near 220° longitude where DMSP traversed, the general IED structure is reproduced by GAIM. At 90° longitude and 40° latitude, and 180° longitude between 10° and −10° latitude, the radio occultation density measurements demonstrate the need of topside data to accurately reproduce the topside structure in GAIM. The GAIM uses a physics-based ionosphere-plasmasphere model and a Gauss Markov Kalman filter as a basis to assimilate a diverse set of measurements in real-time [85]. GAIM can provide specifications and forecasts on a spatial grid that can be local, regional, or even global. The technique was proposed by Schunk et al. (2004) [51]. In addition to radio occultation and DMSP measurements, GAIM has been validated by the IRI model and ionosonde measurements [86]. Therefore, GAIM is a promising CIT technique due to its reliability, flexibility, and real-time ability.

6.2. Ionospheric Disturbance Study

The advantage of CIT over other instruments is two- or three-dimensional observation on a regional scale. This makes it valuable in various ionospheric disturbance studies.
The ionospheric storm is a typical large-scale disturbance structure. Figure 12 shows the tomographic images during an ionospheric storm on 18 August 2003, together with those of the quiet ionosphere on previous and following days. IED enhancement is evident in both latitude and altitude ranges (Figure 12b). Northward expansion of EIA is remarkable, and a positive disturbance is shown in the entire F region at the latitudes below 35°N. However, at the latitudes above 35°N, the ionosphere above 600 km is enhanced, while the negative storm phase effect appears from 200 to 600 km. Ionospheric disturbances are usually a mixture of several processes and two or more processes may compete with each other. The analysis of the leading mechanism should benefit from CIT outputs.
A study on MSTIDs with CIT is shown in Figure 13. The top panels show the reconstructed IED at three consecutive times. The black lines with wave-like variations refer to the peak height from reconstruction IED, which manifest the MSTIDs. The white dashed lines are peak height from IRI and do not show any variation. The good correlation exists between the enhancements observed in the tomographic images and the TEC perturbation images. In addition, the F2 peak layer anticorrelates with TEC variations (the blue dashed lines). This feature indicates the electrodynamic nature of MSTID based on Perkins instability [87].
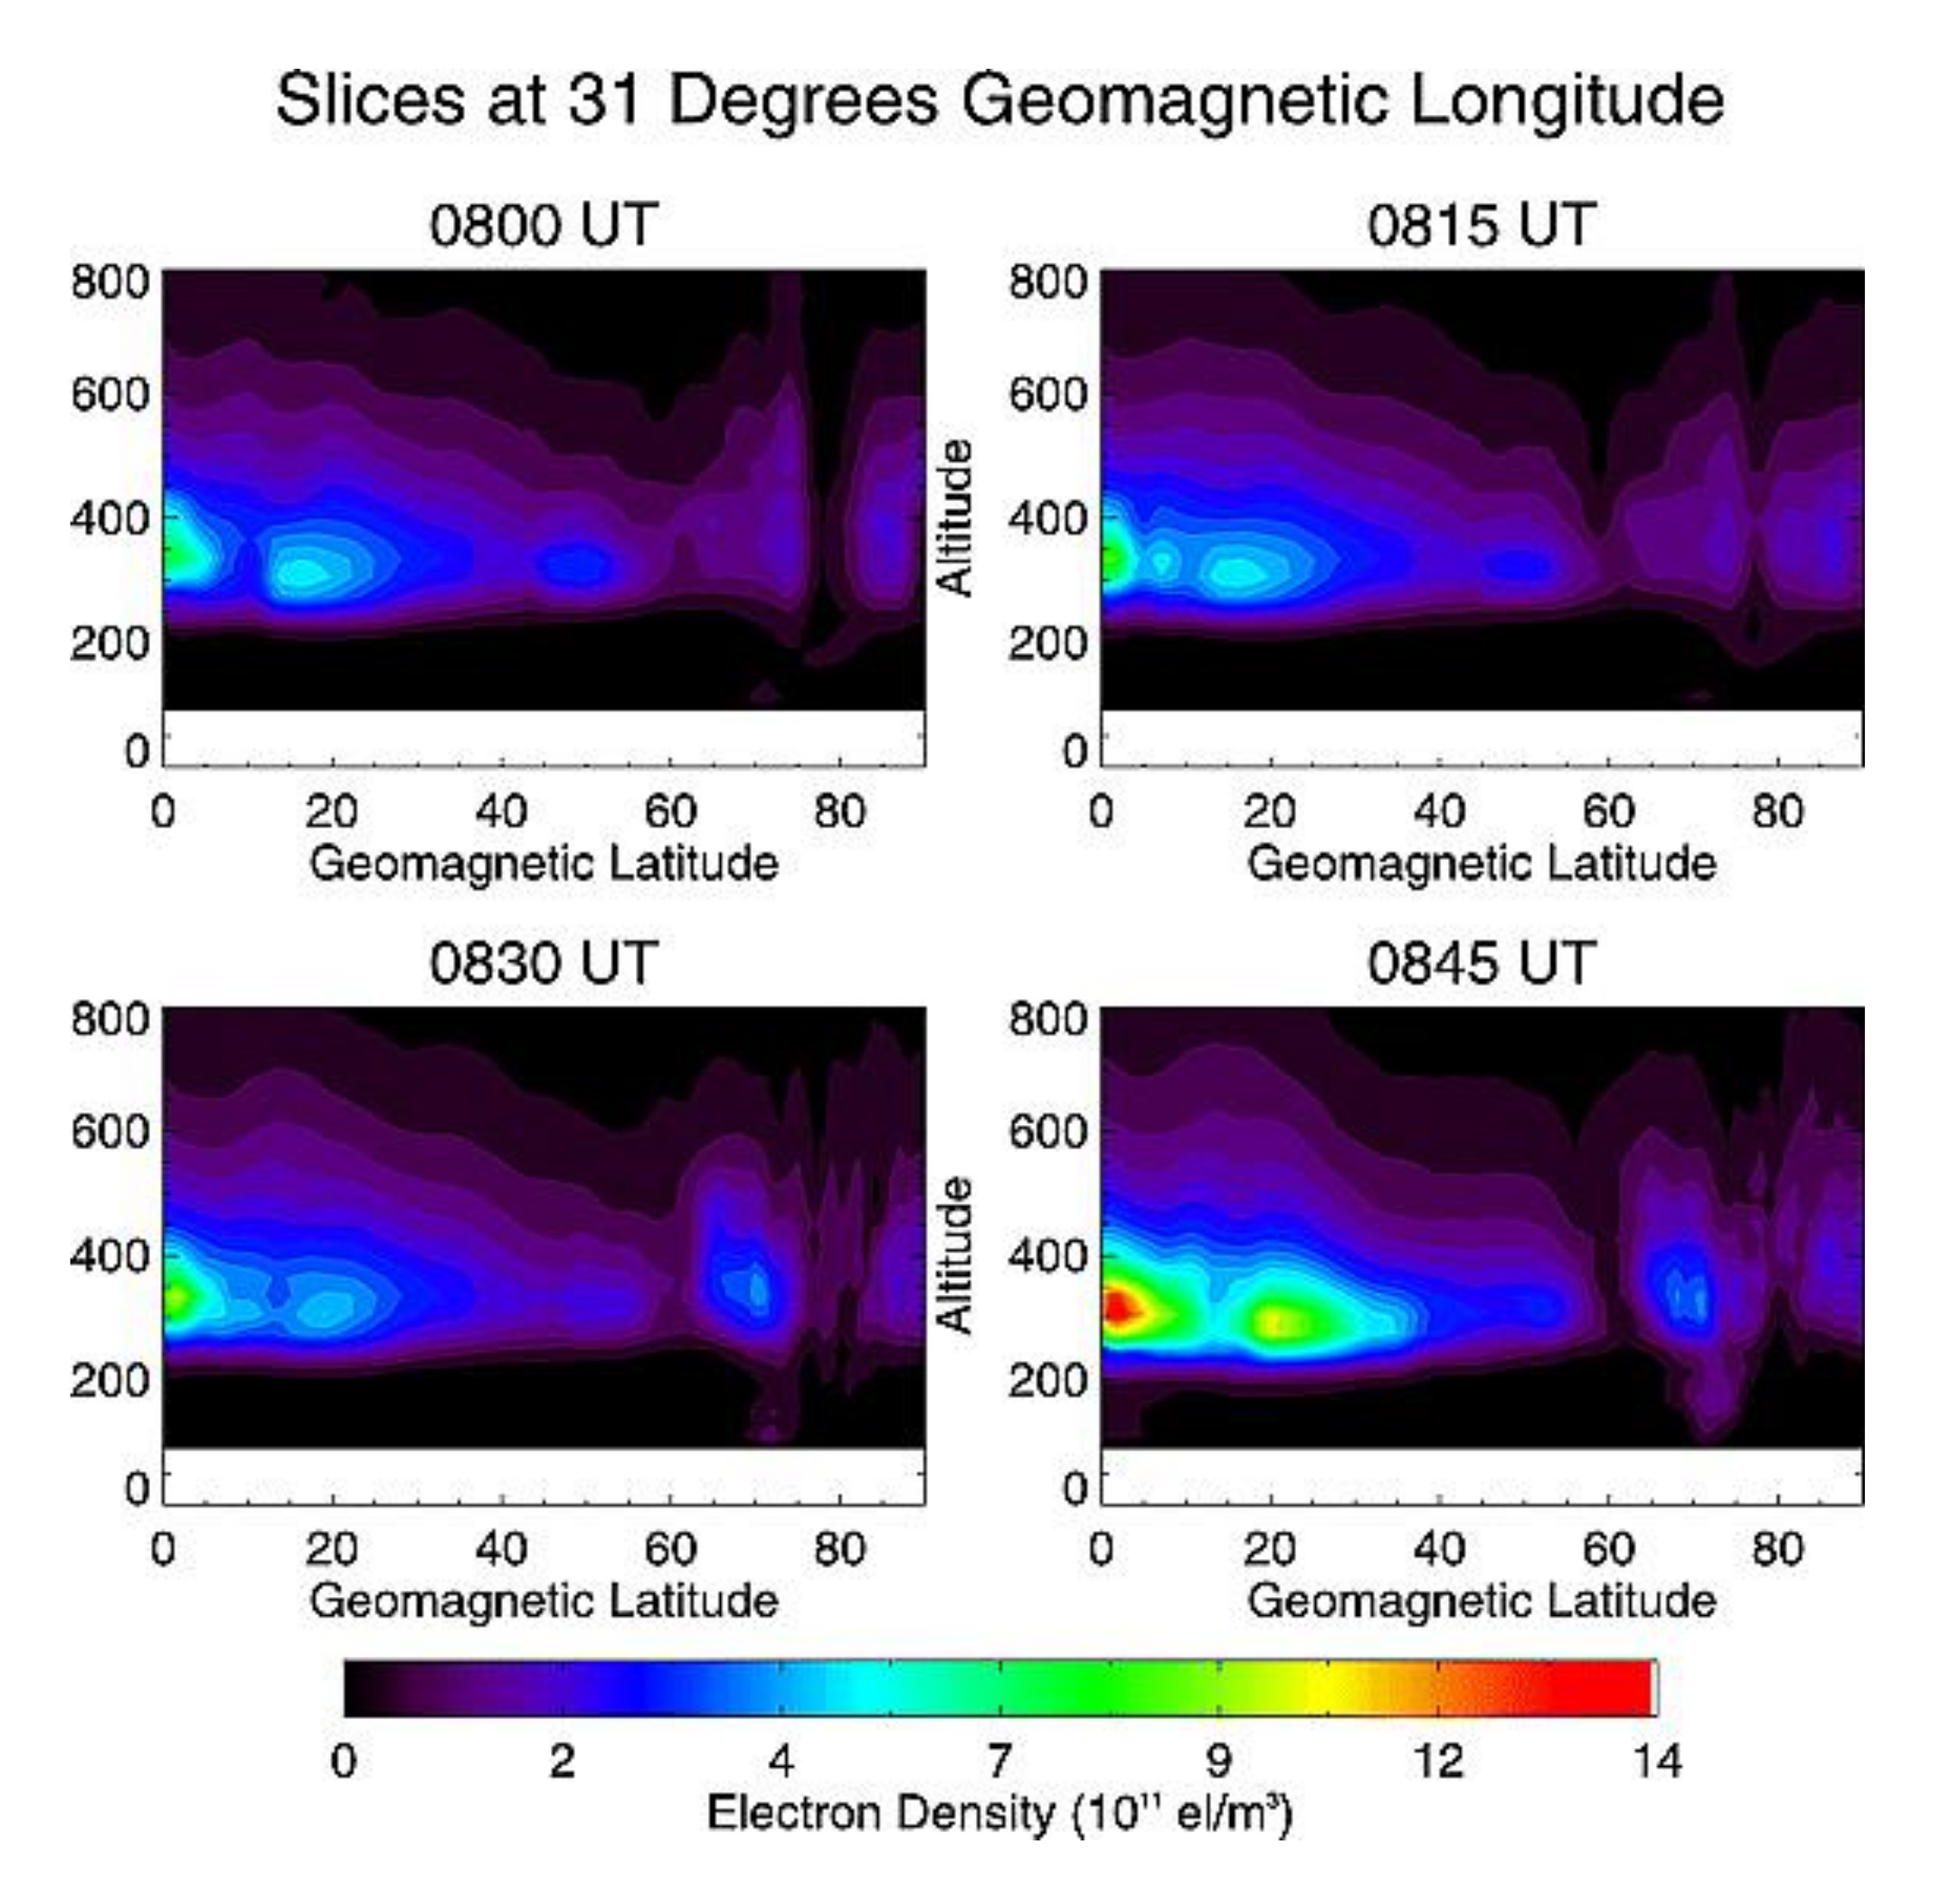
Dynamic evolution of the ionospheric trough in high-latitudes is also studied with CIT. In those areas with only sparse observation, GNSS is an important supplementary observation. Although GNSS has some limitations in polar regions due to the inclination of satellite orbits, the tomographic images can be obtained by data assimilation with multi-source observations. Figure 14 shows the geomagnetic latitude-altitude images of IED in the northern hemisphere, where the structure of a trough in high-latitudes is very clear. The dynamic features of electron density are reproduced by CIT, including the strength of the trough as well as the movement of the auroral boundary. The evolution of the high-latitude auroral boundary can be recognized by the time series of the tomographic images. It should be pointed out that the images were obtained by data assimilation with multi-source data. The satisfactory quality of reconstruction in high-latitudes in this case is mostly because of the supplement of LEO beacon observation, in particular the Greenland tomography chain. In fact, such detailed results in high-latitudes cannot be achieved with available ground-based GNSS data. In such cases, multi-source data are important supplements for CIT.
Song et al. (2021) [89] also successfully detected large-scale traveling ionospheric disturbances (LSTIDs) and nighttime MSTIDs by CIT. In addition to the studies of large-scale and medium-scale ionospheric disturbances, the structures with smaller scales started to be studied by CIT. Prol et al. (2018) [90] analyzed the feasibility of using CIT to study the ionospheric equatorial plasma bubbles (EPBs) over the Brazilian region. They compared IED images from CIT with simultaneous observations of all-sky images in the 630.0 nm emission line of the atomic oxygen. The mean rate of success of the tomographic method was 37.1%, being more efficient near the magnetic equator.

6.3. Ionospheric Correction

The ionospheric effects distort radio waves propagating through it. The TEC model has been used to calibrate the measurements in radio systems such as radio astronomy, radar and GNSS positioning with a single frequency signal. Because the ionospheric single layer model brings errors in ionospheric correction with two-dimension TEC, CIT becomes a next-generation ionospheric correction, especially for the region with ionospheric disturbances. Meggs and Mitchell (2006) [91] have demonstrated a threefold improvement in TEC mapping using three-dimensional imaging compared to two-dimensional ionospheric mapping. Voxel-based CIT has been applied to calibrate the ionospheric delay in single-frequency PPP with GNSS. Prol et al. (2018) [64] demonstrated that three-dimensional imaging in ionospheric correction can improve the estimation of TEC by 59% and single-frequency PPP by 31% in comparison to the results derived from the two-dimensional map. In high precision measurement with GNSS, such as SBAS or PPP-RTK, function-based CIT has been applied in consideration of the limitation of the ionospheric single layer model. The estimation errors in SBAS can be reduced by 30–50% compared to a planar fit on the thin shell [92]. The convergence time in PPP-RTK can be reduced from 80 epochs to 20 epochs with a sample rate of 30 s compared to the time without external corrections provided [93]. Voxel-based CIT may be applied to these fields if the resolution and precision meet requirements. In addition to GNSS, ionospheric correction with three-dimensional image can be utilized for other trans-ionospheric radio systems such as radar altimeter and radio telescope.

6.4. Ionospheric Monitoring

Because ionospheric disturbances affect the operation of trans-ionospheric radio systems, ionospheric monitoring is an important part of space weather. Saito et al. (2017) [32] reported a real-time three-dimensional ionospheric tomography system using GNSS measurement data from 200 GNSS receivers distributed throughout Japan. It commenced operation in March 2016, and it continuously produces three-dimensional electron density distributions over Japan every 15 min with a latency of about 6 min. The real-time monitoring system can improve the performance of GNSS-based systems and further the understanding of ionospheric variations.

7. Future Directions

More than 30 years have passed since the first report of CIT was published, and voxel-based CIT with GNSS ground receivers has been developing continuously during this period. Bust and Mitchell (2008) [12] made an introduction to the future directions a dozen years ago, in which multi-source data have enhanced the ability of GNSS-CIT and tomographic images from CIT have benefited various applications. Higher resolution and precision are still being pursued, especially for the global four-dimensional CIT. Voxel-based CIT with only ground-based GNSS data has almost reached its limit of possibilities, since spatiotemporal resolution and reconstruction errors cannot be further significantly improved using the current infrastructure. Together with different types of data and background information, CIT will contribute to bridging the gap between models of upper atmosphere and observations.
The early CIT aimed to reconstruct some reasonable IED height profiles. Now the three-dimensional IED can be reconstructed by CIT. However, due to the ill-conditioned problem and the number of receivers and satellites, the resolution of CIT is still limited. With the densest GNSS network which consists of more than 1200 receivers in Japan, Seemala et al. (2014) [94] realized a horizontal resolution of 1° × 1°, and a mixed vertical resolution with a minimum of 25 km. Muafiry et al. (2018) [95] tried CIT of the sporadic E layer with voxels as small as 0.16° × 0.20° × 30 km, which is an interesting challenge. Furthermore, Ghaffari Razin and Voosoghi (2017) [81] realized a vertical resolution of 10 km and a horizontal resolution of 1° × 1°. Higher resolution may be realized with more satellites and more occultation data, since more navigation satellites and LEO satellites have been put into operation.
Resolution and precision are mutual constraints in CIT, which leave a lot to be improved. The research on precision is an important part of realizing global-scale CIT. At present, it takes priority to solve the ill-conditioned problem. Nevertheless, the errors brought by additional constraints or other measurements cannot be ignored. Detailed efforts on related problems and algorithms should be continued. Moreover, effective improvements in the CIT techniques are attractive.
In terms of both physical and mathematical perspectives, the real-time ability remains to be a future direction, even though the four-dimensional CIT model has been presented from simulations to real data experiments [77,79]. The large-scale CIT, even global CIT, is equally significant. Although a global CIT model has been presented by Scherliess et al. (2004) [78], the global real-time CIT remains to be a challenging topic. He et al. (2013) [96] presented an algorithm to realize global real-time CIT, while the resolution can still be improved. Gerzen et al. (2020) [97] developed a four-dimensional global CIT with an ensemble Kalman filter, while the altitudes were restricted between 430 and 20,200 km. In morphology and dynamics studies of ionosphere and ionospheric monitoring, the global real-time CIT with higher precision and resolution is a continuous goal. In order to achieve it, an algorithm processing massive data with faster speed and lower computational load should be designed, and the data from more GNSS ground receivers or other instruments are necessary. Simultaneously, resolution and precision must also be ensured.
With more observation data available and more techniques presented, the resolution, precision and scale can be gradually improved, and the future applications of CIT will be extended. Higher resolution and precision benefit the studies on the electron density variation of the ionospheric fine structures. Larger scale is beneficial to the studies of large-scale disturbance. The tomographic image and vertical profile will be indispensable supplements to other observations. In GNSS high precision positioning, the voxel-based CIT will provide more reasonable ionospheric correction to decrease the estimation errors and convergence time. Meanwhile, the real-time positioning requires the real-time ionospheric model. Furthermore, the three-dimensional ionospheric image will provide more reliable and wider integrity monitoring on ionospheric dynamics, since IED can vary much with no significant change in TEC.

8. Summary

Although numerous voxel-based CIT methods have been developed and widely used in the past 30 years, the most crucial challenge in CIT is still the ill-posed and ill-conditioned problem. In voxel-based models, the balance of resolution and accuracy is critical. The voxel size should be determined based on the distribution of the GNSS receivers and corresponding rays. In order to solve the ill-conditioned problem, additional information needs to be supplemented in equation construction. Since various information contains respective system errors and random noises, the dependence should be considered thoroughly. The selection of the algorithm in equation solving or result estimation should be based on utilized data and computational load. The ART has an advantage of incorporating prior information, but it is an iteration in the epoch interval and has a large computational load. The Kalman filtering and ANN are recursive algorithms between epochs and have an advantage of real-time or near real-time computation. Similarly, the parameters in these algorithms should be adjusted by the noise levels.
The strength of CIT is that ionospheric morphology and dynamics can be studied over various temporal and spatial scales. Therefore, CIT has proved a useful technique to complement the observations from other instruments, since the distributions of ionosondes and ISRs and occultation data are relatively sparse. Furthermore, CIT provides a new insight to identify important factors of vertical ionospheric profiles and complements two-dimensional ionospheric modeling. The potential applications of CIT can be further expanded, because the resolution and precision of CIT are also gradually improved with the various approaches presented.
The voxel-based CIT has become one of the most important techniques to extract the IED and applied to study the ionospheric phenomenon and the related physical mechanism. With CIT being an ill-posed and ill-conditioned problem, the efforts have never been ceased to propose new algorithms by utilizing more measurements and better mathematical means. With the development of GNSS and other observational instruments, the line integral measurements are continuously increasing which can improve the resolution and precision of CIT. The various data from different systems have different error levels, therefore a coordinate strategy is needed, and an appropriate solution should be selected according to the practical application. This will lead to the development of the voxel-based CIT for regular observation and a more complete understanding of the ionosphere.

Author Contributions

W.L. designed the paper, collected references, drafted and revised the paper; G.M. supervised the whole work and revised the draft; Q.W. supervised the work and contributed to the preliminary draft. All authors have read and agreed to the published version of the manuscript.

Funding

This work is supported by the National Key Research Program of China “Collaborative Precision Positioning Project” (No. 2016YFB0501900) and the National Natural Science Foundation of China (Nos. 11873064, 12073049 and U2031146).

Institutional Review Board Statement

Not applicable.

Informed Consent Statement

Not applicable.

Data Availability Statement:

Not applicable.

Acknowledgments

More than 200 papers on voxel-based GNSS-CIT have been published by various research groups around the world though a limited number of them could be cited in this review. The authors would like to thank the four anonymous reviewers for their insightful comments that significantly enhanced this paper.

Conflicts of Interest

The authors declare no conflict of interest.

Abbreviations

GNSSGlobal Navigation Satellite System
CITComputerized Ionospheric Tomography
IEDIonospheric Electron Density
TECTotal Electron Content
CTComputerized Tomography
ARTAlgebraic Reconstruction Technique
NNSSNavy Navigational Satellite System
LEOLow Earth Orbit
EIAEquatorial Ionospheric Anomaly
MSTIDsMedium-Scale Traveling Ionospheric Disturbances
STECSlant Total Electron Content
PPPPrecise Point Positioning
IPPIonospheric Piercing Point
RMSERoot Mean Square Error
ROIRegion Of Interest
IRIInternational Reference Ionosphere
GPSGlobal Positioning System
EOFsEmpirical Orthogonal Functions
EIAEquatorial Ionization Anomaly
RMSRoot Mean Square
ISRIncoherent Scatter Radar
MARTMultiplicative Algebraic Reconstruction Technique
DMSPDefense Meteorological Satellite Program
CARTConstrained Algebraic Reconstruction Technique
CMARTConstrained Multiplicative Algebraic Reconstruction Technique
SARTSimultaneous Algebraic Reconstruction Technique
SMARTSimultaneous Multiplicative Algebraic Reconstruction Technique
VRSsVirtual Reference Stations
SVDSingular Value Decomposition
GSVDGeneralized Singular Value Decomposition
ANNArtificial Neural Network
MAPMaximum A Posteriori
GAIMGlobal Assimilation of Ionospheric Measurements
LSTIDsLarge-Scale Traveling Ionospheric Disturbances
EPBsEquatorial Plasma Bubbles
RTKReal-Time Kinematic
SBASSatellite-Based Augmentation System

References

  1. Herman, G.T. Image Reconstruction from Projections: The Fundamentals of Computerized Tomography; Academic Press: New York, NY, USA, 1980. [Google Scholar]
  2. Natterer, F. The Mathematics of Computerized Tomography; Vieweg + Teubner Verlag: Wiesbaden, Germany, 1986. [Google Scholar]
  3. Austen, J.R.; Franke, S.J.; Liu, C.H.; Yeh, K.C. Application of computerized tomography techniques to ionospheric research. In Proceedings of the International Beacon Satellite Symposium on Radio Beacon Contribution to the Study of Ionization and Dynamics of the Ionosphere and to Corrections to Geodesy and Technical Workshop, Oulu, Finland, 9–14 June 1986; pp. 25–35, Part 1. [Google Scholar]
  4. Andreeva, E.S.; Galinov, A.V.; Kunitsyn, V.E.; Mel’nichenko, Y.A.; Tereschenko, E.E.; Filimonov, M.A.; Chernyakov, S.M. Radiotomographic reconstruction of ionization dip in the plasma near the earth. JETP Lett. 1990, 52, 145–148. [Google Scholar] [CrossRef]
  5. Fremouw, E.J.; Secan, J.A.; Howe, B.M. Application of stochastic inverse theory to ionospheric tomography. Radio Sci. 1992, 27, 721–732. [Google Scholar] [CrossRef]
  6. Kunitake, M.; Ohtaka, K.; Maruyama, T.; Tokumaru, M.; Morioka, A.; Watanabe, S. Tomographic imaging of the ionosphere over Japan by the modified truncated SVD method. Ann. Geophys. 1995, 13, 1303–1310. [Google Scholar]
  7. Kunitsyn, V.E.; Andreeva, E.S.; Razinkov, O.G. Possibilities of the nears-pace environment radio tomography. Radio Sci. 1997, 32, 1953–1963. [Google Scholar] [CrossRef]
  8. Rius, A.; Ruffini, G.; Cucurull, L. Improving the vertical resolution of ionospheric tomography with GPS occultations. Geophys. Res. Lett. 1997, 24, 2291–2294. [Google Scholar] [CrossRef] [Green Version]
  9. Hernández-Pajares, M.; Juan, J.M.; Sanz, J. Global observation of the ionospheric electronic response to solar events using ground and LEO GPS data. J. Geophys. Res. Space Phys. 1998, 103, 20789–20796. [Google Scholar] [CrossRef] [Green Version]
  10. García-Fernández, M.; Hernández-Pajares, M.; Juan, J.M.; Sanz, J.; Orús, R.; Coisson, P.; Nava, B.; Radicella, S.M. Combining ionosonde with ground GPS data for electron density estimation. J. Atmos. Sol. Terr. Phys. 2003, 65, 683–691. [Google Scholar] [CrossRef]
  11. Ma, X.F.; Maruyama, T.; Ma, G.; Takeda, T. Three-dimensional ionospheric tomography using observation data of GPS ground receivers and ionosonde by neural network. J. Geophys. Res. Space Phys. 2005, 110, A05308. [Google Scholar] [CrossRef]
  12. Bust, G.S.; Mitchell, C.N. History, current state, and future directions of ionospheric imaging. Rev. Geophys. 2008, 46, RG1003. [Google Scholar] [CrossRef]
  13. Wen, D.; Yuan, Y.; Ou, J.; Huo, X.; Zhang, K. Ionospheric temporal and spatial variations during the 18 August 2003 storm over China. Earth Planets Space 2007, 59, 313–317. [Google Scholar] [CrossRef] [Green Version]
  14. Thampi, S.V.; Yamamoto, M.; Lin, C.; Liu, H. Comparison of FORMOSAT-3/COSMIC radio occultation measurements with radio tomography. Radio Sci. 2011, 46, RS3001. [Google Scholar] [CrossRef]
  15. Chen, C.H.; Saito, A.; Lin, C.H.; Yamamoto, M.; Suzuki, S.; Seemala, G.K. Medium-scale traveling ionospheric disturbances by three-dimensional ionospheric GPS tomography. Earth Planets Space 2016, 68, 32. [Google Scholar] [CrossRef] [Green Version]
  16. Nesterov, I.A.; Andreeva, E.S.; Padokhin, A.M.; Tumanova, Y.S.; Nazarenko, M.O. Ionospheric perturbation indices based on the low- and high-orbiting satellite radio tomography data. GPS Solut. 2017, 21, 1679–1694. [Google Scholar] [CrossRef]
  17. Andreeva, E.S.; Tereshchenko, E.D.; Nazarenko, M.O.; Nesterov, I.A.; Padokhin, A.M.; Tumanova, Y.S. Exploring the ionospheric structures by radio tomographic methods under different space weather conditions. In Proceedings of the 2017 Progress in Electromagnetics Research Symposium-Spring (PIERS), St. Petersburg, Russia, 22–25 May 2017; pp. 1298–1304. [Google Scholar] [CrossRef]
  18. Yao, Y.; Tang, J.; Chen, P.; Zhang, S.; Chen, J. An improved iterative algorithm for 3-D ionospheric tomography reconstruction. IEEE Trans. Geosci. Remote Sens. 2014, 52, 4696–4706. [Google Scholar] [CrossRef]
  19. Jin, R.; Jin, S.; Feng, G. M_DCB: Matlab code for estimating GNSS satellite and receiver differential code biases. GPS Solut. 2012, 16, 541–548. [Google Scholar] [CrossRef]
  20. Zhang, B.; Teunissen, P.J.G.; Yuan, Y.; Zhang, H.; Li, M. Joint estimation of vertical total electron content (VTEC) and satellite differential code biases (SDCBs) using low-cost receivers. J. Geod. 2018, 92, 401–413. [Google Scholar] [CrossRef] [Green Version]
  21. Hernández-Pajares, M.; Juan, J.M.; Sanz, J.; Colombo, O.L. Application of ionospheric tomography to real-time GPS carrier-phase ambiguities resolution, at scales of 400–1000 km and with high geomagnetic activity. Geophys. Res. Lett. 2000, 27, 2009–2012. [Google Scholar] [CrossRef] [Green Version]
  22. Ma, G.; Maruyama, T. Derivation of TEC and estimation of instrumental biases from GEONET in Japan. Ann. Geophys. 2003, 21, 2083–2093. [Google Scholar] [CrossRef] [Green Version]
  23. Liu, J.; Chen, R.; Wang, Z.; Zhang, H. Spherical cap harmonic model for mapping and predicting regional TEC. GPS Solut. 2011, 15, 109–119. [Google Scholar] [CrossRef]
  24. Psychas, D.; Verhagen, S.; Liu, X.; Memarzadeh, Y.; Visser, H. Assessment of ionospheric corrections for PPP-RTK using regional ionosphere modelling. Meas. Sci. Technol. 2018, 30, 014001. [Google Scholar] [CrossRef] [Green Version]
  25. Juan, J.M.; Rius, A.; Hernández-Pajares, M.; Sanz, J. A two-layer model of the ionosphere using Global Positioning System data. Geophys. Res. Lett. 1997, 24, 393–396. [Google Scholar] [CrossRef] [Green Version]
  26. Sutton, E.; Na, H. Comparison of geometries for ionospheric tomography. Radio Sci. 1995, 30, 115–125. [Google Scholar] [CrossRef]
  27. Semeter, J.; Kamalabadi, F. A natural pixel decomposition for tomographic imaging of the ionosphere. In Proceedings of the 1998 IEEE International Conference on Acoustics, Speech and Signal Processing, Seattle, WA, USA, 15 May 1998; Volume 5, pp. 2913–2916. [Google Scholar] [CrossRef]
  28. Supriadi, S.; Darmawan, D.; Septiawan, R. Checkerboard test implementation into ionospheric tomography for SuGAr data. J. Phys. Conf. Ser. 2018, 1130, 012037. [Google Scholar] [CrossRef]
  29. Das, S.K.; Shukla, A.K. Two-dimensional ionospheric tomography over the low-latitude Indian region: An intercomparison of ART and MART algorithms. Radio Sci. 2011, 46, RS2005. [Google Scholar] [CrossRef]
  30. Zheng, D.; Hu, W.; Nie, W. Multiscale ionospheric tomography. GPS Solut. 2015, 19, 579–588. [Google Scholar] [CrossRef]
  31. Zheng, D.; Zheng, H.; Wang, Y.; Nie, W.; Li, C.; Ao, M.; Hu, W.; Zhou, W. Variable pixel size ionospheric tomography. Adv. Space Res. 2017, 59, 2969–2986. [Google Scholar] [CrossRef]
  32. Saito, S.; Suzuki, S.; Yamamoto, M.; Saito, A.; Chen, C.H. Real-Time ionosphere monitoring by three-dimensional tomography over Japan. Navigation 2017, 64, 495–504. [Google Scholar] [CrossRef] [Green Version]
  33. Chen, B.; Wu, L.; Dai, W.; Luo, X.; Xu, Y. A new parameterized approach for ionospheric tomography. GPS Solut. 2019, 23, 96. [Google Scholar] [CrossRef] [Green Version]
  34. Watermann, J.; Bust, G.S.; Thayer, J.P.; Neubert, T.; Coker, C. Mapping plasma structures in the high-latitude ionosphere using beacon satellite, incoherent scatter radar and ground-based magnetometer observations. Ann. Geophys. 2002, 45, 177–189. [Google Scholar] [CrossRef]
  35. Mitchell, C.N.; Spencer, P.S.J. A three-dimensional time-dependent algorithm for ionospheric imaging using GPS. Ann. Geophys. 2003, 46, 687–696. [Google Scholar] [CrossRef]
  36. Giday, N.M.; Katamzi, Z.T.; Mckinnell, L.A. Ionospheric tomography over South Africa: Comparison of MIDAS and ionosondes measurements. Adv. Space Res. 2016, 57, 245–256. [Google Scholar] [CrossRef]
  37. Wen, D.; Liu, S.; Tang, P. Tomographic reconstruction of ionospheric electron density based on constrained algebraic reconstruction technique. GPS Solut. 2010, 14, 375–380. [Google Scholar] [CrossRef]
  38. Fehmers, G.C.; Kamp, L.P.J.; Sluijter, F.W.; Spoelstra, T.A.T. A model-independent algorithm for ionospheric tomography: 1. Theory and tests. Radio Sci. 1998, 33, 149–163. [Google Scholar] [CrossRef]
  39. Bruno, J.; Mitchell, C.N.; Bolmgren, K.H.A.; Witvliet, B.A. A realistic simulation framework to evaluate ionospheric tomography. Adv. Space Res. 2020, 65, 891–901. [Google Scholar] [CrossRef]
  40. Na, H.; Lee, H. Resolution analysis of tomographic reconstruction of electron density profiles in the ionosphere. Int. J. Imaging Syst. Technol. 1990, 2, 209–218. [Google Scholar] [CrossRef]
  41. Panicciari, T.; Smith, N.D.; Mitchell, C.N.; Da Dalt, F.; Spencer, P.S.J. Using sparse regularization for multi-resolution tomography of the ionosphere. Nonlinear Process. Geophys. 2015, 22, 613–624. [Google Scholar] [CrossRef] [Green Version]
  42. Wang, S.; Huang, S.; Fang, H. Dual-parameter regularization method in three-dimensional ionospheric reconstruction. Ann. Geophys. 2018, 36, 1255–1266. [Google Scholar] [CrossRef]
  43. Yao, Y.; Tang, J.; Kong, J.; Zhang, L.; Zhang, S. Application of hybrid regularization method for tomographic reconstruction of midlatitude ionospheric electron density. Adv. Space Res. 2013, 52, 2215–2225. [Google Scholar] [CrossRef]
  44. Lee, J.K.; Kamalabadi, F.; Makela, J.J. Three-dimensional tomography of ionospheric variability using a dense GPS receiver array. Radio Sci. 2008, 43, RS3001. [Google Scholar] [CrossRef]
  45. Panicciari, T.; Smith, N.D.; Da Dalt, F.; Mitchell, C.N. Robust ionospheric tomography using sparse regularization. In Proceedings of the 2014 XXXIth General Assembly and Scientific Symposium (URSI GASS), Beijing, China, 16–23 August 2014; 2014; pp. 1–4. [Google Scholar] [CrossRef]
  46. Ou, M.; Zhang, H.B.; Zhen, W.M. GPS-based ionospheric tomography with constrained IRI as a regularization. In Proceedings of the 10th International Symposium on Antennas, Propagation and EM Theory, Xi’an, China, 22–26 October 2012; pp. 656–659. [Google Scholar] [CrossRef]
  47. Ganguly, S.; Brown, A. Real-time characterization of the ionosphere using diverse data and models. Radio Sci. 2001, 36, 1181–1197. [Google Scholar] [CrossRef]
  48. Chen, B.; Dai, W.; Cai, C.; Kuang, C. An improved method of ionospheric tomography. Lect. Notes Electr. Eng. 2012, 159, 3–9. [Google Scholar] [CrossRef]
  49. Yao, Y.; Kong, J.; Tang, J. A new ionosphere tomography algorithm with two-grid virtual observations constraints and three-dimensional velocity profile. IEEE Trans. Geosci. Remote Sens. 2015, 53, 2373–2383. [Google Scholar] [CrossRef]
  50. Yao, Y.; Zhai, C.; Kong, J.; Zhao, Q.; Zhao, C. A modified three-dimensional ionospheric tomography algorithm with side rays. GPS Solut. 2018, 22, 107. [Google Scholar] [CrossRef]
  51. Schunk, R.W.; Scherliess, L.; Sojka, J.J.; Thompson, D.C.; Anderson, D.N.; Codrescu, M.; Minter, C.; Fuller-Rowell, T.J.; Heelis, R.A.; Hairston, M.; et al. Global assimilation of ionospheric measurements (GAIM). Radio Sci. 2004, 39, RS1S02. [Google Scholar] [CrossRef]
  52. Angling, M.J.; Cannon, P.S. Assimilation of radio occultation measurements into background ionospheric models. Radio Sci. 2004, 39, RS1S08. [Google Scholar] [CrossRef]
  53. Chiang, K.Q.Z.; Psiaki, M.L. GPS and ionosonde data fusion for ionospheric tomography. In Proceedings of the 27th International Technical Meeting of the Satellite Division of the Institute of Navigation (ION GNSS+ 2014), Tampa, FL, USA, 8–12 September 2014; pp. 1163–1172. [Google Scholar]
  54. Chartier, A.T.; Smith, N.D.; Mitchell, C.N.; Jackson, D.R.; Patilongo, P.J.C. The use of ionosondes in GPS ionospheric tomography at low latitudes. J. Geophys. Res. Space Phys. 2012, 117, A10326. [Google Scholar] [CrossRef] [Green Version]
  55. Ssessanga, N.; Yamamoto, M.; Saito, S.; Saito, A.; Nishioka, M. Complementing regional ground GNSS-STEC computerized ionospheric tomography (CIT) with ionosonde data assimilation. GPS Solut. 2021, 25, 93. [Google Scholar] [CrossRef]
  56. Bust, G.S.; Coco, D.S.; Gaussiran, T.L. Computerized ionospheric tomography analysis of the combined ionospheric campaign. Radio Sci. 2001, 36, 1599–1605. [Google Scholar] [CrossRef]
  57. Austen, J.R.; Franke, S.J.; Liu, C.H. Ionospheric imaging using computerized tomography. Radio Sci. 1988, 23, 299–307. [Google Scholar] [CrossRef]
  58. Raymund, T.D.; Austen, J.R.; Franke, S.J.; Liu, C.H.; Klobuchar, J.A.; Stalker, J. Application of computerized tomography to the investigation of ionospheric structures. Radio Sci. 1990, 25, 771–789. [Google Scholar] [CrossRef]
  59. Prol, F.S.; Camargo, P.O. Ionospheric tomography using GNSS: Multiplicative algebraic reconstruction technique applied to the area of brazil. GPS Solut. 2016, 20, 807–814. [Google Scholar] [CrossRef] [Green Version]
  60. Yang, Z.; Song, S.; Jiao, W.; Chen, G.; Xue, J.; Zhou, W.; Zhu, W. Ionospheric tomography based on GNSS observations of the CMONOC: Performance in the topside ionosphere. GPS Solut. 2017, 21, 363–375. [Google Scholar] [CrossRef]
  61. Jin, S.; Li, D. 3-D ionospheric tomography from dense GNSS observations based on an improved two-step iterative algorithm. Adv. Space Res. 2018, 62, 809–820. [Google Scholar] [CrossRef]
  62. Li, D.; Jin, S.; Zheng, G.; Calabia, A. Evaluation of 3-D ionospheric tomography from denser GNSS observations in Japan. In Proceedings of the 2016 Progress in Electromagnetic Research Symposium (PIERS), Shanghai, China, 8–11 August 2016; pp. 4986–4990. [Google Scholar] [CrossRef]
  63. Wen, D.; Wang, Y.; Norman, R. A new two-step algorithm for ionospheric tomography solution. GPS Solut. 2012, 16, 89–94. [Google Scholar] [CrossRef]
  64. Prol, F.S.; Camargo, P.O.; Hernández-Pajares, M.; Muella, M.T.A.H. A new method for ionospheric tomography and its assessment by ionosonde electron density, GPS TEC, and single-frequency PPP. IEEE Trans. Geosci. Remote Sens. 2018, 57, 2571–2582. [Google Scholar] [CrossRef]
  65. Ou, M.; Zhang, H.B.; Yu, X.; She, C.L.; Liu, D.; Zhen, W.M. An algorithm combined with EOFs analysis and MART for GPS-based ionospheric tomography. In Proceedings of the 9th International Symposium on Antennas, Propagation and EM Theory, Guangzhou, China, 29 November–2 December 2010; pp. 1230–1233. [Google Scholar] [CrossRef]
  66. Zheng, D.; Yao, Y.; Nie, W.; Yang, W.; Hu, W.; Ao, M.; Zheng, H. An improved iterative algorithm for ionospheric tomography reconstruction by using the automatic search technology of relaxation factor. Radio Sci. 2018, 53, 1051–1066. [Google Scholar] [CrossRef]
  67. Wen, D.; Zhang, X.; Tong, Y.; Zhang, G.; Zhang, M.; Leng, R. GPS-based ionospheric tomography with a constrained adaptive simultaneous algebraic reconstruction technique. J. Earth Syst. Sci. 2015, 124, 283–289. [Google Scholar] [CrossRef]
  68. Nandi, S.; Bandyopadhyay, B. Study of low-latitude ionosphere over Indian region using simultaneous algebraic reconstruction technique. Adv. Space Res. 2015, 55, 545–553. [Google Scholar] [CrossRef]
  69. Liu, S.; Wang, J.; Gao, J. Inversion of ionospheric electron density based on a constrained simultaneous iteration reconstruction technique. IEEE Trans. Geosci. Remote Sens. 2010, 48, 2455–2459. [Google Scholar] [CrossRef]
  70. Gerzen, T.; Minkwitz, D. Simultaneous multiplicative column-normalized method (SMART) for 3-D ionosphere tomography in comparison to other algebraic methods. Ann. Geophys. 2016, 34, 97–115. [Google Scholar] [CrossRef] [Green Version]
  71. Yao, Y.; Chen, P.; Zhang, S.; Chen, J. A new ionospheric tomography model combining pixel-based and function-based models. Adv. Space Res. 2013, 52, 614–621. [Google Scholar] [CrossRef]
  72. Lu, W.; Ma, G.; Wan, Q.; Li, J.; Wang, X.; Fu, W.; Maruyama, T. Virtual reference station-based computerized ionospheric tomography. GPS Solut. 2021, 25, 8. [Google Scholar] [CrossRef]
  73. Fan, J.; Ma, G. Characteristics of GPS positioning error with non-uniform pseudorange error. GPS Solut. 2014, 18, 615–623. [Google Scholar] [CrossRef] [Green Version]
  74. Bhuyan, K.; Singh, S.B.; Bhuyan, P.K. Application of generalized singular value decomposition to ionospheric tomography. Ann. Geophys. 2004, 22, 3437–3444. [Google Scholar] [CrossRef] [Green Version]
  75. Wen, D.; Yuan, Y.; Ou, J.; Zhang, K.; Liu, K. A hybrid reconstruction algorithm for 3-D ionospheric tomography. IEEE Trans. Geosci. Remote Sens. 2008, 46, 1733–1739. [Google Scholar] [CrossRef] [Green Version]
  76. Erturk, O.; Arikan, O.; Arikan, F. Tomographic reconstruction of the ionospheric electron density as a function of space and time. Adv. Space Res. 2009, 43, 1702–1710. [Google Scholar] [CrossRef]
  77. Howe, B.M.; Runciman, K.; Secan, J.A. Tomography of the ionosphere: Four-dimensional simulations. Radio Sci. 1998, 33, 109–128. [Google Scholar] [CrossRef]
  78. Scherliess, L.; Schunk, R.W.; Sojka, J.J.; Thompson, D.C. Development of a physics-based reduced state Kalman filter for the ionosphere. Radio Sci. 2004, 39, RS1S04. [Google Scholar] [CrossRef]
  79. Tuna, H.; Arikan, O.; Arikan, F. Model based computerized ionospheric tomography in space and time. Adv. Space Res. 2018, 61, 2057–2073. [Google Scholar] [CrossRef]
  80. Granat, R.A.; Na, H. Estimating dynamic ionospheric changes without a priori models. Radio Sci. 2000, 35, 341–349. [Google Scholar] [CrossRef]
  81. Ghaffari Razin, M.; Voosoghi, B. Ionosphere tomography using wavelet neural network and particle swarm optimization training algorithm in Iranian case study. GPS Solut. 2017, 21, 1301–1314. [Google Scholar] [CrossRef]
  82. Khorsheed, E.; Hurn, M.; Jennison, C. Mapping electron density in the ionosphere: A principal component MCMC algorithm. Comput. Stat. Data Anal. 2011, 55, 338–352. [Google Scholar] [CrossRef] [Green Version]
  83. Norberg, J.; Roininen, L.; Vierinen, J.; Amm, O.; Lehtinen, M. Ionospheric tomography in Bayesian framework with Gaussian Markov random field priors. Radio Sci. 2015, 50, 138–152. [Google Scholar] [CrossRef] [Green Version]
  84. Norberg, J.; Vierinen, J.; Roininen, L.; Orispää, M.; Kauristie, K.; Rideout, W.C.; Coster, A.J.; Lehtinen, M.S. Gaussian Markov random field priors in ionospheric 3-D multi-instrument tomography. IEEE Trans. Geosci. Remote Sens. 2018, 56, 7009–7021. [Google Scholar] [CrossRef] [Green Version]
  85. Gardner, L.C.; Schunk, R.W.; Scherliess, L.; Sojka, J.J.; Zhu, L. Global assimilation of ionospheric measurements-Gauss Markov model: Improved specifications with multiple data types. Space Weather 2014, 12, 675–688. [Google Scholar] [CrossRef]
  86. Aa, E.; Liu, S.; Huang, W.; Shi, L.; Gong, J.; Chen, Y.; Shen, H.; Li, J. Regional 3-D ionospheric electron density specification on the basis of data assimilation of ground-based GNSS and radio occultation data. Space Weather 2016, 14, 433–448. [Google Scholar] [CrossRef] [Green Version]
  87. Ssessanga, N.; Kim, Y.H.; Kim, E. Vertical structure of medium-scale traveling ionospheric disturbances. Geophys. Res. Lett. 2015, 42, 9156–9165. [Google Scholar] [CrossRef]
  88. Bust, G.S.; Garner, T.W.; Gaussiran, T.L. Ionospheric data assimilation three-dimensional (IDA3D): A global, multisensor, electron density specification algorithm. J. Geophys. Res. Space Phys. 2004, 109, A11312. [Google Scholar] [CrossRef] [Green Version]
  89. Song, R.; Hattori, K.; Zhang, X.; Liu, J.-Y.; Yoshino, C. Detecting the ionospheric disturbances in Japan using the three-dimensional computerized tomography. J. Geophys. Res. Space Phys. 2021, 126, e2020JA028561. [Google Scholar] [CrossRef]
  90. Prol, F.S.; Hernández-Pajares, M.; Muella, M.T.A.H.; Camargo, P.O. Tomographic imaging of ionospheric plasma bubbles based on GNSS and radio occultation measurements. Remote Sens. 2018, 10, 1529. [Google Scholar] [CrossRef] [Green Version]
  91. Meggs, R.W.; Mitchell, C.N. A study into the errors in vertical total electron content mapping using GPS data. Radio Sci. 2006, 41, RS1008. [Google Scholar] [CrossRef]
  92. Blanch, J.; Walter, T.; Enge, P. A new ionospheric estimation algorithm for SBAS combining Kriging and tomography. In Proceedings of the 2004 National Technical Meeting of The Institute of Navigation, San Diego, CA, USA, 26–28 January 2004; pp. 524–529. [Google Scholar]
  93. Olivares-Pulido, G.; Terkildsen, M.; Arsov, K.; Teunissen, P.J.G.; Khodabandeh, A.; Janssen, V. A 4D tomographic ionospheric model to support PPP-RTK. J. Geod. 2019, 93, 1673–1683. [Google Scholar] [CrossRef] [Green Version]
  94. Seemala, G.K.; Yamamoto, M.; Saito, A.; Chen, C.H. Three-dimensional GPS ionospheric tomography over japan using constrained least squares. J. Geophys. Res. Space Phys. 2014, 119, 3044–3052. [Google Scholar] [CrossRef] [Green Version]
  95. Muafiry, I.N.; Heki, K.; Maeda, J. 3D tomography of midlatitude sporadic-E in Japan from GNSS-TEC data. Earth Planets Space 2018, 70, 45. [Google Scholar] [CrossRef] [Green Version]
  96. He, L.M.; Yang, Y.; Su, C.; Yu, J.Q.; Yang, F.; Wu, L.X. Grid-based representation and dynamic visualization of ionospheric tomography. In Proceedings of the International Archives of the Photogrammetry, Remote Sensing and Spatial Information Sciences, Xuzhou, China, 11–12 November 2013; 2013; Volume XL-4/W2, pp. 71–76. [Google Scholar] [CrossRef] [Green Version]
  97. Gerzen, T.; Minkwitz, D.; Schmidt, M.; Erdogan, E. Analysis of different propagation models for the estimation of the topside ionosphere and plasmasphere with an ensemble Kalman filter. Ann. Geophys. 2020, 38, 1171–1189. [Google Scholar] [CrossRef]
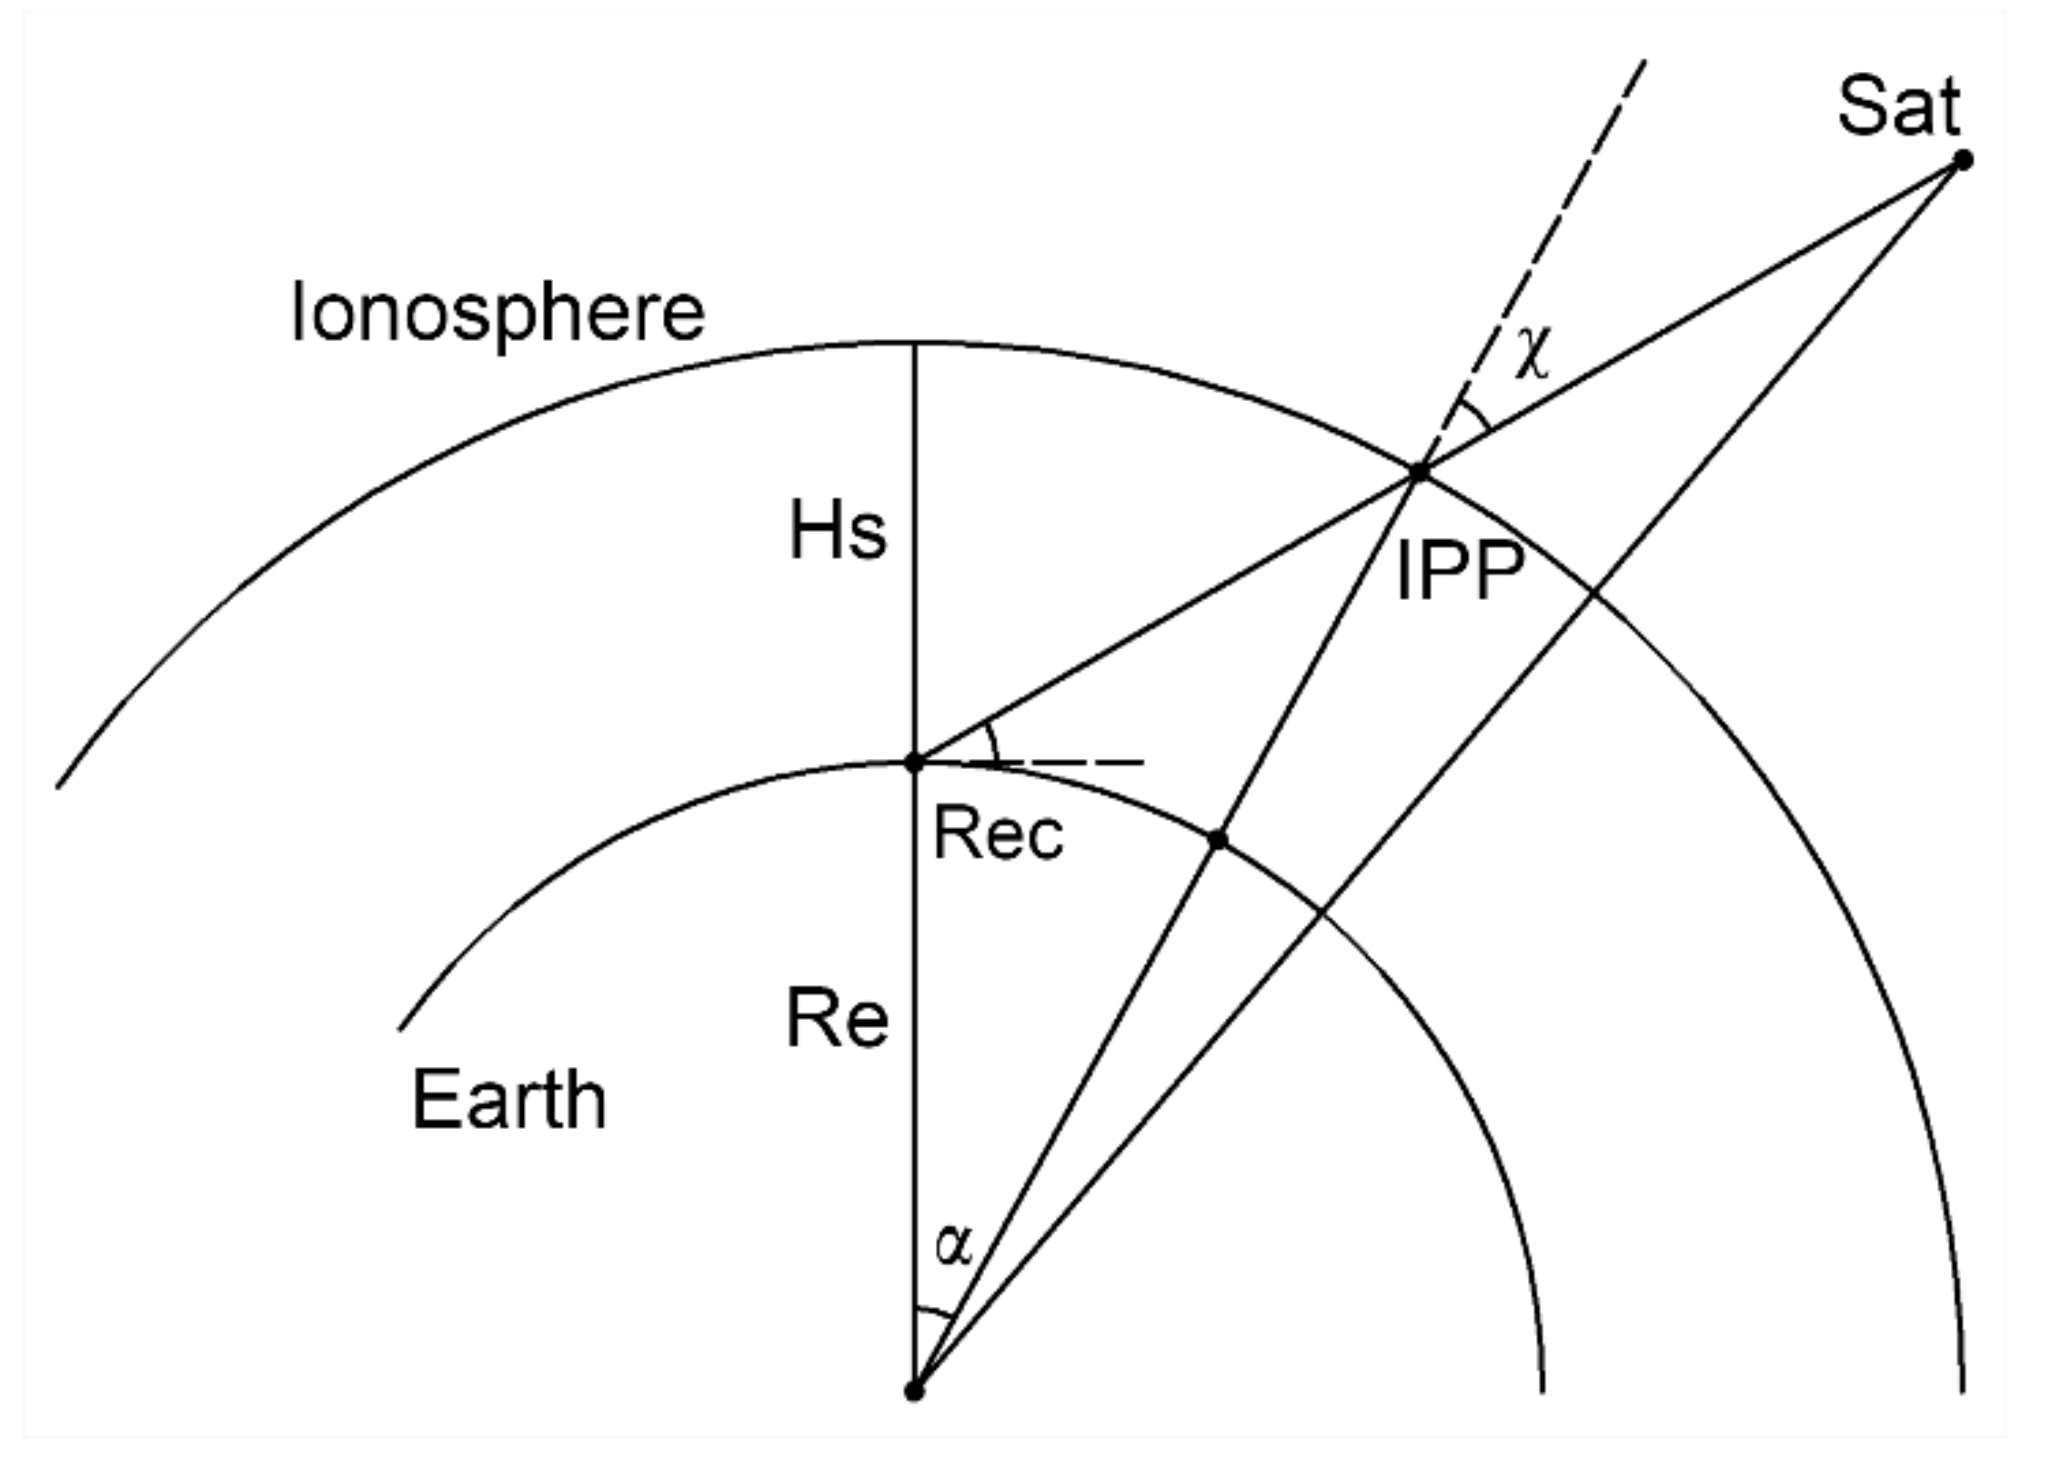
Figure 1. Diagram of ionospheric single layer model. All the ionospheric electrons are assumed to concentrate on an infinite thin single layer. The intersection of the ionospheric single layer and the sightline between the receiver and the satellite is defined as ionospheric piercing point (IPP). Hs stands for the height of the ionospheric single layer.
Remotesensing 13 03432 g001
Figure 2. Diagram of the three-dimensional ionosphere. The ionosphere is divided into discretized three-dimensional voxels. The voxels are traversed by plenty of satellite-receiver rays and the ionospheric electron density (IED) of the illuminated voxels can be reconstructed.
Remotesensing 13 03432 g002
Figure 3. Diagram of the voxel geometries in computerized ionospheric tomography (CIT) (adapted from [26]). Geometries 1–3 correspond to a rectangle containing the annular region, a rectangle within the annular region, and an annular region, respectively.
Remotesensing 13 03432 g003
Figure 4. Diagram of the natural voxel decomposition (adapted from [27]). The light gray area is the natural voxel, and the dark gray area is their intersection part.
Remotesensing 13 03432 g004
Figure 5. The diagram of a residual minimization training neural network for CIT (adapted from [11]). The input nodes are the intercepts in voxels calculated by the coordinates of the satellites and receivers. The output nodes are the IED utilized to obtain the estimated observations, which are updated with the weights. The weights and the instrumental biases are adjusted by the objective function.
Remotesensing 13 03432 g005
Figure 6. Ionospheric tomography results at 05:30 UT (14:30 JST) on 17 March 2016 (from [32]). (a) Latitude-altitude image at 136°E longitude plane, (b) longitude-altitude image at 35°N latitude plane, (c) horizontal distribution at an altitude of 350 km, and (d) vertical profile at a location 35°N, 136° E.
Remotesensing 13 03432 g006
Figure 7. IED sections along the longitude of 111.28 E for periods of UT 7–8 on 5 June 2015 (ac) and UT 5–6 on 23 June 2015 (df) (from [33]). (a,d) IED images derived from IRI 2016 model, (b,e) tomography with uniform IED in the voxel, and (c,f) tomography with parameterized IED in the voxel. The vertical resolution is 25 km and the horizontal resolution is 2° × 2°.
Remotesensing 13 03432 g007
Figure 8. Reconstructed vertical IED profiles in Europe (EISCAT model) and North America (Millstone Hill model) obtained using 1 or 2 empirical orthogonal functions (EOFs), compared with the true vertical IED profiles (from [39]). Tromso and Boston are far from the ionosondes, while Chilton and Boulder are located at the ionosondes.
Remotesensing 13 03432 g008
Figure 9. (a) Jicamarca incoherent scatter observations, which should be considered the ground truth in this experiment, (b) Jicamarca ionosonde observations, (c) a reconstructed image that includes the ionosonde observations, and (d) a reconstructed image that does not have the ionosonde observations (from [54]). The black line in the images shows the ionosonde peak height.
Remotesensing 13 03432 g009
Figure 10. Latitude-altitude images of IED reconstructed by CIT (from [72]). (a) Reconstructed image with only observation stations, (b) reconstructed image with VRSs added, (c) initial estimates from IRI 2016, and (d) the difference between (a,b). The unit of IED is e/m3.
Remotesensing 13 03432 g010
Figure 11. IED output at 800 km altitude, with the IED from radio occultation and defense meteorological satellite program (DMSP) overlaid for comparison (from [85]). The DMSP data are in the southern hemisphere near 220° longitude, and the radio occultation density values are at 90° longitude and 40° latitude, and 180° longitude between 10° and −10° latitude.
Remotesensing 13 03432 g011
Figure 12. Two-dimensional images of IED at 21 LT on magnetic quiet days (a,c) and on the magnetic storm day (b) (from [13]). (a) 17 August 2003, (b) 18 August 2003, and (c) 19 August 2003. The unit of electron density is 1011 e/m3.
Remotesensing 13 03432 g012
Figure 13. Comparison between longitude-altitude images of IED and horizontal total electron content (TEC) perturbation images (from [87]). The white dashed, black, and blue dashed lines indicate the variation of the peak height obtained from IRI, reconstruction IED, and TEC perturbations, respectively. The black arrows indicate the good correlation existing between the enhancements observed in the tomographic images and the TEC perturbation images.
Remotesensing 13 03432 g013
Figure 14. Tomographic images of an ionospheric trough from 0800 to 0900 UT along a geomagnetic longitude of 31°E (from [88]).
Remotesensing 13 03432 g014
Table 1. The Kalman filtering equations.
EquationComments
(K1) m f = L m + b Model state forecast
(K2) P f = L P L T + Q Model state forecast error
(K3) d = G m + n Measurement equation
(K4) K = P f G T G P f G T + E 1 Kalman gain
(K5) m a = m f + K d G m f Model state analysis
(K6) P a = I R P f Model state analysis error
The variables are: m , model state vector; L , state transition matrix; b , transition model error; P , model error covariance matrix; Q = b b T , transition model error covariance; d , data vector; G , measurement matrix; n , observation error; E = n n T , observation error covariance; and R = K G , model resolution matrix. The superscripts f and a represent the forecast and analysis terms, respectively.
Publisher’s Note: MDPI stays neutral with regard to jurisdictional claims in published maps and institutional affiliations.