1. Introduction
Arctic studies are increasingly relevant in the scope of climate change as the region’s seasonal variables provide important information on the global climate system [
1]. Despite their importance, the vast landscapes are sparsely populated and difficult to reach; hence, large-scale comparative studies of landscape elements are limited. Mapping of the biophysical cover of Arctic surfaces is fundamental for monitoring purposes and form an important basis for studies of various ecosystem processes and states such as greenhouse gas exchange [
2,
3,
4], surface energy balance [
5,
6], and permafrost [
7,
8]. These interactions are often measured on a local scale, but to interpret their influence in a regional context, it is essential to identify the physical extent of the land cover. This is where improved technology of satellite images provides an easily accessible tool to map the Arctic land cover from above.
Working with land-cover classification based on large amounts of data with high dimensionality increases the need for processing power [
9,
10,
11]. To assist the remote sensing community with the necessary processing power, the use of cloud computing platforms such as Google Earth Engine (GEE) is an extremely valuable tool. GEE is a cloud-based platform consisting of a large data catalog from different satellite sources and spatial analysis tools. It is operated through a web-based application programming interface (API) [
12]. With no need for manual download of satellite images or a powerful desktop at the user end, this platform provides the user with the necessary tools for processing large amounts of data relatively quickly. The rapid response to changes in the analysis gives the user the ability to evaluate the output more easily. This geospatial analysis platform is free to use, and it is considered to be state-of-the-art for remote sensing analysis [
9,
10,
12,
13,
14].
Maps of vegetation characteristics exist for Greenland as part of circumpolar arctic vegetation classification efforts [
15,
16,
17] based on a blend of information, including also satellite imagery and the Circumpolar Arctic Vegetation Map (CAVM) [
16], and is provided in a 1 km spatial resolution. Karami et al. [
18] produced a spatially more detailed vegetation land-cover map for all of the ice-free parts of Greenland, utilizing data from the Landsat 8 OLI satellite, representing current state-of-the-art in land-cover mapping of Greenland. Their rationale behind surface classes for their land-cover classification was similar to previous upscaling applications in Greenland, and the map should, therefore, be suitable for such use [
18]. Their work relied on time-series analysis of 2015 Landsat data, producing per-pixel vegetation phenology metrics, Normalized Difference Moisture Index (NDMI), and topography features combined with a Random Forest (RF) classifier. With more than 4000 Landsat 8 images, this work was a very time-consuming process [
18]. Their complete regional land-cover map of the ecosystems in Greenland in a 30 m resolution is to the author’s knowledge the only of its sort in such a high resolution.
With the rapid technological development and an increase in available data sources, the remote sensing community is provided with an increasing number of opportunities to further improve their research. On this basis, this article aims to optimize the work of Karami et al. [
18] by utilizing imagery from newer satellites in combination with cloud computing.
While Sentinel-2 and Landsat 8 are relatively similar regarding spectral resolution, there is one region of the electromagnetic spectrum that is further collected by the Sentinel-2 satellites; the red-edge. This spectral region is located between the red and the NIR wavelengths and vegetation is spectrally characterized by a sharp increase in this spectral region [
19]. The use of information gained from the red-edge has shown to be important for vegetation discrimination due to its sensitivity to e.g., the vegetation’s structural characteristics [
20].
The study of vegetation phenology based on remote-sensed optical imagery commonly relies on vegetation indices (VI). One of the most used VI is the Normalized Difference Vegetation Index (NDVI), which relies on the relative difference between the red and near-infrared (NIR) wavelengths. This index has been shown to correlate with several vegetation characteristics such as biomass, leaf area index, and carbon fluxes [
21,
22]. Time-series of NDVI values are commonly used to describe the vegetation phenology, thereby extracting metrics related to the growing season [
23]. While it might be possible to partly distinguish types of vegetation solely on phenology timing and peak NDVI, studies have shown that including topography information and other spectral indices, such as the NDMI, increases classification accuracy [
18,
24]. With the timing of green-up and senescence derived from the phenology analysis, it is possible to examine the vegetation’s spectral signature within its growing season.
Classification based solely on optical images has caused problems when different land covers have had similar spectral signatures. One problem of such observation is the spectral similarity of water and shadows [
25,
26]. The solar reflectance of these areas is close to zero, which makes them difficult to distinguish from each other. To overcome this problem some studies have proposed water indices that increase the small spectral differences [
27,
28], while others have strived to incorporate information about the topography in combination with the illumination conditions at the time of observation [
25,
26]. While there is no comprehensive solution to this challenge, the methodological approach should depend on the conditions in the area of interest.
This study seeks to produce high-resolution land-cover maps for selected parts of Greenland using multi-temporal images from the Sentinel-2 satellites. The study provides the basis for further improving the classification scheme presented by Karami et al. [
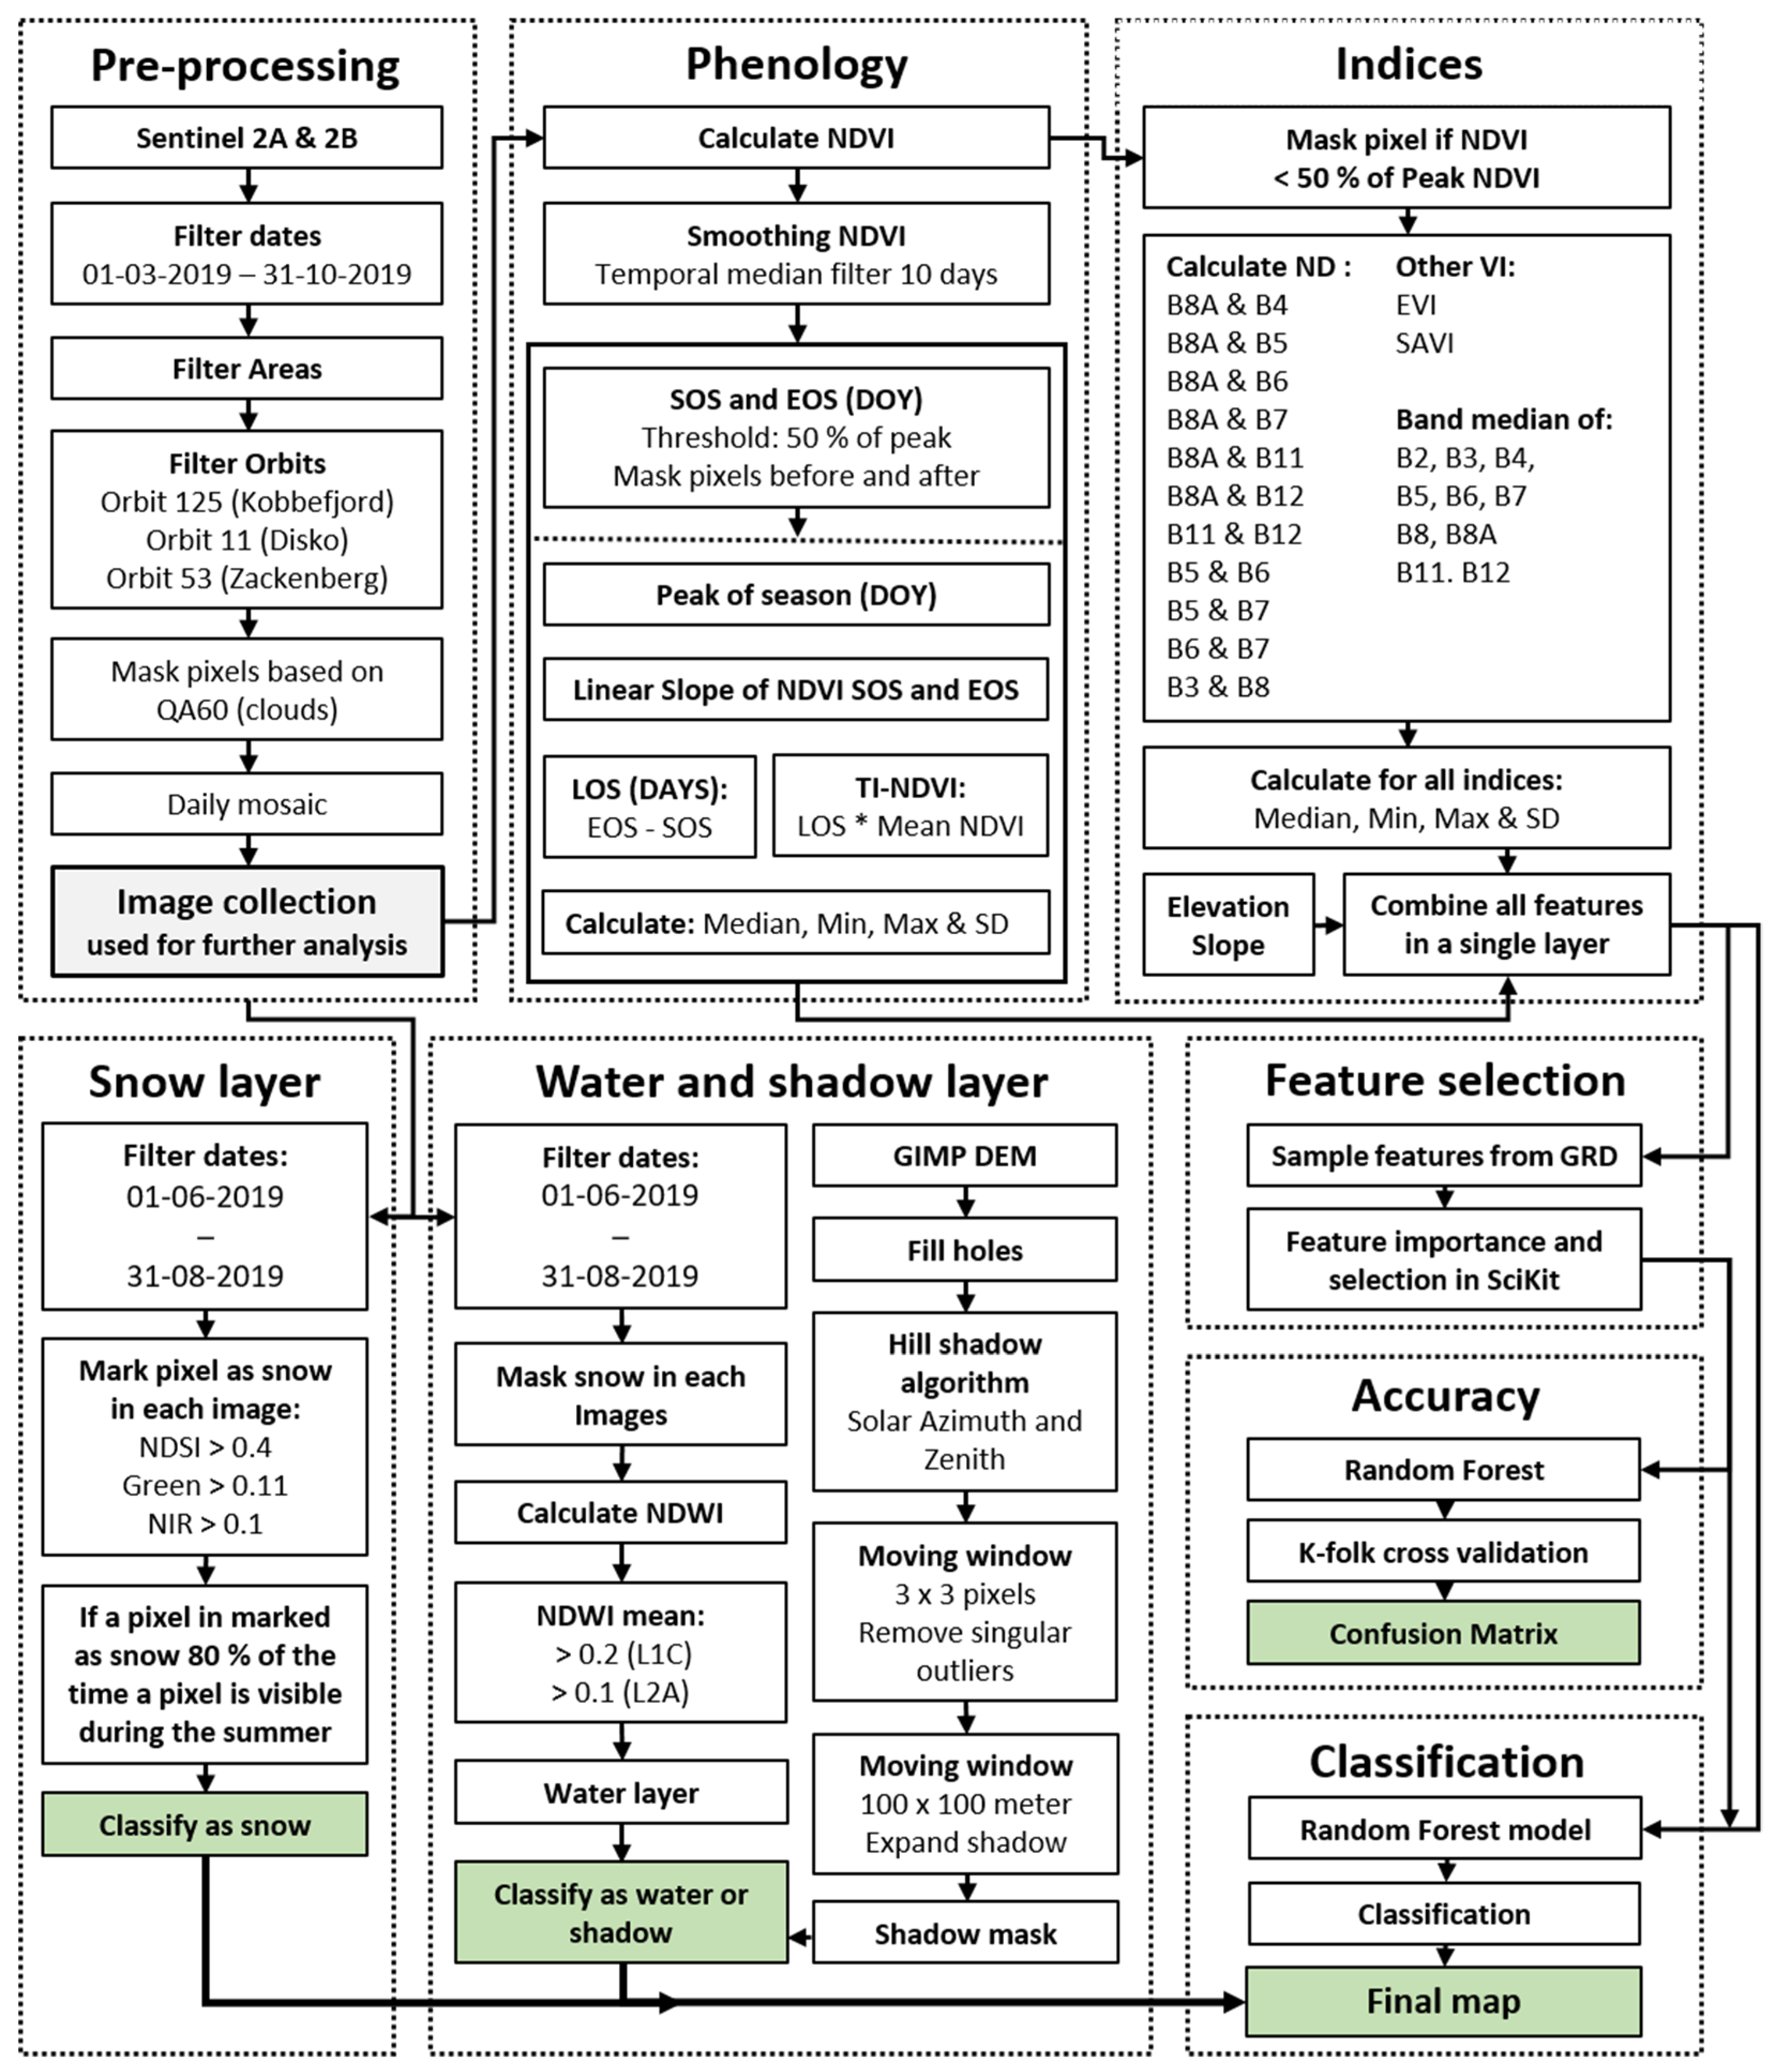
18]. The new classification is based on phenological metrics from NDVI time-series, wetness estimation based on NDMI; indices including information obtained from the red-edge bands, topographical features, and in situ observations are included to train the Random Forest classifier [
29]. The extracted features are analyzed for their importance related to the classifier and their ability to separate vegetation land-cover classes. A water detection workflow, based on water indices in combination with a hill shadow algorithm, is built to automatically map water-covered areas. This whole framework for land cover classification is coded in GEE.
This study, thereby, aims to provide a methodology to produce high-resolution land-cover maps that could be utilized for further Arctic research.
5. Conclusions
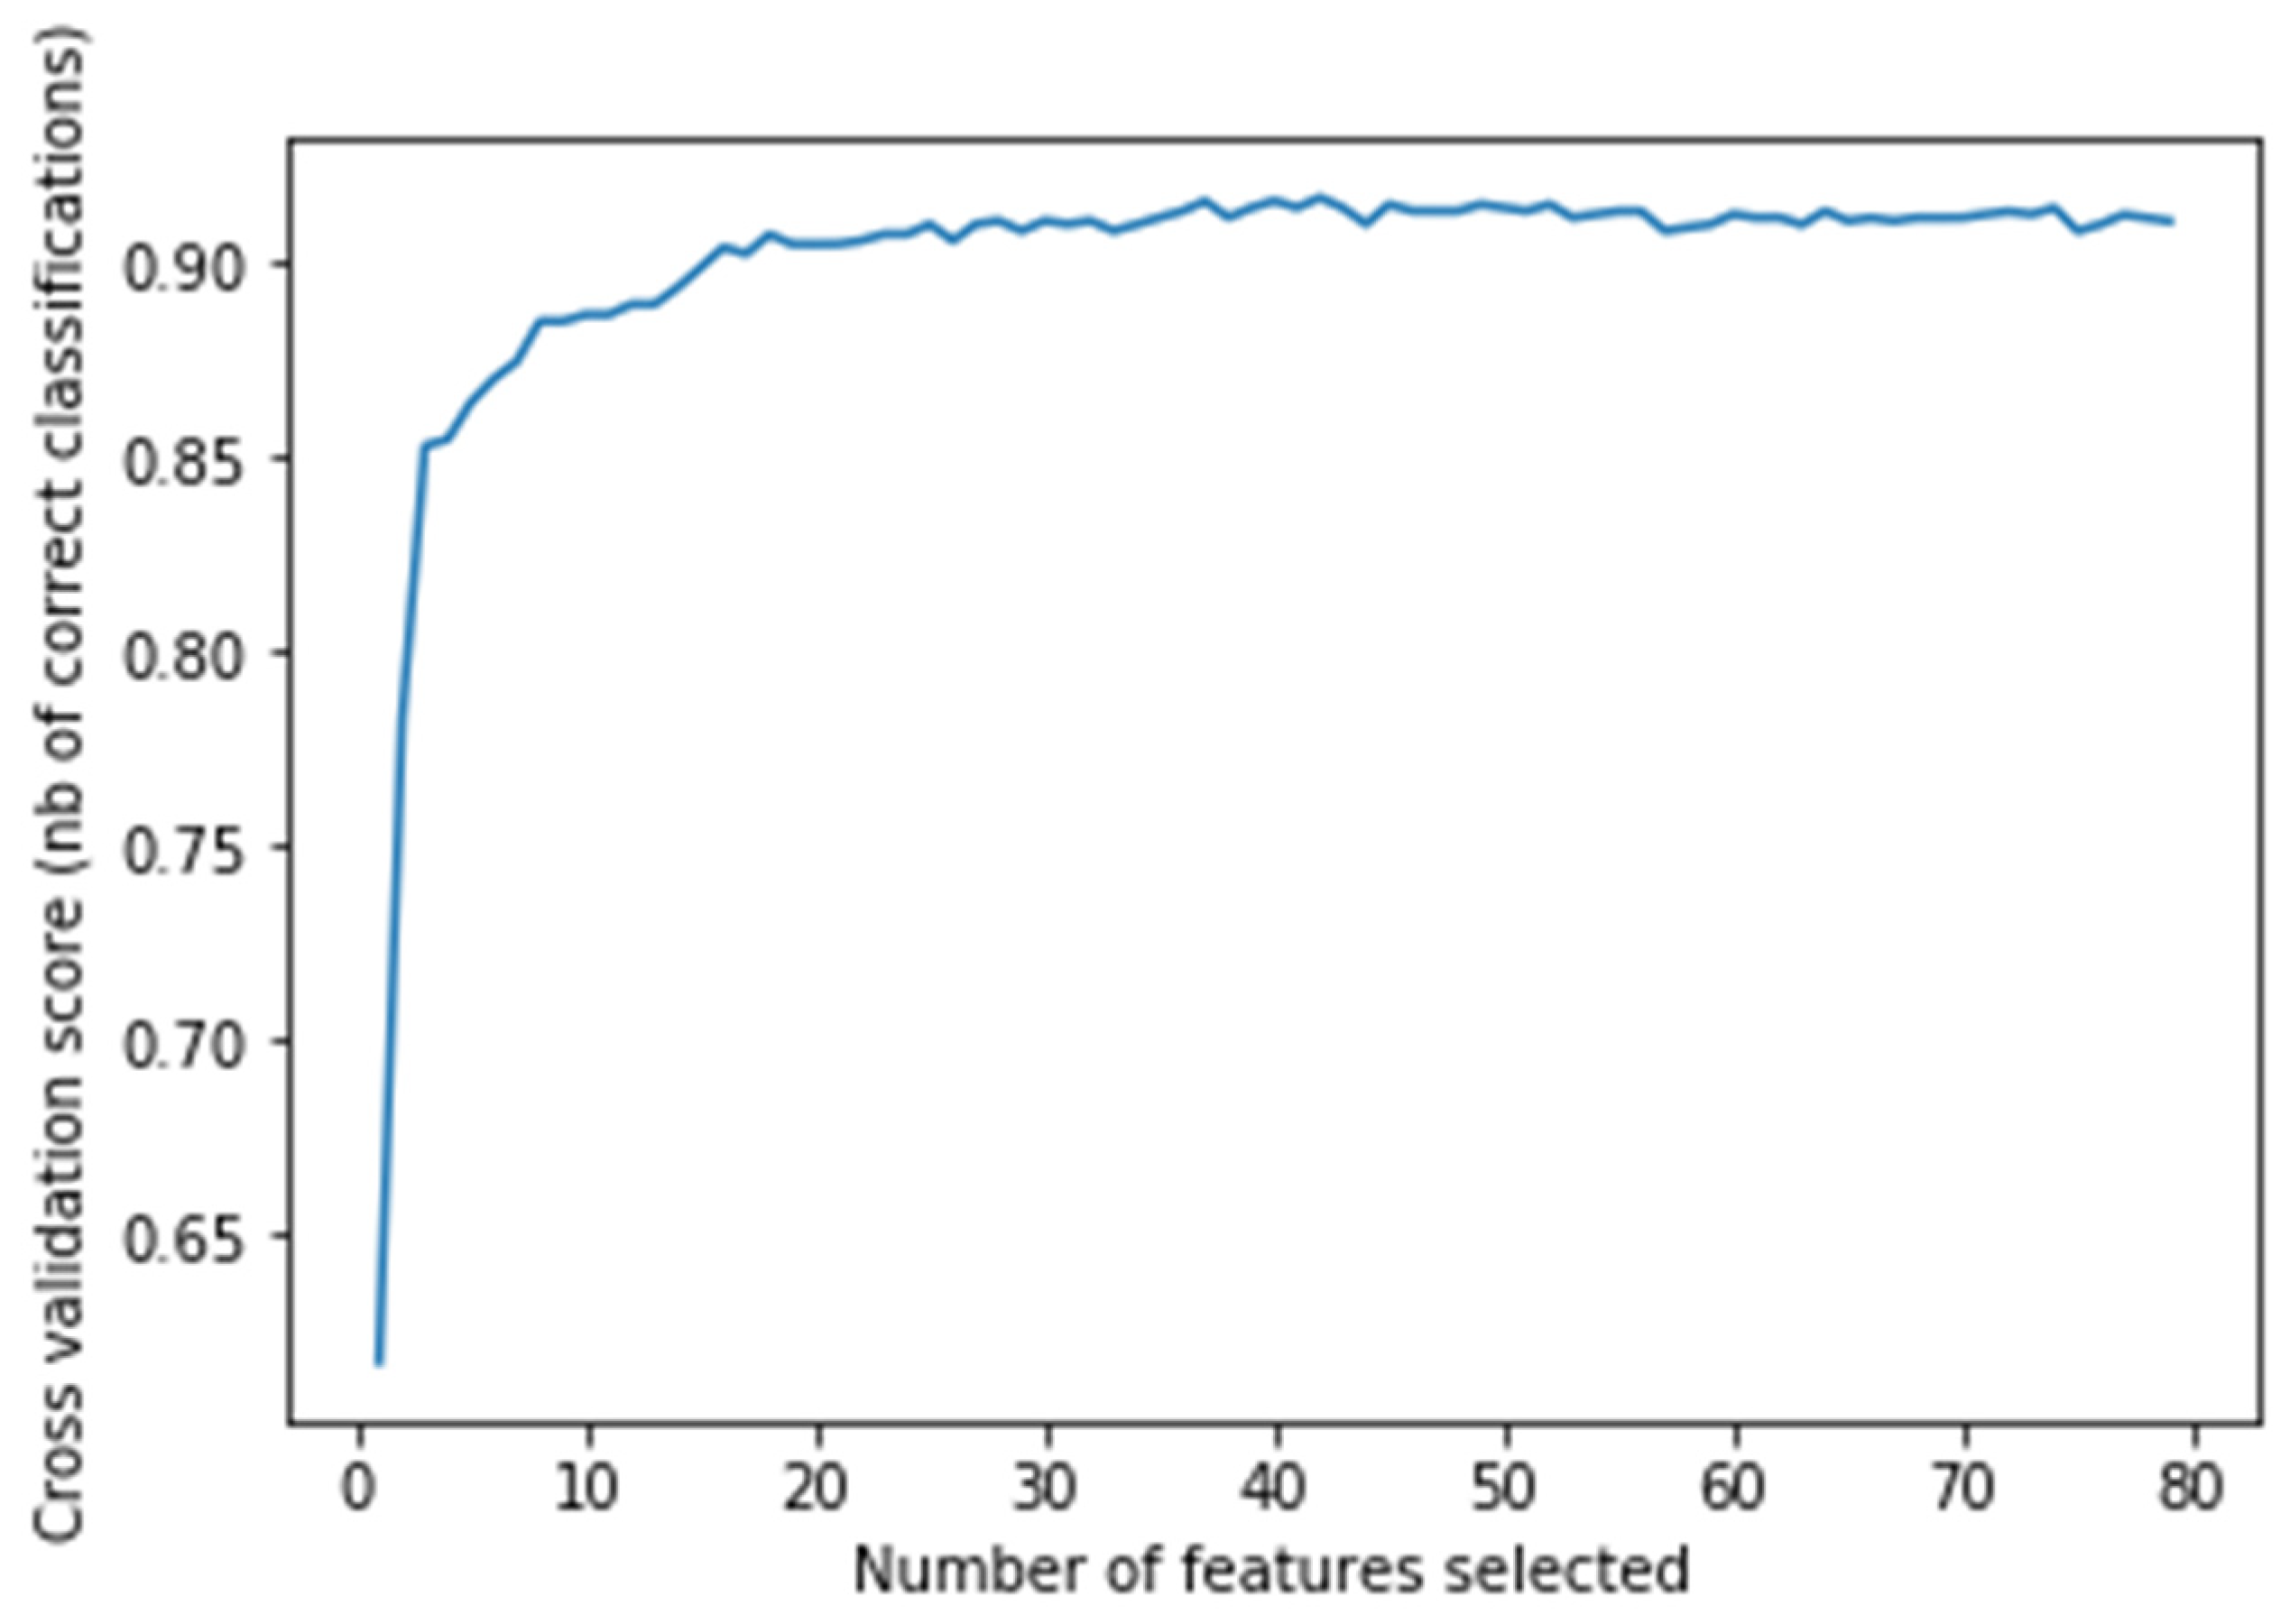
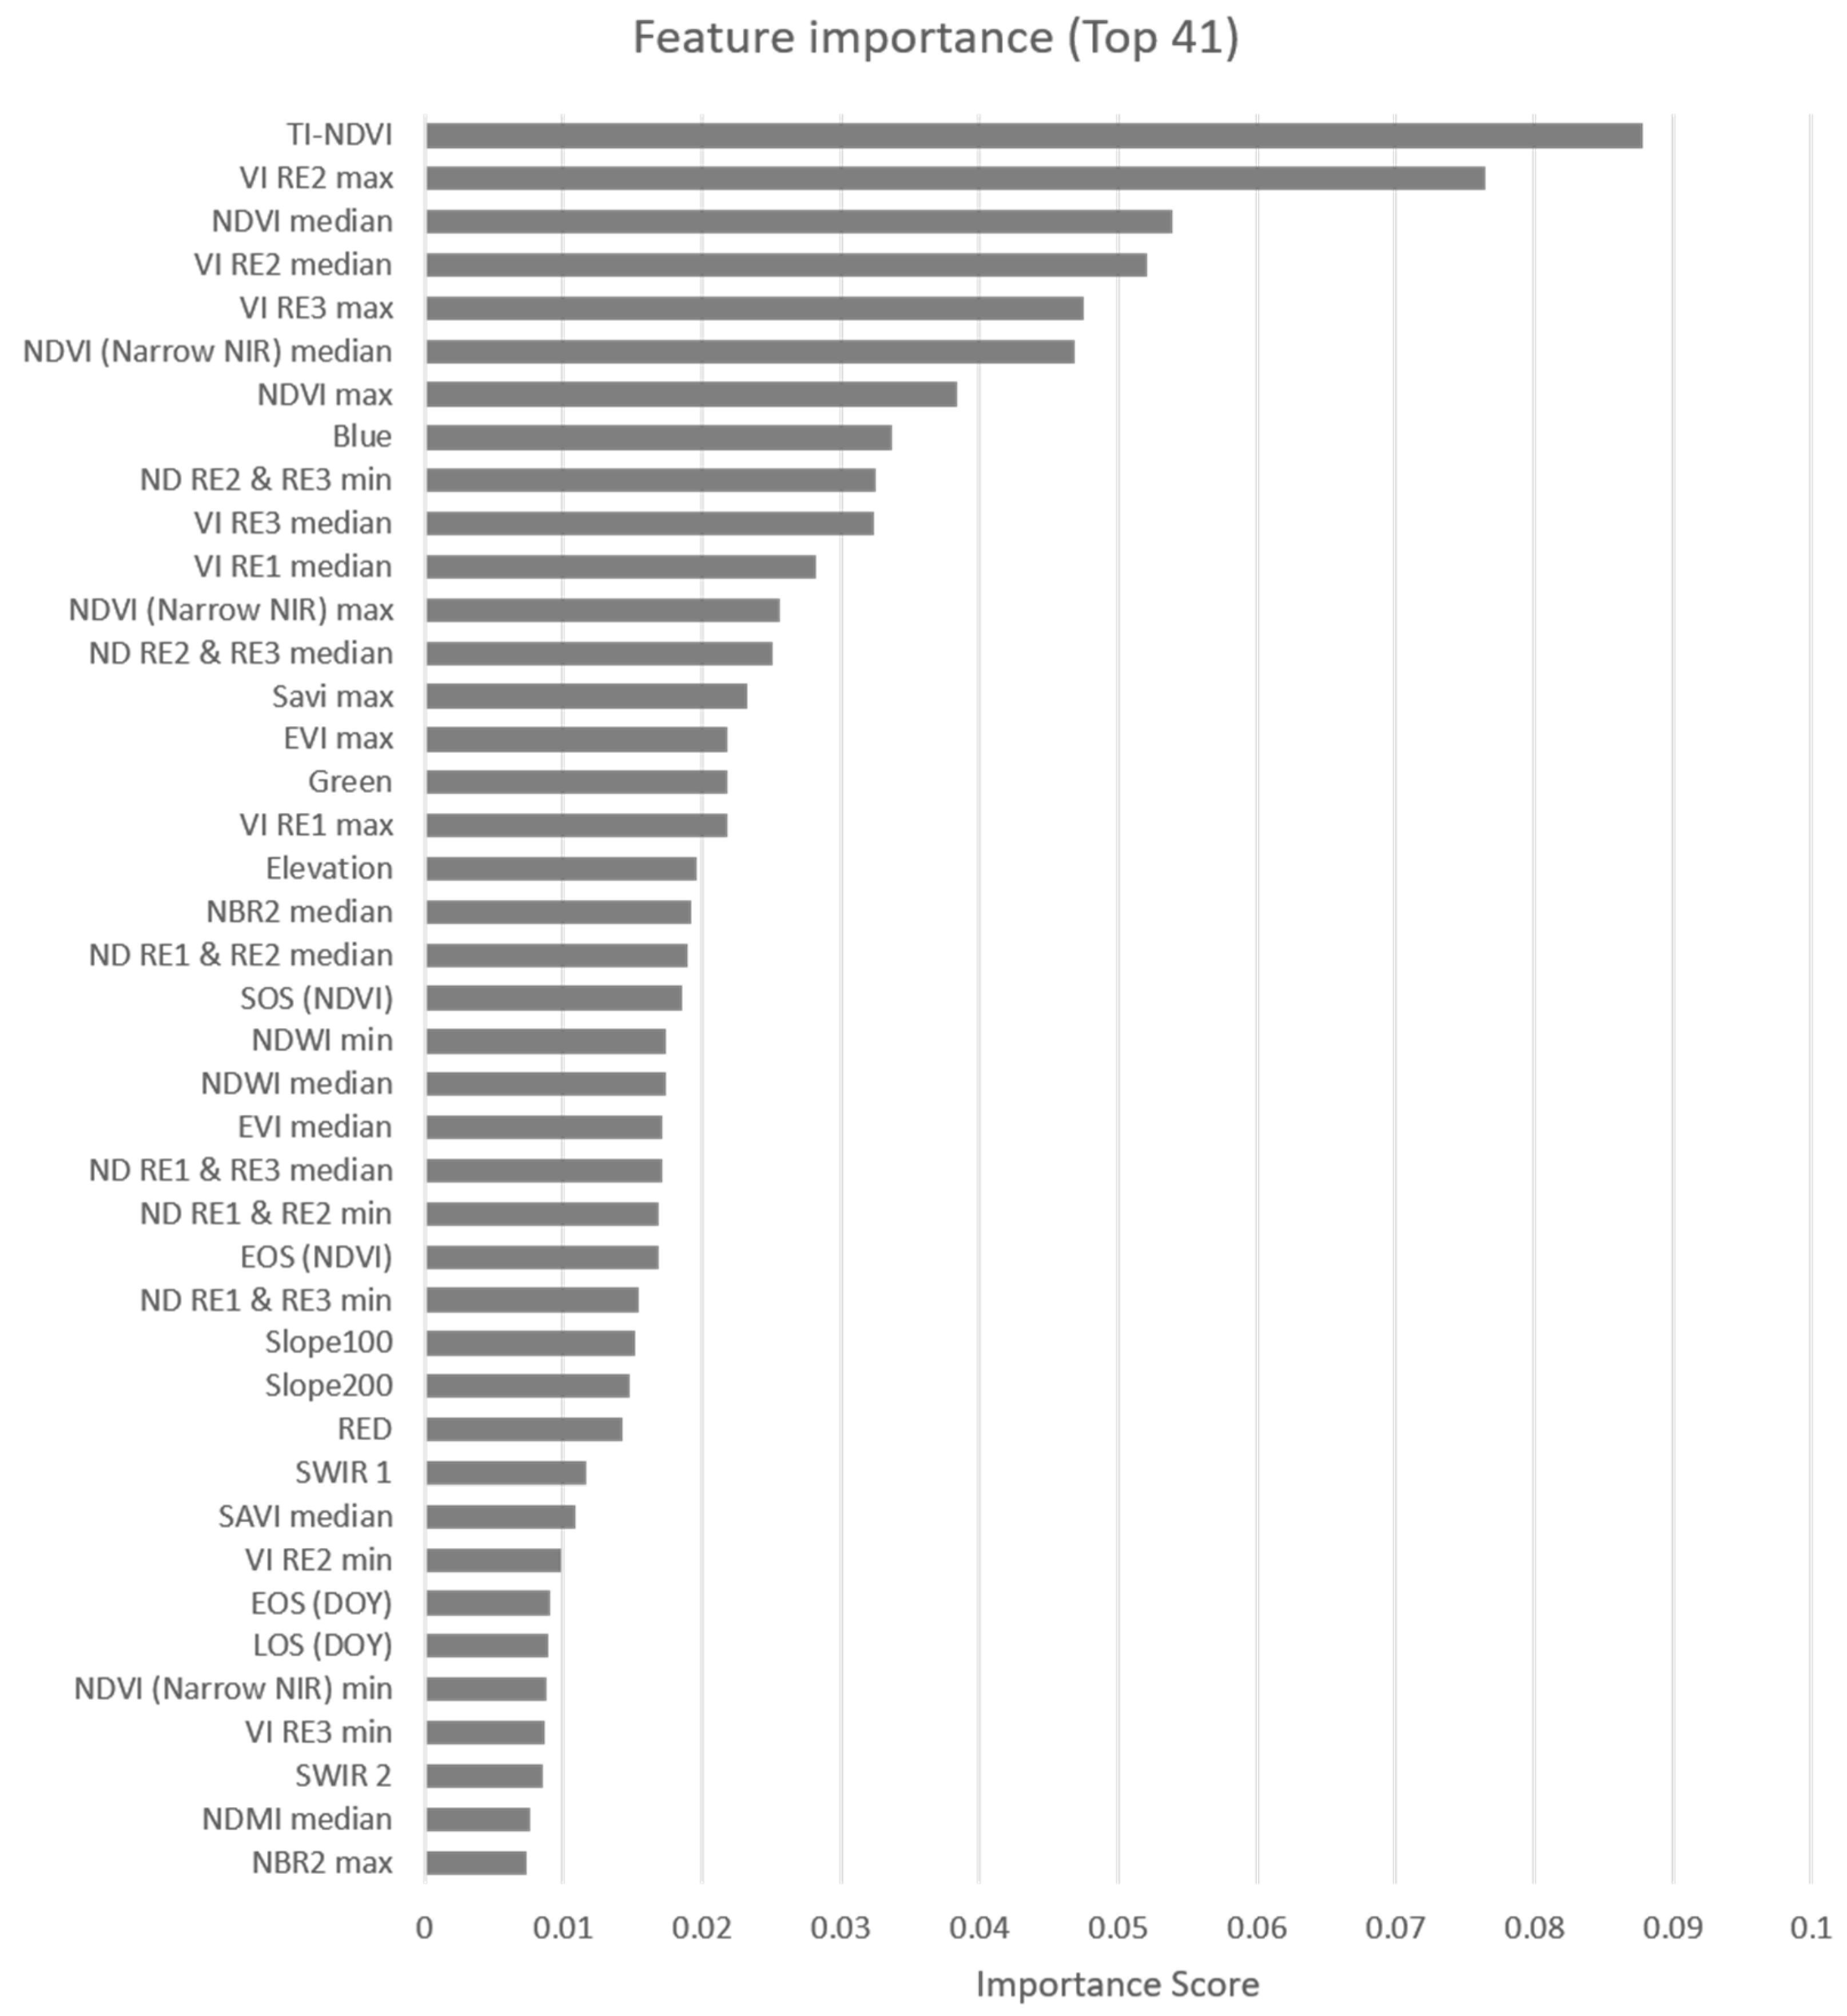
Accurate and precise (i.e., high spatial detail) land-cover mapping is pivotal for improved ecosystem modeling and GHG-related research in the highly heterogeneous Arctic region. The classification framework developed in Google Earth Engine was able to produce high-resolution land cover maps (10 m resolution) covering different climatic and phenological conditions in Greenland. Based on 41 extracted features (vegetation indices, spectral reflectance, and phenology metrics) derived from Sentinel-2 data during 2019 and a DEM, the RF classifier was able to reach a high level of accuracy (OA of 91.8%) when compared against a total of 1164 GRD points. The use of vegetation phenology features derived from Sentinel-2 data, as a means to restrict observations for which features are extracted, was found to be a suitable way to standardize the multi-temporal dataset used. This made the classification framework able to deal with the challenge of area-specific differences in phenology and image availability.
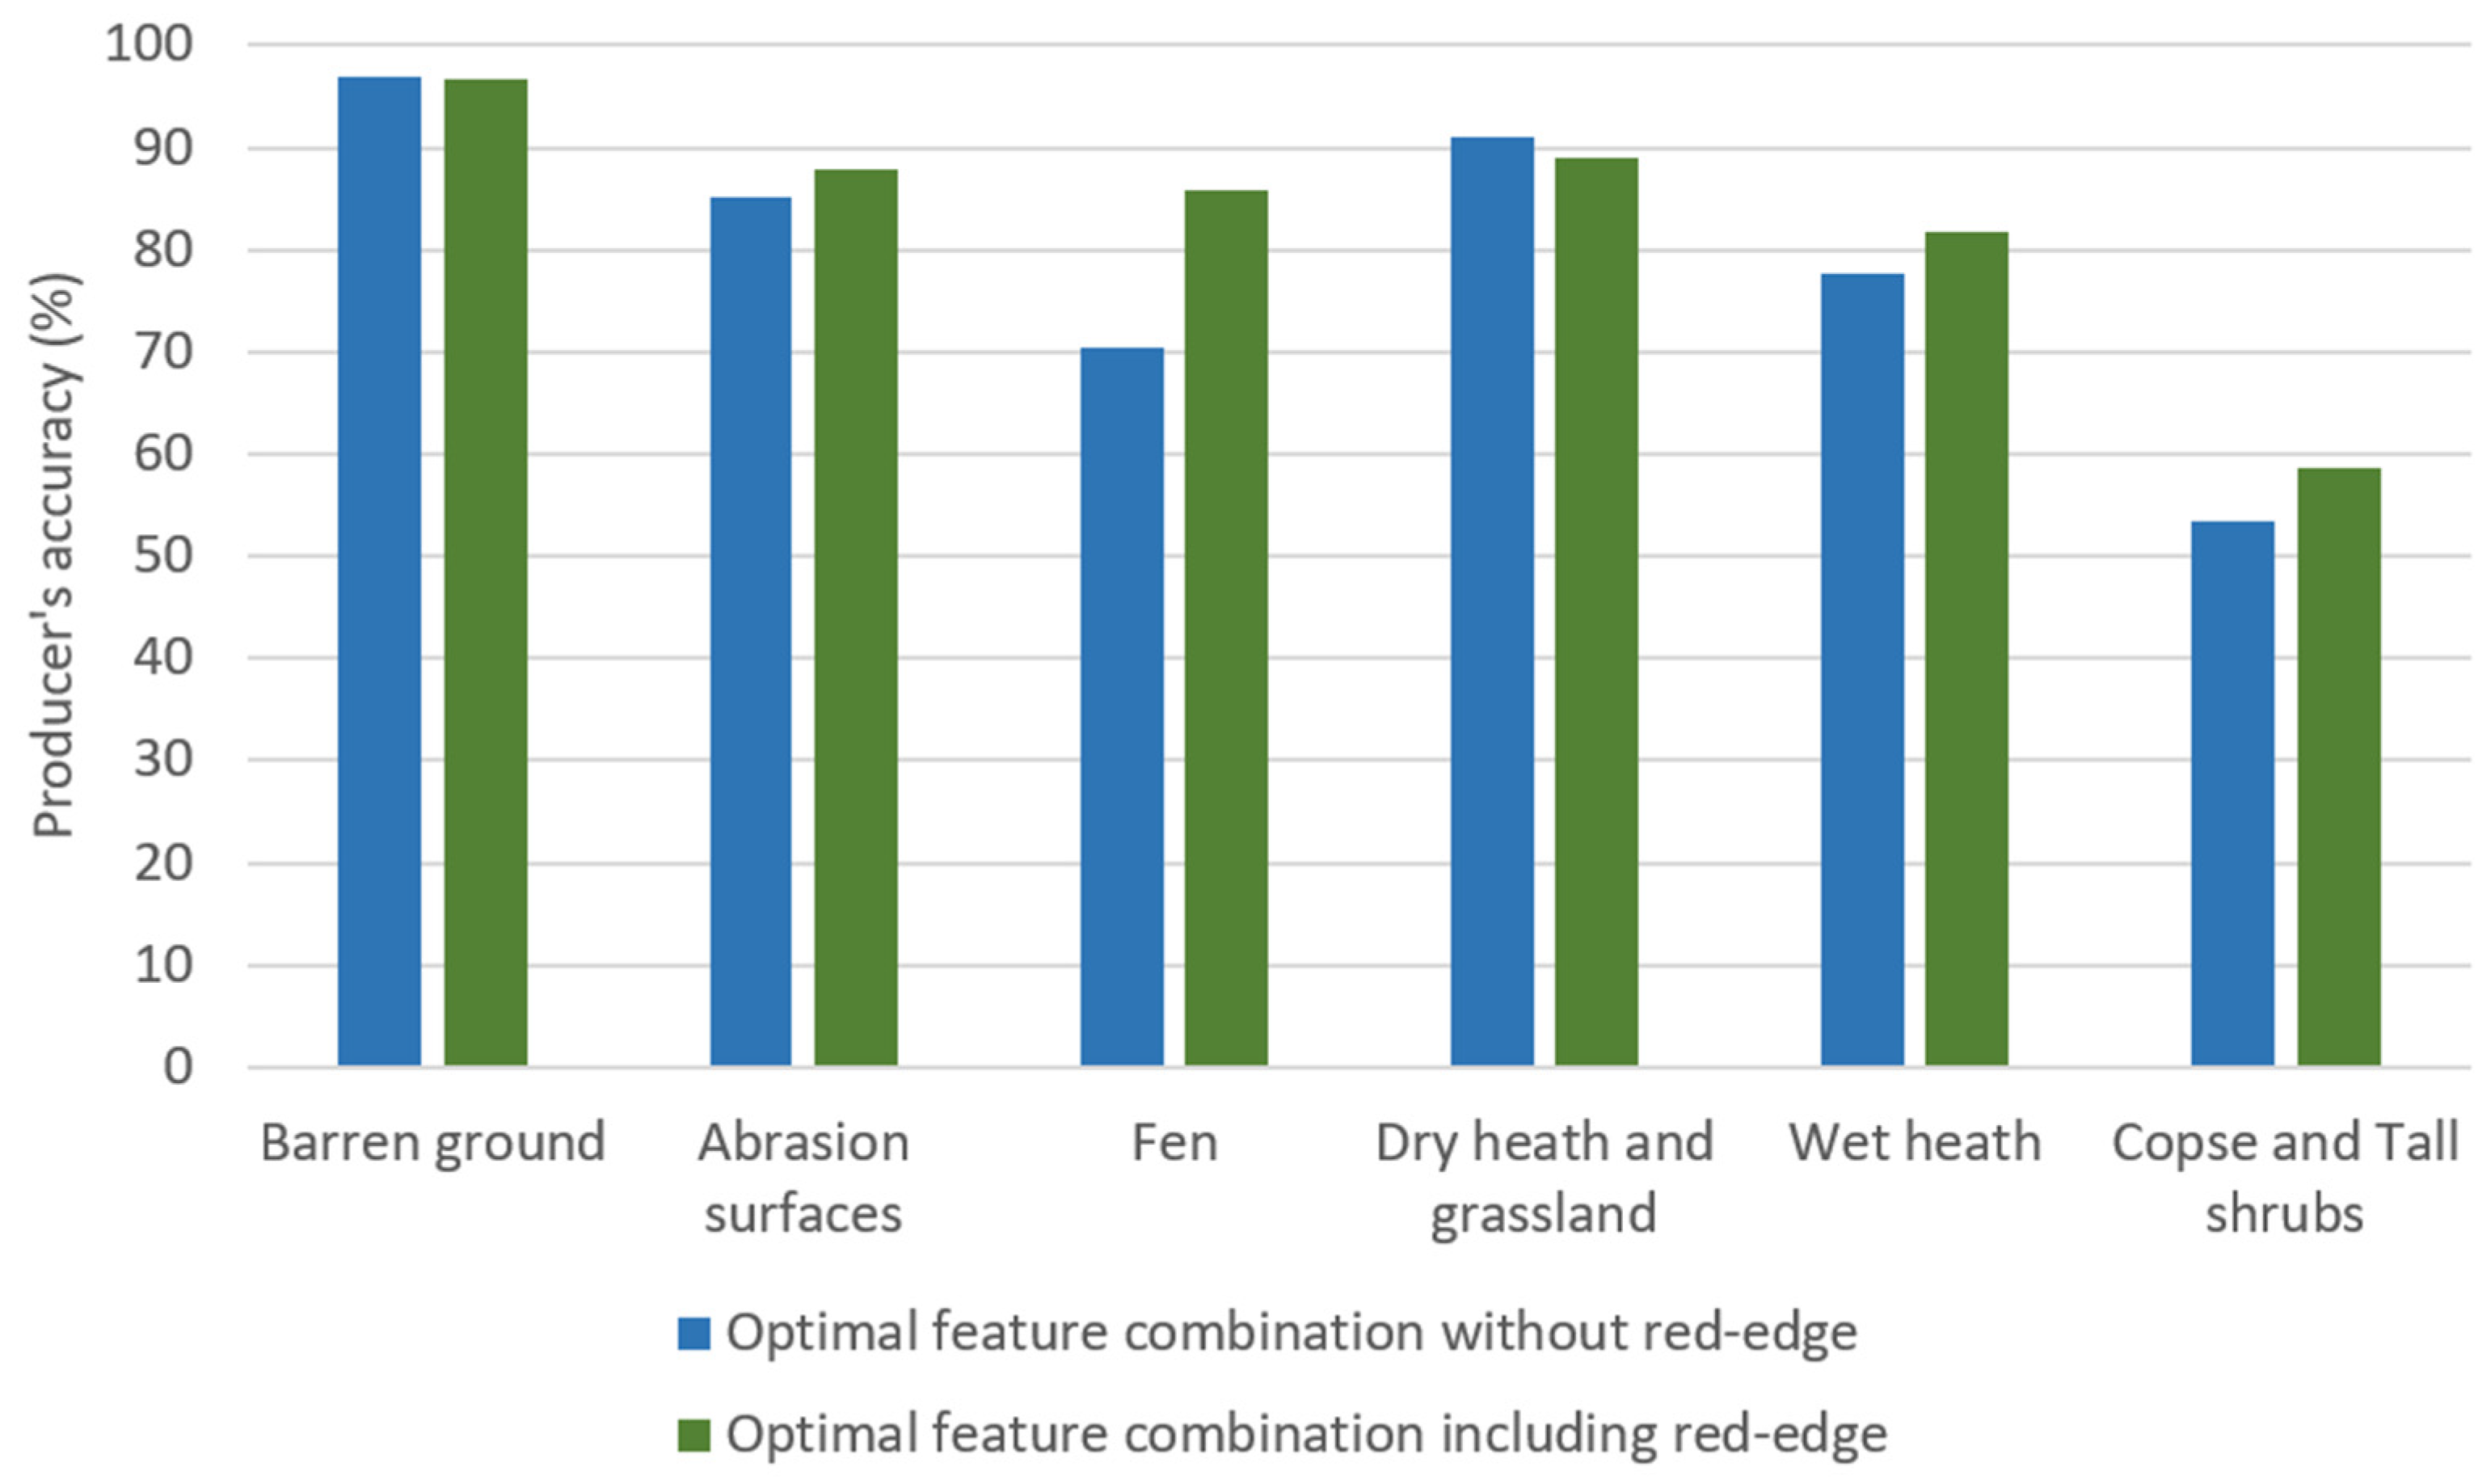
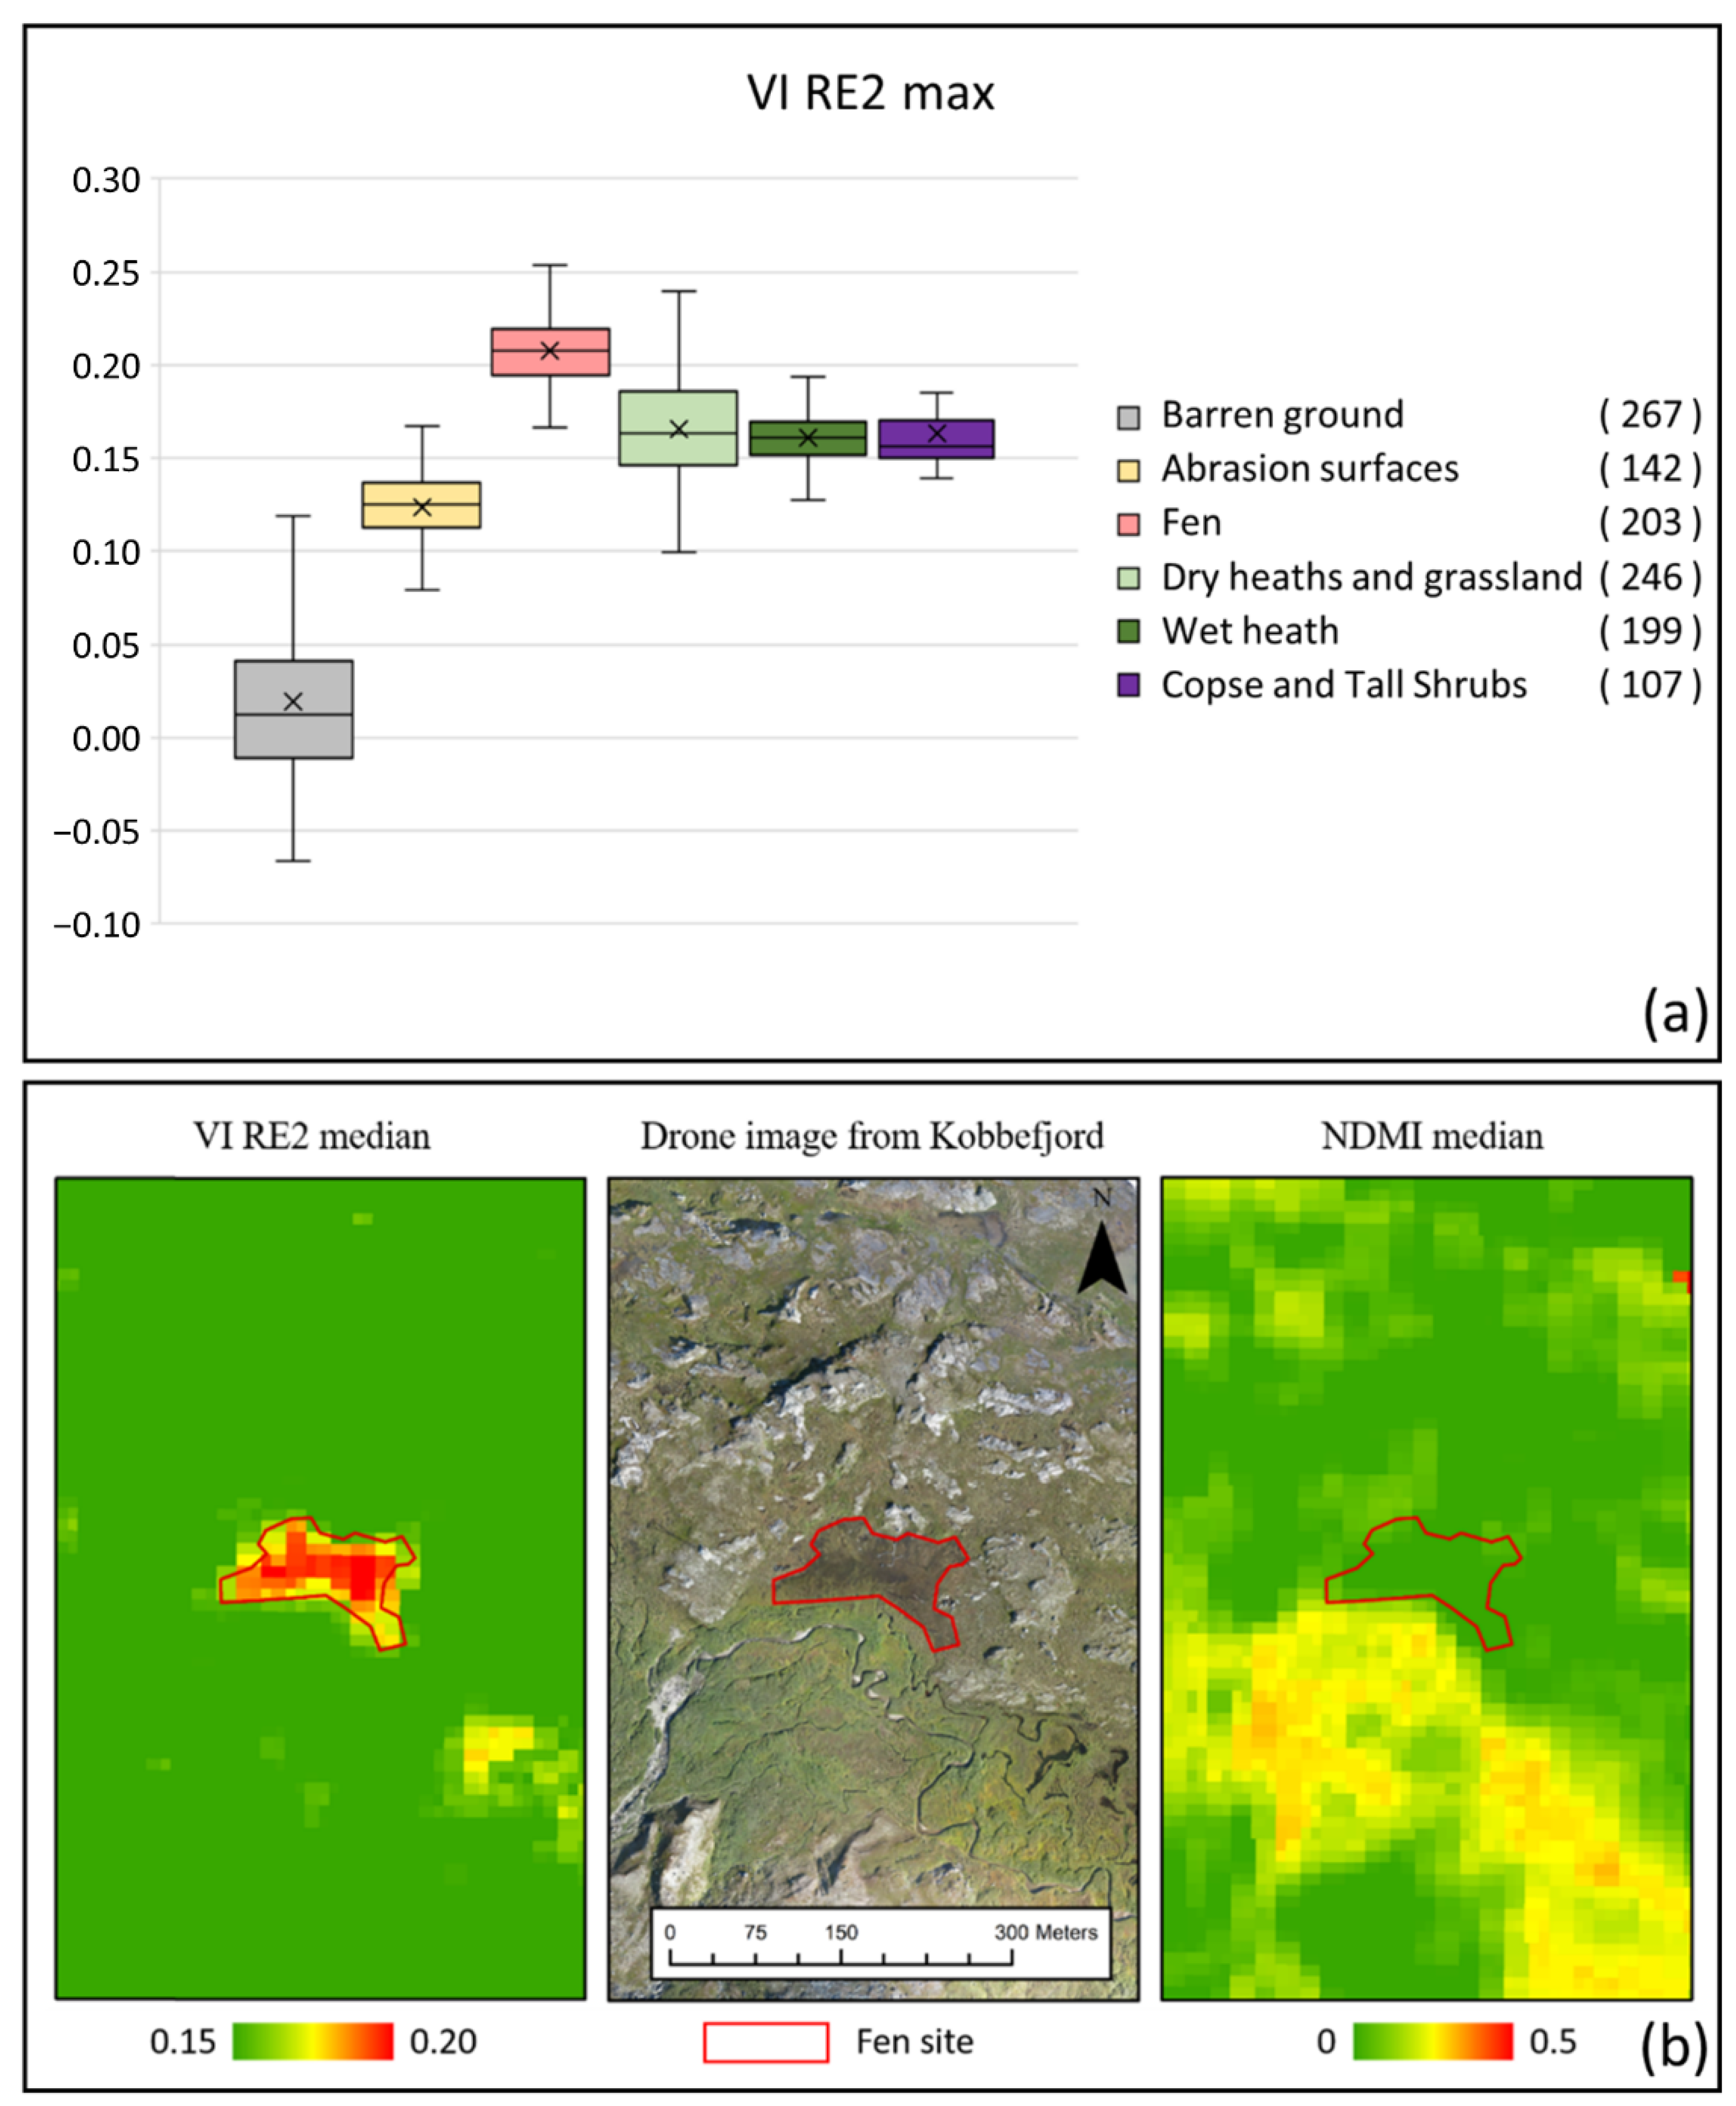
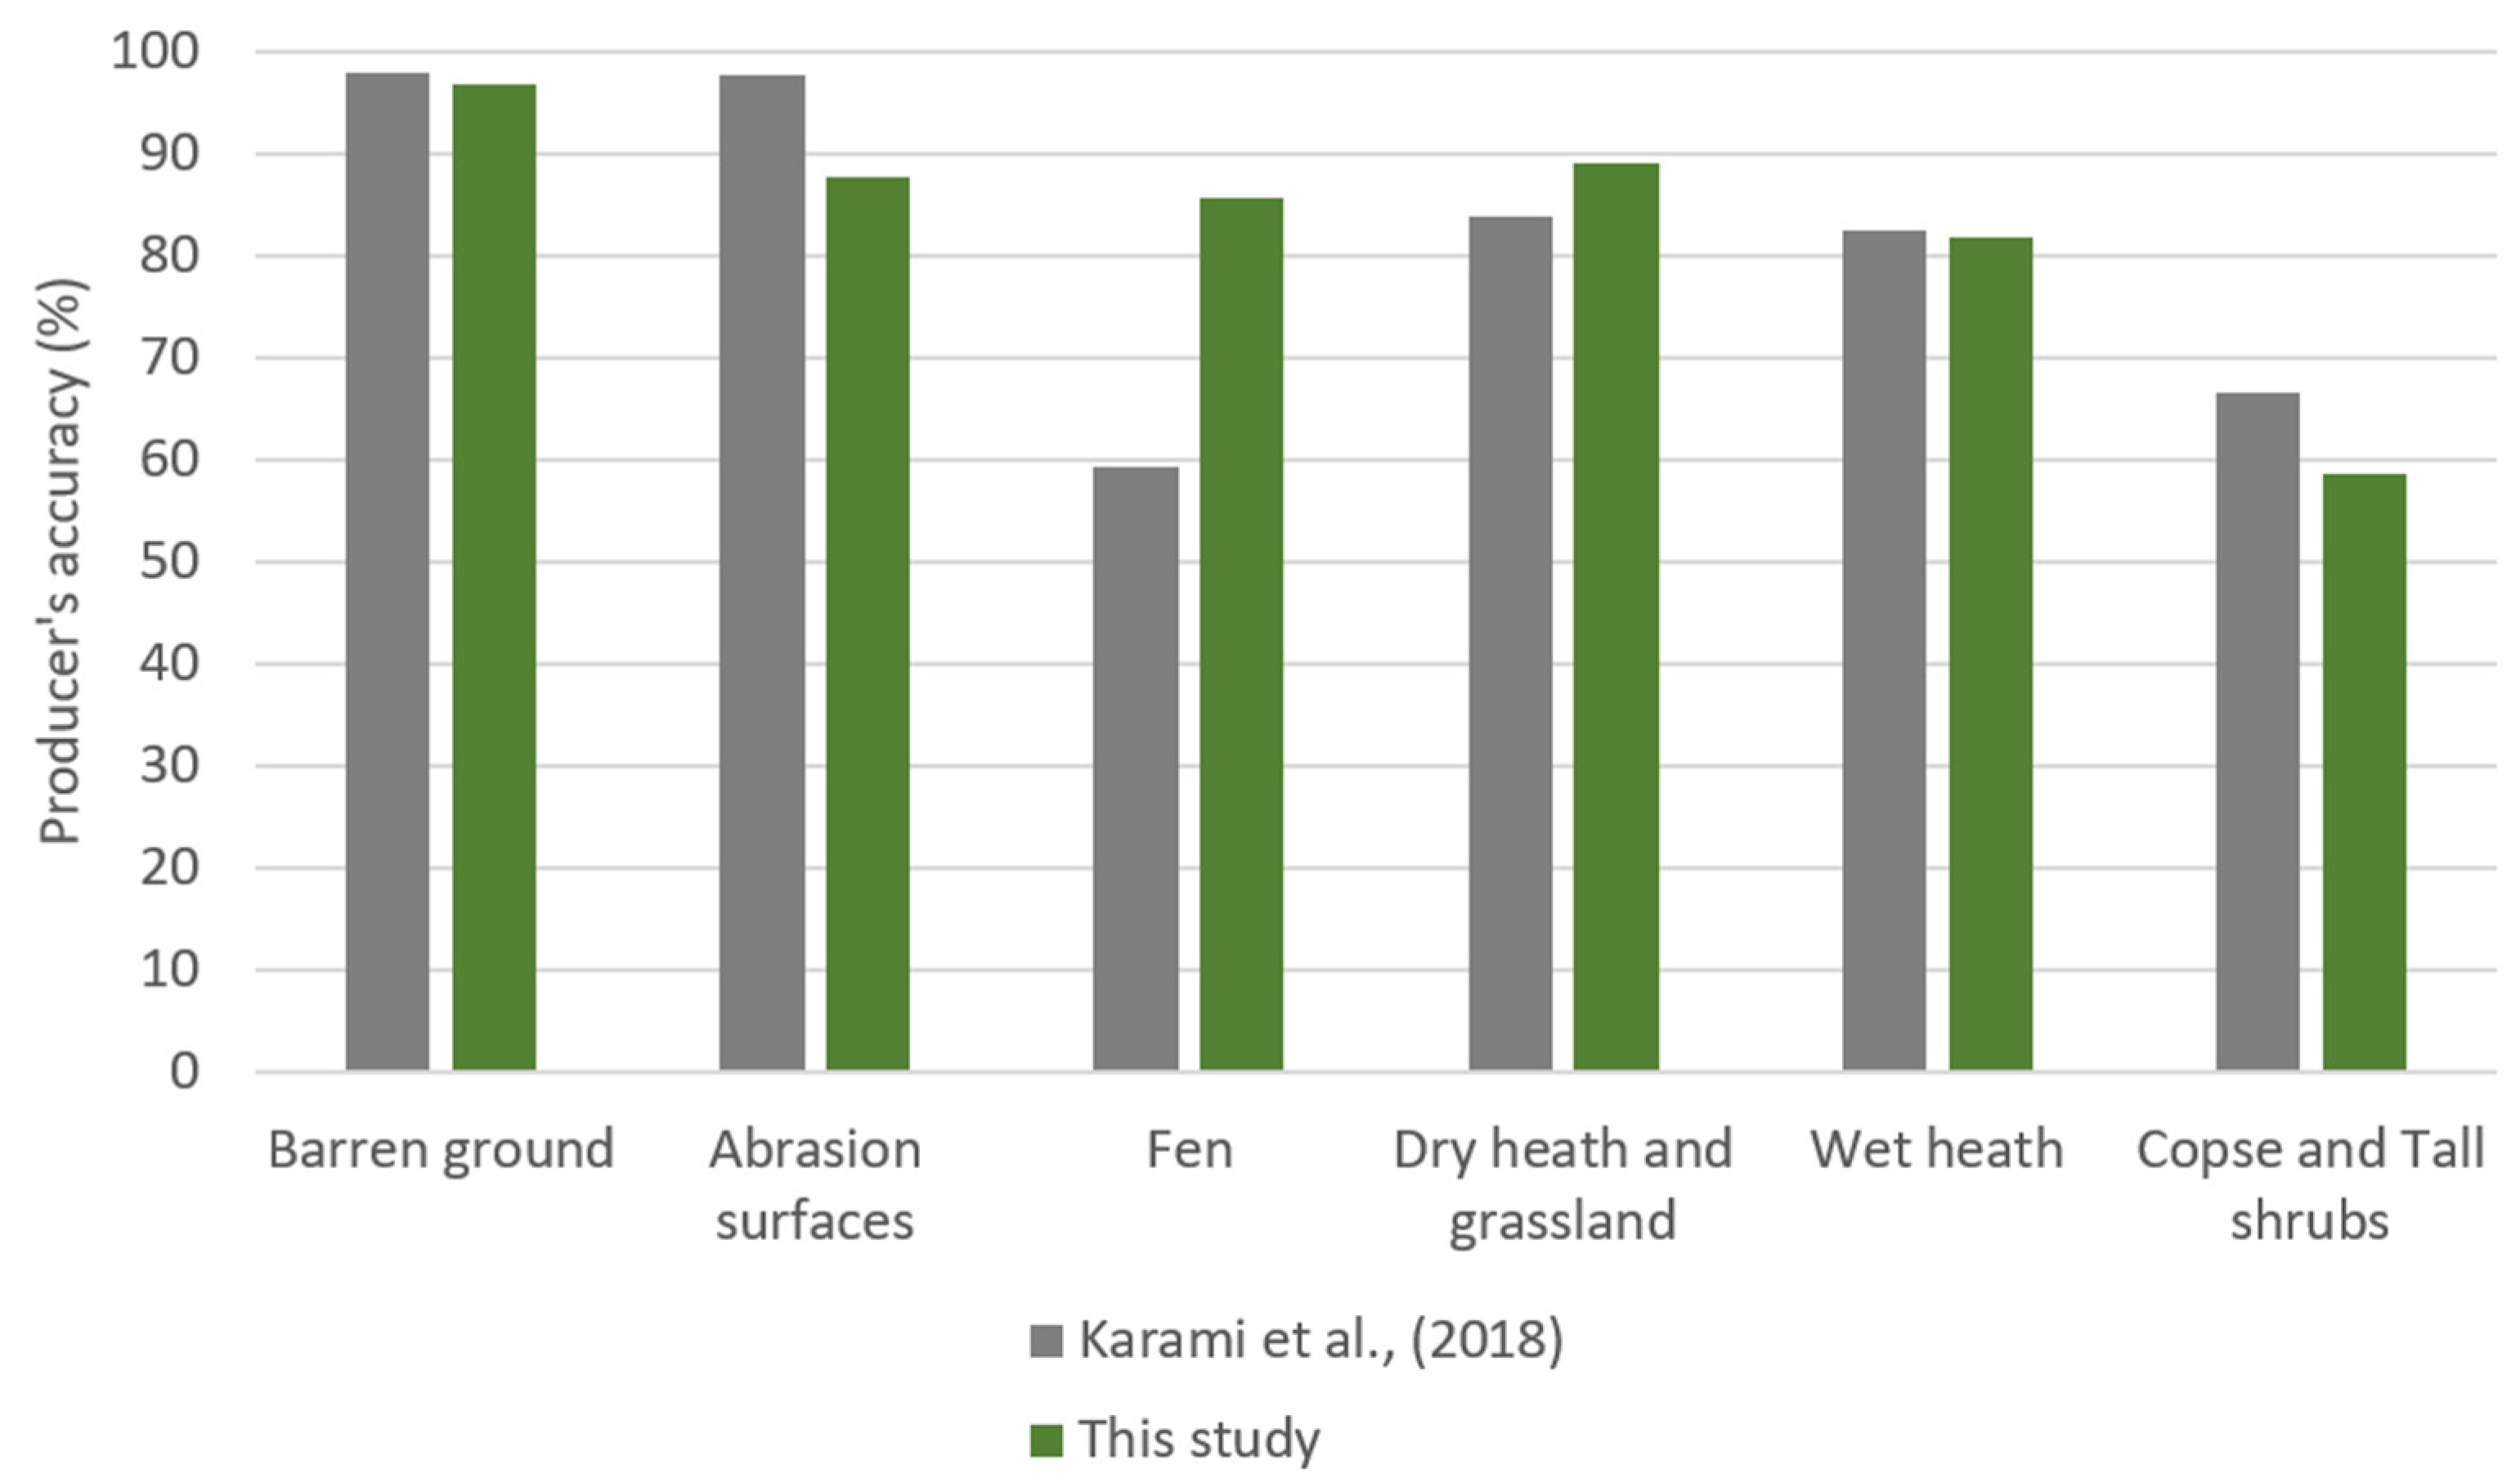
Both phenology and red-edge features derived from Sentinel-2 imagery were found to be of high importance for the classification of land cover in Greenland and increased classification performance was especially observed for the fen class as compared to previous studies based on Landsat data. The overall accuracy of the current classification was found to be at the same level as compared to state-of-the-art mapping of the region, yet the improved spatial resolution (of almost one order of magnitude) of the current study offers considerable advantages for future applications within up-scaling of ground-based climate change ecosystem research.
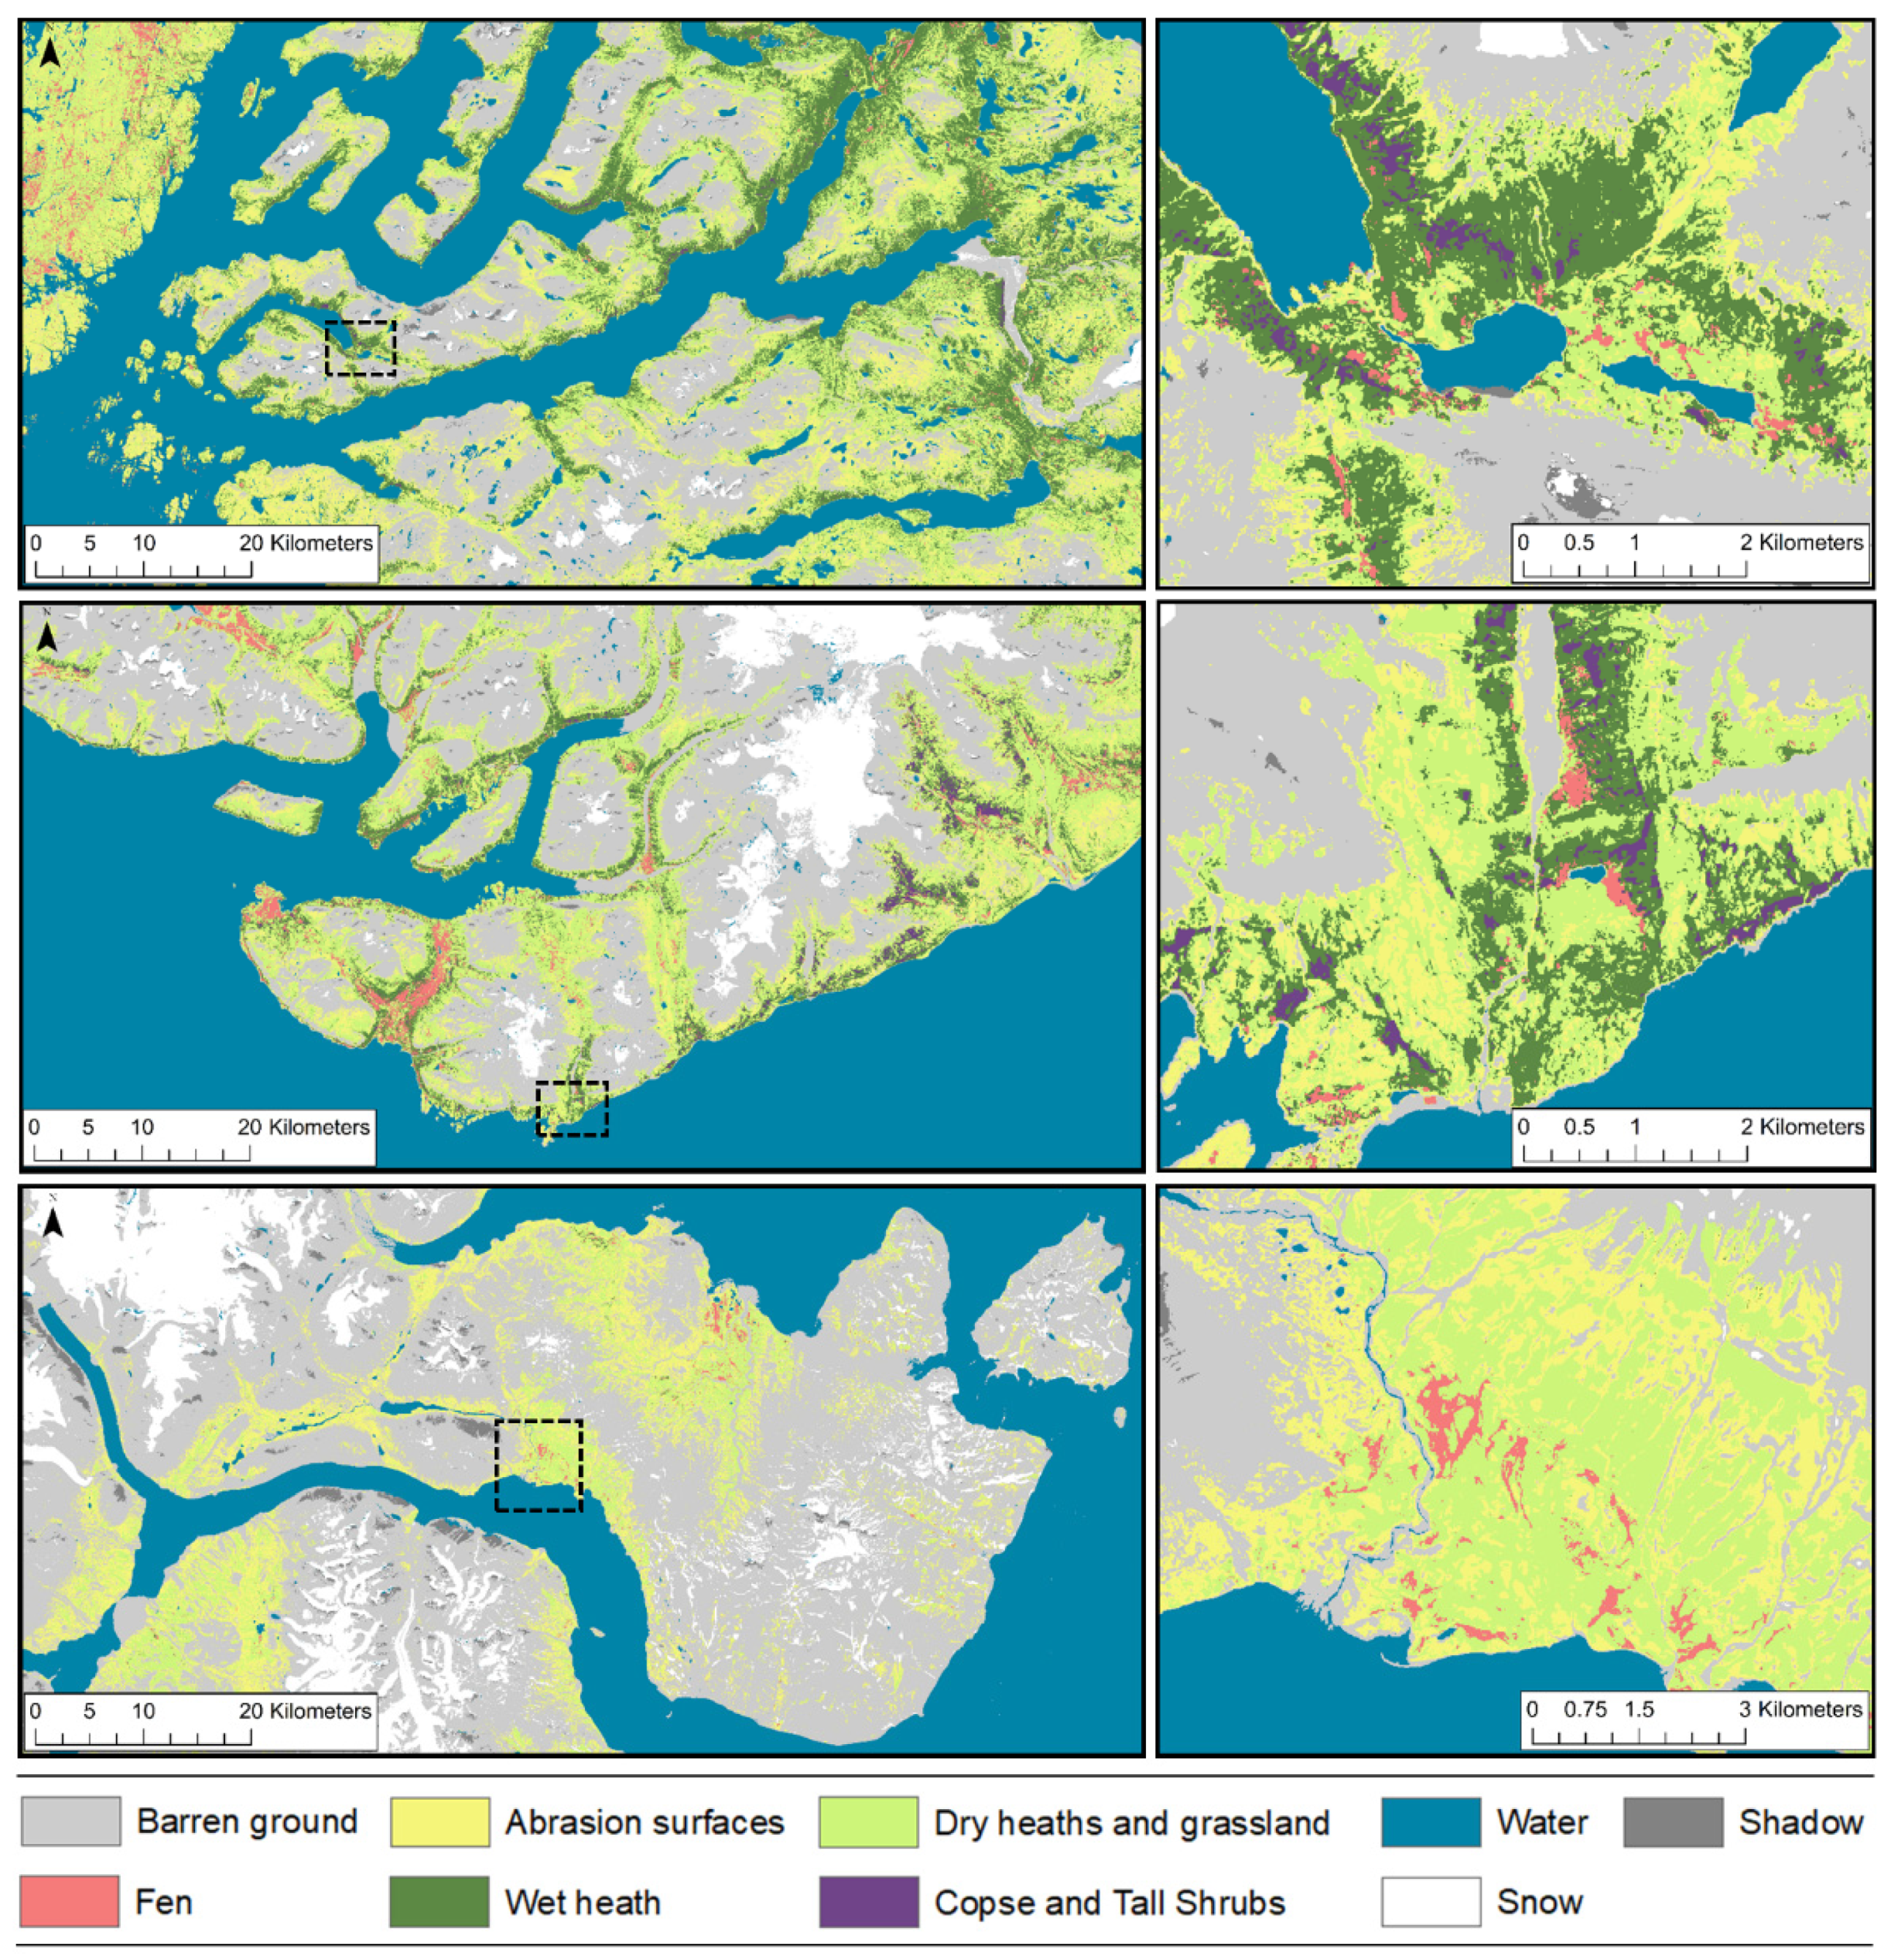
The final classified maps revealed a different distribution of land cover classes across the three case areas. Given the variability in climate and thereby vegetation structure and functioning between the three case areas, it is expected that the proposed framework can be used in extrapolating to other Arctic areas than the ones covered in the present study. The cloud-based framework is scalable and can be easily adapted to classify larger parts (potentially full coverage) of Greenland with a spatial resolution of 10 m. For a wall-to-wall classification of the entire ice-free Greenland, it is, however, important to consider to what extent the land cover classes operated (as defined by the training data set) represent the remaining land cover in Greenland.


