Abstract
Coastal areas have become increasingly vulnerable to groundwater salinization, especially in the last century, due to the combined effects of climate change and growing anthropization. In this study, a novel methodology named GALDIT-SUSI was applied in the floodplain of the Volturno River mouth for the current (2018) and future (2050) evaluation of seawater intrusion accounting for the expected subsidence and groundwater salinization rates. Several input variables such as digital surface model, land use classification, subsidence rate and drainage system have been mapped via remote sensing resources. The current assessment highlights how areas affected by salinization coincide with the semiperennial lagoons and inland depressed areas where paleosaline groundwaters are present. The future assessment (2050) shows a marked increase of salinization vulnerability in the coastal strip and in the most depressed areas. The results highlight that the main vulnerability driver is the Revelle index, while predicted subsidence and recharge rates will only slightly affect groundwater salinization. This case study indicates that GALDIT-SUSI is a reliable and easy-to-use tool for the assessment of groundwater salinization in many coastal regions of the world.
1. Introduction
Coastal zones (CZ) represent exceptionally sensitive environments worldwide which have been deeply influenced by natural processes and human activities capable of modifying the landscape pattern structure and the ecological processes in the related ecosystems [1,2]. Climate change, especially sea-level rise (SLR) [3], severe drought and anomalous waves [4] are the natural processes that most affect coastal systems [5], and anthropic pressures, namely high population density and widespread agricultural and touristic activities [6,7], have been identified as important drivers responsible for coastal systems degradation, especially in deltaic coastal settings.
In particular, seawater intrusion (SI) and more generally groundwater salinization, are serious phenomena that could negatively affect these delicate settings, being the main discriminating factor for the groundwater quality in coastal aquifers worldwide. In the Mediterranean coastal areas, anthropogenic activities requiring large quantities of water, which is usually met by abstracting groundwater resources, have led to continuous groundwater depletion, triggering SI. Moreover, among all factors, SLR in Mediterranean coastal aquifers has been identified as one of the main reasons responsible for actual and future SI [8], which can be further amplified by local factors such as land subsidence [9] and coastline retreat [10].
In many coastal areas worldwide, subsidence rate has significantly increased within the last 50 years due to (i) economic growth, (ii) excessive pumping of groundwater, (iii) touristic growth and (iv) continuous changes in land use [11]. The phenomenon of subsidence could in turn promote several issues, especially in coastal plains, such as land inundation, water salinization and increased hydraulic risk. The full understanding of subsidence triggering factors still represents a challenging task due to the large number of both natural and anthropogenic variables involved [12,13]. Considering all these factors, it is critical to include the analysis of subsidence rate when assessing which coastal areas may be more vulnerable to SI.
Various methodologies were proposed and tested to assess groundwater vulnerability to SI, although they do not consider together all the hazard factors previously mentioned. The simplest and most widely used methods are index and overlay methods [14]. Many of these methodologies were developed for the assessment of anthropogenic pollution, but they were also used for SI assessment. They include canonical and modified forms of GALDIT [15,16], which were successfully applied in many regions worldwide [17,18,19]. The most recent modifications of GALDIT include (i) weight and classes optimization with statistical methods [20], (ii) conceptual optimization [21] and (iii) the addition of new parameters [22,23].
Nevertheless, all these studies have focused only on the current status of SI evaluation without offering a provision for possible future changes. Aerial and satellite image interpretation can help greatly to overcome this issue by identifying landform characteristics and increasing input data resolution. Recently, their utilization has become more user-friendly, owing to the creation of dedicated management software [24]. For example, several thematic maps such as (i) drainage density, (ii) geomorphology, (iii) land use and (iv) land cover could be enhanced and adapted using Landsat data [25,26]. Moreover, all these remote sensing products, if suitably modified, could also be useful to obtain a forecast of the future evolution of a particular morphological feature.
Accordingly, the aim of this study is to assess the actual (2018) and future (2050) groundwater salinization in the delta coastal plain of the Volturno River via a GALDIT-SUSI application focused on anthropogenic impacts and enhanced with remote sensing data. The study area was chosen since a recent study based on geostatistical and trend analysis [27] have already highlighted the presence of SI in the coastal area. A future assessment of the phenomena, together with a specification of the main drivers responsible for future change in SI, will help to implement specific remediation actions finalized to a sustainable use of groundwater resources. This work proposes the first attempt to merge classical hydrogeological information, normally used to implement classical and modified GALDIT methods, with data produced using remote sensing technologies, aimed to produce an actual and future assessment of the SI phenomenon. Specifically, land use together with projected subsidence rates will also offer useful insights for the near-future coastal lands management.
2. Study Area
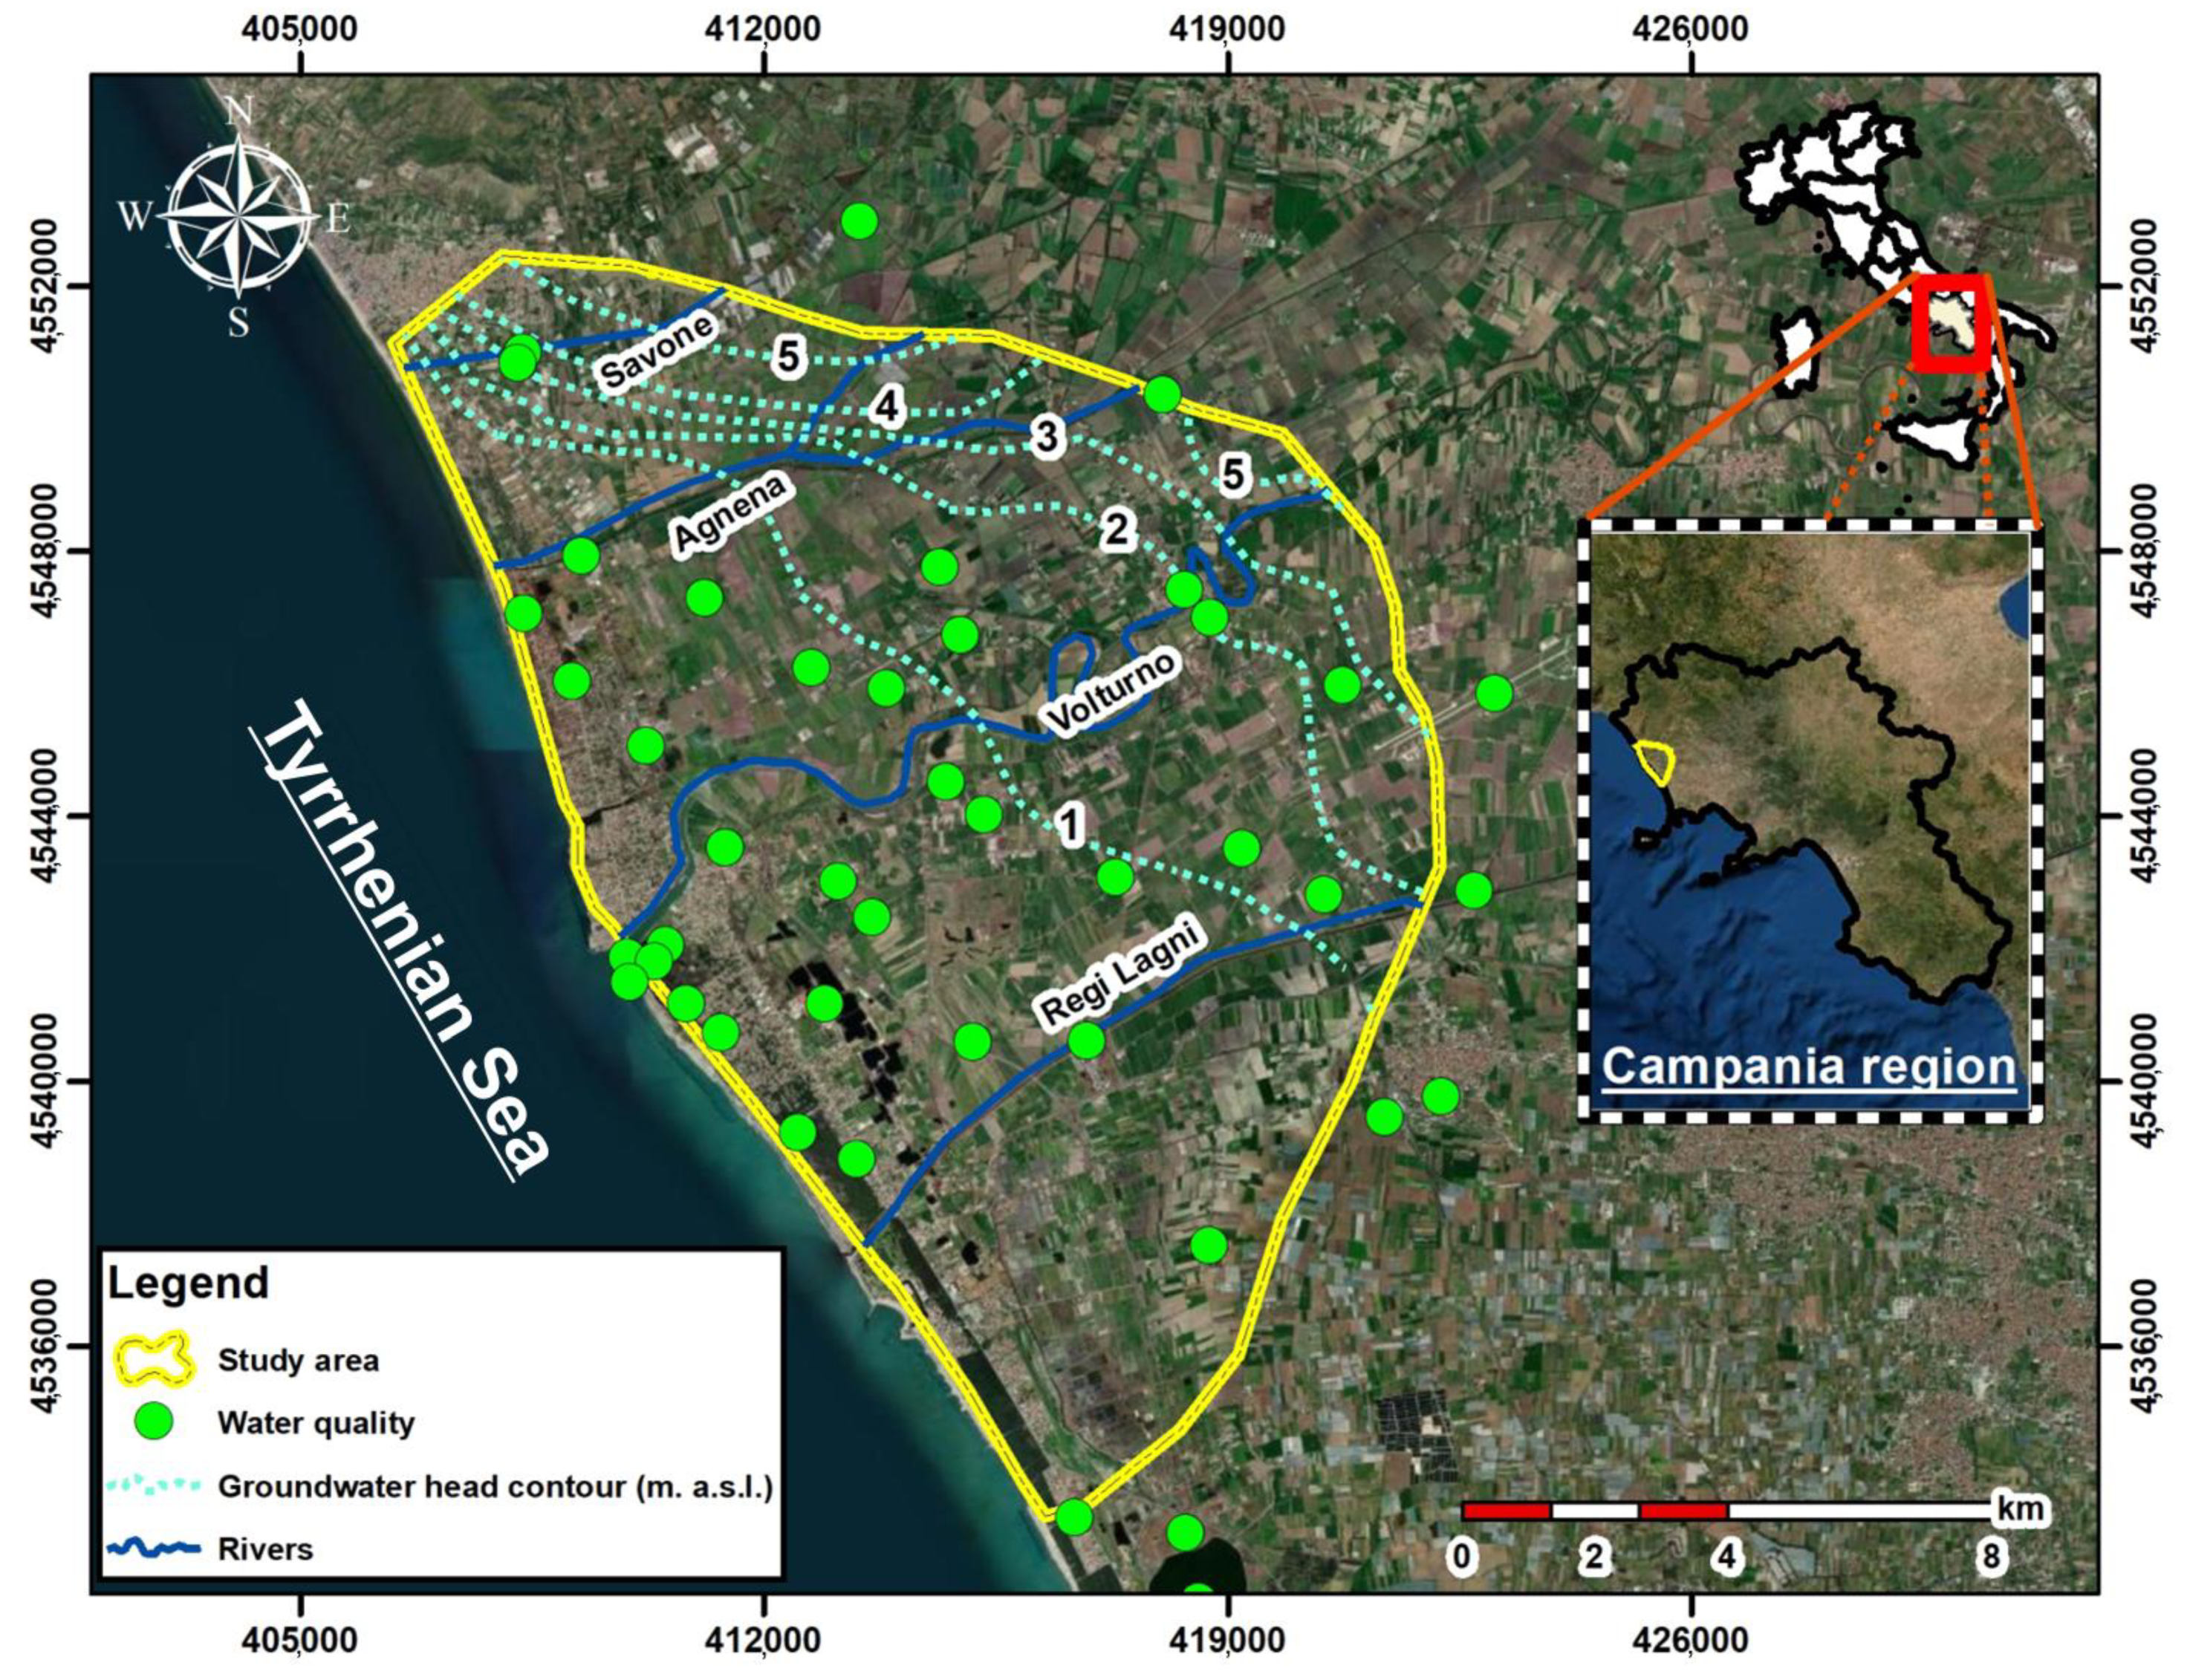
The CZ chosen in this study for the SI assessment is the coastal floodplain belonging to the Volturno River mouth, in the Campania Plain (CP), Southern Italy (Figure 1). The entire CP has high economic and ecological values, due to the presence of many farm activities, touristic structures and wetland protected zones, such as the Variconi oasis. The Volturno River delta plain is a small part of a wide tectonic depression of the CP, a large extensional sedimentary basin formed during the Quaternary, between the western broadside of the Southern Apennines and the Eastern Tyrrhenian margin [28].

Figure 1.
Location map of the study area (yellow boundary), well locations (green dots), main river courses (blue lines) and groundwater head contours (dotted lines).
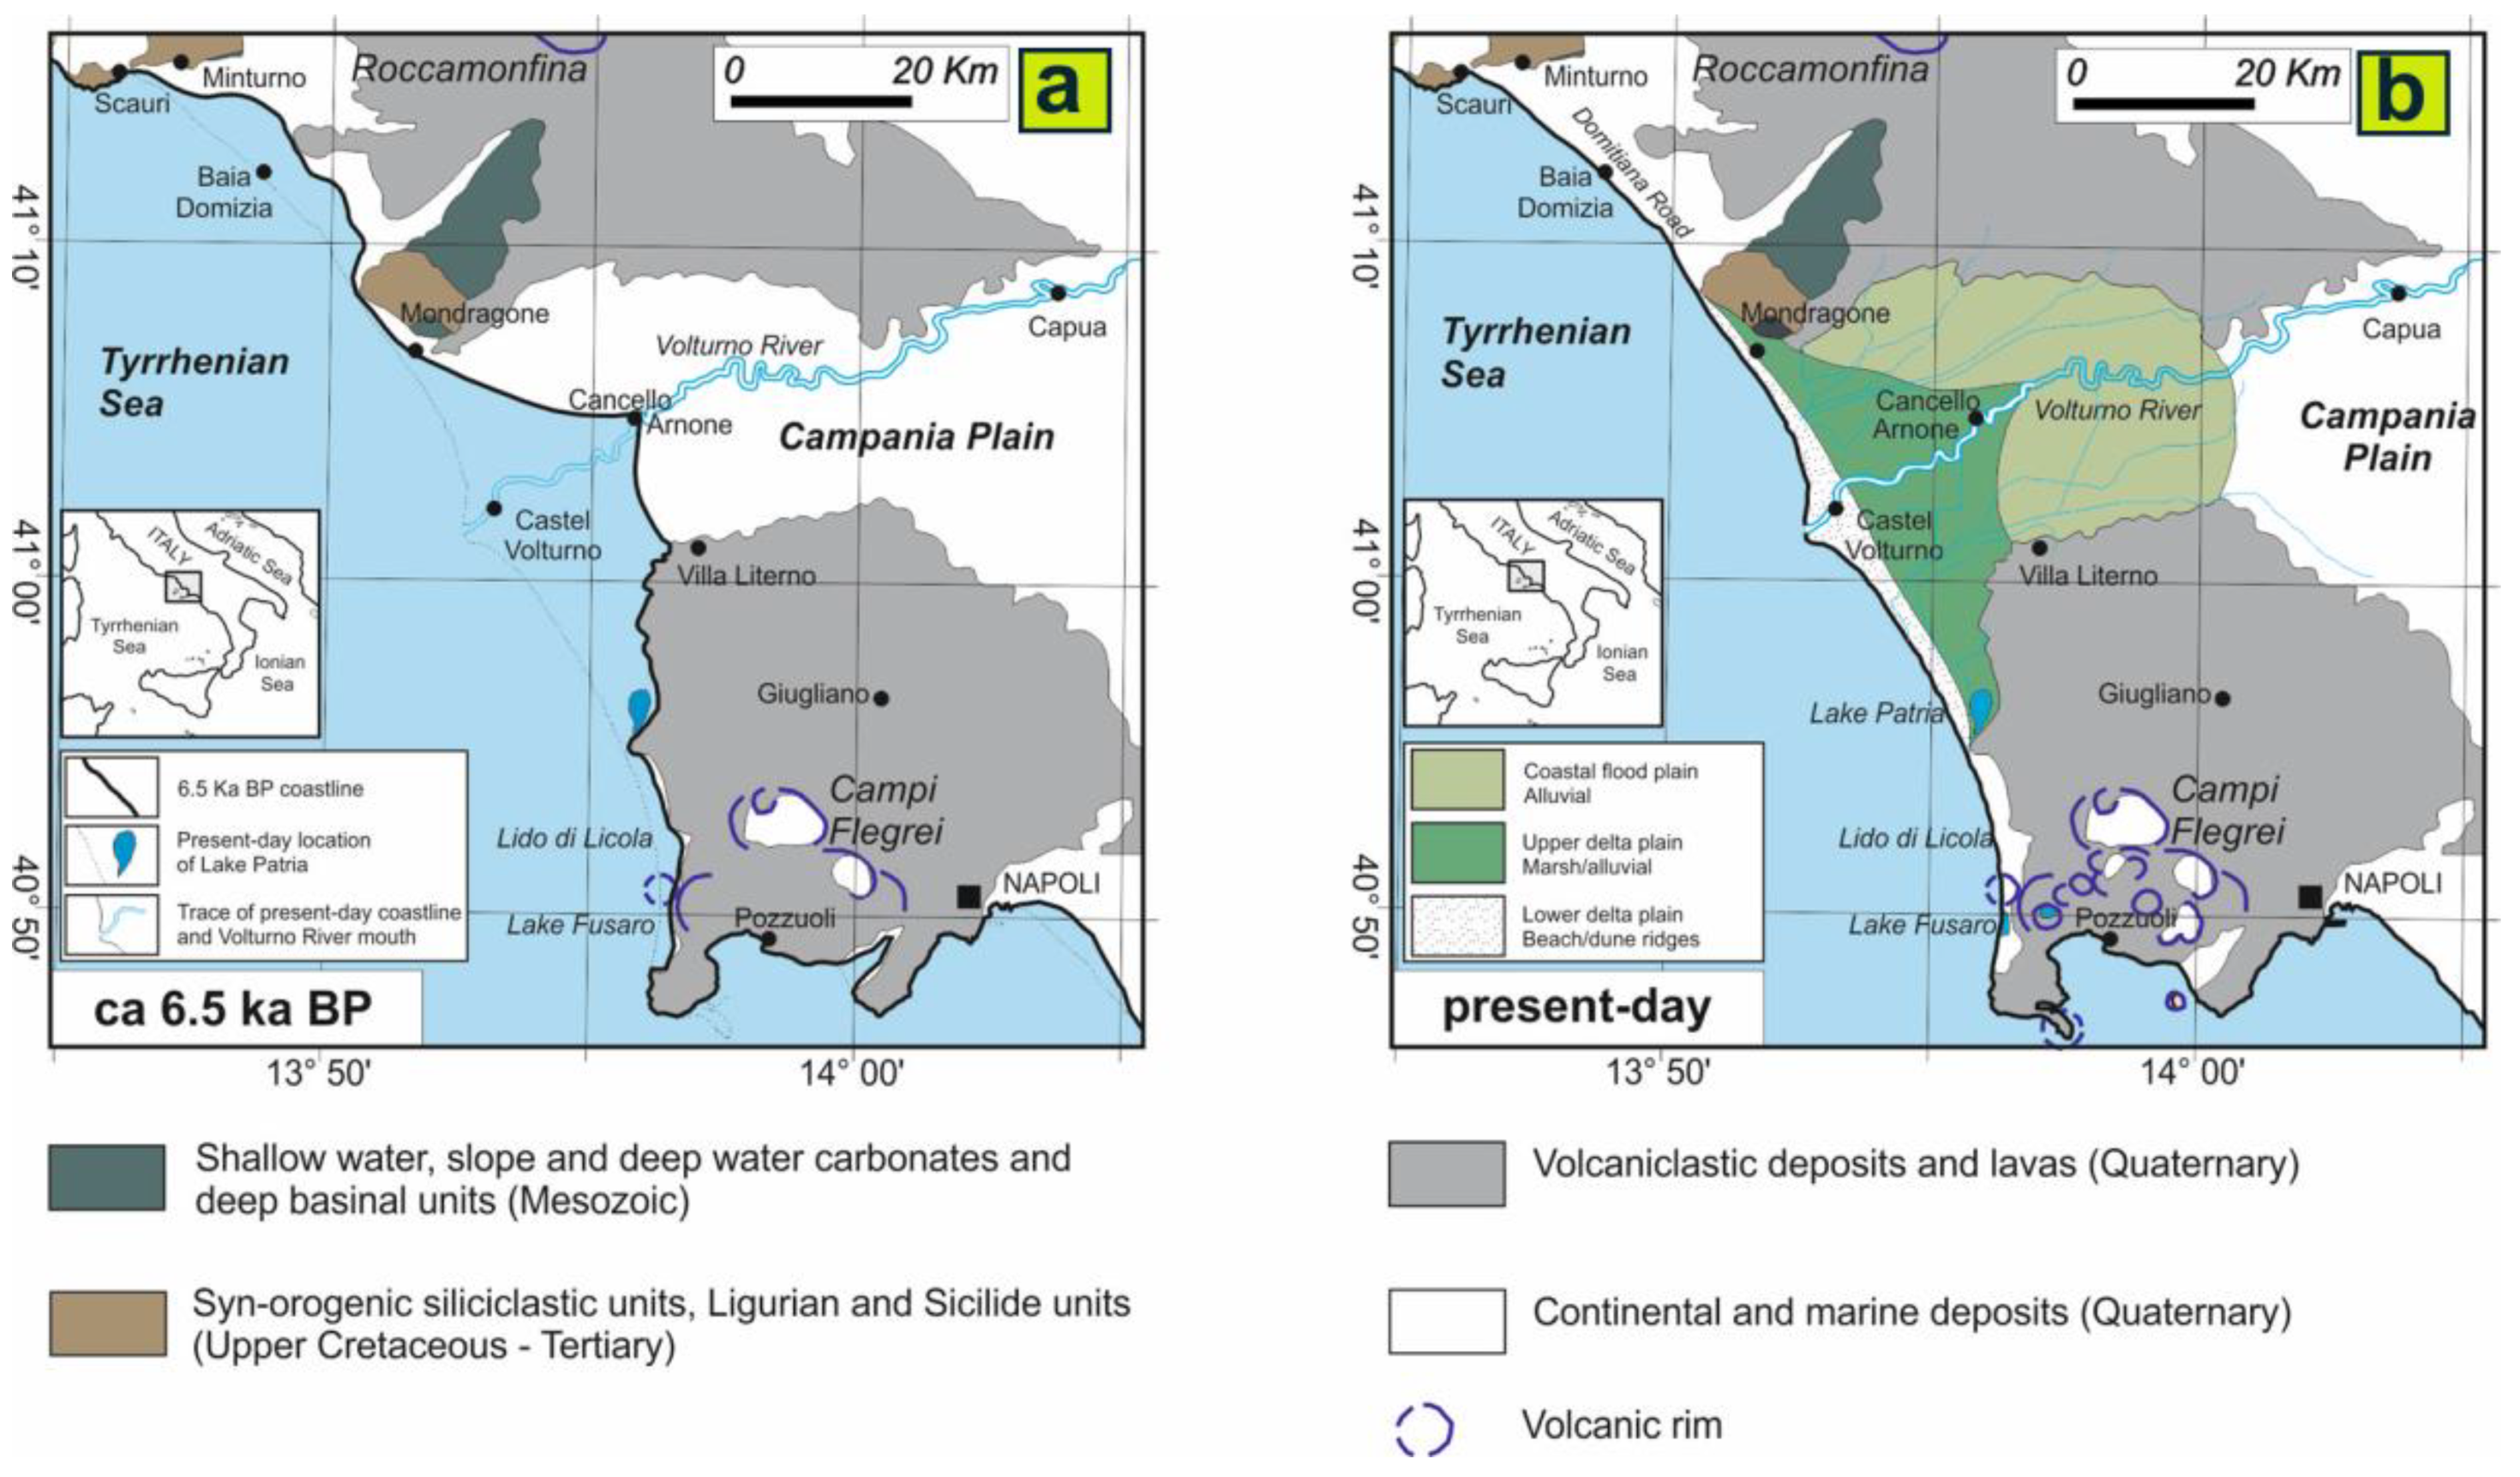
During the Pleistocene, the CP was characterized by the onset of a rapid tectonic subsidence and consequently it was filled with continental and marine deposits (alluvial, fluvial and lagoon deposits), interfingered with volcanic deposits related to the explosive eruptions of Somma-Vesuvius, Roccamonfina and Campi Flegrei districts [29]. Among the volcanic events that characterized the area, the 39 ka pyroclastic flow deposits vented by the Campi Flegrei (Campania Grey Tuff—CGT) blanketed the entire plain and represented the substrate for the Holocene sedimentation that followed [30]. These deposits were deeply eroded by the paleo-Volturno River in response to the Last Glacial Maximum sea-level drop [31,32]. During the Pleistocene–Early Holocene (ca. 6–15 ka) the post-glacial rising of sea level caused a broadening of the inner shelf with a rapid flooding of the lower part of the Volturno plain. Since 6.5 ky, a coastal pro-gradation phase, established at the termination of the transgressive phase, allowed the formation of a wave-dominated delta system with flanking strand plains forming beach–dune systems that partially enclose shallow lagoons and marshes (Figure 2). The present-day morphology is largely inherited by the Holocene sedimentary evolution. The Volturno River mouth is a low-lying area, with mean ground elevation above sea level (a.s.l.) of approximately −2.0 to 4.0 m and characterized by semipermanent water bodies (lagoons and wetlands). Here, the aquifer is hosted in sandy dune deposits interlayered with silt lens.
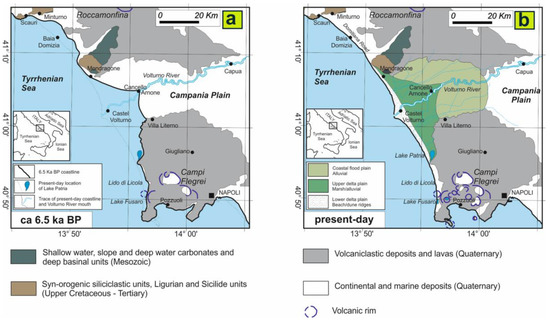
Figure 2.
Sketch map of the Late Holocene to present-day geomorphological evolution of the Volturno River delta plain: (a) approximate location of the coastline 6.5 ka BP, inferred from facies analysis based on Sacchi et al. [32]; (b) actual location of the coastline.
A pro-delta formation made of silty clay deposits is present starting from 16–20 m below ground level (b.g.l.); it represents the impermeable bed of the coastal aquifer [30] (Figure 3). High subsidence rates characterize the entire coastal environments (from −5 to −25 mm/year) with the most affected area corresponding to the ancient buried lagoon, which was filled by highly compactable peat and clay-rich sediments [9].
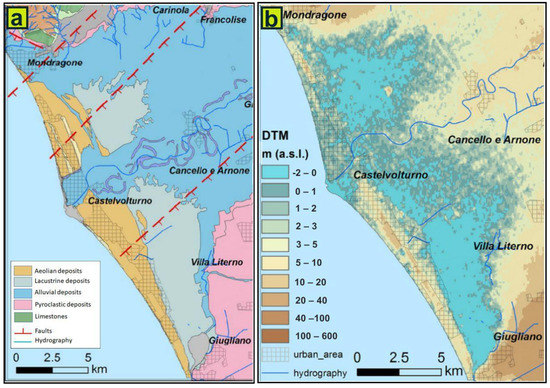
Figure 3.
Schematic geologic map of the Volturno River delta plain (a) and digital terrain model of the same area (b), slightly modified from Matano et al. [9].
The dynamics of the whole coastal system dramatically changed in the last century following reclamation interventions that completed the canalization of most secondary streams in the lower alluvial plain [33]. The availability of reclaimed lands along the coastal alluvial plain promoted the development of agriculture and farming, together with strong coastal urbanization. Therefore, landscape fragmentation increased significantly between the 1960s and the 1990s, as well as built-up land area that overgrew to the sea. An overall reduction of high-quality ecosystems (humid coastal setting, lacustrine/marshy back-dune area and beach–dune system) occurred, resulting in biodiversity loss and a dramatic reduction of environmental quality [34]. Moreover, sediment supply to the coast has been reduced, resulting in erosional processes that have led to the loss of hectares of beach [35].
The site selected for the present study corresponds to the area of maximum ingression during the Holocene transgression (Figure 1 and Figure 2), characterized by marine and transitional environments and currently resting largely below the sea level (Figure 3). The area has a typical Mediterranean climate with wet winters and dry summers, an average annual temperature of 21.0 °C and precipitation of 800–1000 mm/year [35].
3. Materials and Methods
3.1. GALDIT-SUSI
GALDIT-SUSI, proposed by Kazakis et al. [23], considers the six standard GALDIT parameters, such as the characteristics of the aquifer, the morphology and the vadose zone, together with the presence/absence of superficial water bodies (lagoon, torrents and river) to determine the SI vulnerability of coastal aquifers. The SUSI modification allows accounting for the saline water that can indirectly intrude into the aquifer flowing from surface water bodies towards groundwater. Moreover, the introduction of the elevation parameters also allows accounting for the effect of naturally depressed areas along with water bodies bathymetry.
The six additional parameters used to implement the GALDIT-SUSI method are (1) vadose zone hydraulic conductivity (K), (2) elevation, (3) torrents, (4) rivers, (5) wetlands and (6) lagoons (Table S1). The initial weights of the overall twelve parameters were defined using the analytic hierarchy process [36]. Table S1 shows the weight and class range for each parameter. The final SI vulnerability map of GALDIT-SUSI was produced using the following formula:
where the parameters are R and W their corresponding weights from Table S1. All twelve parameters were constructed and classified in a GIS environment retaining a cell resolution of 2 × 2 m. The existing status of SI was calculated in 44 groundwater and surface water samples using the Revelle index (RI) [37].
GALDIT-SUSI = Σ Wi*Ri/ΣWi
3.2. Data Collection and Analysis
To obtain the main geomorphological features characterizing the study area, extensive cartographic documentation (topographic maps, ortho images, aerial photographs) was acquired covering a period of about 200 years; the maps were acquired as raster files in tiff format, 300 and 1200 dpi and georeferenced through ground control points (GCPs) technique, using as a base map the georeferenced Topographic Regional Map (CTR) of the Campania Region (1:25.000) and GeoMedia® Pro 6.1 with ‘‘Image Registration’’ tool, which allowed for resampling the maps by bilinear interpolation. All new data were reprojected to UTM Zone 33 (WGS84). The accuracy of the maps (Table 1) could be affected by errors induced either by digitization and georeferencing, the latter being more common if the original map was realized in different coordinate systems. In this study, the root mean square error (RMSe) calculated for all the maps used to draw the land use/land cover (LULC) polygons is lower than the pixel resolution. Multitemporal data were topologically overlapped to facilitate spatial analysis (change, persistence and trend).

Table 1.
Input data used to obtain land use and land cover (LULC), hydrographic network (HN), coastline (C), subsidence trends (ST), and digital terrain model (DTM). The year of data acquisition, its resolution and root mean square error (RMSe) are also reported.
All the data for the GALDIT-SUSI application were collected from previous literature and online regional databases. The information to define the aquifer characteristics, such as (i) aquifer type, (ii) vadose zone materials, (iii) aquifer thickness and (iv) vadose zone/aquifer K values, were extracted from the interpretation of several geological boreholes collected from a local institutional database and literature [9,35]. Major ions in surface waters and groundwater samples were collected in a sampling campaign conducted in September 2016 on 44 monitoring stations (Figure 1) and analyzed using an isocratic dual pump ion chromatograph ICS-1000 Dionex.
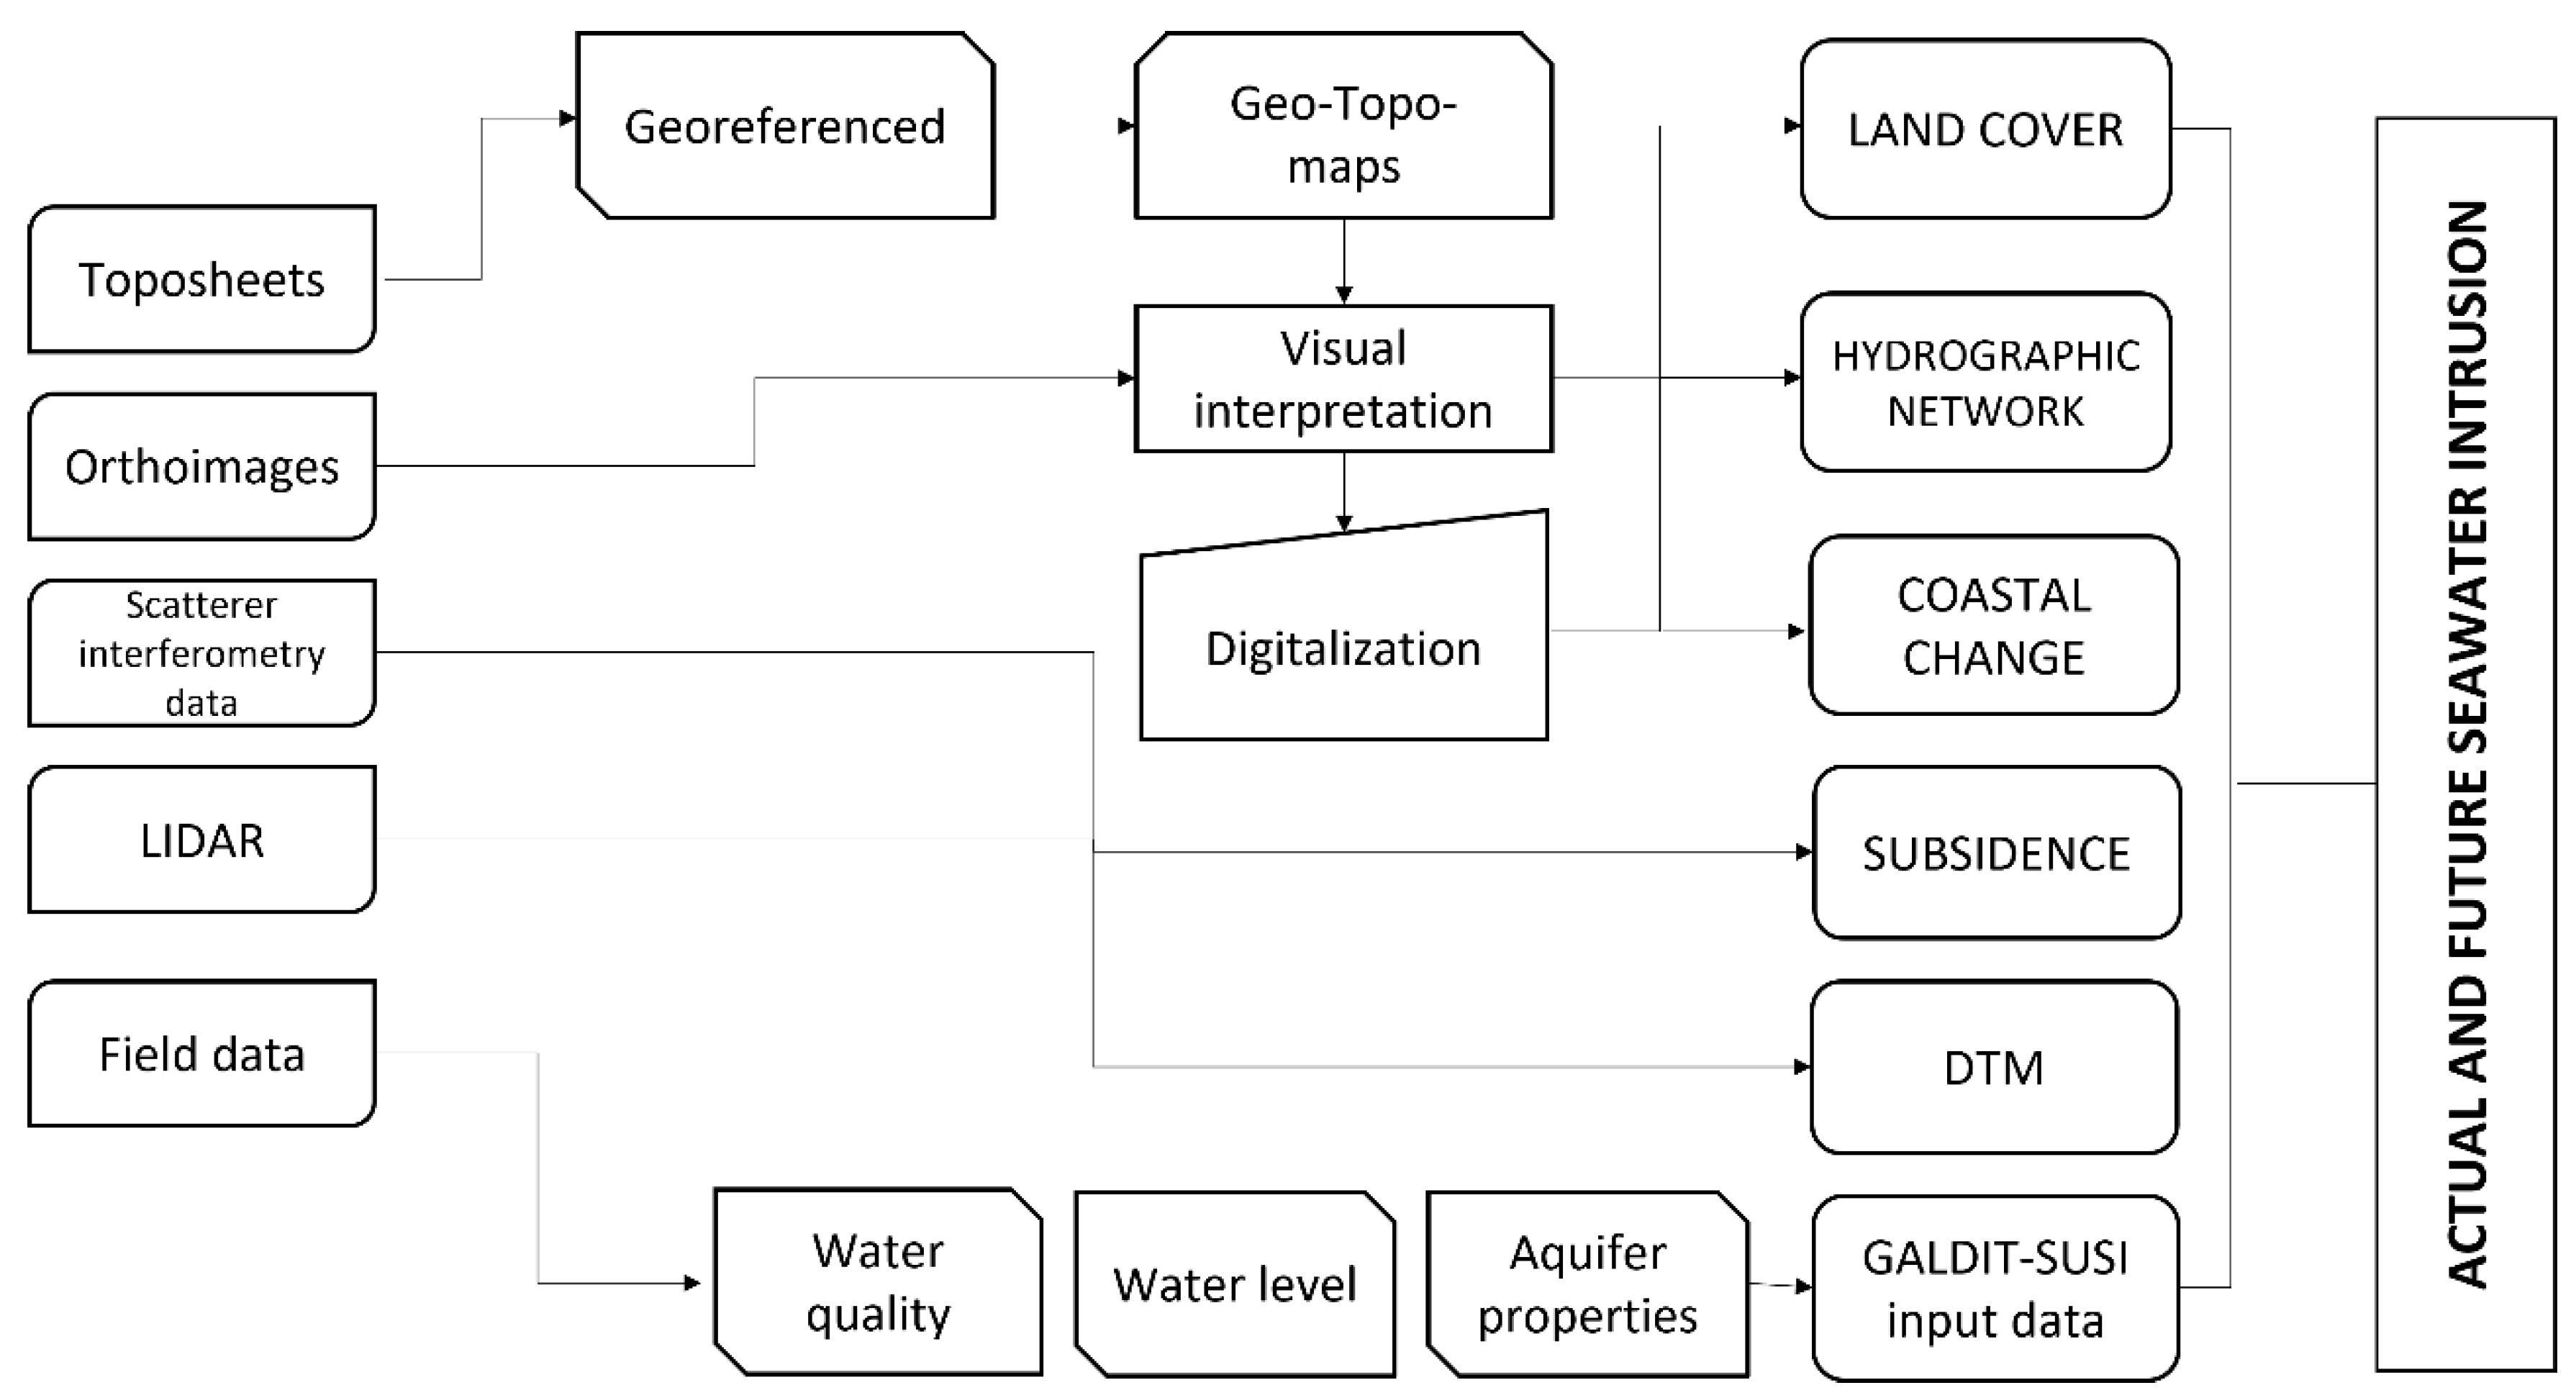
The main data processing and study workflow are shown in Figure 4.
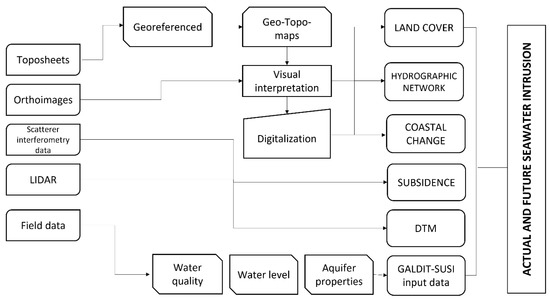
Figure 4.
Workflow for spatial data processing and SI vulnerability.
3.2.1. Land Use Map
The land use map was reconstructed for 2012. The land cover categories were identified by visual on-screen photointerpretation and then digitized and classified. All the activities were performed in GeoMedia®; the polygons were digitized in a vectorial format and classified with the aim of field surveys. The land use map CORINE Land Cover (CLC, 2012) was used to check and verify the results and obtain the land use maps. The related land use classes were combined or renamed, according to the CLC nomenclature, to produce the final outputs. They were classified into nine categories that could be easily recognized in each time period. To outline the drainage system evolution over time, the topographic maps from 1957 to 1987 were scanned and imported into the GIS environment; the maps were analyzed by manual on-screen interpretation and the main linear elements (i.e., rivers and canals) were digitized. No changes occurred after the beginning of the 1990s.
3.2.2. Coastline Changes
To document the processes and geomorphological changes that occurred in the study area, 150 years of cartographic sources were acquired in raster format with 300 and 1200 dpi resolution and georeferenced through the GCPs technique using as a base map the georeferenced CTR of the Campania Region (1:5000 scale, 2006). Approximately 100 GCPs were identified on each document in order to achieve the most reliable accuracy. These douments were managed in GIS using the software Intergraph Geomedia Pro 6.1 and georeferenced in the UTM Zone 33 (WGS84) coordinate system.
The uncertainties in mapping the shoreline position owing to short-term dynamic cyclic fluctuations [38] were considered, although the available records from which long-term shoreline changes were determined span over 100 years and thus considered reliable, whereas an accuracy of few meters is limited only to the most recent datasets [39]. The coastline position from 1957 to 2018 varied from a maximum of 90 m landward in the central part of the study area at the Volturno River mouth to a maximum of 65 m seaward in the northern part of the study area between the Savone and Agnena rivers. Assuming that the coastline changes in this area will occur at an almost steady trend and rate in the near future, as testified by several long-term monitoring studies in the area [33,39], the maximum expected shift for 2050 will be approximately 48 m landward and 35 m seaward.
3.2.3. DTM
The digital terrain model (DTM) was realized by merging the DTM FIRST with 2 × 2 m resolution for the coastal stretch (750 m wide) and 1 x 1 m resolution for the inland area; they were finally resampled at 2 × 2 m resolution for the whole area (Figure 3b). The data were acquired from LIDAR scanning available from the Ministry of Environment and Protection of the Sea and Territory (http://www.pcn.minambiente.it/mattm/accessed, accessed on 10 January 2020).
3.2.4. Subsidence and Geology
The assessment of the subsidence trends was based on a temporal analysis and mapping of persistent scatterers (PS) data, obtained from interferometric processing of ERS-1/2 (1992–2001), RADARSAT (2003–2007) and ENVISAT (2003–2010) radar satellite scenes of the study area using permanent scatterers (PS-InSAR) and persistent scatterers pairs (PSP) techniques [9]. The information concerning post-processing, analysis and mapping of the available PS interferometry datasets, derived from the combination of both ascending and descending orbits of three different radar satellite systems during an observation period of almost two decades (1992–2010), are available in Matano et al. [9].
According to the identified subsidence rate, the predicted elevation for 2050 was calculated by subtracting from the DTM the product between the subsidence for the time frame considered, 30 years (2020–2050), using the raster calculator.
To assess the relationship between lithology and subsidence, the stratigraphic architecture of the subsoil was reconstructed on the basis of 400 shallow borehole stratigraphic logs (mostly up to 20–30 m in depth) located along the lower Volturno plain, and on previous studies results [30,31,32,33,34].
Borehole stratigraphic data were interpreted and grouped into three main units:
- Pre-CGT—comprises all the lithofacies deposited before the Phlegraean volcanic eruption (39 Ky) and settled below the tuff unit.
- CGT—consists of the Campania Grey Tuff volcanic deposits.
- Post-CGT—comprises all the sediments deposited after the CGT eruption and that likely constituting Holocene sedimentation.
Among this last unit, the thickness of each lithology characterizing the alluvial/transitional deposits was also recorded to understand their impact in the subsidence processes. Top and bottom depths of each lithological unit surface (peat, clay, silt, sand and gravel) were stored in a relational database. The ratio between the thickness of peat, clay and silt (the most compressible materials) and the whole post-CGT thickness was then considered. Reference geological sections were realized to compare thicknesses and lithology of the post-CGT deposits and the subsidence rates. Cumulative subsidence profiles were drawn on each profile.
3.2.5. Future Groundwater Quality and Head Variations
The future status of groundwater quality was assessed on the basis of a linear increasing trend of the RI in the whole area, +0.011 per year, derived by analyzing the observed RI in area wells from 2002 to 2018. The trend obtained was also in accordance with the groundwater salinization trend highlighted by previous research in the same study area [27].
Similarly, groundwater head values for the next 30 years were evaluated according to the piezometric records from 2002 to 2018, available for five monitoring wells located inside the study area and showing no increasing or decreasing trends, and thus kept fixed at actual conditions for the future SI assessment.
4. Results and Discussion
4.1. Geochemical Background
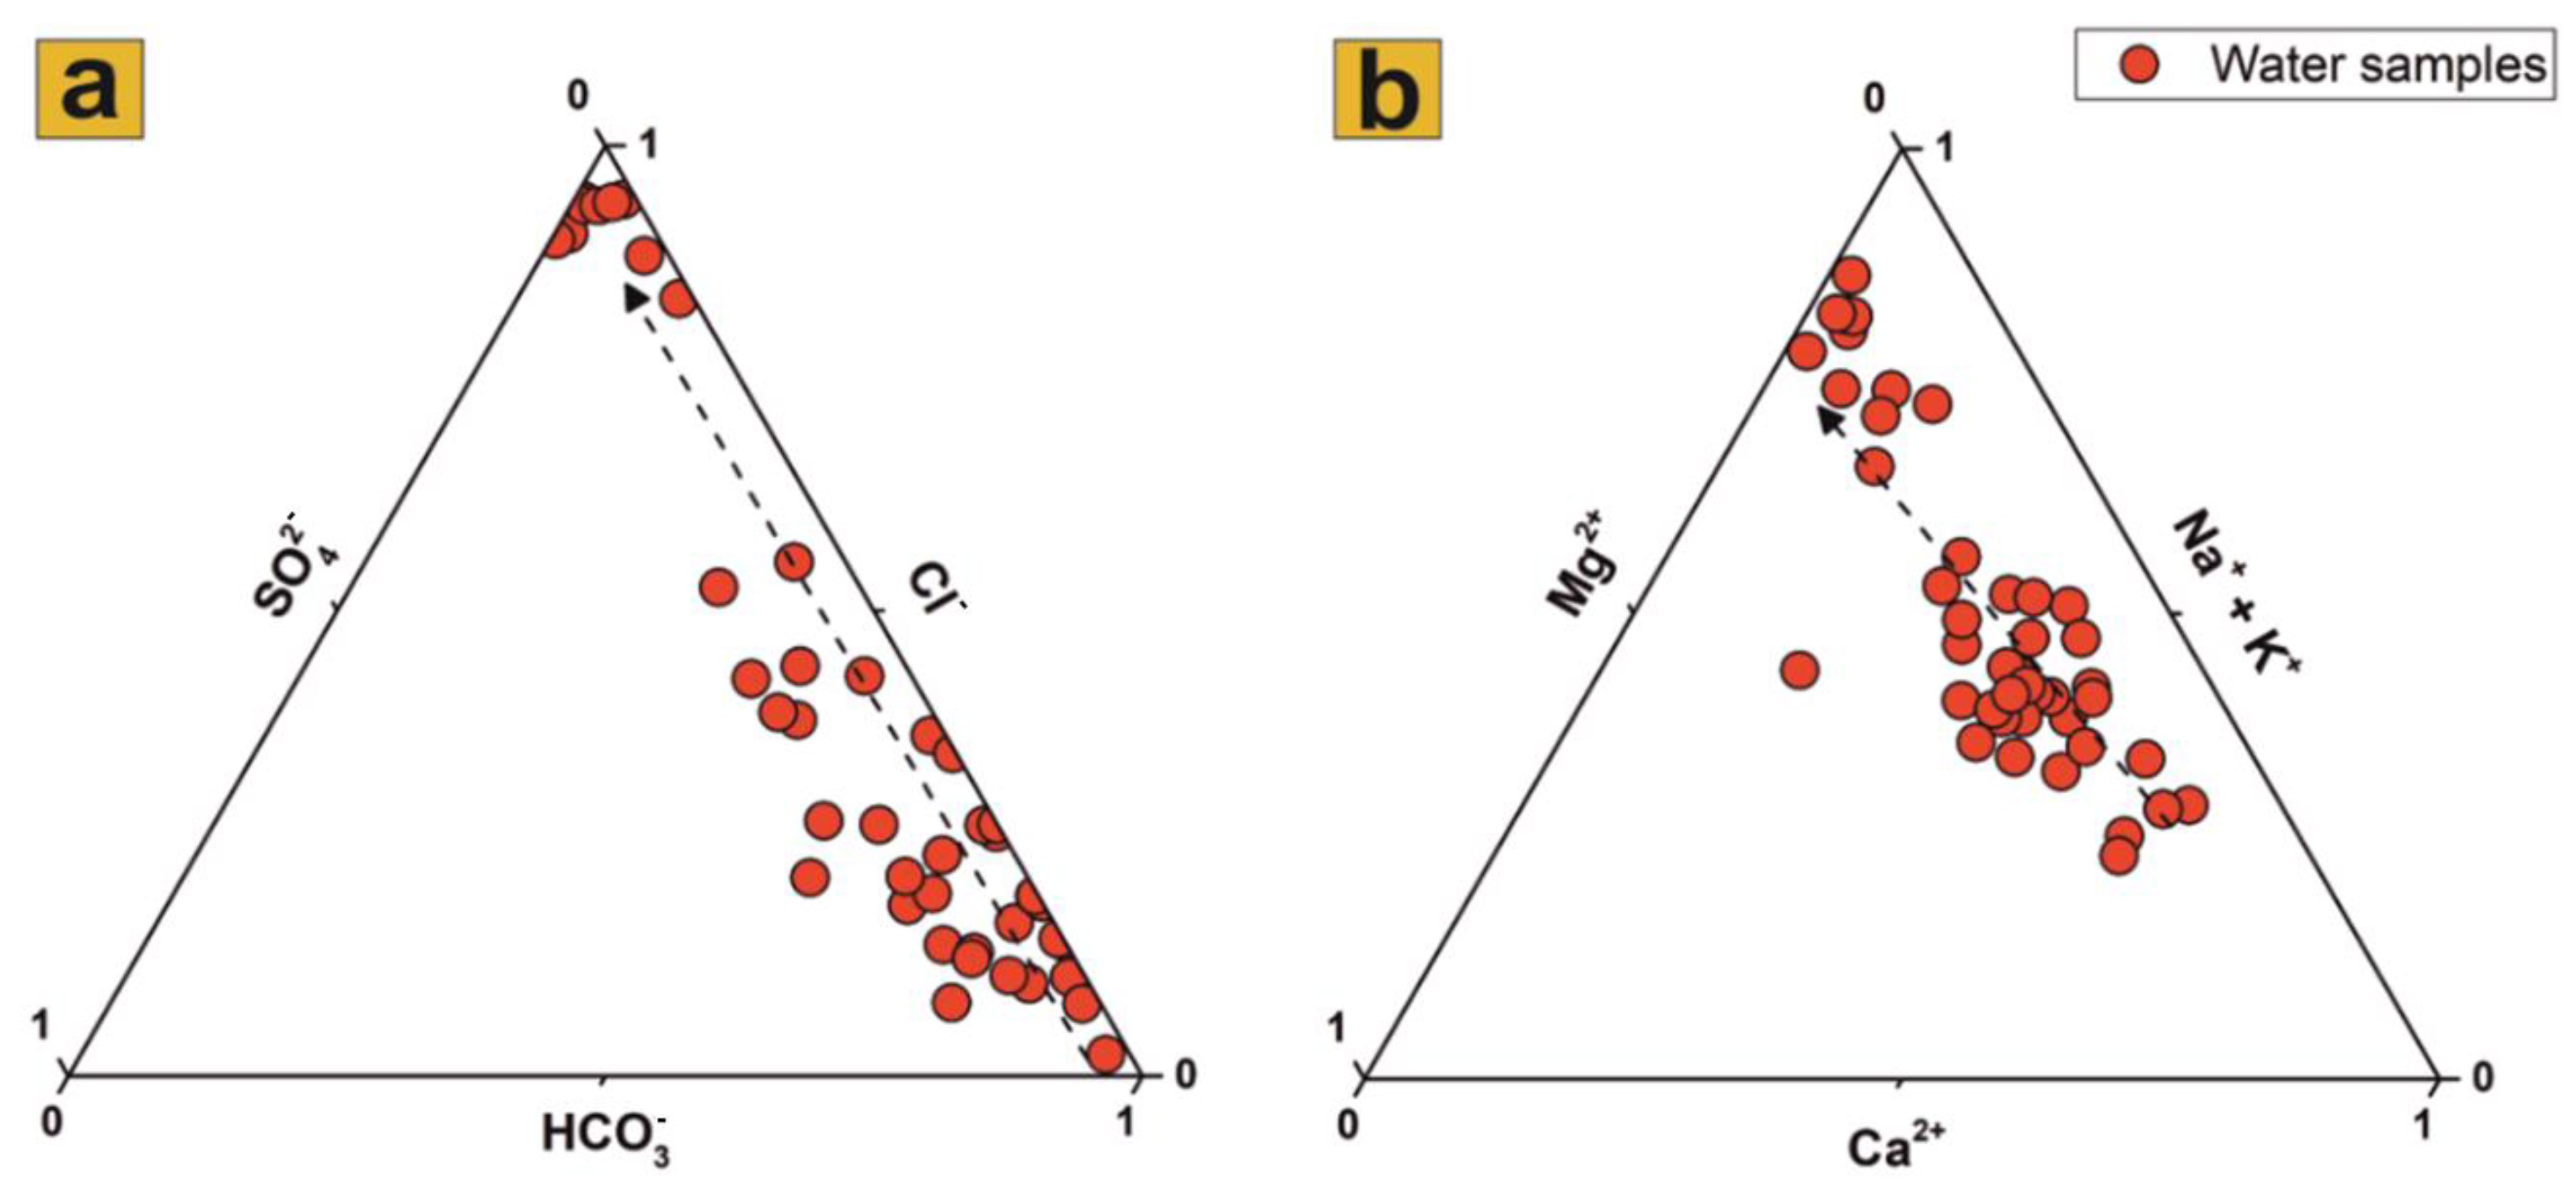
Descriptive statistics of all physicochemical parameters measured within the 44 water samples is presented in Table 2. Both surface water and groundwater samples inside the study area mainly belong to the carbonate–alkali and sodium chloride facies, showing a very high salinity content. The high correlation found between Cl−, Na+, Br− and SO42− (r > 0.9) further confirms the presence of salinization phenomena. The ternary diagrams representing the main anions (Figure 5a) and cations (Figure 5b) indicate that water mineralization is mainly shifted towards the predominance of Cl− in solution, followed by Na+, K+ and Mg2+, highlighting the dissolution of saline sediment and recent SI only near the coast [26]. Cl− concentrations in the area range from a minimum of 9 mg/L to as much as 19,400 mg/L for the Tyrrhenian Sea. Another characteristic of groundwater samples in the area is the elevated NO3− pollution. The average detected value of this pollutant is 33.5 mg/L, and in some samples it exceeds the WHO limit of 50 mg/L, reaching a maximum concentration six times higher than the threshold limit. The presence of NO3− pollution can be directly connected to the intensive agricultural activities that widely characterize the CZ of the entire CP [40].
Table 2.
General statistics of the sampled waters.

Figure 5.
The major anions (a) and cations (b) ternary plots highlight the increasing trend in Cl− concentration, followed by alkali ions and Mg2+ concentrations.
4.2. Land Use Changes
The comparison between pre-urbanization and actual land use maps shows that the landscape composition went through major changes from the beginning of 1900s, when land reclamation works resulted in the canalization of most secondary streams in the lower alluvial plain, and croplands and/or grassland covered most of the territory [35]. Since the second half of the XX century, massive urbanization of the coastal area replaced most of the former land cover types. Salt marshes, lagoons and wetland, beach–dune systems and a conspicuous fraction of agricultural land were nearly obliterated and converted into settlement areas in response to population growth and tourism expansion. Unfortunately, the land use change induced by the socioeconomic development exposed the residential areas to a high vulnerability in a few decades since the disappeared pristine environments acted as natural buffers to reduce wave action, storm surges, shoreline erosion and, ultimately, SI [41,42].
4.3. Geological Framework and Subsidence Rate
The analysis of the borehole data allowed reconstruction of the upper surface of the GCT in the whole CP, and to recognize paleovalley morphology in correspondence to the course of the modern Volturno River [9]. The vertical ground deformation assessed by Matano et al. [9] documented a continuous subsidence, mostly confined in the paleovalley perimeter (Figure S1). Inside this perimeter, the vertical ground movements could be considered stable with values within ±10 mm. Looking in detail at the study site, high subsidence rates (>15 mm/y) are distributed in the external sectors of the alluvial plain, and in the back-dune depressions, extending about 8 km2 (Figure 6a). The coastal sector near the Volturno River mouth, extending for about 10 km2, is characterized by moderate subsidence values (−5 to −7 mm/y), while the dune system sector shows very slight subsidence or stability. Considering the near future (2050) (Figure 6b), inside this perimeter, the vertical ground movements can be regarded as stable in most of the territory, with values within ±10 mm. In correspondence with the more subsided areas identified previously, a cumulated subsidence of –418 mm can be reached at the upstream stretch of the Volturno River course.
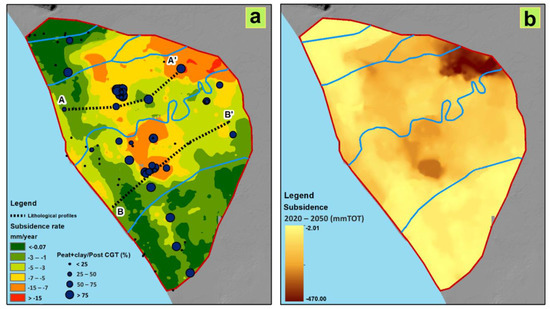
Figure 6.
(a) Actual subsidence rate (mm/year), classified from lower (green color) to higher (red color) rates, orientation of lithological profiles shown in Figure 7 (dotted lines) and borehole locations (blue dots) classified accordingly to the increasing ratio between Peat + clay/Post-Campania Grey Tuff (CGT). (b) Calculated total subsidence (mm) obtained by multiplying the subsidence rate shown in (a) for a 30-year period (2020–2050).
To identify the possible origin of the increase of the vertical displacement observed in the abovementioned sectors of the study area and to validate the described trends, the lithology of the post-CGT deposits was considered. In particular, the thickness of materials highly subject to secondary consolidation (i.e., clay, silt and peat) was compared to the subsidence values (Figure 5a). The map shows that zones with high values of subsidence (not corresponding to the absolute maximum values) correspond to a large thickness of peat and clay lithologies in the subsoil. From a geotechnical point of view, these soils can be classified as fine-grained soil characterized by high values of the secondary compression coefficient, which can contribute to soil deformation.
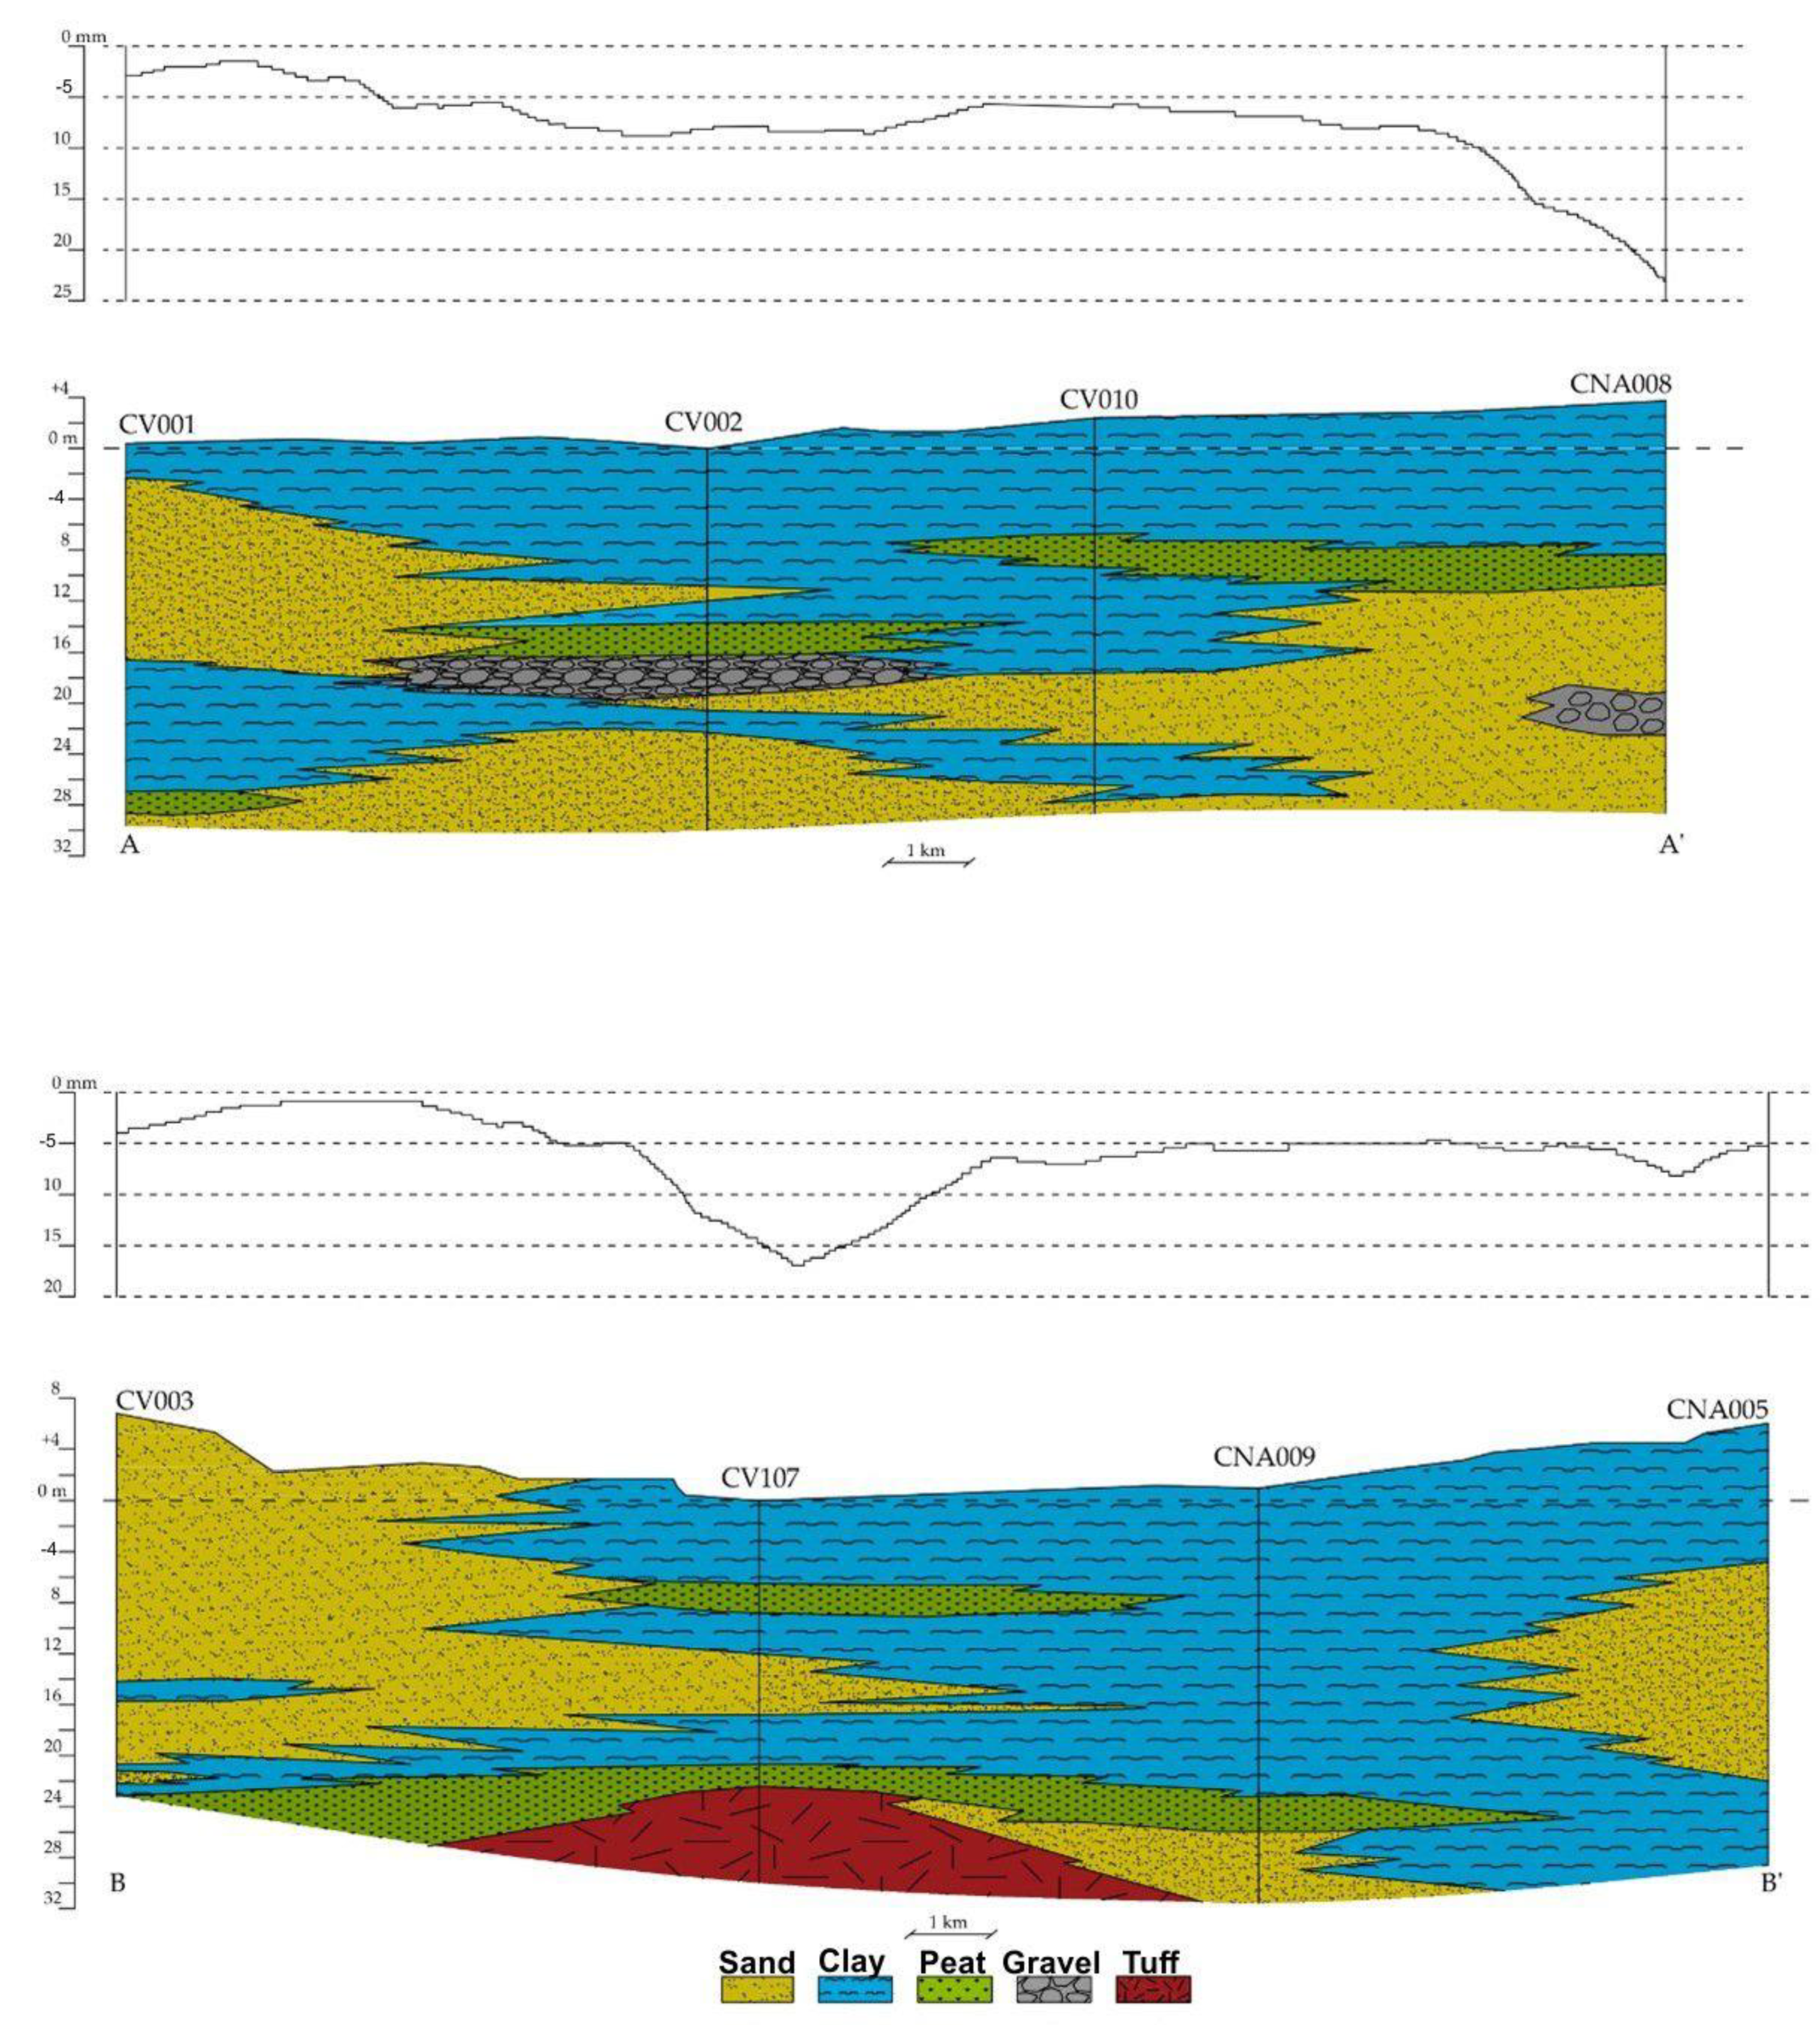
Two lithostratigraphic sea–land transects were constructed, focusing on the stratigraphic position of the compressible layers (clays and peat) in relation to the different average subsidence rates (Figure 7). They show anomalous increases in annual average subsidence in correspondence to large thicknesses of peat and clay. The inclusion of significant amounts of peat and organic matter clearly reflects high values of the secondary compression coefficient (creep), that is, the continuous soil deformation under constant effective stresses [43].
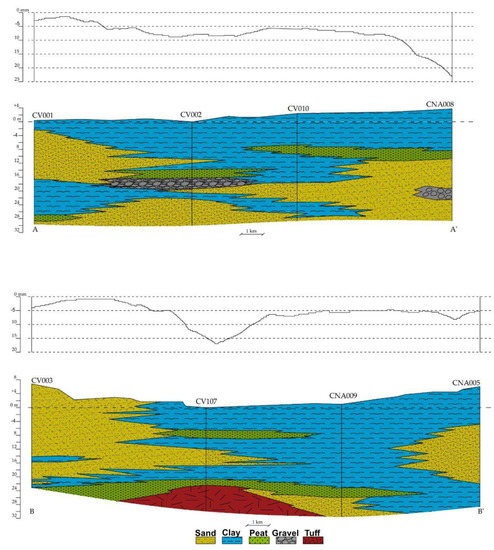
Figure 7.
Sea–land lithological profiles compared with the vertical velocity of displacement detected by SAR data (track locations shown in Figure 6). Note the higher values corresponding to the major thicknesses of peat and clay lithologies. The two profiles refer to the Figure 6a for orientation (A–A1’, B–B’)
4.4. Actual Seawater Intrusion Assessment
The GALDIT-SUSI was applied in the coastal plain of the Volturno River to assess the actual SI vulnerability. In accordance with the available hydrogeological information and the GALDIT-SUSI method (Figure S2), the local aquifer is classified as (i) unconfined within sand deposits with a bottom impermeable layer of pro-delta silty clay sediments along the coast, and so classified as highly vulnerable (rating 7), (ii) confined inside clay and silty clay deposits, which constitute the alluvial plain of the Volturno River and characterized by an average vulnerability (rating 5) and (iii) bounded in those areas adjoining the Volturno and Savone rivers, with a low vulnerability (rating 2). The K value of the sandy formations, which constitute the main aquifer body for the whole study area, in some places interbedded with silt lenses, varies between 15–30 m/day. Following Table S1, the main aquifer body is classified as highly vulnerable (rating 10). The water table ranges from −2.0 to +8.0 m a.s.l. and all the vulnerability classes are represented in the study area with bands subparallel to the coastline. The most vulnerable zone (rating 10) extends from the north coast to the central eastern part of the study area, while the less vulnerable area (rating 2.5) lies in the northern part of the study area; the remaining territory, more than 50% of the plain, is characterized by an average to high vulnerability to SI (rating 5 and 7.5) due to the low piezometric values, ranging from +1.0 to +3.0 m. a.s.l. The calculated RI ranges from 0.02 to over 200. Highly positive values (>2), corresponding to high and very high vulnerability to SI, characterize the whole coastal zone and some internal areas where paleoseawater trapped in Holocene sediments contributes to increased overall salinity. The remaining alluvial plain is instead characterized by a medium to low vulnerability (negative RI). The aquifer thickness is commonly utilized in many rating methodologies to express pollutant dilution [44]. Generally high values of aquifer thickness express a high dilution capacity, thus the vulnerability of the aquifer to SI is higher where the aquifer is thinner. In the study area, the aquifer thickness, calculated through the interpretation of available lithological boreholes and according to previous studies, is not greater than 30 m [27], which is sufficient to be considered highly vulnerable to SI (rating 10). In the GALDIT-SUSI methodology, additional parameters were included with the standard ones, such as vadose zone K and ground elevation. The elevation is classified using the previously created DTM. In detail, the morphology ranges from −0.05 m to +12.0 m a.s.l. All the areas close to the river mouth up to 6 km inland range from −0.05 to +2.0 a.s.l., while the elevation reaches its maximum in the remaining relict dunes and in the northeastern part of the study area. The depressed morphology, coincident with the ancient reclamation works of Lake Patria and Clanio River, is classified as high (rating 7.5) and very high (rating 10) vulnerability, while the remaining valley is characterized by medium (rating 5) to low (rating 2.5) vulnerability. Another important parameter introduced by the GALDIT-SUSI modification is vadose zone K, which plays a key role in determining the interactions between groundwater and surface water [45]. Where low values of vadose K occur, the interaction is limited and vice versa. In the coastal area, the vadose zone is mainly made of coarse-grained material with a K ranging between 5 and 10 m/d, thus corresponding to medium vulnerability (rating 5), while all the unsaturated materials far from the coastline are silt and silty clay deposits characterized by a low vulnerability (rating 2.5). Regarding the distance from lagoons, rivers, torrents, wetlands and shoreline, the SI vulnerability is considered higher in the areas that lie nearer water bodies or courses. All the distances were calculated using a buffer zone of 75, 150, 300 and greater than 300 m for lagoons, rivers and torrents, while a buffer of 500, 750, 1000 and greater than 1000 m was used for the shoreline. All the parameters previously discussed are represented in the maps of Figure S2.
The composite SI vulnerability map was constructed by using Equation (1) and the raster calculator tool in ArcGIS 10.2. The actual SI assessment map (Figure 8a) subdivides the area into five classes of vulnerability, classified using a geometrical interval, and ranging from very low to very high vulnerability to SI.
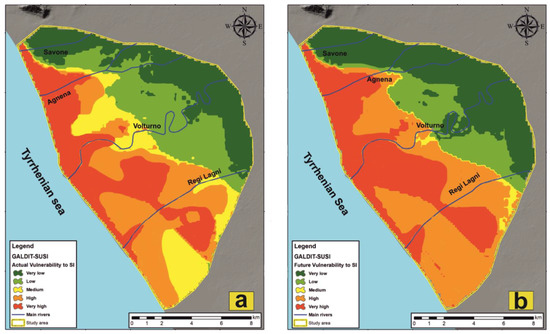
Figure 8.
Actual (a) and future (b) vulnerability to seawater intrusion (SI) calculated according to the GALDIT-SUSI methodology.
The highest vulnerability to SI spans the entire coastline, widening inland towards the north of the study area. Very high vulnerability also characterizes the terminal stretches of the Agnena, Volturno and Regi Lagni rivers, up to 4.0 km from the shoreline. In these zones, the rivers act as a preferential way for SI due to their riverbed elevation largely below ground level, especially close to the coastal zone [46]. The low elevation, together with the high salinity index (RI > 2), and the unconfined aquifer condition are responsible for the natural high vulnerability to salinization. In the southeastern portion of the study area, a wide area of very high vulnerability to SI also corresponds with depressed areas affected by a high rate of subsidence and recently involved in reclamation operations, where the presence of drainage canals contributes to worsen the situation. Moreover, note that this highly vulnerable zone coincides with the greatest thickness of peat and clay sediment (Figure 7) suggesting a controlling role of lithology towards the SI phenomena. In this portion of the study area, a wide part of the territory is classified as highly vulnerable.
The low and very low vulnerability areas are present only in the northern part of the study area, at least 5 km from the coastline, and are divided from the most vulnerable areas by a thin stripe where the vulnerability to SI is medium. The area located between the Regi Lagni River and Lago Patria, characterized by lacustrine sediments and where the subsidence rates are small, is also classified as medium vulnerable.
4.5. Future Seawater Intrusion Assessment
The future vulnerability to SI was assessed considering the future impact of subsidence, groundwater heads and salinization rate upon the whole study area. According to the previous elaboration, the subsidence rate in the area ranges from a minimum of 0.0 to a maximum of 20 mm/year. These rates could significantly impact the study area in 2050, especially within those areas slightly above the sea level (0.0–2.0 m), also increasing the erosional processes through the years if the trend remains constant. This assumption is confirmed from the study conducted by Aucelli et al. [47], who predicted the topographic model for the Volturno River plain using the actual subsidence rate. Considering this scenario and applying the predicted trends for 30 years into the future, a maximum of 0.45 m of subsidence (Figure 5b) will be registered in 2050, which will become almost 1.0 m in 2100. Together with subsidence, the increasing trend of salinization, which will affect the whole Campanian coastal zone [27], will surely influence the future vulnerability to SI. The predicted RI and elevation are represented in Figure S3. Concerning the future groundwater heads, despite slight piezometric changes, which will affect only the shoreline strip [8], the SUSI classification (Table S1) for the whole area will not show significant changes in the parameter classification. Thus, the same map was used for the future evaluation of SI. A similar result was obtained for the coastline changes.
The final step was the assessment of SI for 2050 using GALDIT-SUSI retaining the same weight and rate used for the actual SI evaluation. The composite vulnerability map was so calculated using Equation (1) and represented in Figure 8b. The future SI vulnerability map divided the entire valley in five classes of vulnerability: very high, high, medium, low and very low.
From a first glance at the map, it is already clear that the very high and high vulnerability classes will characterize a wider area at the expense of the medium vulnerability. Specifically, the very high vulnerability areas that line the Agnena, Volturno and Regi Lagni rivers further expand laterally, while the areas of high vulnerability expand to the detriment of the areas of medium vulnerability, the latter having almost completely disappeared in the map of future vulnerability to SI. The low and very low vulnerability will remain confined in those areas characterized by groundwater levels markedly above sea level and higher topographical elevations.
The changes recorded in the distribution of the vulnerability to SI, and in particular its exacerbation, are mainly attributable to the increase in RI, which in 2050 will be up to three time stronger than 2018 [27] and, even if to a lesser extent, to the impact of subsidence. On the other hand, the decrease in recharge [48,49,50] with the relative lowering of the water table and coastal erosion will only marginally affect the enlargement of highly vulnerable areas. The predominant role of RI ultimately derives from the expected sea-level rise, which will push highly saline sea waters farther into the coastal aquifers, but also along the terminal stretches of the rivers that in turn will let the saline water percolate downward to the unconfined aquifers. This effect, specifically addressed by the GALDIT-SUSI methodology, will be proportional to the increased difference in hydraulic head between the sea and the continental waters (both superficial and underground). On the other hand, coastal erosion, the increased frequency of anomalous waves and storm surges, despite being highly destructive phenomena on a local scale, will not lead to an evident worsening of the vulnerability to SI as they are limited to a thin coastal stripe already classified as highly vulnerable currently, while their negative effects cannot spread much inland.
4.6. Actual and Future Seawater Intrusion Comparison
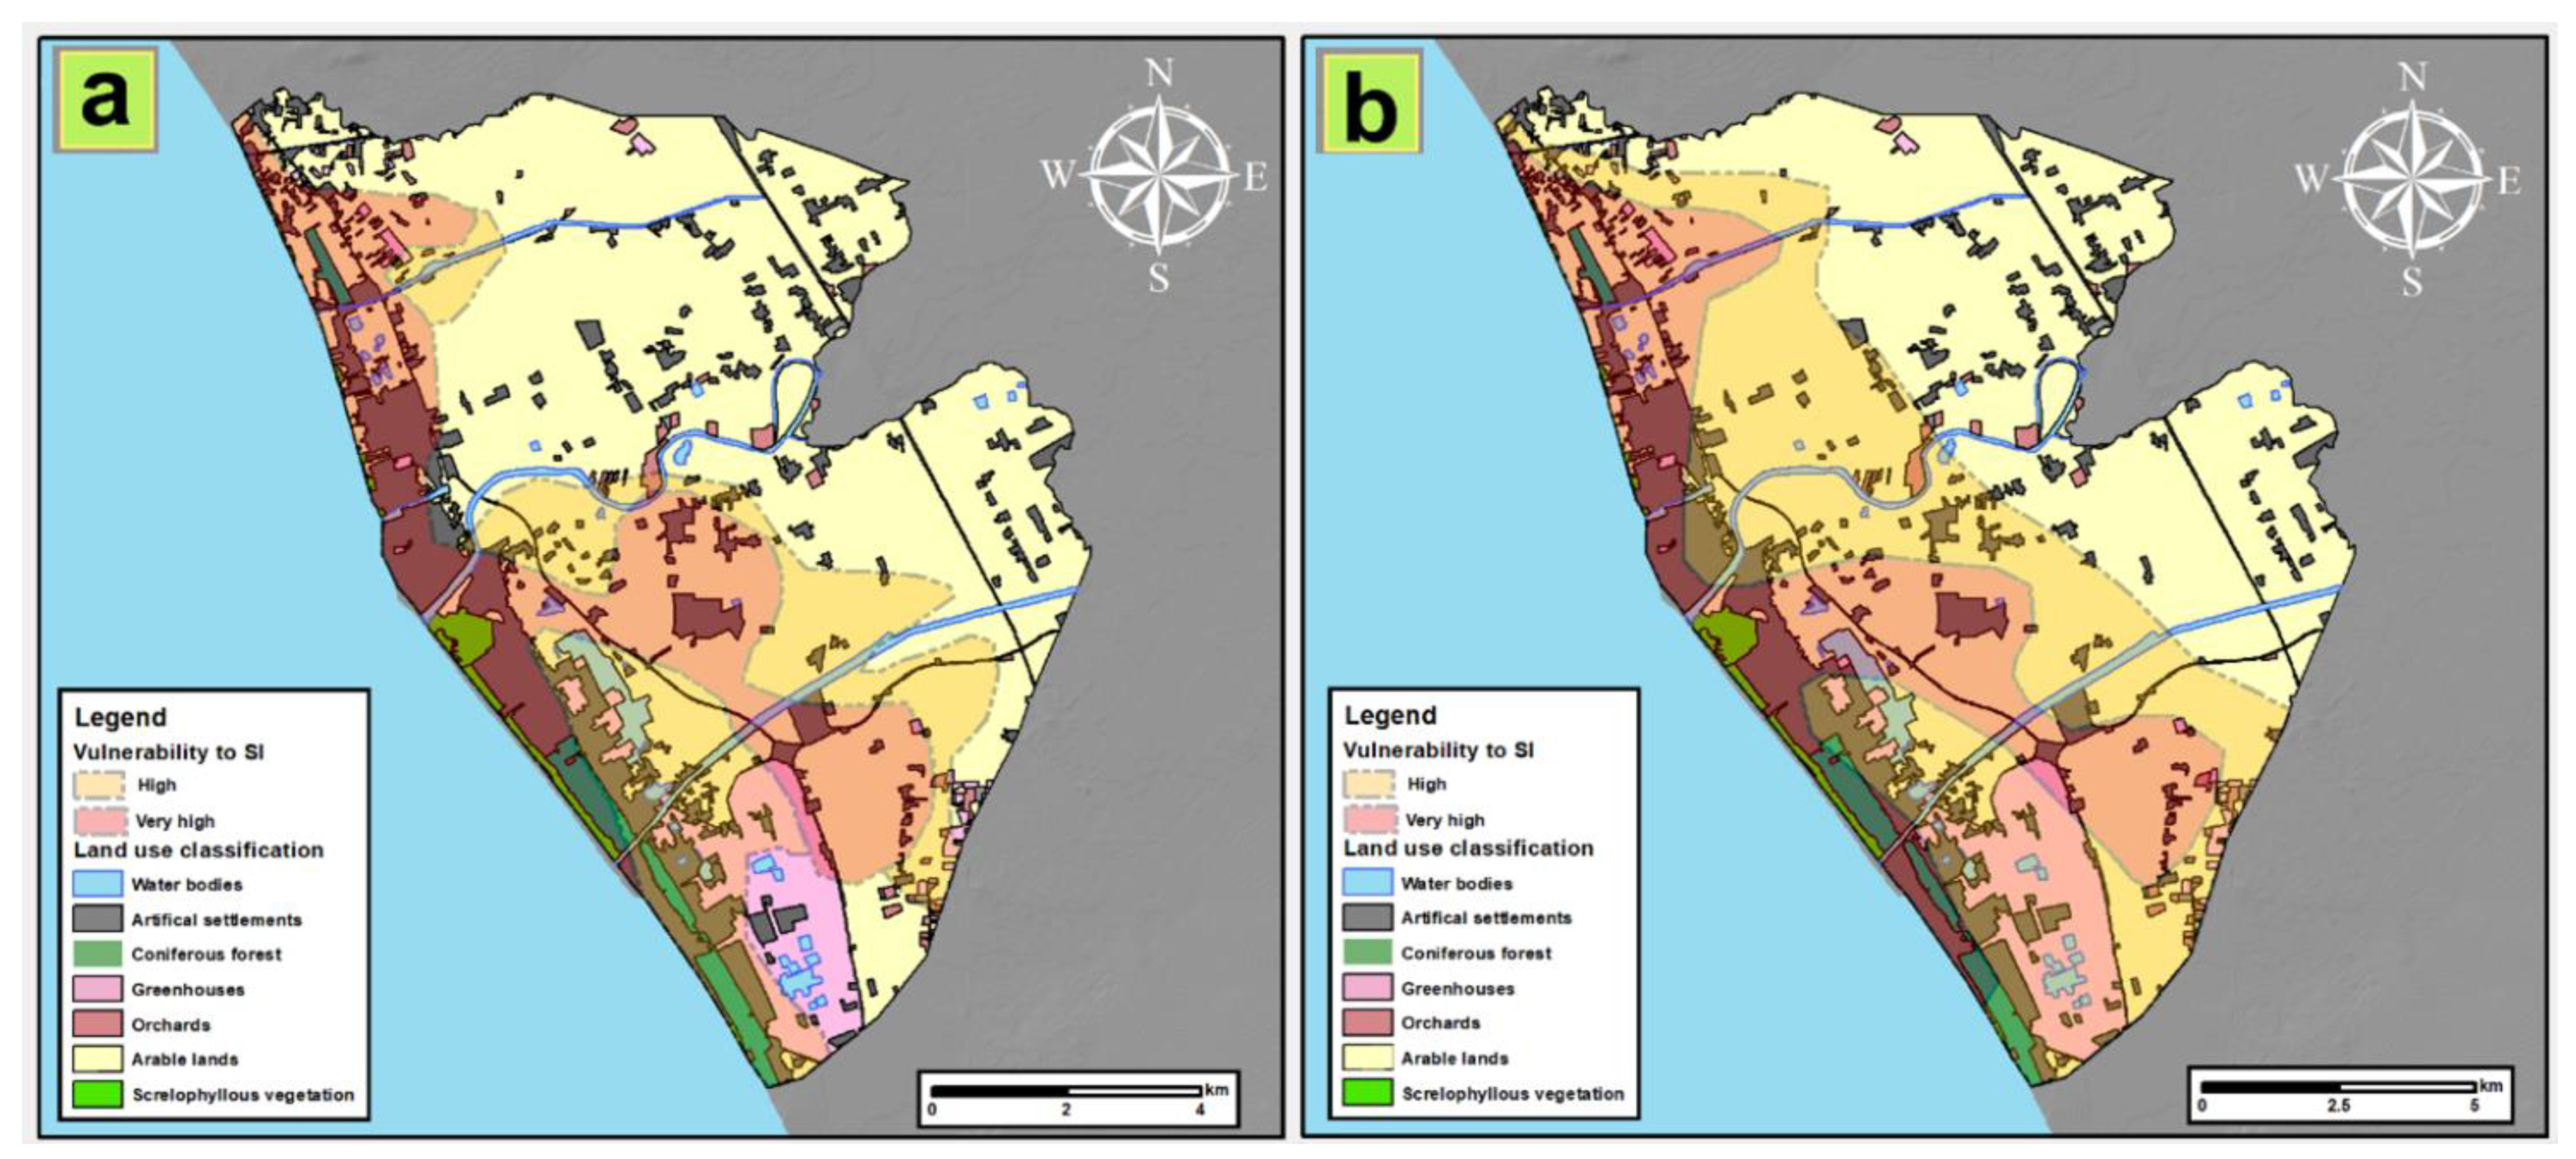
Figure 9 shows a comparison between the distribution of the high and very high SI vulnerability with the study area’s land use. The actual distribution of the vulnerability to SI (Figure 9a) affects several typologies of land use, such as urban area, forest, greenhouses and a large portion of arable land, for a total extension of 6000 ha. The situation worsens considering the 2050 scenario (Figure 9b), where the extension of SI could increase, influencing a larger portion of arable land. In detail, approximately 4000 ha more could face salinization issues compared to 2020; in fact, in 2050 the total extension of arable land with high and very high vulnerability will be 10,260 ha. Whereas more than 70% of these territories are currently utilized for agricultural production, the predicted scenario for 2050 could lead to a reduction in suitable land for agriculture [50] due to soil salinization. Here, the shallow depth to the water table together with the depressed morphology, which will enhance water salinization, could directly influence the quality of water taken up by roots, thus limiting plant growth [51].
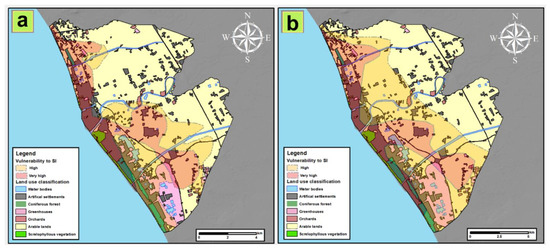
Figure 9.
Comparison of actual (a) and future (b) seawater intrusion (SI) vulnerability with land use classification.
This study highlights how the use of GIS and remote sensing resources can allow for (i) optimizing the input data resolution, (ii) producing new inputs for future assessment and (iii) increasing the overall result’s quality. Nevertheless, it is worth clarifying that this rating methodology cannot overcome the reliability of a process-based numerical model [52,53]. In fact, the rating methods can only generate static snapshots of vulnerability, according to data availability, without highlighting the evolution and trend of the phenomenon over the time. Despite this drawback, the proposed assessment demonstrates how the exploitation of a multidisciplinary approach integrating geological, hydrogeological, geochemical and morphological analysis can return highly reliable results and provide a forecast of the future evolution of SI. The use of high-resolution data contributes to increase the overall assessment reliability, with an accuracy of 7 × 7 m and an error of 5.2 m, calculated by summing the lowest resolution and highest error of the input data (Table 1) with the accuracy of georeferenced points used to create the raster maps.
Furthermore, it must be stressed that GALDIT-SUSI has already been proved to be a reliable assessment tool for different of hydrogeological settings [23]; the future seawater intrusion assessment scenario needs subsidence and groundwater quality trend data that are not always available, thus limiting the applicability of this method to highly characterized coastal aquifers. A future hybridization of this method with numerical models could allow for consideration of a wider number of scenarios and performance of sensitivity analyses on important forcing conditions [54], such as (i) climate change, (ii) increasing groundwater overexploitation, (iii) sea-level rise and (iv) severe drought conditions. Finally, a holistic assessment could also be generated accounting for soil salinization risk, which represents an important issue for agricultural areas [55]. Thus, the methodology applied represents an easy and reliable tool for screening vulnerability to SI, especially for studies at the watershed rather than plot scale, for which necessary data for a numerical model application are often missing.
5. Conclusions
In this study, the GALDIT-SUSI methodology is combined with remote sensing techniques and applied to a low-lying coastal area of the Volturno River mouth in Campania (Italy) to investigate the vulnerability to water resource salinization. In the study area, different subsidence rates are predicted for 2050, along with a significant increase of the Revelle index. The GALDIT-SUSI mapping showed a higher vulnerability of coastal and inland depressed areas, which will widen appreciably in 2050. Furthermore, the study highlighted the controlling role of lithology both on subsidence and groundwater salinization. The large-scale vertical displacements are linked to the land use. At a closer scale, however, they appear largely controlled by the sediment nature, which determines the compaction rate. The 2050 map shows a worrying scenario depicting the possible degradation of approximately 4000 ha of agricultural land due to salinization. The study demonstrates the suitability of the proposed integration of the GALDIT-SUSI method with remote sensing resources as a screening tool for the assessment of the vulnerability to salinization in coastal areas, emphasizing how classical hydrological studies may be drastically improved by the employment of radar satellite scenes and land use classification from remote sensing for land and water resources management.
Supplementary Materials
The following are available online at https://www.mdpi.com/article/10.3390/rs13183632/s1, Table S1: Parameters included in the GALDIT-SUSI method, Figure S1: Subsidence rate during 1992–2010, Figure S2: Thematic maps of GALDIT-SUSI parameters applied in the study area.
Author Contributions
Conceptualization, G.B. and M.M.; methodology, G.B., M.M.N., C.B. and M.V.; software, G.B., N.C. and M.V.; formal analysis, G.B., M.M. and D.R.; investigation, M.M., N.C. and D.R.; data curation, G.B., C.B. and M.M.N.; writing—original draft preparation, G.B.; writing—review and editing, M.M., N.C. and D.R.; supervision, M.M. and D.R. All authors have read and agreed to the published version of the manuscript.
Funding
The scholarship and research activities of Maria Margarita Ntona were part of the Environment, Design and Innovation Ph.D. Program funded by the V:ALERE 2020 Program (VAnviteLli pEr la RicErca) of the University of Campania “Luigi Vanvitelli”.
Institutional Review Board Statement
Not applicable
Informed Consent Statement
Not applicable
Data Availability Statement
Data available on request due to restrictions eg privacy or ethical. The data presented in this study are available on request from the corresponding author
Conflicts of Interest
The authors declare no conflict of interest.
References
- Anthony, E.J.; Marriner, N.; Morhange, C. Human influence and the changing geomorphology of Mediterranean deltas and coasts over the last 6000 years: From progradation to destruction phase? Earth-Sci. Rev. 2014, 139, 336–361. [Google Scholar] [CrossRef]
- Schuerch, M.; Spencer, T.; Temmerman, S.; Kirwan, M.L.; Wolff, C.; Lincke, D.; McOwen, C.J.; Pickering, M.D.; Reef, R.; Vafeidis, A.T.; et al. Future response of global coastal wetlands to sea-level rise. Nature 2018, 561, 231–234. [Google Scholar] [CrossRef]
- Suzuki, K.; Matsuo, K.; Yamazaki, D.; Ichii, K.; Iijima, Y.; Papa, F.; Yanagi, Y.; Hiyama, T. Hydrological variability and changes in the arctic circumpolar tundra and the three largest pan-arctic river basins from 2002 to 2016. Remote Sens. 2018, 10, 402. [Google Scholar] [CrossRef] [Green Version]
- Tamura, H.; Kawaguchi, K.; Iwamoto, T.; Fujiki, T. Coastal destruction and unusual wave spectra induced by typhoon Faxai in 2019. Coast. Eng. J. 2021, 63, 92–105. [Google Scholar] [CrossRef]
- Wong, P.P.; Losada, I.J.; Gattuso, J.-P.; Hinkel, J.; Khattabi, A.; McInnes, K.L.; Saito, Y.; Sallenger, A. Coastal systems and low-lying areas. In Climate Change 2014: Impacts, Adaptation, and Vulnerability. Part A: Global and Sectoral Aspects; Field, C.B., Barros, V.R., Dokken, D.J., Mach, K.J., Mastrandrea, M.D., Bilir, T.E., Chatterjee, M., Ebi, K.L., Estrada, Y.O., Genova, R.C., et al., Eds.; Cambridge University Press: Cambridge, UK, 2014; pp. 361–409. [Google Scholar]
- Tan, W.J.; Yang, C.F.; Château, P.A.; Lee, M.T.; Chang, Y.C. Integrated coastal-zone management for sustainable tourism using a decision support system based on system dynamics: A case study of Cijin, Kaohsiung, Taiwan. Ocean Coast. Manag. 2018, 153, 131–139. [Google Scholar] [CrossRef]
- Mastrocicco, M.; Colombani, N. The issue of groundwater salinization in coastal areas of the Mediterranean region: A review. Water 2021, 13, 90. [Google Scholar] [CrossRef]
- Mastrocicco, M.; Busico, G.; Colombani, N.; Vigliotti, M.; Ruberti, D. Modelling actual and future seawater intrusion in the Variconi coastal wetland (Italy) due to climate and landscape Changes. Water 2019, 11, 1502. [Google Scholar] [CrossRef] [Green Version]
- Matano, F.; Sacchi, M.; Vigliotti, M.; Ruberti, D. Subsidence trends of Volturno River coastal plain (Northern Campania, Southern Italy) inferred by SAR interferometry data. Geosciences 2018, 8, 8. [Google Scholar] [CrossRef] [Green Version]
- De Sanjosé Blasco, J.J.; Serrano-Cañadas, E.; Sánchez-Fernández, M.; Gómez-Lende, M.; Redweik, P. Application of multiple geomatic techniques for coastline retreat analysis: The case of Gerra Beach (Cantabrian Coast, Spain). Remote Sens. 2020, 12, 3669. [Google Scholar] [CrossRef]
- Herrera-García, G.; Ezquerro, P.; Tomás, R.; Béjar-Pizarro, M.; López-Vinielles, J.; Rossi, M.; Rosa, M.; Mateos, R.M.; Carreón-Freyre, D.; Lambert, J.; et al. Mapping the global threat of land subsidence. Science 2021, 371, 34–36. [Google Scholar] [CrossRef]
- Du, Y.; Feng, G.; Liu, L.; Fu, H.; Peng, X.; Wen, D. Understanding land subsidence along the coastal areas of Guangdong, China, by analyzing multi-track MTInSAR data. Remote Sens. 2020, 12, 299. [Google Scholar] [CrossRef] [Green Version]
- Vitagliano, E.; Riccardi, U.; Piegari, E.; Boy, J.; Di Maio, R. Multi-component and multi-source approach for studying land subsidence in deltas. Remote Sens. 2020, 12, 1465. [Google Scholar] [CrossRef]
- Barzegar, R.; Moghaddam, A.A.; Deo, R.; Fijani, E.; Tziritis, E. Mapping groundwater contamination risk of multiple aquifers using multi-model ensemble of machine learning algorithms. Sci. Total Environ. 2018, 621, 697–712. [Google Scholar] [CrossRef] [PubMed]
- Machiwal, D.; Cloutier, V.; Güler, C.; Kazakis, N. A review of GIS-integrated statistical techniques for groundwater quality evaluation and protection. Environ. Earth. Sci. 2018, 77, 681. [Google Scholar] [CrossRef]
- Chachadi, A.G.; Lobo-Ferreira, J.P. Assessing aquifer vulnerability to seawater intrusion using GALDIT method: Part 2, GALDIT indicators description. In Proceedings of the 4th Interceltic Colloquium on Hydrology and Management of Water Resources, Guimaraes, Portugal, 11–14 July 2005; Volume 310, pp. 172–180. [Google Scholar]
- Parizi, E.; Hosseini, S.M.; Ataie-Ashtiani, B.; Simmons, C.T. Vulnerability mapping of coastal aquifers to seawater intrusion: Review, development and application. J. Hydrol. 2019, 570, 555–573. [Google Scholar] [CrossRef]
- Luoma, S.; Okkonen, J.; Korkka-Niemi, K. Comparison of the AVI, modified SINTACS and GALDIT vulnerability methods under future climate-change scenarios for a shallow low-lying coastal aquifer in southern Finland. Hydrogeol. J. 2017, 25, 203–222. [Google Scholar] [CrossRef] [Green Version]
- Trabelsi, N.; Triki, I.; Hentati, I.; Zairi, M. Aquifer vulnerability and seawater intrusion risk using GALDIT, GQISWI and GIS: Case of a coastal aquifer in Tunisia. Environ. Earth Sci. 2016, 75, 669. [Google Scholar] [CrossRef]
- Bordbar, M.; Neshat, A.; Javadi, S. A new hybrid framework for optimization and modification of groundwater vulnerability in coastal aquifer. Environ. Sci. Pollut. Res. 2016, 26, 21808–21827. [Google Scholar] [CrossRef]
- Kazakis, N.; Spiliotis, M.; Voudouris, K.; Pliaka, F.K.; Papadopoulos, B. A fuzzy multicriteria categorization of the GALDIT method to assess seawater intrusion vulnerability of coastal aquifers. Sci. Total Environ. 2018, 621, 524–534. [Google Scholar] [CrossRef]
- Motevalli, A.; Moradi, H.R.; Javadi, S. A comprehensive evaluation of groundwater vulnerability to saltwater up-coning and sea water intrusion in a coastal aquifer (case study: Ghaemshahr-juybar aquifer). J. Hydrol. 2018, 557, 753–773. [Google Scholar] [CrossRef]
- Kazakis, N.; Busico, G.; Colombani, N.; Mastrocicco, M.; Pavlou, A.; Voudouris, K. GALDIT-SUSI a modified method to account for surface water bodies in the assessment of aquifer vulnerability to seawater intrusion. J. Environ. Manag. 2019, 235, 257–265. [Google Scholar] [CrossRef] [PubMed]
- Deibe, D.; Amor, M.; Doallo, R. Big data geospatial processing for massive aerial LiDAR datasets. Remote Sens. 2020, 12, 719. [Google Scholar] [CrossRef] [Green Version]
- Fabris, M. Monitoring the coastal changes of the Po River Delta (Northern Italy) since 1911 using archival cartography, multi-temporal aerial photogrammetry and LiDAR data: Implications for coastline changes in 2100 A.D. Remote Sens. 2021, 13, 529. [Google Scholar] [CrossRef]
- Dhakate, R.; Sankaran, S.; Kumar, V.S.; Amarender, B.; Harikumar, P.; Subramanian, S.K. Demarcating saline water intrusion pathways using remote sensing, GIS and geophysical techniques in structurally controlled coastal aquifers in southern India. Environ. Earth Sci. 2016, 75, 1–19. [Google Scholar] [CrossRef]
- Mastrocicco, M.; Gervasio, M.P.; Busico, G.; Colombani, N. Natural and anthropogenic factors driving groundwater resources salinization for agriculture use in the Campania plains (Southern Italy). Sci. Tot. Environ. 2021, 758. [Google Scholar] [CrossRef] [PubMed]
- Matano, F.; Critelli, S.; Barone, M.; Muto, F.; Di Nocera, S. Stratigraphic and provenance evolution of the Southern Apennines foreland basin system during the Middle Miocene to Pliocene (Irpinia-Sannio successions, Italy). Mar. Pet. Geol. 2014, 57, 652–670. [Google Scholar] [CrossRef]
- De Vivo, B.; Rolandi, G.; Gans, P.B.; Calvert, A.; Bohrson, W.A.; Spera, F.J.; Belkin, H.E. New constraints on the pyroclastic eruptive history of the Campanian volcanic Plain (Italy). Miner. Pet. 2001, 73, 47–65. [Google Scholar] [CrossRef]
- Zanchetta, G.; Sulpizio, R.; Di Vito, M.A. The role of volcanic activity and climate in alluvial fan growth at volcanic areas: An example from southern Campania (Italy). Sedim. Geol. 2004, 168, 249–280. [Google Scholar] [CrossRef]
- Amorosi, A.; Pacifico, A.; Rossi, V.; Ruberti, D. Late quaternary incision and deposition in an active volcanic setting: The Volturno valley fill, southern Italy. Sedim. Geol. 2012, 282, 307–320. [Google Scholar] [CrossRef]
- Sacchi, M.; Molisso, F.; Pacifico, A.; Vigliotti, M.; Sabbarese, C.; Ruberti, D. Late-Holocene to recent evolution of Lake Patria, South Italy: An example of a coastal lagoon within a Mediterranean delta system. Glob. Planet. Change 2014, 117, 9–27. [Google Scholar] [CrossRef]
- Ruberti, D.; Vigliotti, M.; Di Mauro, A.; Chieffi, R.; Di Natale, M. Human influence over 150 years of coastal evolution in the Volturno delta system (southern Italy). J. Coast. Conserv. 2018, 22, 897–917. [Google Scholar] [CrossRef]
- Isidori, M.; Lavorgna, M.; Nardelli, A.; Parrella, A. Integrated environmental assessment of Volturno river in South Italy. Sci. Total Environ. 2004, 327, 123–134. [Google Scholar] [CrossRef] [PubMed]
- Ruberti, D.; Vigliotti, M. Land use and landscape pattern changes driven by land reclamation in a coastal area: The case of Volturno delta plain, Campania Region, southern Italy. Environ. Earth Sci. 2017, 76, 694. [Google Scholar] [CrossRef]
- Saaty, T.L. How to make a decision: The analytic hierarchy process. Eur. J. Oper. Res. 1990, 48, 9–26. [Google Scholar] [CrossRef]
- Revelle, R. Criteria for recognition of the sea water in ground-waters. Trans. Am. Geophys. Union 1941, 22. [Google Scholar] [CrossRef]
- Bowman, D.; Pranzini, E. Shoreline monitoring: Review and recommendations. In Beach Erosion Monitoring: Results from BEACHMED-e/OpTIMAL Project; Nuova Grafica Fiorentina: Firenze, Italy, 2008; p. 232. [Google Scholar]
- Donadio, C.; Vigliotti, M.; Valente, R.; Stanislao, C.; Ivaldi, R.; Ruberti, D. Anthropic vs. natural shoreline changes along the northern Campania coast, Italy. J. Coast. Conserv. 2017, 22, 939–955. [Google Scholar] [CrossRef]
- Corniello, A.; Ducci, D. Hydrogeochemical characterization of the main aquifer of the “Litorale Domizio-Agro Aversano NIPS” (Campania—southern Italy). J. Geochem. Explor. 2014, 137, 1–10. [Google Scholar] [CrossRef]
- De Pippo, T.; Donadio, C.; Pennetta, M.; Petrosino, C.; Terlizzi, F.; Valente, A. Coastal hazard assessment and mapping in Northern Campania, Italy. Geomorphology 2008, 97, 451–466. [Google Scholar] [CrossRef]
- Wolanski, E.; Martinez, J.A.; Richmond, R.H. Quantifying the impact of watershed urbanization on a coral reef: Maunalua bay, Hawaii. Estuar. Coast. Shelf Sci. 2009, 84, 259–268. [Google Scholar] [CrossRef]
- Navarro, V.; Alonso, E.E. Secondary compression of clays as a local dehydration process. Géotechnique 2001, 51, 859–869. [Google Scholar] [CrossRef]
- Busico, G.; Kazakis, N.; Cuoco, E.; Colombani, N.; Tedesco, D.; Voudouris, K.; Mastrocicco, M. A novel hybrid method of specific vulnerability to anthropogenic pollution using multivariate statistical and regression analyses. Water Res. 2020, 171. [Google Scholar] [CrossRef]
- Kalbus, E.; Reinstorf, F.; Schirmer, M. Measuring methods for groundwater–surface water interactions: A review. Hydrol. Earth Syst. Sci. 2006, 10, 873–887. [Google Scholar] [CrossRef] [Green Version]
- Wu, S.; Cheng, H.; Xu, Y.J.; Li, J.; Zheng, S. Decadal changes in bathymetry of the yangtze river estuary: Human impacts and potential saltwater intrusion. Estuar. Coast. Shelf Sci. 2016, 182, 158–169. [Google Scholar] [CrossRef] [Green Version]
- Aucelli, P.P.C.; Di Paola, G.; Incontri, P.; Rizzo, A.; Vilardo, G.; Benassai, G.; Buonocore, B.; Pappone, G. Coastal inundation risk assessment due to subsidence and sea level rise in a Mediterranean alluvial plain (Volturno coastal plain–southern Italy). Estuar. Coast. Shelf Sci. 2017, 198, 597–609. [Google Scholar] [CrossRef]
- Tramblay, Y.; Koutroulis, A.; Samaniego, L.; Vicente-Serrano, S.M.; Volaire, F.; Boone, A.; Le Page, M.; Llasat, M.C.; Albergel, C.; Burak, S.; et al. Challenges for drought assessment in the Mediterranean region under future climate scenarios. Earth-Sci. Rev. 2020, 210. [Google Scholar] [CrossRef]
- Benini, L.; Antonellini, M.; Laghi, M.; Mollema, P.N. Assessment of water resources availability and groundwater salinization in future climate and land use change scenarios: A case study from a coastal drainage basin in Italy. Water Resour. Manag. 2016, 30, 731–745. [Google Scholar] [CrossRef]
- Busico, G.; Ntona, M.M.; Carvalho, S.C.P.; Patrikaki, O.; Voudouris, K.; Kazakis, N. Simulating future groundwater recharge in coastal and inland catchments. Water Res. Manag. 2021, 11, 1–6. [Google Scholar] [CrossRef]
- Zörb, C.; Geilfus, C.M.; Dietz, K.J. Salinity and crop yield. Plant Biol. 2019, 21, 31–38. [Google Scholar] [CrossRef]
- Oude Essink, G.H.P.; Van Baaren, E.S.; De Louw, P.G. Effects of climate change on coastal groundwater systems: A modeling study in The Netherlands. Water Resour. Res. 2010, 46. [Google Scholar] [CrossRef]
- Zhang, D.; Yang, Y.; Wu, J.; Zheng, X.; Liu, G.; Sun, X.; Lin, J.; Wu, J. Global sensitivity analysis on a numerical model of seawater intrusion and its implications for coastal aquifer management: A case study in Dagu River Basin, Jiaozhou Bay, China. Hydrogeol. J. 2020, 28, 2543–2557. [Google Scholar] [CrossRef]
- Pulido-Velazquez, D.; Renau-Pruñonosa, A.; Llopis-Albert, C.; Morell, I.; Collados-Lara, A.J.; Senent-Aparicio, J.; Baena-Ruiz, L. Integrated assessment of future potential global change scenarios and their hydrological impacts in coastal aquifers. A new tool to analyse management alternatives in the Plana Oropesa-Torreblanca aquifer. Hydrol. Earth Syst. Sci. 2018, 22, 3074. [Google Scholar] [CrossRef] [Green Version]
- Sahab, S.; Suhani, I.; Srivastava, V.; Chauhan, P.S.; Singh, R.P.; Prasad, V. Potential risk assessment of soil salinity to agroecosystem sustainability: Current status and management strategies. Sci. Total Environ. 2021, 764. [Google Scholar] [CrossRef] [PubMed]


Publisher’s Note: MDPI stays neutral with regard to jurisdictional claims in published maps and institutional affiliations. |
© 2021 by the authors. Licensee MDPI, Basel, Switzerland. This article is an open access article distributed under the terms and conditions of the Creative Commons Attribution (CC BY) license (https://creativecommons.org/licenses/by/4.0/).