
Interpretation of the Reflectance Spectra of Lithium (Li) Minerals and Pegmatites: A Case Study for Mineralogical and Lithological Identification in the Fregeneda-Almendra Area

 ,
,  , ,
, ,  ,
,  , , and
Abstract
:
1. Introduction
2. Study Area and Field Surveys
3. Methodology
3.1. Reflectance Spectroscopy Studies
3.2. Complementary Petrographic and Geochemical Studies
4. Results
4.1. Li-Minerals Spectral Database
Characterization of Petalite Alteration Products
4.2. Spectral Studies for Lithological Classification
5. Discussion
5.1. Spectral Behavior of Li-Bearing Minerals
5.2. Effects of Alteration in the Spectral Signature of Li-Bearing Minerals
5.3. Discrimination of Li-Pegmatites from the Remaining Lithologies
5.4. Potential of Li-Exploration Using Satellite Data
6. Conclusions
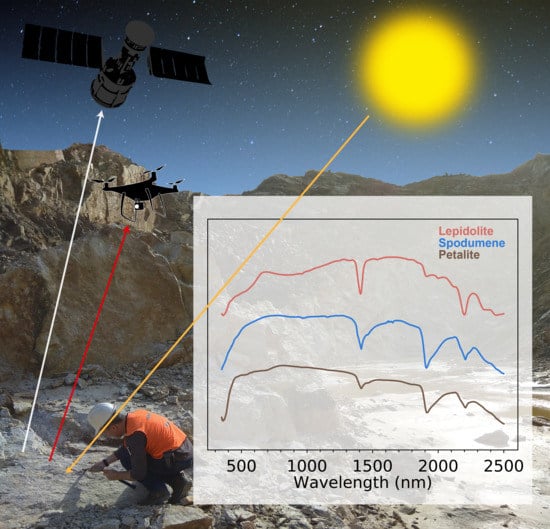
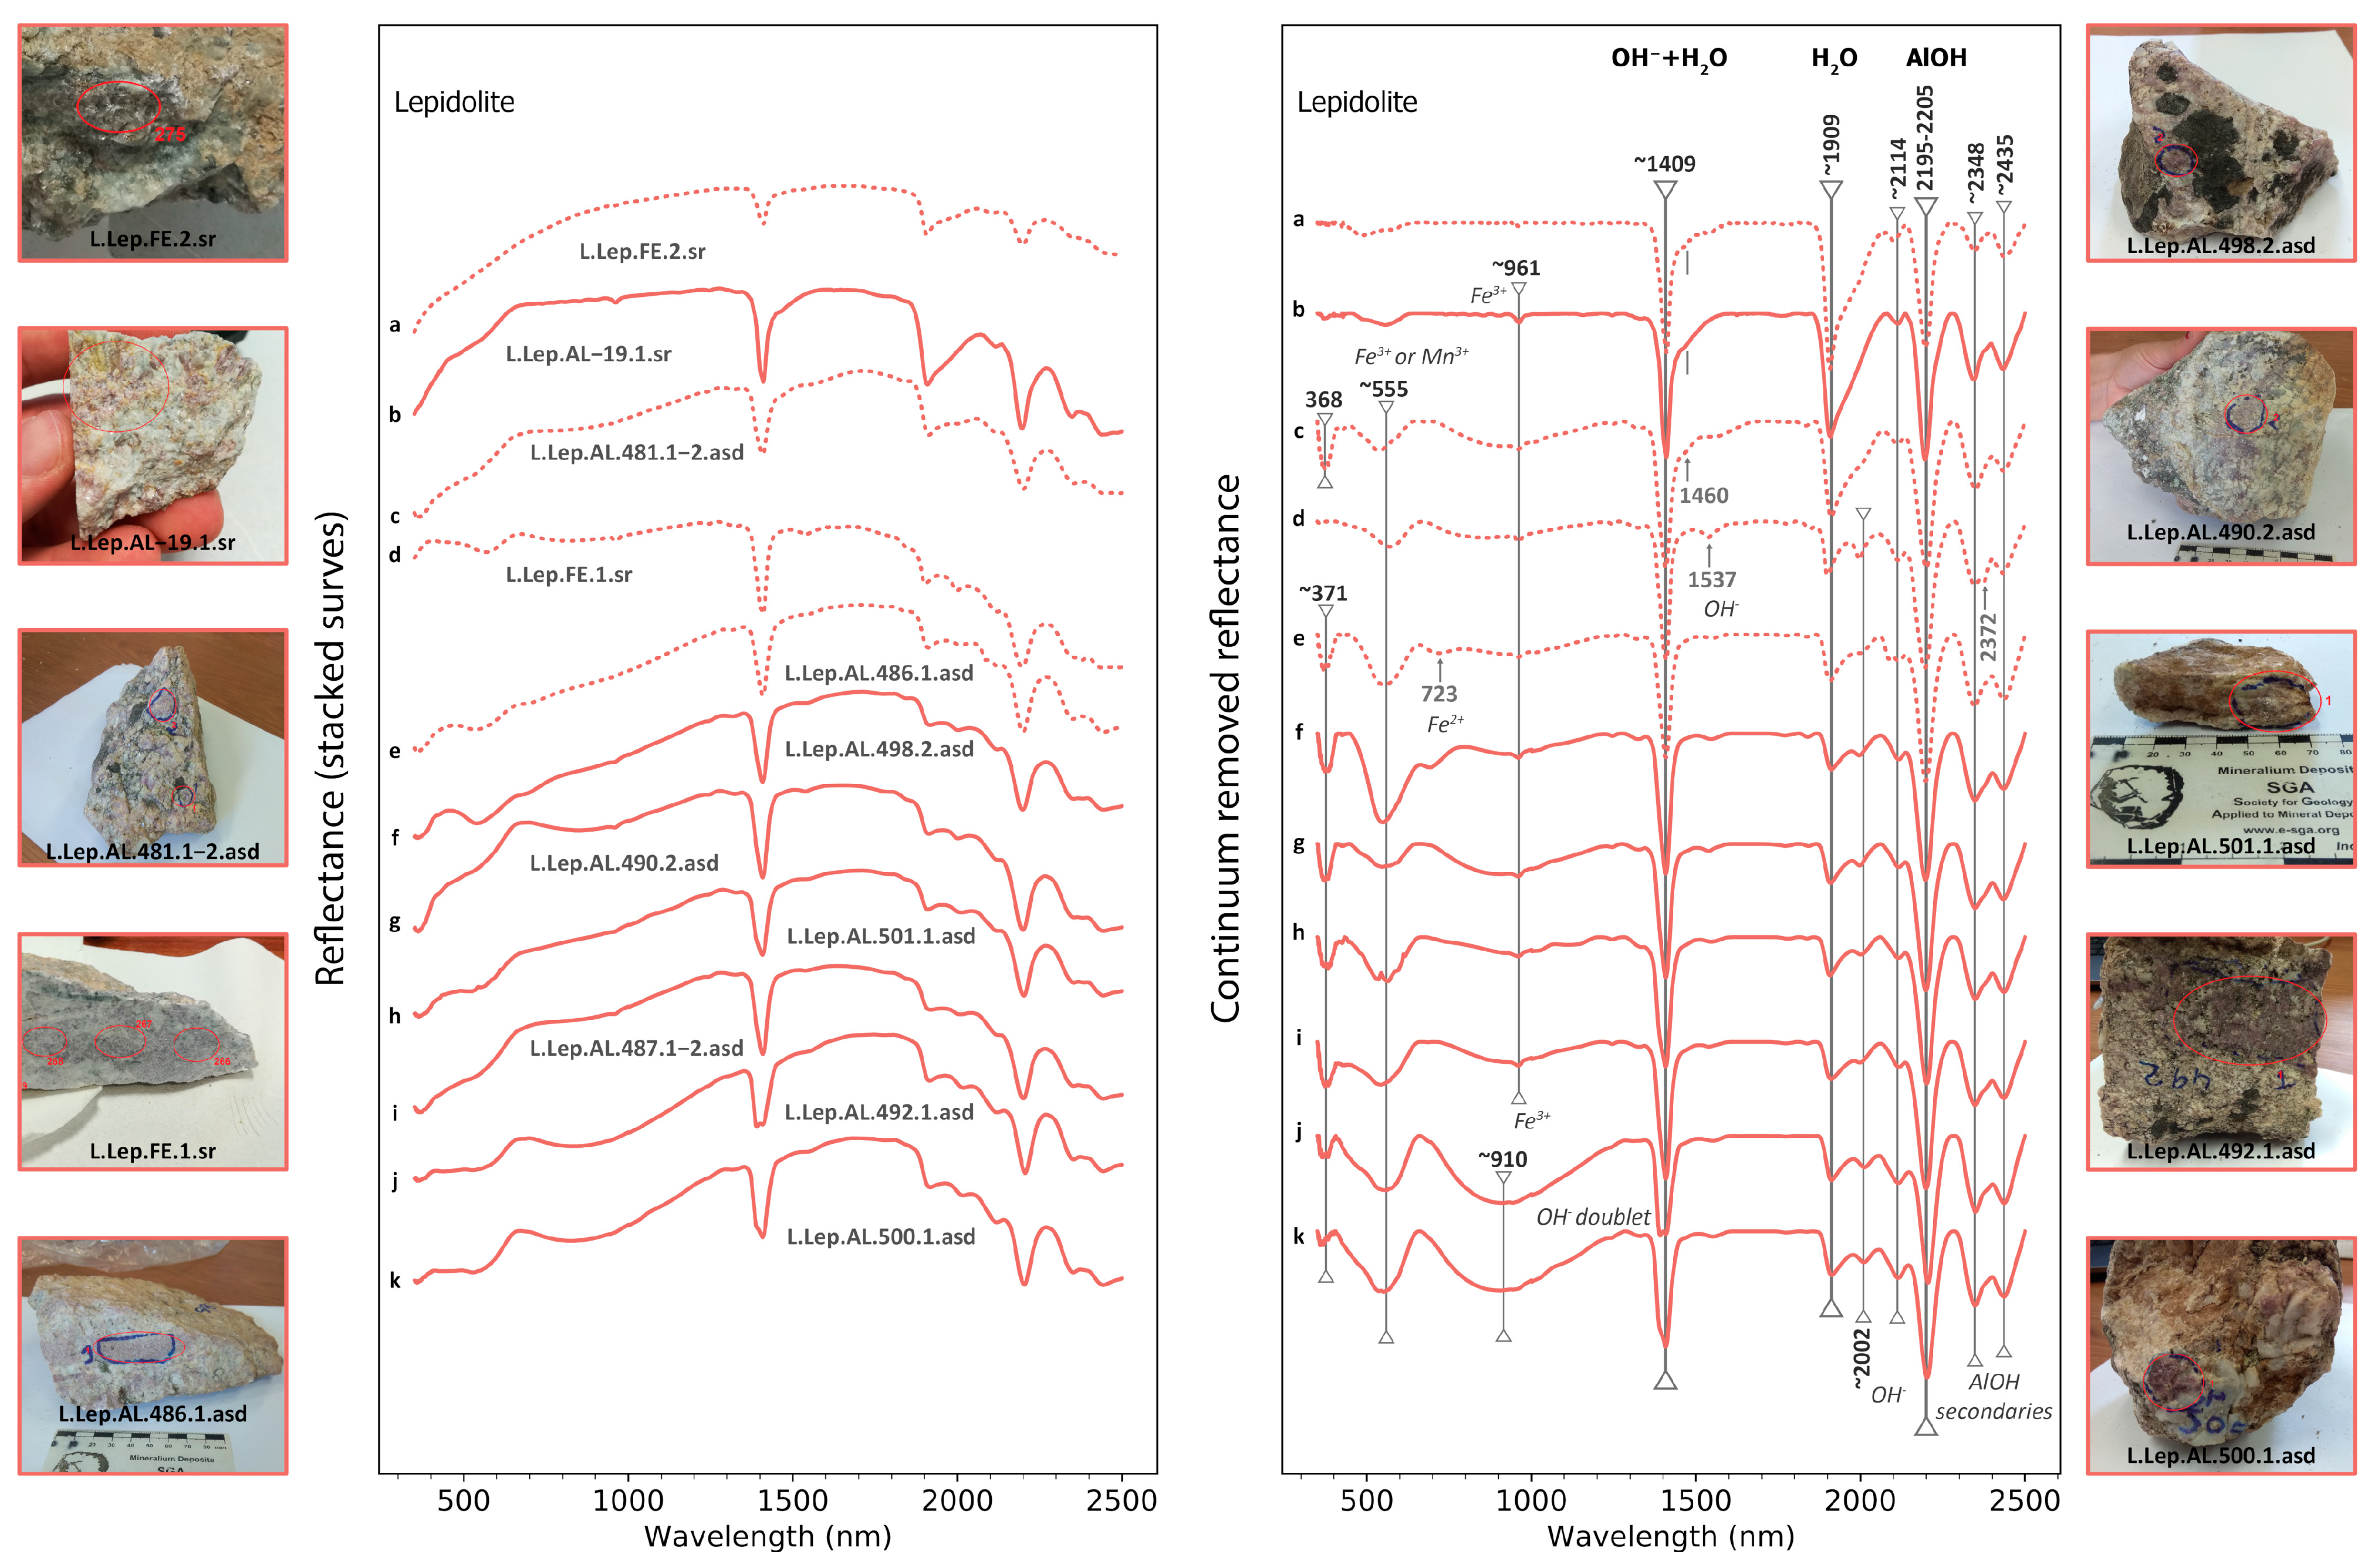
- Can Li-bearing minerals be distinguished from each other and other minerals? The spectra obtained allowed the discrimination of lepidolite from spodumene, petalite, and other white micas. However, it was not possible to distinguish petalite from spodumene because clay-related absorption features dominate the spectra of both Li-minerals, thus obscuring any likely diagnostic spectral behavior. This implies that spodumene and petalite can only be indirectly identified. Several factors, such as the VNIR features or the position of the main Al–OH absorption, enable direct lepidolite identification through multi- or hyperspectral satellite data.
- How can the alteration products affect the spectral signature of Li-bearing minerals? The complementary petrography and geochemical studies proved that the same alteration minerals observed in previous studies occur in either well-preserved or completely altered samples. However, the clay-related absorption depths are much smaller for petalite relics. Further studies are needed to understand if the clay minerals formed from petalite alteration in the Fregeneda–Almendra region are related to weathering or metasomatic processes. Therefore, the effect of alteration paragenesis is paramount in the spectral behavior of spodumene and petalite, thus limiting the possibility to discriminate areas where these Li-minerals occur from heavily altered, barren areas through multispectral data. On the other hand, using hyperspectral data could overcome this limitation, either through the possibility of recognizing variable absorption depths (distinct amounts of clay minerals) or by the identification of other alteration minerals exclusively related to Li-minerals such as cookeite. Notwithstanding, in areas where clay-related alteration is not prevalent, the same methodology can be employed, using montmorillonite and kaolinite as pathfinders to identify spodumene and petalite worldwide since the alteration paragenesis is similar to the described in tropical conditions.
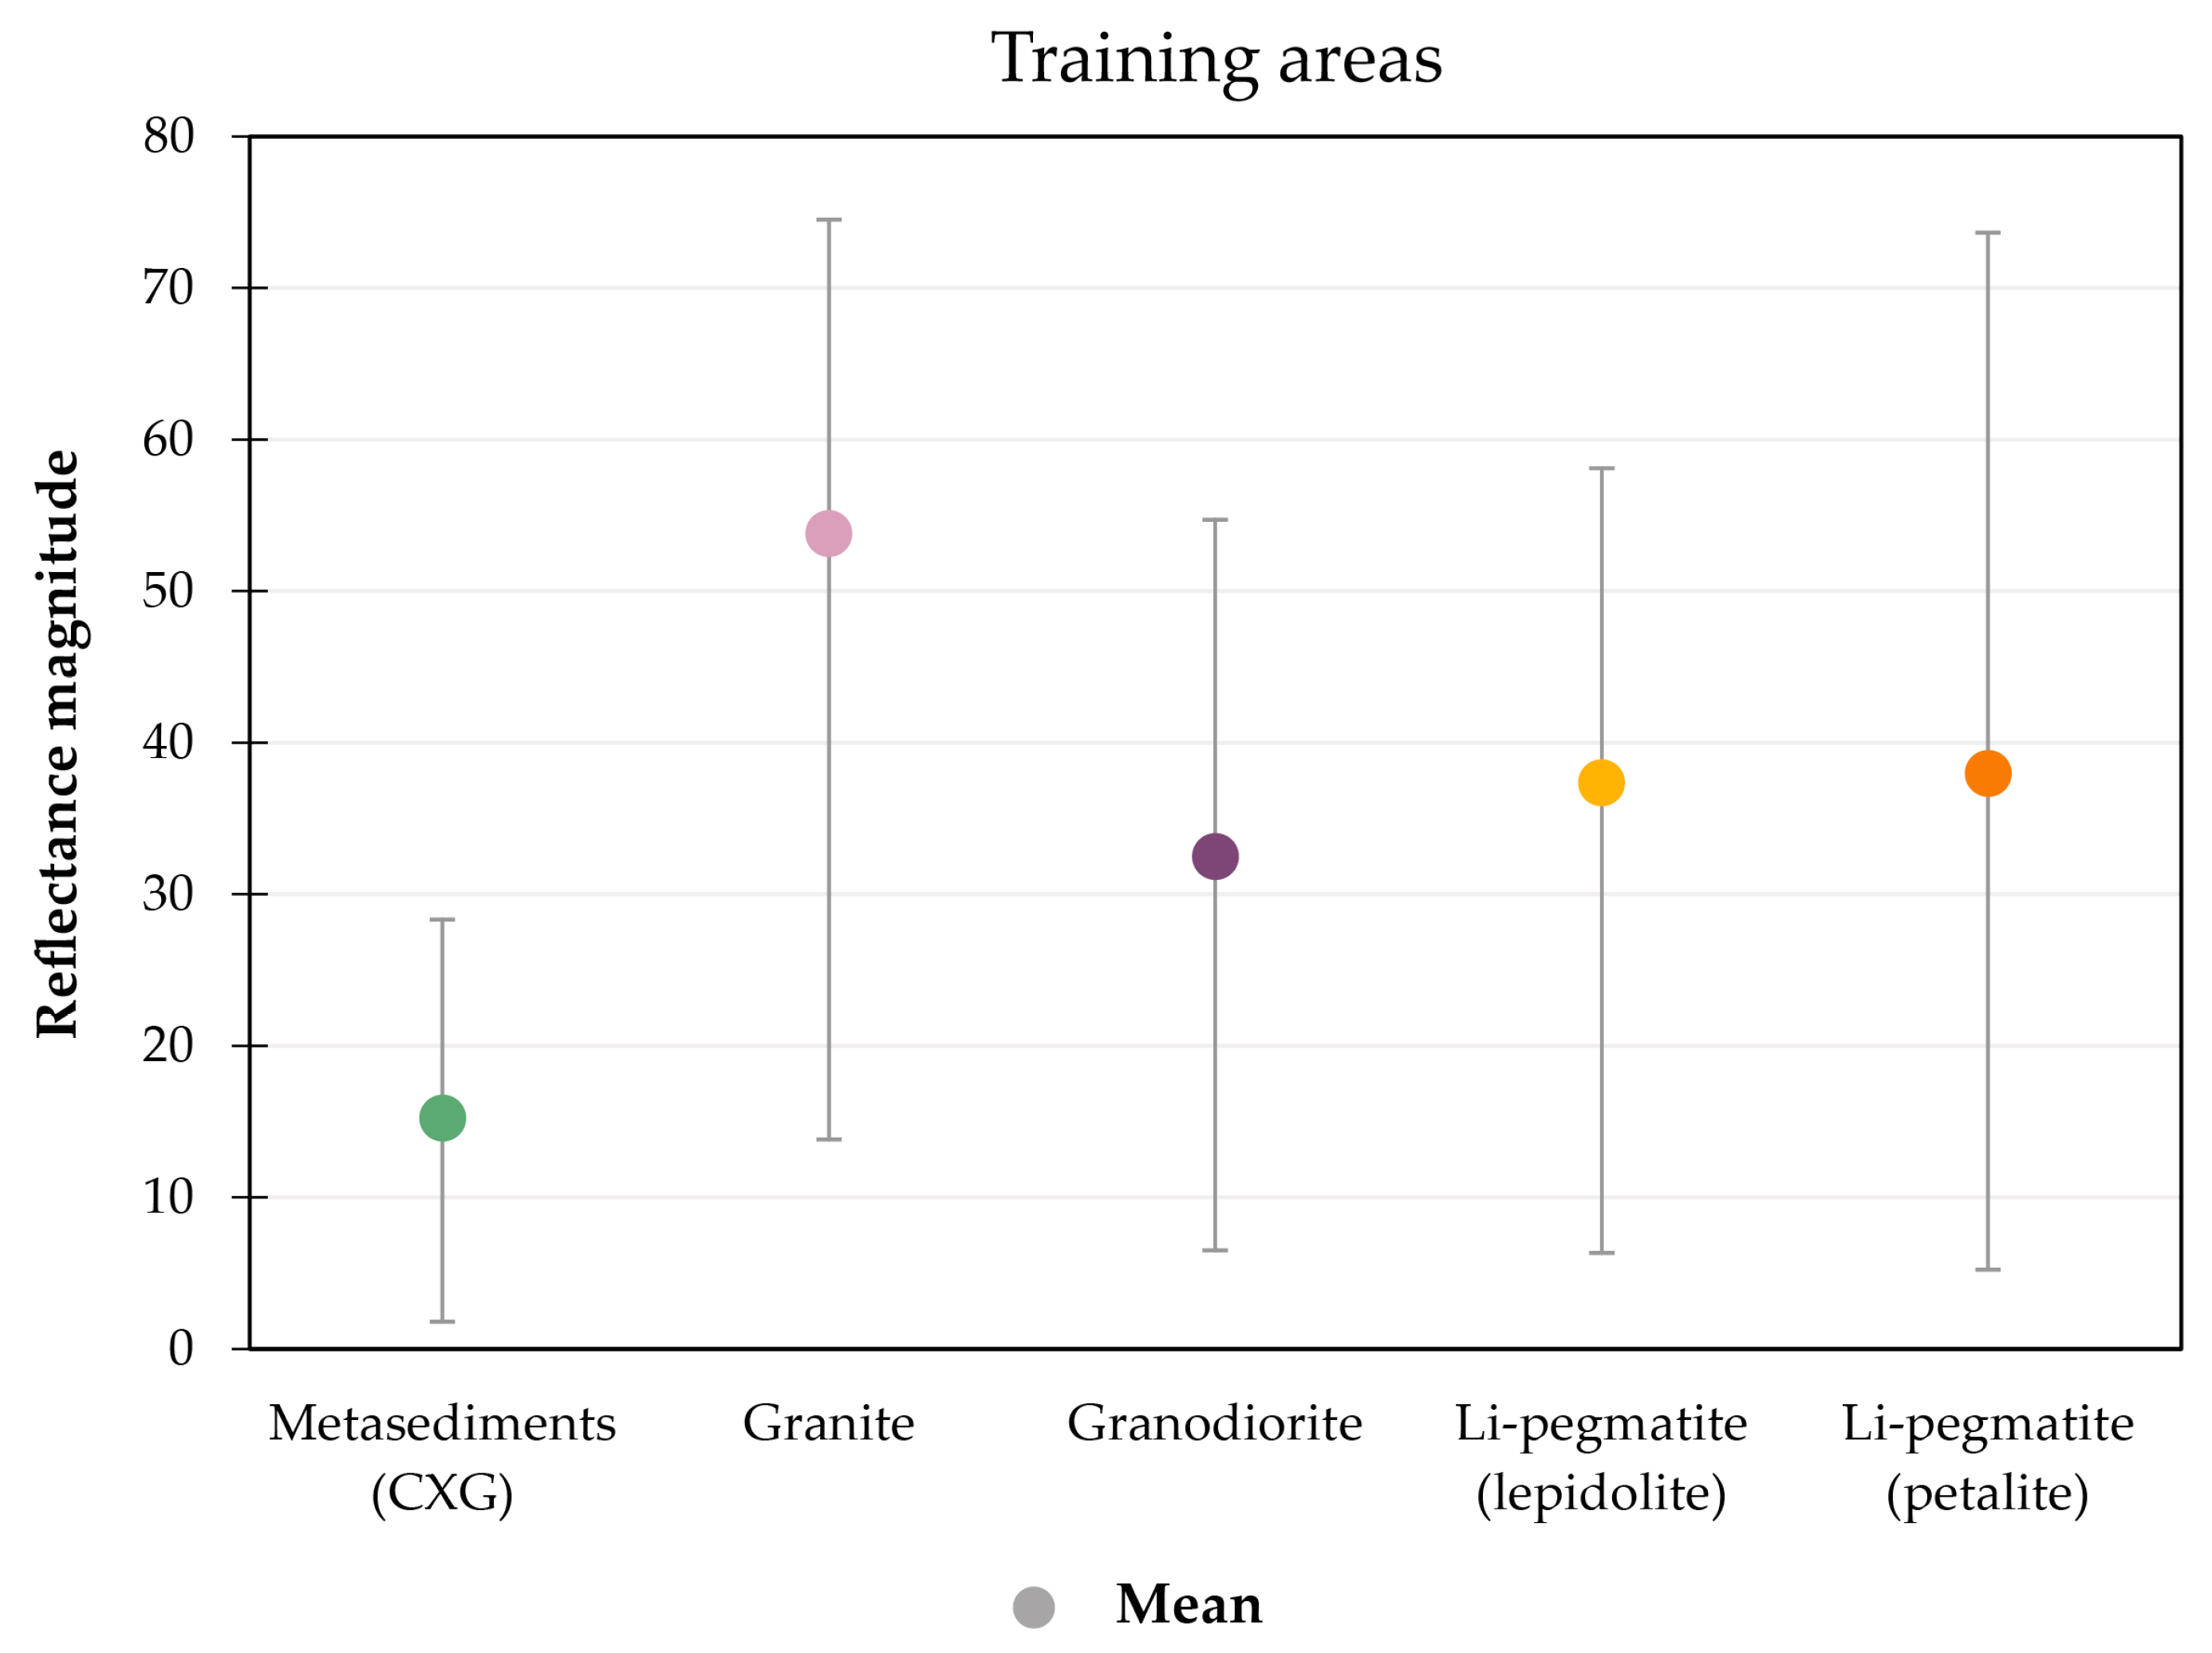
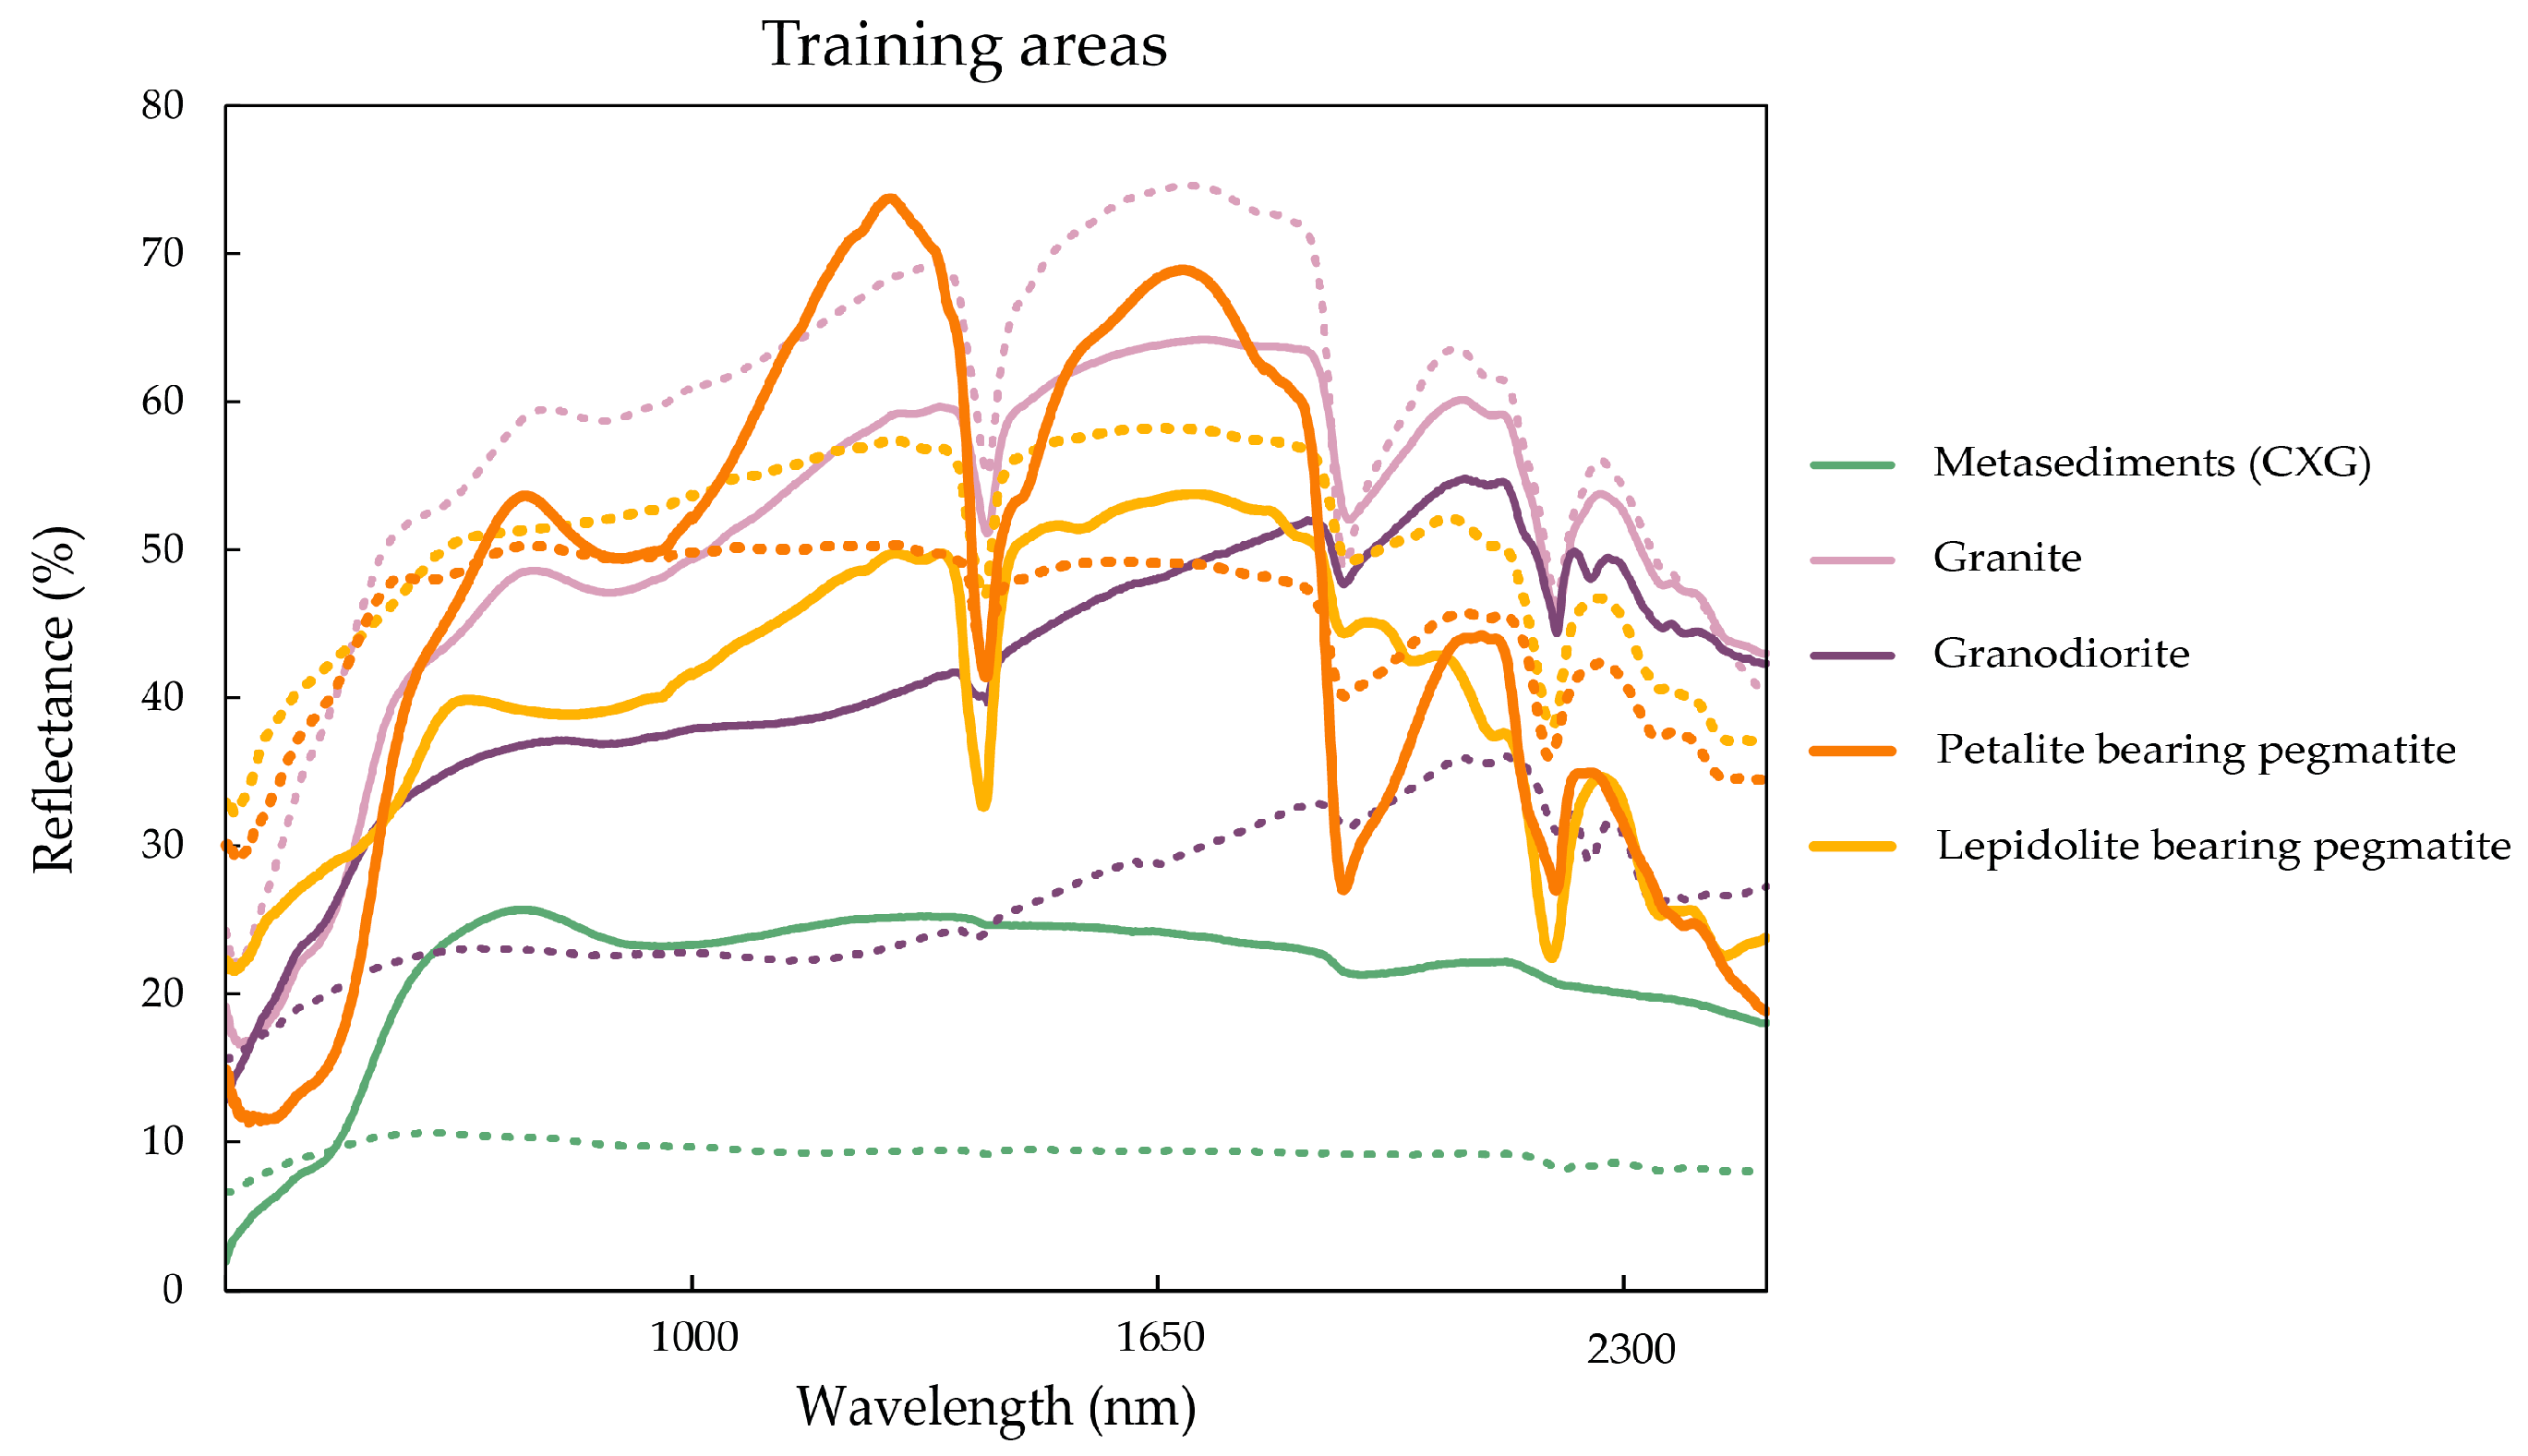
- Can Li-pegmatites be spectrally discriminated from other lithologies in a supervised classification attempt? Despite the similar absorption features, we conclude that the satellite data can map Li-pegmatites through several criteria such as (i) the distinctive reflectance magnitude, (ii) higher absorptions depths, (iii) distinct wavelength position of key absorption features, and (iv) particular overall spectral behavior reflecting different mineral assemblages. Minerals such as lepidolite, cookeite, and orthoclase can work as targets for Li-pegmatites. Further studies are needed to evaluate the performance of hyperspectral data in real-life conditions and compare it with the laboratory-simulated hyperspectral data.
Supplementary Materials
Author Contributions
Funding
Institutional Review Board Statement
Informed Consent Statement
Data Availability Statement
Conflicts of Interest
Appendix A


| False-Positive Area | Site Description | Lithology | Petrography | Spectroscopy |
|---|---|---|---|---|
| 1 (GPS point 443) | Wine plantation; disturbed soil with many rock boulders | CXG metasediments: A1 *–striped phyllites interbed with metagraywacke benches; A2–light-colored phyllite. | A1: WM/Ser, Qtz, IO, Bt, Pl, Chl, Tur, detrital WM, detrital Zr, opaque minerals | Il, Mnt, WM, Chl/Bt, Goe and other IO, Qtz? |
| 2 (GPS point 444) | Hillside area; slope deposits | Ordovician metasediments: A1–whitish impure quartzite (metapsamite) with a ferruginous crust; A2/A3–reddish, ferruginous impure quartzite. | A1: Qtz, WM, IO, detrital Zr, Tur | WM, Qtz, Il, Goe, Kao |
| 3 (GPS point 445) | Olive plantation; sparse rock boulders | CXG metasediments: A1/A2–striped phyllites interbed with metagraywacke benches. A3–pegmatite. | A2: WM/Ser, Qtz, Chl, detrital WM, Pl, IO, Ap, opaque minerals | Mnt, Il, Chl/Bt, Goe and other IO, Qtz? |
| 4 (GPS point 446) | Almond plantation; disperse rock boulders | CXG metasediments: A1/A2–striped phyllites interbed with metagraywacke benches | A1: Qtz, WM/Ser, Bt, Pl, detrital WM, Tur, IO, detrital Zr, Ap, opaque minerals | WM, Ser, Chl |


References
- Lypaczewski, P.; Rivard, B.; Lesage, G.; Byrne, K.; D’Angelo, M.; Lee, R.G. Characterization of Mineralogy in the Highland Valley Porphyry Cu District Using Hyperspectral Imaging, and Potential Applications. Minerals 2020, 10, 473. [Google Scholar] [CrossRef]
- Laakso, K.; Peter, J.M.; Rivard, B.; Gloaguen, R. Combined hyperspectral and lithogeochemical estimation of alteration intensities in a volcanogenic massive sulfide deposit hydrothermal system: A case study from Northern Canada. In Proceedings of the 2016 8th Workshop on Hyperspectral Image and Signal Processing: Evolution in Remote Sensing (WHISPERS), Los Angeles, CA, USA, 21–24 August 2016; pp. 1–5. [Google Scholar] [CrossRef]
- Laakso, K.; Peter, J.M.; Rivard, B.; White, H.P. Short-Wave Infrared Spectral and Geochemical Characteristics of Hydrothermal Alteration at the Archean Izok Lake Zn-Cu-Pb-Ag Volcanogenic Massive Sulfide Deposit, Nunavut, Canada: Application in Exploration Target Vectoring. Econ. Geol. 2016, 111, 1223–1239. [Google Scholar] [CrossRef]
- Turner, D.; Rivard, B.; Groat, L. Rare earth element ore grade estimation of mineralized drill core from hyperspectral imaging spectroscopy. In Proceedings of the 2014 IEEE Geoscience and Remote Sensing Symposium, Quebec City, QC, Canada, 13–18 July 2014; pp. 4612–4615. [Google Scholar] [CrossRef]
- Möller, V.; Williams-Jones, A.E. A hyperspectral study (V-NIR-SWIR) of the Nechalacho REE-Nb-Zr deposit, Canada. J. Geochem. Explor. 2018, 188, 194–215. [Google Scholar] [CrossRef] [Green Version]
- Sun, Y.; Seccombe, P.K.; Yang, K. Application of short-wave infrared spectroscopy to define alteration zones associated with the Elura zinc–lead–silver deposit, NSW, Australia. J. Geochem. Explor. 2001, 73, 11–26. [Google Scholar] [CrossRef]
- Tappert, M.C.; Rivard, B.; Giles, D.; Tappert, R.; Mauger, A. The mineral chemistry, near-infrared, and mid-infrared reflectance spectroscopy of phengite from the Olympic Dam IOCG deposit, South Australia. Ore Geol. Rev. 2013, 53, 26–38. [Google Scholar] [CrossRef]
- Naleto, J.L.C.; Perrotta, M.M.; Costa, F.G.d.; de Souza Filho, C.R. Point and imaging spectroscopy investigations on the Pedra Branca orogenic gold deposit, Troia Massif, Northeast Brazil: Implications for mineral exploration in amphibolite metamorphic-grade terrains. Ore Geol. Rev. 2019, 107, 283–309. [Google Scholar] [CrossRef]
- Linnen, R.L.; Van Lichtervelde, M.; Černý, P. Granitic Pegmatites as Sources of Strategic Metals. Elements 2012, 8, 275–280. [Google Scholar] [CrossRef]
- Goodenough, K.M.; Shaw, R.A.; Smith, M.; Estrade, G.; Marqu, E.; Bernard, C.; Nex, P. Economic mineralization in pegmatites: Comparing and contrasting NYF and LCT examples. Can. Mineral. 2019, 57, 753–755. [Google Scholar] [CrossRef]
- Kesler, S.E.; Gruber, P.W.; Medina, P.A.; Keoleian, G.A.; Everson, M.P.; Wallington, T.J. Global lithium resources: Relative importance of pegmatite, brine and other deposits. Ore Geol. Rev. 2012, 48, 55–69. [Google Scholar] [CrossRef]
- Selway, J.B.; Breaks, F.W.; Tindle, A.G. A Review of Rare-Element (Li-Cs-Ta) Pegmatite Exploration Techniques for the Superior Province, Canada, and Large Worldwide Tantalum Deposits. Explor. Min. Geol. 2005, 14, 1–30. [Google Scholar] [CrossRef]
- Dill, H.G. Pegmatites and aplites: Their genetic and applied ore geology. Ore Geol. Rev. 2015, 69, 417–561. [Google Scholar] [CrossRef]
- Steiner, B.M. Tools and Workflows for Grassroots Li–Cs–Ta (LCT) Pegmatite Exploration. Minerals 2019, 9, 499. [Google Scholar] [CrossRef] [Green Version]
- Zhang, A.; Wang, R.; Li, Y.; Hu, H.; Lu, X.; Ji, J.; Zhang, H. Tourmalines from the Koktokay No.3 pegmatite, Altai, NW China: Spectroscopic characterization and relationships with the pegmatite evolution. Eur. J. Mineral. 2008, 20, 143–154. [Google Scholar] [CrossRef]
- Carrino, T.A.; de Brito Barreto, S.; de Oliveira, P.J.A.; de Araújo Neto, J.F.; de Lima Correia, A.M. Linking gemology and spectral geology: A case study of elbaites from Seridó Pegmatite Province, Northeastern Brazil. Braz. J. Geol. 2019, 49. [Google Scholar] [CrossRef]
- Bocchio, R.; Adamo, I.; Caucia, F. Aquamarine from the Masino-Bregaglia Massif, Central Alps, Italy. Gems Gemol. 2009, 45, 204–207. [Google Scholar] [CrossRef]
- de Araújo Neto, J.F.; de Brito Barreto, S.; Carrino, T.A.; Müller, A.; de Lira Santos, L.C.M. Mineralogical and gemological characterization of emerald crystals from Paraná deposit, NE Brazil: A study of mineral chemistry, absorption and reflectance spectroscopy and thermal analysis. Braz. J. Geol. 2019, 49. [Google Scholar] [CrossRef] [Green Version]
- da Silva, S.M.P.; Crósta, A.P.; Angélica, R.S.; Beurlen, H.; da Silva, M.R.R. Mineralogical characterization and mapping using reflectance spectroscopy: An experiment at Alto do Giz pegmatite in the south portion of Borborema Pegmatite Province (BPP), northeastern Brazil. Estud. Geol. 2009, 19, 337–342. [Google Scholar]
- Cardoso-Fernandes, J.; Lima, A.; Roda-Robles, E.; Teodoro, A.C. Constraints and potentials of remote sensing data/techniques applied to lithium (Li)-pegmatites. Can. Mineral. 2019, 57, 723–725. [Google Scholar] [CrossRef]
- Cardoso-Fernandes, J.; Teodoro, A.C.; Lima, A. Remote sensing data in lithium (Li) exploration: A new approach for the detection of Li-bearing pegmatites. Int. J. Appl. Earth Obs. Geoinf. 2019, 76, 10–25. [Google Scholar] [CrossRef]
- Santos, D.; Teodoro, A.; Lima, A.; Cardoso-Fernandes, J. Remote sensing techniques to detect areas with potential for lithium exploration in Minas Gerais, Brazil. In Proceedings of the SPIE Remote Sensing, Strasbourg, France, 9–12 September 2019; Schulz, K., Michel, U., Nikolakopoulos, K.G., Eds.; SPIE: Bellingham, WA, USA, 2019. [Google Scholar] [CrossRef]
- Cardoso-Fernandes, J.; Teodoro, A.C.; Lima, A.; Roda-Robles, E. Semi-Automatization of Support Vector Machines to Map Lithium (Li) Bearing Pegmatites. Remote Sens. 2020, 12, 2319. [Google Scholar] [CrossRef]
- Gao, Y.; Bagas, L.; Li, K.; Jin, M.; Liu, Y.; Teng, J. Newly Discovered Triassic Lithium Deposits in the Dahongliutan Area, NorthWest China: A Case Study for the Detection of Lithium-Bearing Pegmatite Deposits in Rugged Terrains Using Remote-Sensing Data and Images. Front. Earth Sci. 2020, 8, 553. [Google Scholar] [CrossRef]
- Costa, M.A.C.; Perrotta, M.M.; Melo, T.G.; Turra, B. Estudos Espectrais. In Avaliação do Potencial do Lítio no Brasil: Área do Médio Rio Jequitinhonha, Nordeste de Minas Gerais: Texto Explicativo e Mapas; Paes, V.J.C., Santos, L.D., Tedeschi, M.F., Betiollo, L.M., Eds.; CPRM: Belo Horizonte, MG, Brazil, 2016; p. 276. [Google Scholar]
- Vieira, R. Aplitopegmatitos com Elementos Raros da Região Entre Almendra (V.N. de Foz Côa) e Barca d’Alva (Figueira de Castelo Rodrigo). Campo Aplitopegmatítico da Fregeneda-Almendra. Ph.D. Thesis, Faculdade de Ciências da Universidade do Porto, Porto, Portugal, 2010. [Google Scholar]
- Roda, E. Distribución, Caracteristicas y Petrogenesis de las Pegmatitas de La Fregeneda (Salamanca). Ph.D. Thesis, Facultad de Ciencia y Tecnología de la Universidad del País Vasco (UPV/EHU), Bilbao, Spain, 1993. [Google Scholar]
- Cardoso-Fernandes, J.; Teodoro, A.C.; Lima, A.; Roda-Robles, E. Evaluating the performance of support vector machines (SVMs) and random forest (RF) in Li-pegmatite mapping: Preliminary results. In Proceedings of the SPIE Remote Sensing, Strasbourg, France, 9–12 September 2019; Schulz, K., Michel, U., Nikolakopoulos, K.G., Eds.; SPIE: Bellingham, WA, USA, 2019. [Google Scholar] [CrossRef]
- Cardoso-Fernandes, J.; Silva, J.; Lima, A.; Teodoro, A.C.; Perrotta, M.; Cauzid, J.; Roda-Robles, E. Characterization of lithium (Li) minerals from the Fregeneda–Almendra region through laboratory spectral measurements: A comparative study. In Earth Resources and Environmental Remote Sensing/GIS Applications XI; SPIE: Bellingham, WA, USA, 2020. [Google Scholar] [CrossRef]
- Cardoso-Fernandes, J.; Silva, J.; Lima, A.; Teodoro, A.C.; Perrotta, M.; Cauzid, J.; Roda-Robles, E.; Ribeiro, M.A. Reflectance spectroscopy to validate remote sensing data/algorithms for satellite-based lithium (Li) exploration (Central East Portugal). In Earth Resources and Environmental Remote Sensing/GIS Applications XI; SPIE: Bellingham, WA, USA, 2020. [Google Scholar] [CrossRef]
- Roda-Robles, E.; Pesquera, A.; Velasco, F.; Fontan, F. The granitic pegmatites of the Fregeneda area (Salamanca, Spain): Characteristics and petrogenesis. Mineral. Mag. 1999, 63, 535–558. [Google Scholar] [CrossRef]
- da Costa, J.C.S. Notícia Sobre Uma Carta Geológica do Buçaco, de Nery Delgado; Serviços Geológicos de Portugal: Lisboa, Portugal, 1950. [Google Scholar]
- Teixeira, C. Notas Sobre Geologia de Portugal o Complexo Xisto-Grauváquico Ante-Ordoviciano; Empresa Literaria Fluminense Lda.: Lisboa, Portugal, 1955; p. 48. [Google Scholar]
- Rodríguez Alonso, M.D.; Díez Balda, M.A.; Perejón, A.; Pieren, A.; Liñán, E.; López Díaz, F.; Moreno, F.; Gámez Vintaned, J.A.; Gónzalez Lodeiro, F.; Martínez Poyatos, D.; et al. Domínio del Complejo Esquisto-Grauváquico: Estratigrafía. La secuencia litoestratigráfica del Neoproterozóico-Câmbrico Inferior. In Geología de España; Vera, J.A., Ed.; Geológica de España-Instituto Geológico y Minero de España (SGE-IGME): Madrid, Spain, 2004; pp. 78–81. [Google Scholar]
- Pereira, I.; Dias, R.; Bento dos Santos, T.; Mata, J. Exhumation of a migmatite complex along a transpressive shear zone: Inferences from the Variscan Juzbado–Penalva do Castelo Shear Zone (Central Iberian Zone). J. Geol. Soc. 2017, 174, 1004. [Google Scholar] [CrossRef]
- Ferreira, J.A.; Bento dos Santos, T.; Pereira, I.; Mata, J. Tectonically assisted exhumation and cooling of Variscan granites in an anatectic complex of the Central Iberian Zone, Portugal: Constraints from LA-ICP-MS zircon and apatite U–Pb ages. Int. J. Earth Sci. 2019, 108, 2153–2175. [Google Scholar] [CrossRef]
- da Silva, A.F.; Ribeiro, M.L. Notícia Explicativa da Folha 15-A: Vila Nova de Foz Côa; Serviços Geológicos de Portugal: Lisboa, Portugal, 1991; p. 52. [Google Scholar]
- da Silva, A.F.; Ribeiro, M.L. Notícia Explicativa da Folha 15-B: Freixo de Espada à Cinta; Instituto Geológico e Mineiro: Lisboa, Portugal, 1994; p. 48. [Google Scholar]
- Silva, A.F.; Santos, A.J.; Ribeiro, A.; Cabral, J.; Ribeiro, M.L. Carta Geológica de Portugal na Escala 1/50.000–Folha 15-B–Freixo de Espada à Cinta; Serviços Geológicos de Portugal: Lisboa, Portugal, 1990. [Google Scholar]
- Silva, A.F.; Santos, A.J.; Ribeiro, A.; Ribeiro, M.L. Carta Geológica de Portugal na Escala 1/50.000–folha 15-A–Vila Nova de Foz Côa; Serviços Geológicos de Portugal: Lisboa, Portugal, 1990. [Google Scholar]
- ASD Inc. ViewSpec Pro™ User Manual; ASD Document 600555 Rev. A; ASD Inc.: Boulder, CO, USA, 2008. [Google Scholar]
- Menges, F. Spectragryph–Optical Spectroscopy Software, Version 1.2.14. Available online: http://www.effemm2.de/spectragryph/ (accessed on 22 July 2020).
- Clark, R.N.; Roush, T.L. Reflectance spectroscopy: Quantitative analysis techniques for remote sensing applications. J. Geophys. Res. Solid Earth 1984, 89, 6329–6340. [Google Scholar] [CrossRef]
- Therien, C. Welcome to the PySptools Documentation. Available online: https://pysptools.sourceforge.io/ (accessed on 22 July 2020).
- Cardoso-Fernandes, J.; Silva, J.; Dias, F.; Lima, A.; Teodoro, A.C.; Barrès, O.; Cauzid, J.; Perrotta, M.; Roda-Robles, E.; Ribeiro, M.A. Tools for Remote Exploration: A Lithium (Li) Dedicated Spectral Library of the Fregeneda–Almendra Aplite–Pegmatite Field. Data 2021, 6, 33. [Google Scholar] [CrossRef]
- Cardoso-Fernandes, J.; Silva, J.; Dias, F.; Lima, A.; Teodoro, A.C.; Barrès, O.; Cauzid, J.; Perrotta, M.; Roda-Robles, E.; Ribeiro, M.A. Tools for Remote Exploration: A Lithium (Li) Dedicated Spectral Library of the Fregeneda–Almendra Aplite-Pegmatite Field; Zenodo: Meyrin, Switzerland, 2021. [Google Scholar] [CrossRef]
- Hunt, G.R.; Salisbury, J.W. Visible and near-infrared spectra of minerals and rocks: I Silicate minerals. Mod. Geol. 1970, 1, 283–300. [Google Scholar]
- Clark, R.N.; King, T.V.V.; Klejwa, M.; Swayze, G.A.; Vergo, N. High spectral resolution reflectance spectroscopy of minerals. J. Geophys. Res. Solid Earth 1990, 95, 12653–12680. [Google Scholar] [CrossRef] [Green Version]
- Pontual, S.; Merry, N.J.; Gamson, P. Spectral Interpretation Field Manual: GMEX Spectral Analysis Guides for Mineral Exploration, 3rd ed.; AusSpec International Ltd.: Victoria, Australia, 2008; Volume 1. [Google Scholar]
- Clark, R.N.; Swayze, G.A.; Gallagher, A.J.; King, T.V.V.; Calvin, W.M. The U. S. Geological Survey, Digital Spectral Library: Version 1 (0.2 to 3.0 um); Open-File Report 93–592; Geological Survey: Reston, WV, USA, 1993. [Google Scholar]
- Mattson, S.M.; Rossman, G.R. Fe2+-Fe3+ interactions in tourmaline. Phys. Chem. Miner. 1987, 14, 163–171. [Google Scholar] [CrossRef]
- Clark, R.N. Chapter 1: Spectroscopy of rocks and minerals and principles of spectroscopy. In Remote Sensing for the Earth Sciences: Manual of Remote Sensing, 3rd ed.; Ryerson, R.A., Ed.; John Wiley & Sons, Inc.: Hoboken, NJ, USA, 1999. [Google Scholar]
- Hunt, G.R. Spectral signatures of particulate minerals in the visible and near infrared. Geophysics 1977, 42, 501–513. [Google Scholar] [CrossRef] [Green Version]
- King, T.V.V.; Clark, R.N. Spectral characteristics of chlorites and Mg-serpentines using high-resolution reflectance spectroscopy. J. Geophys. Res. Solid Earth 1989, 94, 13997–14008. [Google Scholar] [CrossRef]
- Clark, R.N.; Swayze, G.A.; Wise, R.; Livo, K.E.; Hoefen, T.M.; Kokaly, R.F.; Sutley, S.J. USGS Digital Spectral Library splib05a. Available online: https://pubs.usgs.gov/of/2003/ofr-03-395/ (accessed on 8 January 2021).
- Hunt, G.R.; Ashley, R.P. Spectra of altered rocks in the visible and near infrared. Econ. Geol. 1979, 74, 1613–1629. [Google Scholar] [CrossRef]
- Cardoso-Fernandes, J.; Dias, F.; Lima, A.; Anjos Ribeiro, M.; Perrotta, M.; Roda-Robles, E.; Teodoro, A.C. Petalite alteration products from the Bajoca pegmatite (Central Portugal): A multiapproach for lithium exploration. In Proceedings of the EGU General Assembly 2021, Online, 19–30 April 2021. [Google Scholar] [CrossRef]
- Lima, A. Estrutura, Mineralogia e Génese dos Filões Aplitopegmatíticos com Espodumena da Região do Barroso-Alvão. Ph.D. Thesis, Universidade do Porto, Porto, Portugal, 2000. [Google Scholar]
- Lypaczewski, P.; Rivard, B. Estimating the Mg# and AlVI content of biotite and chlorite from shortwave infrared reflectance spectroscopy: Predictive equations and recommendations for their use. Int. J. Appl. Earth Obs. Geoinf. 2018, 68, 116–126. [Google Scholar] [CrossRef]
- Bishop, J.L.; Lane, M.D.; Dyar, M.D.; Brown, A.J. Reflectance and emission spectroscopy study of four groups of phyllosilicates: Smectites, kaolinite-serpentines, chlorites and micas. Clay Miner. 2008, 43, 35–54. [Google Scholar] [CrossRef]
- Felzer, B.; Hauff, P.; Goetz, A.F.H. Quantitative reflectance spectroscopy of buddingtonite from the Cuprite mining district, Nevada. J. Geophys. Res. Solid Earth 1994, 99, 2887–2895. [Google Scholar] [CrossRef]
- Krohn, M.D.; Altaner, S.P. Near-infrared detection of ammonium minerals. Geophysics 1987, 52, 924–930. [Google Scholar] [CrossRef]
- Aires, S.C.M. Petrofísica e Litogeoquímica de Formações do “Complexo Xisto-Grauváquico” (Grupo do Douro) Estudo do Potencial do “Xisto” Para Exploração Como Pedra Natural. Ph.D. Thesis, Faculdade de Ciências da Universidade do Porto, Porto, Portugal, 2018. [Google Scholar]
- Duke, E.F. Near infrared spectra of muscovite, Tschermak substitution, and metamorphic reaction progress: Implications for remote sensing. Geology 1994, 22, 621–624. [Google Scholar] [CrossRef]
- Ellis, R.J.; Scott, P.W. Evaluation of hyperspectral remote sensing as a means of environmental monitoring in the St. Austell China clay (kaolin) region, Cornwall, UK. Remote Sens. Environ. 2004, 93, 118–130. [Google Scholar] [CrossRef]
- Oshigami, S.; Yamaguchi, Y.; Uezato, T.; Momose, A.; Arvelyna, Y.; Kawakami, Y.; Yajima, T.; Miyatake, S.; Nguno, A. Mineralogical mapping of southern Namibia by application of continuum-removal MSAM method to the HyMap data. Int. J. Remote Sens. 2013, 34, 5282–5295. [Google Scholar] [CrossRef]
- Deer, W.A.; Howie, R.A.; Zussman, J. Rock-Forming Minerals: Single-Chain Silicates, 2nd ed.; The Geological Society: London, UK, 1978; Volume 2A, p. 668. [Google Scholar]
- London, D.; Burt, D.M. Chemical models for lithium aluminosilicate stabilities in pegmatites and granites. Am. Mineral. 1982, 67, 494–509. [Google Scholar]
- Dill, H.G. A geological and mineralogical review of clay mineral deposits and phyllosilicate ore guides in Central Europe—A function of geodynamics and climate change. Ore Geol. Rev. 2020, 119, 103304. [Google Scholar] [CrossRef]
- Cerny, P. The Tanco pegmatite at Bernic Lake, Manitoba; VIII, Secondary minerals from the spodumene-rich zones. Can. Mineral. 1972, 11, 714–726. [Google Scholar]
- Asadzadeh, S.; Souza Filho, C.R. A review on spectral processing methods for geological remote sensing. Int. J. Appl. Earth Obs. Geoinf. 2016, 47, 69–90. [Google Scholar] [CrossRef]
- Quensel, P. Minerals of the Varuträsk Pegmatite: IV. Petalite and its Alteration Product, Montmorillonite. Geol. Fören. Stockh. Förh. 1937, 59, 150–156. [Google Scholar] [CrossRef]
- Quensel, P. Minerals of the Varuträsk Pegmatite: X. Spodumene and its Alteration Products. Geol. Fören. Stockh. Förh. 1938, 60, 201–215. [Google Scholar] [CrossRef]
- Foster, M.D. Interpretation of the Composition of Lithium Micas; United States Geological Survey Professional Paper: Washington, DC, USA, 1960; pp. 115–147. [Google Scholar]


| Sample | Friability | Petrography | XRD | Spectroscopy | Li2O (%) |
|---|---|---|---|---|---|
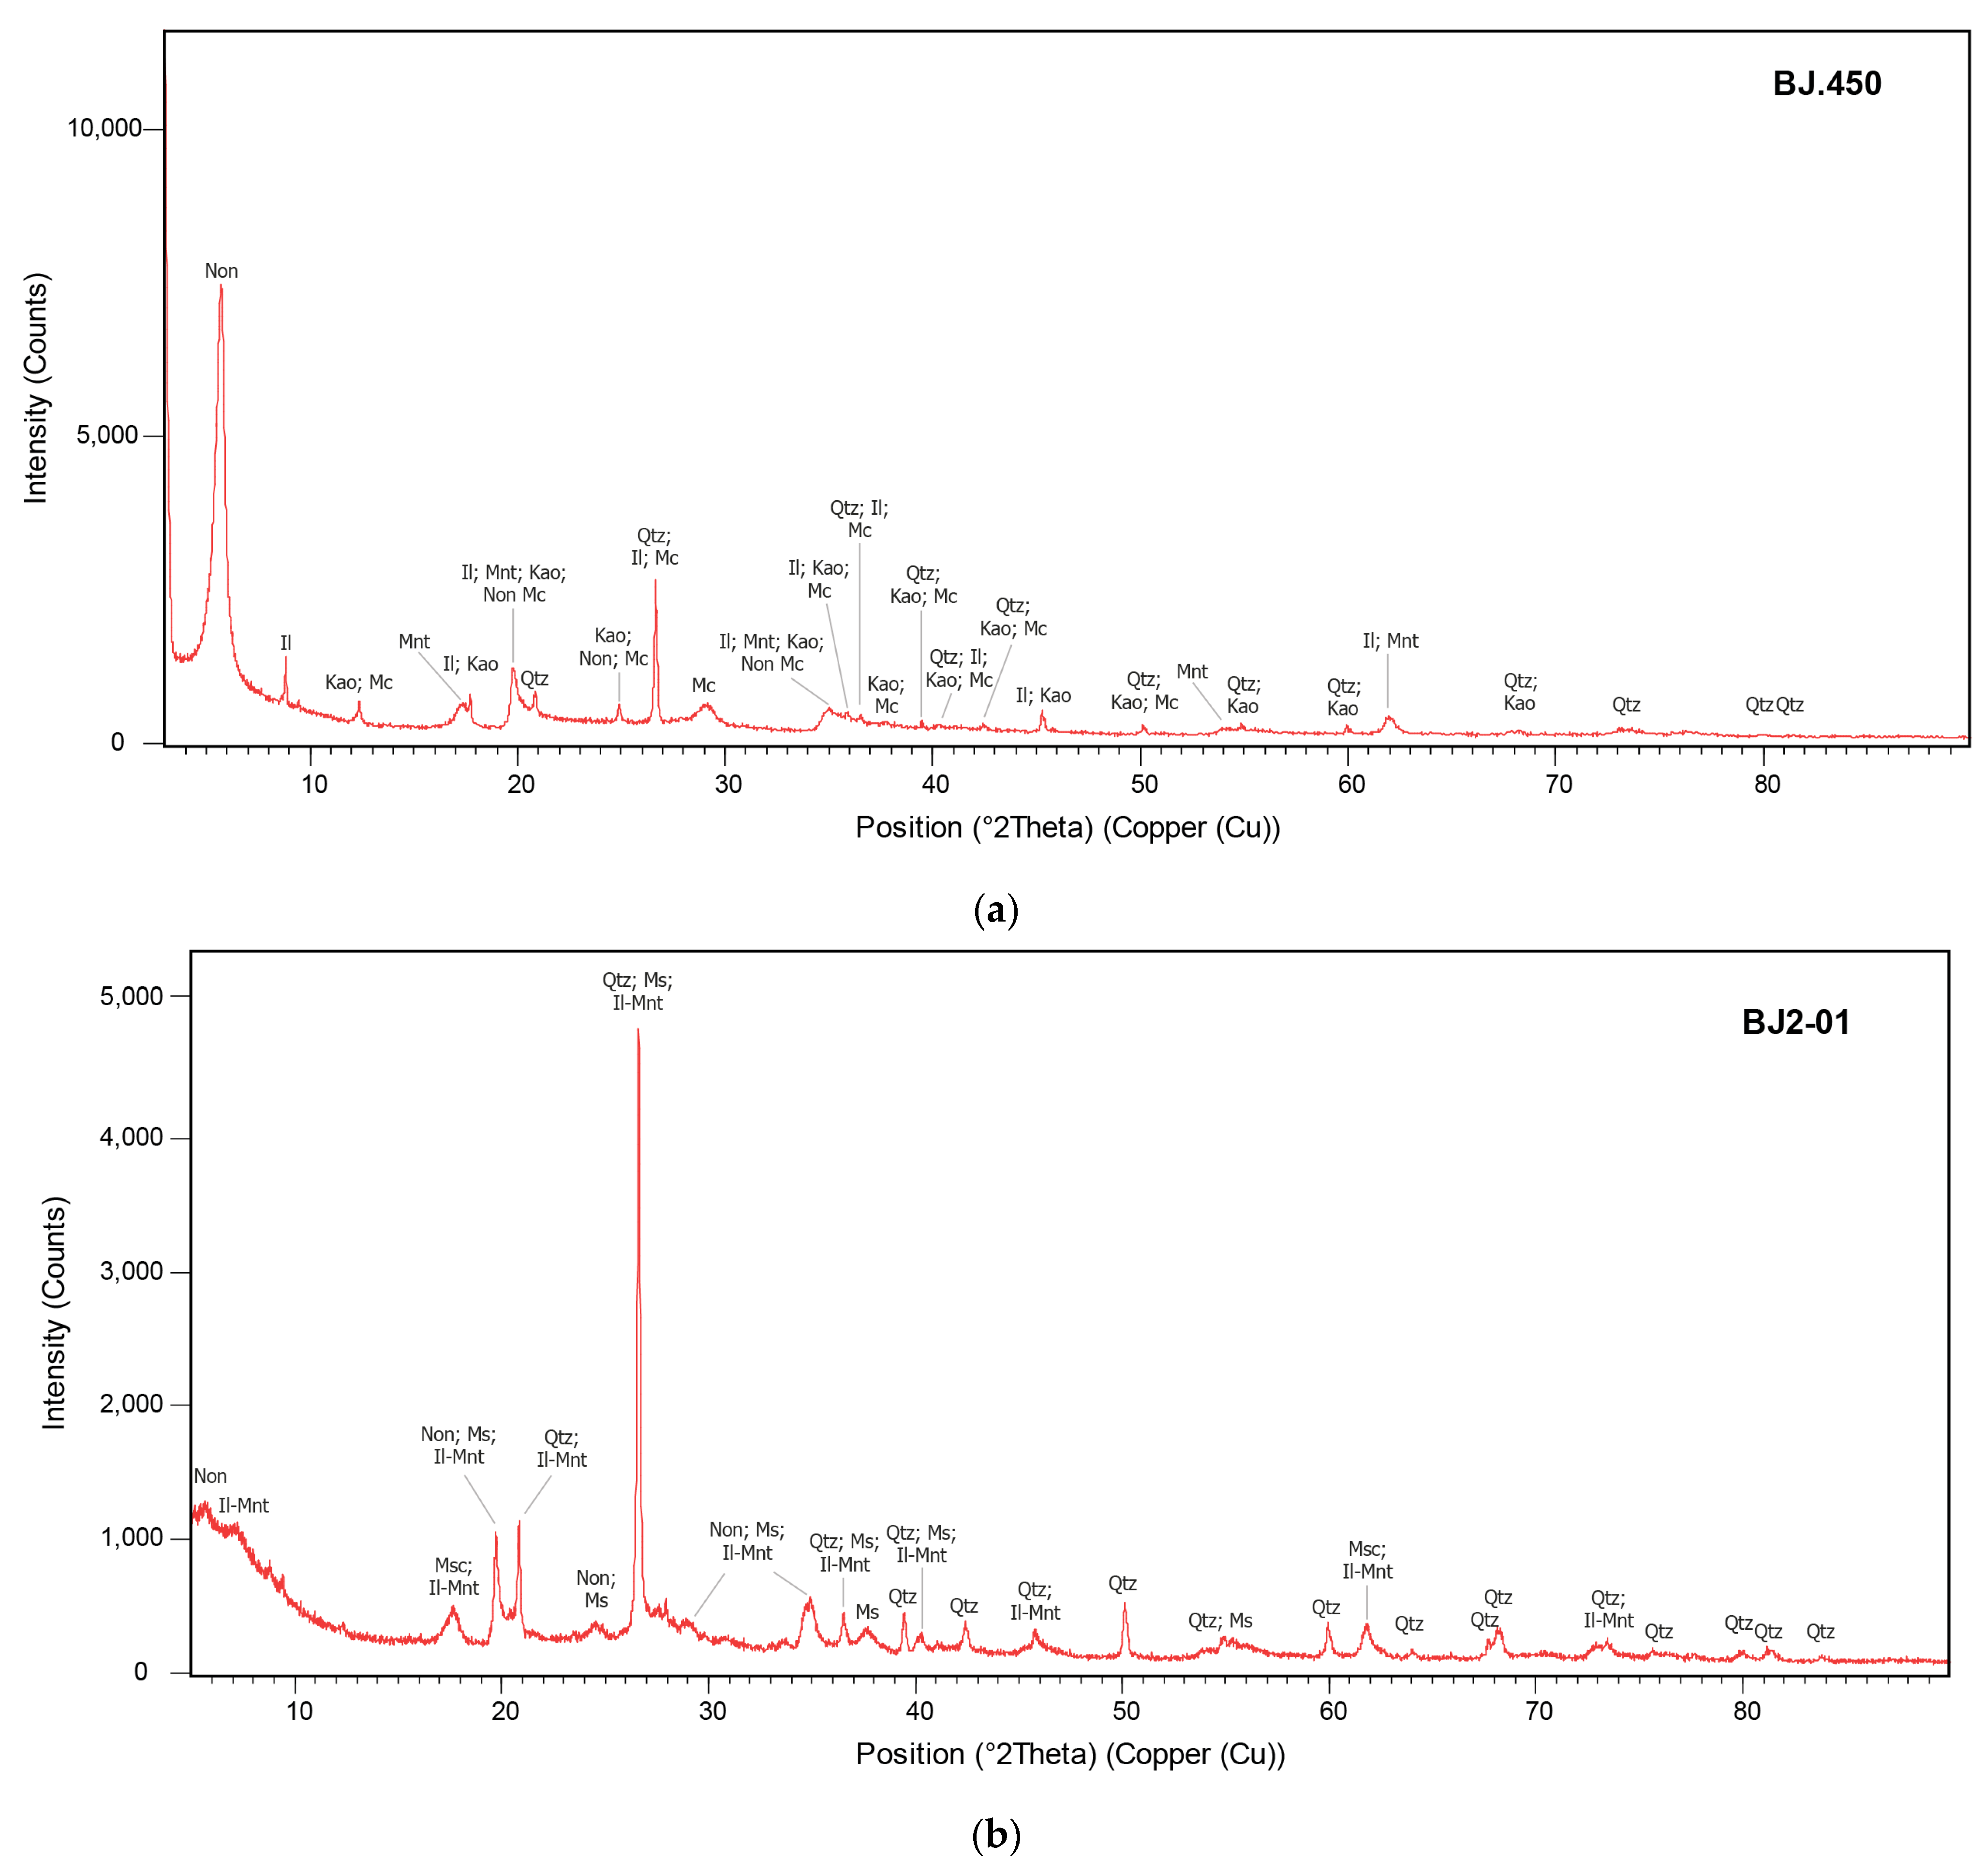
| BJ.450 | Friable | — | Qtz, Il, Mnt/Non, Kao | Mnt | 0.116 |
| BJ-20-12 | Friable | — | — | Mnt, Il/WM | 0.248 |
| HD.479 | Hard rock | Pet, Ser, Pl, Qtz, WM | — | Mnt, Il/WM | 4.585 |
| BJ2-01 | Friable | — | Qtz, Non, Msc, Il-Mnt | Mnt, Il/WM | 0.082 |
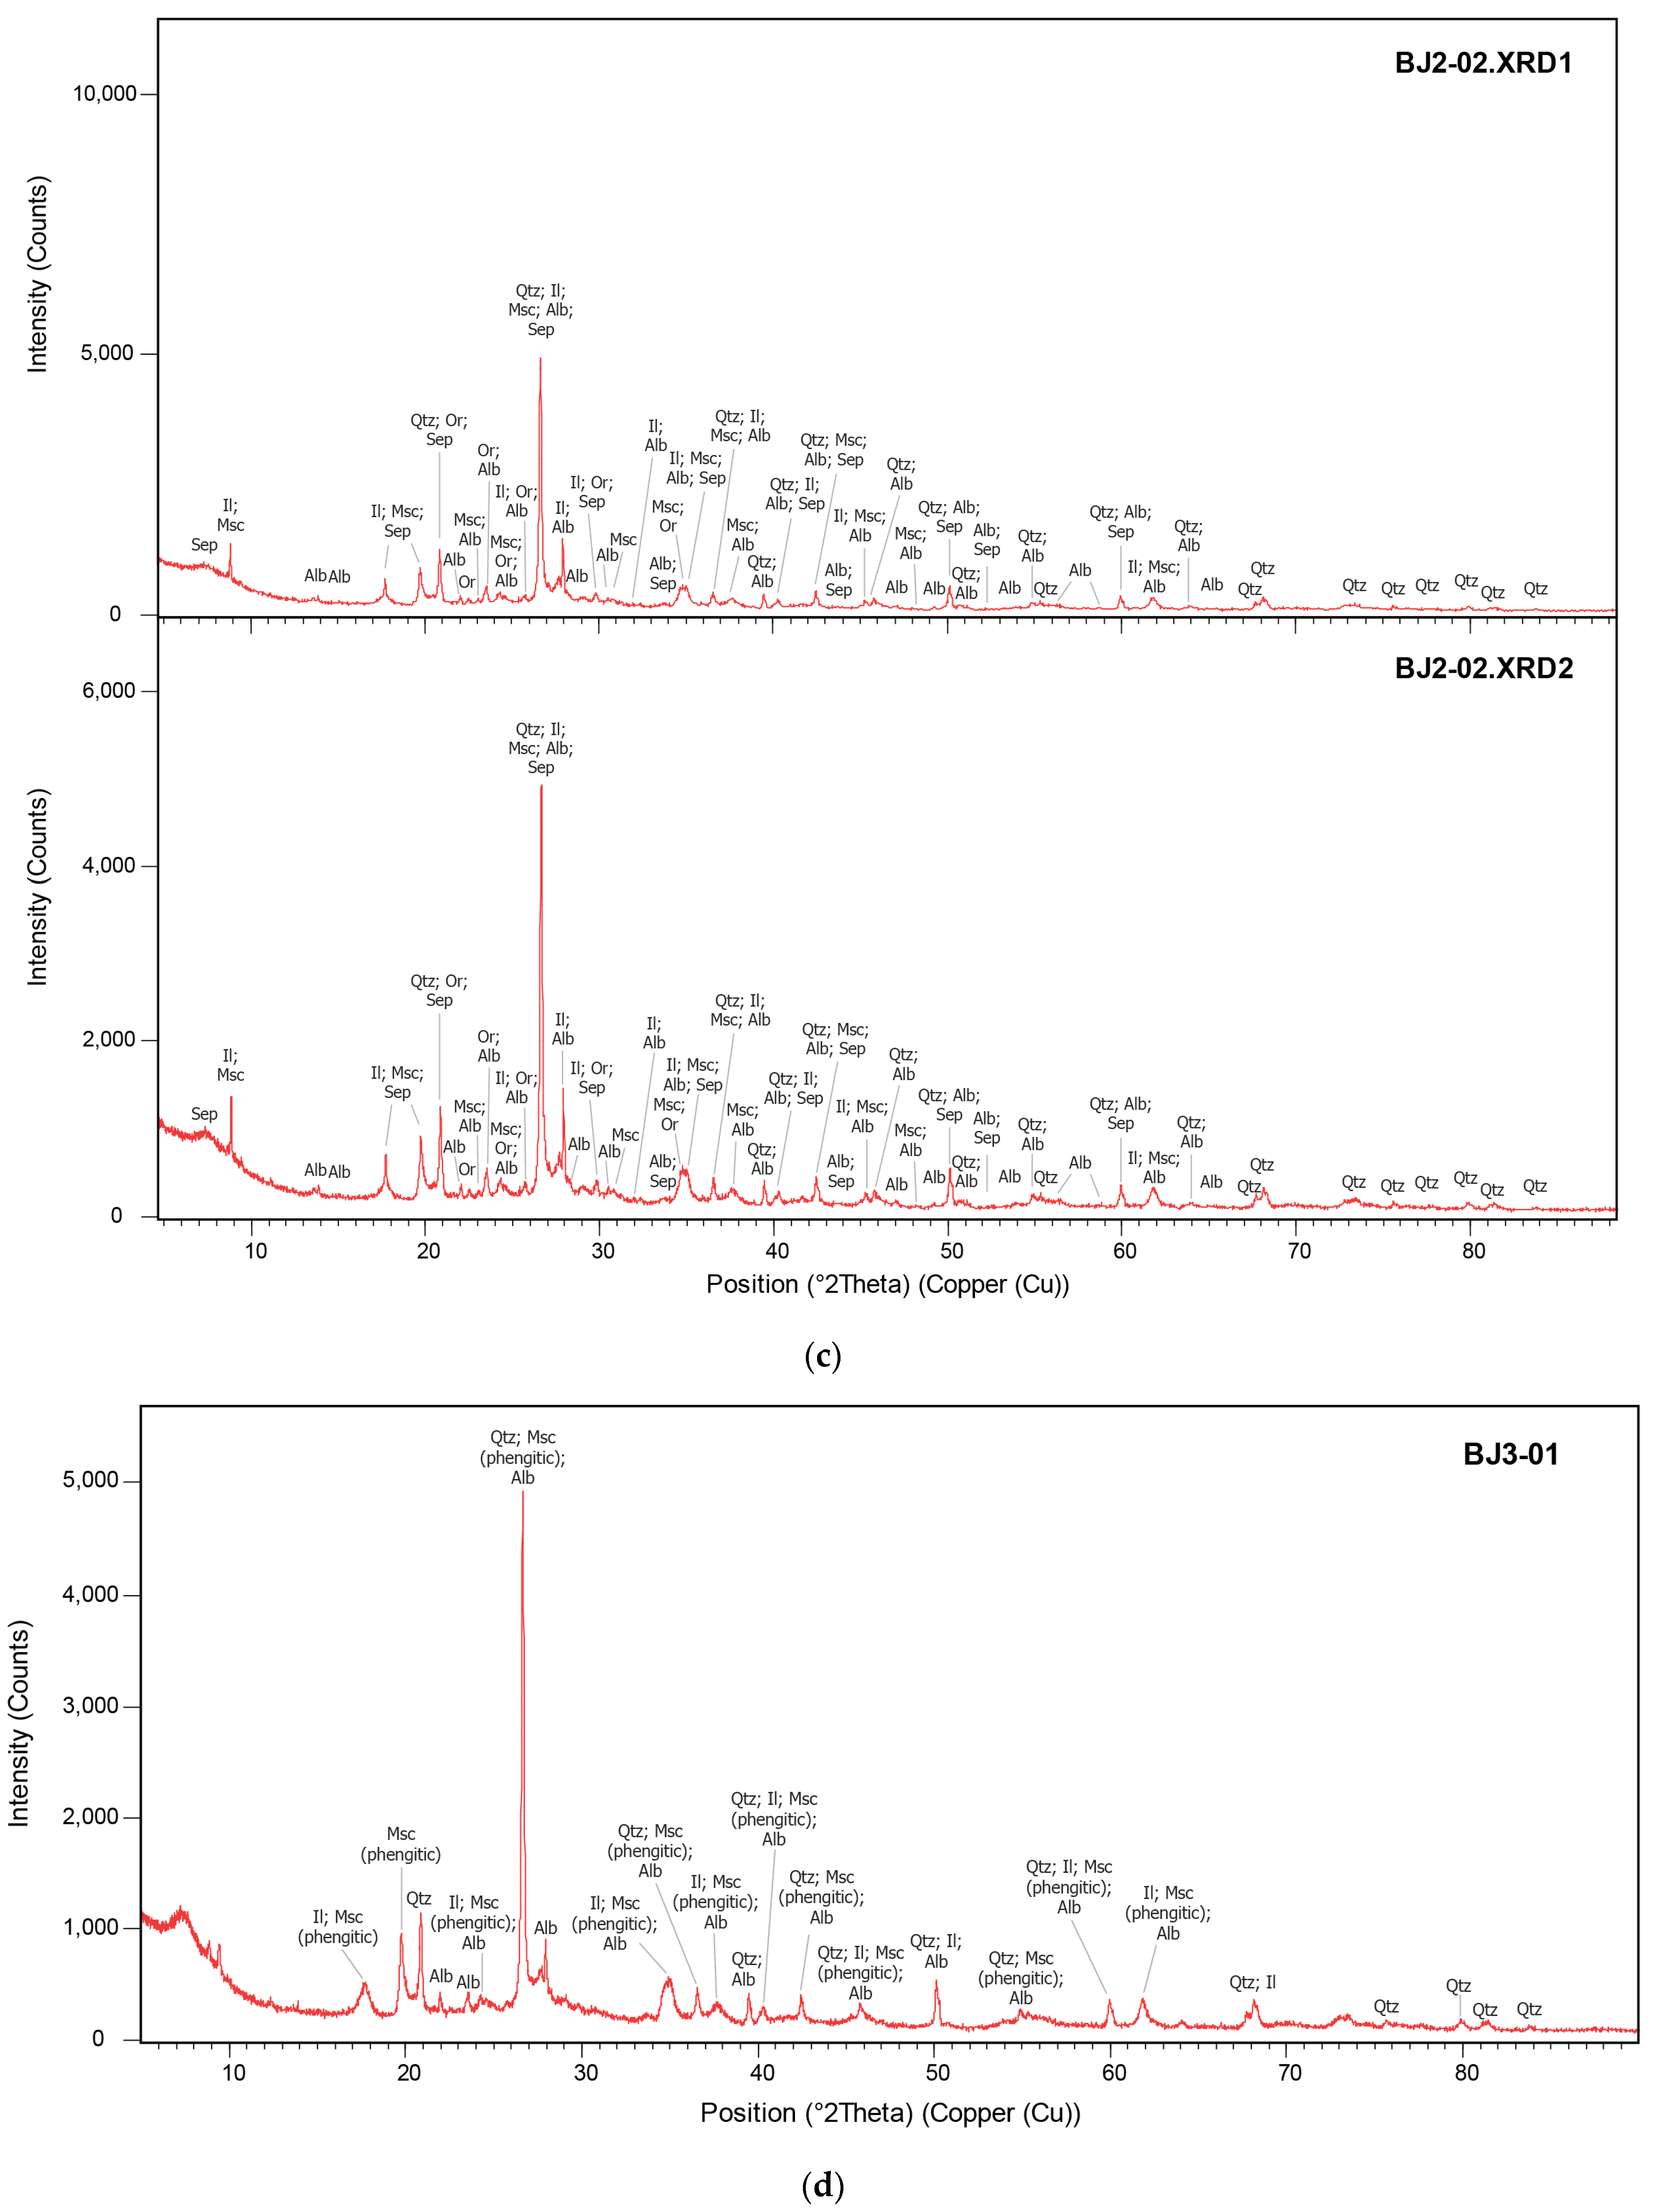
| BJ2-02 | Friable | — | Qtz, Il/Sep, Msc, Or, Alb | Mnt, Il/WM | 0.099 |
| BJ3-01 | Friable | — | Qtz, ll, Msc (phengitic), Alb | Mnt, Il/WM | 0.062 |
| BJ.451 | Hard rock | Cok, WM, Ser, Qtz | — | Mnt, Kao, Sap | 0.409 |
| BJ4-01 | Hard rock | Pet, Mnt *, WM, Pl | — | Mnt, Il/WM, Sap, Kao | 4.628 |
Publisher’s Note: MDPI stays neutral with regard to jurisdictional claims in published maps and institutional affiliations. |
© 2021 by the authors. Licensee MDPI, Basel, Switzerland. This article is an open access article distributed under the terms and conditions of the Creative Commons Attribution (CC BY) license (https://creativecommons.org/licenses/by/4.0/).
Share and Cite
Cardoso-Fernandes, J.; Silva, J.; Perrotta, M.M.; Lima, A.; Teodoro, A.C.; Ribeiro, M.A.; Dias, F.; Barrès, O.; Cauzid, J.; Roda-Robles, E. Interpretation of the Reflectance Spectra of Lithium (Li) Minerals and Pegmatites: A Case Study for Mineralogical and Lithological Identification in the Fregeneda-Almendra Area. Remote Sens. 2021, 13, 3688. https://doi.org/10.3390/rs13183688
Cardoso-Fernandes J, Silva J, Perrotta MM, Lima A, Teodoro AC, Ribeiro MA, Dias F, Barrès O, Cauzid J, Roda-Robles E. Interpretation of the Reflectance Spectra of Lithium (Li) Minerals and Pegmatites: A Case Study for Mineralogical and Lithological Identification in the Fregeneda-Almendra Area. Remote Sensing. 2021; 13(18):3688. https://doi.org/10.3390/rs13183688
Chicago/Turabian StyleCardoso-Fernandes, Joana, João Silva, Mônica M. Perrotta, Alexandre Lima, Ana C. Teodoro, Maria Anjos Ribeiro, Filipa Dias, Odile Barrès, Jean Cauzid, and Encarnación Roda-Robles. 2021. "Interpretation of the Reflectance Spectra of Lithium (Li) Minerals and Pegmatites: A Case Study for Mineralogical and Lithological Identification in the Fregeneda-Almendra Area" Remote Sensing 13, no. 18: 3688. https://doi.org/10.3390/rs13183688
APA StyleCardoso-Fernandes, J., Silva, J., Perrotta, M. M., Lima, A., Teodoro, A. C., Ribeiro, M. A., Dias, F., Barrès, O., Cauzid, J., & Roda-Robles, E. (2021). Interpretation of the Reflectance Spectra of Lithium (Li) Minerals and Pegmatites: A Case Study for Mineralogical and Lithological Identification in the Fregeneda-Almendra Area. Remote Sensing, 13(18), 3688. https://doi.org/10.3390/rs13183688