
Deep Learning-Based Method for Detection of External Air Conditioner Units from Street View Images

1
State Key Laboratory of Resources and Environmental Information System, Institute of Geographic Sciences and Natural Resources Research of Chinese Academy of Sciences, Beijing 100101, China
2
College of Resources and Environment, University of Chinese Academy of Sciences, Beijing 100049, China
3
Jiangsu Center for Collaborative Innovation in Geographical Information Resource Development and Application, Nanjing 210023, China
*
Author to whom correspondence should be addressed.
Remote Sens. 2021, 13(18), 3691; https://doi.org/10.3390/rs13183691
Submission received: 13 August 2021
/
Revised: 10 September 2021
/
Accepted: 13 September 2021
/
Published: 15 September 2021
(This article belongs to the Section Engineering Remote Sensing)
Abstract
:Heat waves may negatively impact the economy and human life under global warming. The use of air conditioners can reduce the vulnerability of humans to heat wave disasters. However, air conditioner usage has been not clear until now. Traditional registration investigation methods are cumbersome and require expensive labor and time. This study used a Labelme image tagging tool and an available street view images database to firstly establish a monographic dataset to detect external air conditioner unit features and proposed two deep learning algorithms of Mask-RCNN and YOLOv5 to automatically retrieve air conditioners. The training dataset used street view images in the 2nd Ring Road area of downtown Beijing. The model evaluation mAP of Mask-RCNN and YOLOv5 reached 0.99 and 0.9428. In comparison, the performance of YOLOv5 was superior, which is attributed to the YOLOv5 model being better at detecting smaller target entities equipped with a lighter network structure and an enhanced feature extraction network. We demonstrated the feasibility of using street view images to retrieve air conditioners and showed their great potential to detect air conditioners in the future.
1. Introduction
Heat wave disasters have become more frequent and severe with global warming [1,2] and have destructive impacts on national economies and human health [3,4]. With continued urban development, temperature records of major metropolises in the eastern coastal region of China (e.g., the Beijing–Tianjin–Hebei region, the Pearl River Delta, and the Yangtze River Delta) have surged significantly compared with those of surrounding cities; additionally, the urban heat island effect caused by urbanization enhances heat wave impacts [5,6]. Extreme heat waves are associated with increased mortality and the incidence of various underlying diseases [7,8], such as cardiovascular disease, acute kidney failure, dehydration, and acute respiratory disease [9,10].
In order to prevent and mitigate heat wave disasters effectively, evaluating the heat wave intensity level in different regions is essential. Whether metropolis residents have resistance to heat waves effectively helps in assessing the affected intensity of heat waves, which even provides some reference for the formulation of policies related to heat wave prevention and mitigation. Regarding the fact that different regions have diverse resistance levels, disaster prevention and mitigation policies formulated by local governors need to be adapted to local resistance conditions, so as to coordinate and deploy supplies to ensure efficient usage. Precisely, governments can publish inchoate high temperature warnings to remind residents of taking precautions where they might present high tolerance to heat wave disasters. Typical measures for mitigating summer heat include the indoor use of air conditioners and early interventions (e.g., media and inchoate warnings for individuals). In high-risk areas, targeted interventions (e.g., providing drinking water in public places, distributing cooling equipment to residents, providing food and hygiene advice, and guaranteeing adequate cooling shelters and medical relief facilities) are preferentially implemented. The use of air conditioners is the principal mitigation method that effectively addresses heat waves and directly reflects the ability of residents to cope with extreme heat waves. Additionally, efficient methods to evaluate the tolerance level of different regions towards heat waves do not exist. The data of air conditioner usage can directly reflect the ability of residents to cope with extreme heat waves. A higher prevalence of air conditioners in a region correlates to lower levels of heat wave disaster affectation. Therefore, the spatial distribution of air conditioners can be used to quickly and accurately assess the level of resistance to heat wave disasters to efficiently assist local governors in formulating disaster relief policies.
Traditional air conditioner information acquisition is complicated and expensive. Sources of air conditioner usage data include sales data from air conditioner companies and statistical data from local statistics bureaus, which do not provide easy and objective indications of air conditioner coverage and spatial distribution. Existing research on air conditioners generally involves air conditioner device and system configurations control, external cooling unit protection, air conditioner system resistance, information extraction systems, and sleep mode settings. Therefore, convenient and efficient registration methods are urgently required to promptly and efficiently extract the spatial distribution of air conditioner usage in certain domains. However, few studies address air conditioner extraction information.
Meanwhile, monographic datasets and feature extraction algorithms for air conditioner external unit feature extraction are deficient, which makes it arduous to accurately obtain air conditioner usage distribution data in certain domains.
Considering the above-mentioned disadvantages, this study establishes a monographic dataset to detect air conditioner external unit features and proposes a convenient low-cost method to identify external air conditioner units with deep learning algorithms in the target detection field.
This method can help decision-makers precisely obtain the number of air conditioners in certain areas for parameter spatialization to ascertain the popularity rate of air conditioners, which indicates tolerance and resilience toward heat waves. These usage data can efficiently assist local governors in formulating heat wave relief policies and heat wave forecasts that are adapted to local conditions in a combination of household numbers and population densities. Meanwhile, air conditioner popularity rate data can also be used to assist urban disaster prevention and disaster mitigation, evaluate urban infrastructure improvement, monitor urban electricity consumption, and help energy-saving planning in different regions.
With the rapid development of deep learning methods in artificial intelligence, convolutional neural network algorithms for semantic segmentation and target detection have made significant progress. Compared with traditional methods, deep learning algorithms efficiently extract classification features from the dataset and conveniently achieve the goal of automatic and efficient classification of target objects.
Significant deep learning achievements have been applied to computer vision, natural language processing, and various disciplines related to image processing [11]. Detecting objects in images is the primary prerequisite task in the computer vision domain. In target detection, distinguishing each entity in images and dividing it into different categories is the principal purpose. In current target detection tasks, this requires making specific distinctions among different entities of the same category. The target detection task in this study is distinguishing which pixel in each image belongs to external air conditioner units and further distinguishing individual external air conditioner units by attaching masks of different colors to selected pixels. In the field of target detection, the aim is to infer the required classification features from images and to classify target objects in images. Although traditional computer vision and machine learning methods meet the majority of the task requirements, the revolution of deep learning cognition algorithms represented by the surging development of convolutional neural networks (CNNs) has induced a significant method revolution in the field of target detection and semantic segmentation [12,13]. The accuracy and efficiency of deep learning algorithms have significantly improved compared with those of traditional methods.
The mainstream target detection algorithms in the deep learning field can be divided into one-stage target detection algorithms (YOLO series) and two-stage target detection algorithms (RCNN series) based on the number of stages in the algorithm structure. The two-stage detection algorithm includes two target detection processes including generating the candidate area and classification. For the two-stage detection algorithm, the candidate region extraction detector is the first detector to distinguish foreground regions and background regions. The classification of candidate regions and coordinate correction modules constitutes the second detector, which is used to compare the results of the first detector to make additions and corrections. The design of two target detection processes in the two-stage detection algorithm improves the accuracy of the algorithm, but also increase the model complexity and time cost, which restricts calculation efficiency. The one-stage detection algorithm directly applies algorithms to input images and generates candidate regions and object categories simultaneously through joint decoding. The one-stage target detection algorithm has an intelligible structure. It performs well in reducing time cost and enhancing computational efficiency. However, it is slightly inferior to the two-stage algorithm in the recognition efficiency of complex samples.
Based on the advantages and disadvantages of the two above-mentioned different stage target detection algorithms, this study uses the latest Mask-RCNN model in two-stage R-CNN series algorithms and the YOLOv5 algorithm in one-stage YOLO series algorithms for the analysis.
The most successful Mask-RCNN model in two-stage target detection algorithms is developed from the classic two-stage target detection algorithm R-CNN. Girshick et al. [14] proposed a target detection framework based on candidate regions and a CNN network in 2014, which is called RCNN network architecture. To extract the frame of the object containing the labeled object in the input images, RCNN first adopts the selection search strategy and uses the pre-trained DCNN network to extract features. Then, the RCNN uses linear classifiers such as SVM to segment objects from the background [14]. The network structure dramatically improves the detection performance of the target detection tasks. However, the time-consuming process remains expensive when the CNN network performs feature extraction tasks. To reduce the high time cost, several studies have improved the original SPP network-based RCNN using an end-to-end training method. Additionally, the RPN candidate regional network structure was introduced to form a new Faster-RCNN [15] network structure that further reduces the time cost required in the network training process. In 2017, Lin et al. built an FPN pyramid network model with better small entity recognition performance by utilizing the pyramid structure feature in a convolutional neural network to improve the detection performance of small entities in images [16]. Based on the previously proposed Faster-RCNN network, He et al. [17] optimized the basic network structure and proposed an updated convolutional network structure (Mask-RCNN) to complete both target detection tasks and semantic segmentation tasks in one theory. The most advanced innovation of the Mask-RCNN network is the effective semantic segmentation of entities and the simultaneous target detection task of entities in high-quality images. The theory of convolutional neural networks is generally successful in target segmentation and has gradually become the preferred theory.
As the most successful model in two-stage target detection algorithms, Mask-RCNN has been applied to many image segmentation tasks and has acquired superior reputation. In 2019, Facebook research published the fast, modular reference implementation of Mask-RCNN algorithms in the PyTorch module, which made Mask-RCNN become flexible and easy to deploy.
Mask-RCNN adopts a two-stage target detection structure. In the first stage, the RPN network is used to extract candidate boundary boxes. In the second stage, RolAlign is used to extract features, carry out category classification, and complete boundary box regression and binary mask generation from candidate regions generated in previous RPN networks. The previously proposed Faster-RCNN is not designed for instance segmentation tasks at the pixel level. Especially in the process of ROI pooling in Faster-RCNN, rough expressions are made for the entities feature. In order to correct the possible “misalignment” problems between pixels, Mask-RCNN is designed with a new RolAlign structure to replace the ROI pooling structure. The RolAlign structure solves pixel alignment between the original image and feature map and pixel alignment between the feature map and ROI to improve the detection accuracy. The design of the RolAlign structure makes Mask-RCNN suitable for instance segmentation tasks and also improves the training accuracy. Meanwhile, Mask-RCNN innovatively proposes a multi-task network structure, which significantly improves the algorithm’s performance without increasing complexity. The network design of Mask-RCNN also achieves the decoupling of mask prediction and category prediction. Mask-RCNN predicts k kinds of binary masks for each ROI. Compared with FCN (full convolutional network), Mask-RCNN has significantly superior performance. The classical FCN network mainly predicts k kinds of categories for each pixel, which aggravates the algorithm complexity.
As classic algorithms in one-stage target detection algorithms, YOLO algorithms are the first one-stage target detection algorithms that have achieved satisfying results in detection accuracy and speed. YOLO algorithms are added with a classifier and designed with a brand new loss function to ensure multiple types of targets can be detected completely. In addition, YOLO algorithms contain an advanced designed feature extraction network to achieve the goal of efficient detection and lightweight overhead. As the first target detection algorithm with the function of deep learning that also supports real-time operation, YOLO algorithms have drawn widespread attention.
YOLOv1 [18] initially proposes a detection approach, which is different from the R-CNN series, and considers target detection as a regression task. YOLOv1 directly takes the entire image as an input and outputs the position information of bounding boxes and the object category in the output layer. The YOLOv1 algorithm has high real-time performance but has relatively weak performance in its detection of small targets as the algorithm prediction is achieved through roughly divided 7 × 7 grids of an entire image. In addition, it can only predict one category of each grid and is unable to predict multiple categories falling on the same grid simultaneously. Regarding problems in the YOLOv1 algorithm, YOLOv2 [19] applies the principle in the Faster-RCNN algorithm to divide each original image into 13 × 13 grids and introduces anchors in the algorithm. Through a cluster analysis, YOLOv2 sets up five anchors in each grid, with each anchor predicting one category. Through a regression analysis of the target position information by predicting the offset between the anchor and the grid, the performance of the YOLOv2 algorithm is effectively improved. In order to enhance the accuracy of the YOLO algorithms for small target detection, YOLOv3 [20] adopts the extraction network Darknet-53 for more in-depth features on the basis of the previous two generations of algorithms. YOLOv3 also uses three scales of features for target detection while increasing the number of anchors. Due to complex design in the model’s structure, the training speed of YOLOv3 is reduced compared with YOLOv2. However, the detection accuracy in YOLOv3 is significantly improved because of its effective detection design of small targets. While improving the non-linearity degree of YOLOv3, the generalization performance and network accuracy are also enhanced. Based on the original YOLOv3 architecture, YOLOv4 [21] introduces the best optimization strategies in the CNN field in recent years, such as the design of CSPDarknet53, SPP, and the PAN framework. These improvements effectively optimize YOLOv4 in many aspects, including data processing, backbone network, network training, activation function, and loss function. All these improvements enable YOLOv4 to achieve extraordinary training performance. The latest YOLOv5 algorithm [22] released in June 2020 is proposed on the basis of the PyTorch framework. The previous four versions of YOLO algorithms were developed on the basis of the DarkNet framework. Implementation in the PyTorch framework enables the YOLOv5 model to achieve more concise understanding, training, and deployment. YOLOv5 adopts a lighter network structure and adopts the enhanced feature extraction network to take the place of the PAN framework, making the model simpler and faster in training speed. Although no papers related to YOLOv5 have been published, YOLOv5 has splendid accuracy performance compared with YOLOv4. YOLOv5 has a lighter model structure and faster model training speed compared with YOLOv4 based on the YOLOv5 code structures that have been released in June 2020 and the high-frequency optimization code. Additionally, YOLOv5 has been favored by a large group of authoritative researchers and is increasingly adopted in various competitions.
In recent decades, the use of Google Street View (GSV) or other Opensource Street View platform images for evaluating street-level urban factors has become a popular research topic. Maniat et al. [23] used a CNN to classify pavements into different defined crack categories from GSV images. Kang et al. [24] used a random forest classifier to establish an automated street-level sidewalk detection method with GSV image data to efficiently evaluate public sidewalk GIS data. Lumnitz [25] et al. used the famous mask regional convolutional neural network (Mask R-CNN) to detect and locate separate tree entities among street-level images to achieve excellent urban forest management. Zou et al. [26] also used a deep learning algorithm to automatically and efficiently detect abandoned houses (AH) using the open-source GSV dataset. Dick et al. [27] used the YOLO algorithm to automatically extract advertised gas prices from GSV imagery and successfully established the Gas Prices of America (GPA) dataset using the United States of America GSV imagery.
Compared with the original and mature computer vision and machine learning methods, the theory of CNN remains in development. However, several CNN methods have accomplished essential success in the field of target segmentation, and have gradually become the preferred theory.
Owing to mature target detection algorithms and platforms that provide a diversity of urban street view image datasets, the tasks of this study establish a monographic dataset to detect external air conditioner unit features and propose a methodological approach to automatically detect external air conditioner units.
In this study, Mask-RCNN and YOLOv5 deep learning algorithms were used to identify external air conditioner units on both sides of the roads in the Beijing 2nd ring from street view images, respectively. The quantity of air conditioners in street view images in several blocks was indirectly obtained by identifying the external air conditioner units in the images. This study proposes a convenient and low-cost detection method to extract external air conditioner unit features by applying Mask-RCNN and YOLOv5 theories in target detection tasks. Additionally, this study provides inspiration for the subsequent realization of the spatialization of air conditioner external units and completes the lower-cost and essential extraction goal of air conditioner information extraction.
2. Materials and Methods
2.1. Street View Image Selection
Several existing public databases do not include external air conditioner unit features. Therefore, this study proposes the use of a manual annotation method for available and high-quality street view images to construct a monographic training dataset for air conditioner external units for the first time. The dataset was selected from street view images provided by the Baidu Street View online map platform and consists of several street view images within the 2nd ring road area of Beijing. The Labelme image annotation tool was used to further annotate street view images for labeling the target entity (external air conditioner units), and a trainable air conditioner external unit thematic dataset was obtained.
Owing to the complication of entity categories contained in the street view images, the limitation of the camera shooting sites selected on different roads, and the immeasurable distance between the buildings on both sides of the street and random selected shooting points, several external air conditioner units only occupy a small proportion in several street view images. External air conditioner unit objects occupy few pixels in a 1024 × 1024 street view image and provide few features, whereas the background provides multiple features (Figure 1a). Entity coverage disturbances and the phenomenon of shadow coverage are caused by inappropriate shooting angles.
This study adopts the following three standards to conduct strict preliminary selection in 18,607 street view images according to the conditions of external air conditioner unit entities in the images before the next labeling step:
- The number of building floors within the camera frame is defined with a limit of 10 to satisfy the requirement of the entity target size of less than 128 × 128, which is standard among existing public datasets;
- This study selected street view images of air conditioner external unit entities with a horizontal front shooting view and inconspicuous distortion and removed street view images with excessive deviation of the camera angle value (Figure 1b);
- Irregular or fragmentary shapes of air conditioner external units caused by urban street vegetation covering (Figure 1c) and covering by other objects (Figure 1d) on both sides of streets exist frequently in several street view pictures. The characteristic of these severely covered air conditioner external units is far more complicated and significantly different compared with other intact entities. Adding the fragmentary entities into the training dataset will add a lot of noise features into the training process because the fragmentary entities are of significant randomness with dissimilar irregular shapes. However, unlabeled entities are added to the background category. Adding the fragmentary entities that contain part of target features into the background category will affect the accuracy of target feature extraction. To address these problems, this study removed images containing external air conditioner units severely covered by trees or other entities.
We selected 533 street view pictures that met the afore-mentioned requirements from 18,607 street view pictures downloaded within the 2nd ring road area of Beijing. The training dataset included 1502 external air conditioner units.
2.2. Target Entity Annotation
The target detection task of an image corresponds to image classification at the pixel level. The purpose of target detection tasks is to mark the same classification label for the target entity belonging to the same category to classify all the entities in the image. We manually informed the machine of the category of each entity before implementing the deep learning method to automatically classify the entities in the images. Therefore, marking the object categories of the sample data is essential. The labeling tool used in this study is Labelme, an open-source image labeling software developed by the MIT Artificial Intelligence Laboratory (MIT CSAIL).
This study used the Labelme image annotation tool to label the target entities in selected street view images. Figure 2 shows some of the labeled images. The Labelme tool generates the annotation files in JSON format. JSON-formatted source data files should be promptly modified to the target format when imputing Mask-RCNN and YOLOv5.
To facilitate the Mask-RCNN input, this study converted each JSON file into a new expanded dataset folder that included the original image JPG file, format files generated by the extension process—Info.yaml, Label.png, Label_Viz.png—and Label_Names.txt text files attached to annotated category names.
In this study, JSON-formatted source data files were converted to txt files, which includes 5 indexes—object-class-id (category number), x (the abscissa of the target center point/the width of the image), y (the ordinate of the target center point/the height of the image), width (the width of the labeled target entity/the width of the image), height (the height of the labeled target entity/the height of the image)—to facilitate the YOLOv5 input. Except for the category number index, the other 4 indexes mentioned above are normalized to the width and height of images, respectively, and the four scale coefficients in the 0–1 interval are obtained.
Combined with the selected result of labeling software Labelme, we visualized 1502 labeled external air conditioner units. The visualization results of four normalized indexes are shown in Figure 3. The light color of the points in one dense area indicates a phenomenon of a large number of points crowded in that area. On the contrary, the dark color of the points in one area shows that few points fall in that area. From the regional distribution of the drop points in Figure 3, a phenomenon of uneven distribution of the target category points is especially obvious and indicates that the target features that need to be classified are more complex. This phenomenon becomes a common situation in target detection tasks. Figure 4 shows expectation result graphs in our recognition task.
Figure 3a shows the distribution of marking the center point of each air conditioning unit in each street view image. An obvious phenomenon of randomness occurs in the distribution of external air conditioner unit entities in street view images. Figure 3b shows the normalized scale coefficient between the length and width of the labeled boxes to the length and width of the real street view images. Figure 3b indicates that the size of labeled air conditioning unit frames is random in the whole dataset, and large labeled frames and small labeled frames coexist. Meanwhile, Figure 3b also shows that the red area representing the concentrated distribution of labeled frames is densely distributed in the area with smaller values. This phenomenon indicates that most of the labeled air conditioning unit entities are of small size. Compared with the size of the whole street view images, the size of the labeled air conditioning unit boxes is small. Therefore, the features contained are also deficient, which affects the feature extraction.
2.3. Mask-RCNN Network Model
After completing the above-mentioned tasks of selecting the street view images and adding classification labels, we used the Mask-RCNN network model to train model files and output the final prediction result.
Mask-RCNN is an improved convolutional neural network model with excellent performance based on the previous Faster-RCNN network structure proposed by He [17]. Mask-RCNN uses an efficient network design for three image recognition tasks: target detection (giving the category and location of the object by pointing to the location in the form of an external rectangle box), instance division (providing the location of the attached segmentation objects with more detailed information in the form of the mask of the area), and key point detection (predicting the semantic key point and position of multiple objects). Mask-RCNN achieves superior recognition results compared with the Faster-RCNN network structure proposed by the same author. Mask-RCNN is improved to become an instance segmentation network on the network basis of Faster-RCNN.
Mask-RCNN adopts the same two-state basic structure as the previous generation of Faster-RCNN. First, a region proposal network is obtained through a one-stage network. Then, the ROIs found by the region proposal network are classified and located. Finally, the network determines the binary masks. Mask-RCNN differs from other networks in the processing sequence by searching for masks before classifying their categories.
The region proposal network (RPN) (the regional recommendation network) is used to recommend regions of interest (ROIs). RPN was first proposed in the Faster-RCNN network structure and was used to extract candidate boxes [17]. In the Faster-RCNN framework, the author proposes RPN to solve the problem of expensive time cost in traditional selective search methods for candidate box extraction. RPN can be combined with the convolutional neural network and integrated into other network algorithms.
In the Mask-RCNN network design, the author optimizes the original ROI pooling structure, which is implemented in the Faster-RCNN network with a regional feature aggregation to obtain an excellent network structure (RoIAlign). RolAlign solves the misalignment problem in ROI pooling, which is easily caused by the original two quantized steps.
In common two-stage detection frameworks (e.g., Fast R-CNN, Faster-RCNN, and RFCN), the processing notion of ROI pooling is to pool the corresponding area into a fixed-size feature map based on the previously obtained coordinate information of the pre-selection box position for the purpose of facilitating the subsequent classification and regression of the surrounding boxes. The position of the pre-selection boxes is usually obtained by model regression, and the position information of the pre-selection box is generally generated in floating-point type form. Therefore, the network structure requires the pooling feature maps to generate a definite fixed image size. ROI pooling is designed for the network and performs two quantization processes. However, the resulting position of the candidate boxes has a certain coordinate deviation compared with the position generated from the initial regression. This coordinate deviation affects the accuracy of the subsequent detection and segmentation processes, and He et al. named this problem “misalignment” [17].
To solve the above-mentioned misalignment, RoIAlign eliminates the quantization operation of ROI pooling and using bilinear interpolation instead of obtaining the coordinate value of pixel points. Thus, the original ROI pooling feature gathering process is transformed into a continuous operation process.
The backbones of previous generation Faster-RCNN are Resnet50 and Resnet101. Mask-RCNN uses a new ResNet network as a backbone, which adds an efficient backbone element (FPN) to the Faster-RCNN backbone.
FPN was proposed to efficiently merge the generated feature maps. Traditional networks use the feature map generated directly in the last layer. However, the position information and resolution of the feature map are of poor quality, which is hard to satisfy the data accuracy requirements for the recognition tasks of small target entities. The FPN structure was introduced into the Mask-RCNN network to solve the above-mentioned problems and integrate all feature maps from the bottom to top levels to take maximum advantage of features extracted from the ResNet backbone (i.e., the C2–C5 layers in the ResNet network).
2.4. YOLOv5 Network Model
After implementing the Mask-RCNN network model to train model files and output the final result, we also used the advanced one-stage YOLOv5 network model to complete our task as a comparative experiment.
YOLOv5 is an improved convolutional neural network model with excellent improvement based on the previous YOLOv4 network structure in one-stage target detection algorithms [22]. The YOLOv4 network combines the latest theories on the basis of the YOLOv3 network. Regarding the latest data enhancement technology applied in the YOLOv4 network [21], YOLOv4 not only uses classic geometric distortion and illumination distortion processing in one image, but also innovatively uses image occlusion (Random Erase, Cutout, Hide and Seek, Grid Mask, MixUp) technology. YOLOv4 mixes CutMix and Mosaic technologies in multi-image combination. YOLOv4 also uses Self-Adversarial Training (SAT) to assist data enhancement. YOLOv4 uses CSPDarknet53, mish activation function, and Dropblock on the network backbone, which simplifies the model calculation and ensures model accuracy. In the publicly available YOLOv5 model architecture, YOLOv5 uses a network architecture on the basis of YOLOv4, which acquires splendid training accuracy. However, YOLOv5 has been greatly improved in flexibility, model deployment, and operating speed compared with YOLOv4.
YOLOv5 transmits each batch of training data through the data loaders and enhances the training data. The data loaders of YOLOv5 mainly implement three data enhancement methods including scaling, color space adjustment, and mosaic augmentation. The mosaic augmentation method can effectively solve problems in extracting small target entity features in this study.
YOLOv5 anchors belong to a kind of auto learning bounding box anchor, and anchors are automatically selected in different training data based on algorithms. Regarding the fact that the target recognition framework is required to scale the original image size and sizes of target entities in images are different, YOLOv5 proposes a new idea of automatically learning the size of anchor boxes. Compared with the YOLOv4 network, the adaptive anchor boxes design in YOLOv5 facilitates parameter tuning in the training model.
YOLOv5 and YOLOv4 take CSPDarknet as a backbone to extract rich information features from the input images. CSPDarknet integrates CSPNet (Cross Stage Partial Networks) with the traditional Darknet network principle. The implementation of CSPNet solves the problem of repeating gradient information in network optimization of the framework backbone in other large-scale convolutional neural networks. CSPNet integrates the gradient changes into a feature map and reduces the types of model parameters and FLOPS values. CSPNet guarantees the model’s superior processing speed and accuracy, and reduces the size of the generated model files. YOLOv5 also adds a focus mechanism on the basis of the original CSPDarknet as the backbone in the model. YOLOv5 inputs the original images into the focus structure and uses slicing operations to generate huge numbers of feature maps. Then, a convolution operation of multiple convolution kernels is carried out to achieve the effective extraction of entity features.
The next network structure following the backbone is the neck, which is used to generate feature pyramids. Feature pyramids enhance the model’s detection of objects at diverse scales to facilitate its recognition of the same category entities in different scales. The FPN network [16] has been the state of the art at the feature aggregation layer in the object detection framework until the PANET network was proposed. On the basis of Mask-RCNN and FPN frameworks, several exquisite improvements have been made in PANET [28] to strengthen the information dissemination capability. The feature extractor of the PANET network adopts the design of the new FPN structure, which enhances the bottom-up path and improves the propagation of low-level features. Through horizontal connections, the output of the PANET network is added to the top-down path in the same stage feature maps, and provides the information for the mask prediction in the next stage. The PANET network also uses an adaptive feature pooling strategy to restore information paths among candidate areas or different feature levels that may be destroyed and aggregate candidate areas. In the adaptive feature pooling strategy, each proposal uses the features of all layers in the feature pyramid to avoid the random allocation of proposals. In the YOLOv4 [21] network, YOLOv4 maintains the SPP module in the previous YOLOv3 network and uses FPN + PANET as a neck design, which achieved excellent algorithm performance to aggregate features for the first time. PANET is therefore considered to be the most suitable feature fusion network for YOLO networks. YOLOv5 draws on the advantages of the previous YOLOv4 network and also uses FPN + PANET as a neck network to aggregate features. Compared with the YOLOv4 network, the YOLOv5 network also adds the CSPNet structure to its backbone network. However, a new CSPNet structure is implemented in the neck structure in YOLOv5 design. Taking the YOLOv5s network applied in this study as an example, the first CSPNet structure CSP1_X is used in the backbone network, while the second CSPNet structure CSP2_X is used in neck. The neck structure of YOLOv4 adopts the ordinary convolution operations. In the YOLOv5 neck structure, the CSP2 structure designed by CSPnet is adopted to strengthen the ability of network feature integration.
The final general detection layer is mainly used for the final detection process, which applies anchor boxes on the feature maps and generates the final output vectors with class probabilities, object scores, and bounding boxes. In the YOLOv5 network, the design of the general detection layer is similar to that of the previous YOLOv3 designs and YOLOv4 design.
In the official code of YOLOv5, 4 versions of the target detection network are given, namely YOLOv5s, YOLOv5m, YOLOv5l, and YOLOv5x. The network structure of the four models is similar. Since we only detected one target category, we used the YOLOv5s model with the performance of the fastest training and the fewest parameter tunings. The YOLOv5s network has the smallest feature map depth and feature map width in the YOLOv5 series. The other three networks have deepened and widened on the basis of the YOLOv5s network. YOLOv5s can be quickly deployed, acquires the least model overheads, and performs splendidly.
3. Results
The experimental environment selected in this study was Python 3+ TensorFlow+ Pytorch. The graphics card type was Tesla V100. Two graphics cards were used in this study. The graphic memory of each card was 16G.
In this study, the widely used and publicly available pre-trained coco weight file was used as the initial weight based on the idea of parameter migration and taken as the initial retraining weight of the pretraining model in the Mask-RCNN training process. The object characteristics of the street view images are dramatically complicated, and the number of negative samples obtained in the background is larger than the number of air conditioner external units; therefore, the minimum probability value controlling the rule of accepting the detected instance was set as 0.6. This value indicates that samples with an intersection ratio between the candidate region and the marked frame greater than 0.6 are considered positive samples. The non-maximum detection suppression threshold was set to 0.2, which indicates that a target area with an intersection ratio between the candidate region and the marked frame of less than 0.2 does not participate in the training process. Thus, target areas with intersection ratios from 0.2–0.6 are background entities.
In the training of Mask-RCNN, the initial learning rate was set to 0.01. After training for 50 epochs, the learning rate dropped to 0.0024 for training the next 100 epochs. Owing to GPU computing power limitations, the entire training process was divided into three sessions, each of which ran for 50 epochs. At the beginning of each new session, the loss value experienced an initial oscillatory surge before reverting to the change trend of the epoch in the previous sequence. Because the image size was 700 × 1024, each graphics card was prescribed to process three pictures in each turn. In the training of Mask-RCNN, the batch size was set to six; each epoch trained 890 steps.
In the training of YOLOv5, the initial learning rate was set to 0.01. The training model was trained from scratch. YOLOv5 applied the SGD (stochastic gradient descent) training strategy combining momentum theory for training 300 epochs. The SGD strategy dynamically takes a random sample from the dataset and calculates the relevant error gradient. Therefore, SGD can dynamically adjust the current learning strategy to make the model converge to a more accurate minimum quickly. However, the disadvantage of the SGD strategy is obvious because its dynamic update direction completely depends on the current epoch, which leads to an extremely unstable update direction. In order to solve this problem, YOLOv5 introduces Nesterov momentum theory. Basic momentum theory is used to make the model converge quickly when the training gradient direction is unchanged. Once the training gradient direction changes, the design of basic momentum theory will help to reduce the fluctuation of the gradient value. Nesterov momentum theory (the accelerated gradient descent theory) is an improvement on the traditional momentum theory. The gradient update method in Nesterov momentum is based on prediction and dramatically improves the responsiveness of the algorithm. In this study, we set Nesterov momentum to 0.937. Owing to the lightweight network structure of YOLOv5, we changed the batch size to 25 in the YOLOv5 training process.
Because the accuracy is based on four simple object classification criteria (true positive, false positive, true negative, and false negative), the accuracy index is universal and convenient for calculating classification algorithms. However, accuracy is not frequently used in the evaluation of advanced network framework tasks, such as detection or segmentation tasks. Accuracy is generally used to evaluate the global accuracy of the model and is unsuitable for evaluating the performance of models containing abundant entities and comprehensive features. Therefore, the accuracy is not the best evaluation index for model evaluation in this study. Thus, the following evaluation indexes were chosen: precision, recall, F1 score, and mAP.
In target detection papers, mAP is used to evaluate model performance. The majority of studies regard mAP as the most significant performance evaluation index for target detection model evaluation. In the model evaluation task in this study, the precision, recall, F1 score, and mAP of the models trained by the Mask-RCNN and YOLOv5 networks were calculated to numerically measure the recognition performance of the model.
The concept of mAP is derived from precision and average precision (AP), which numerically describes the model performance. According to the conceptual definition of the target entity binary classification problem, the real category of the target entities and the category predicted by the classification algorithm can be set as evaluation guidelines. The existing target entities can then be classified into four categories according to the two evaluation conditions: true positive, false positive, true negative, and false negative. The true positive entities primarily refer to the object recognized as true in both prediction and actual data annotation processes. Precision is defined as the proportion of true positive entities to the number of objects identified as true in the algorithm recognition process. Recall refers to the proportion of true positive entities to the number of the whole objects labeled as true. Therefore, precision and recall are set as the ordinate and abscissa of the function, respectively; the forming function curve is called the precision–recall function curve, and the AP value is the value of the area between the curve and the coordinate axis.
The mean average precision (mAP) is the AP value of multiple entity categories. The value of mAP in the experiment is between 0 and 1. The model recognition performance is superior with high mAP scores. The index is essential for evaluating the performance of target detection algorithms. Because only one category of target entities was selected, mAP and AP had the same value for calculating the evaluation index.
The F1 score is the harmonic mean of the precision and the recall and is used to measure the accuracy of the binary classification model and of the precision and recall in the classification model. The F1 score is defined as the harmonic average value of precision and recall, which considers the accuracy ratio of model recognition reflected by the precision value and the simultaneous recall ratio reflected by the recall value when the two indexes conflict.
In summary, precision measures whether the model has been misjudged and recall measures whether the model has missed the target entity. The mAP and F1 scores consider precision and recall rates and reflect the comprehensive performance of the training model.
The precision rate, recall rate, and F1 score formulas are defined as follows:
Precision = TP/(TP + FP) = TP/(all detections)
Recall = TP/(TP + FN) = TP/(all ground truths)
F1 Score = 2 × (Precision × Recall)/(Precision + Recall)
Regarding the training process of Mask-RCNN, Figure 5 shows the loss value curve of the entire process during the Mask-RCNN training process. Loss value is essential to evaluate the training quality of the result. The model that presents a flat, low-level loss value presents superior accuracy. In the last training period of this study, the loss value levelled off and reached 0.0171 in the 150th epoch model file, which was selected as the final analysis model file.
Figure 6 shows the numerical curves of the loss indexes. YOLOv5 uses GIOU loss as the loss of the bounding box. We visualize GIoU loss and target detection loss to analyze training accuracy. Compared to the traditional return loss, GIoU loss for bounding box regression [29] possesses excellent performance without the scale deformation phenomenon. The GIoU loss value being lower indicates that the predicted bounding boxes in the model are more accurate (Figure 6a). Figure 6b indicates the mean loss for the target entities. The model file has a flat, low-level Objectness loss value (Figure 6b), indicating superior accuracy in detecting target entities. Figure 6c,d show the GIoU loss and Objectness loss indexes in the validation dataset, respectively. The last 300th epoch model file with four flat, low-level loss values was selected as the final analysis model file in the YOLOv5 training process.
Table 1 shows the numerical results of the evaluation indexes (the values are rounded to four decimal places). The mAP indexes of the two different models on the same verification dataset both presented splendidly, reaching above 90%; however, the model generated in YOLOv5 had better F1 score index performance with 0.8373 (Table 1). Therefore, in this experiment, the YOLOv5 model had better comprehensive performance in training and was used to predict the air conditioner external units in street view pictures. Figure 7 shows the predicted recognition diagrams of Mask-RCNN and YOLOv5 algorithms.
4. Discussion
The majority of research on air conditioners primarily focuses on renewable energy, electrical power, and energy systems (e.g., coordination of energy storage systems, energy storage modules for air conditioners, and solar photovoltaic direct-drive air conditioning systems). However, the development of the spatial distribution of air conditioner data remains scarce. Existing methods for investigating air conditioner coverage are primarily based on the traditional expensive census method. However, traditional census methods are complicated and consume excessive manpower and time in the census process.
This study proposes a new method using a new notion for the application of street view images and the extraction of air conditioners. It uses two advanced convolutional neural network algorithms to efficiently identify external air conditioner unit entities from street view images. The algorithm applied in this study obtains air conditioners using data from urban areas more quickly and conveniently than traditional high-cost manual census methods.
The experimental dataset was selected from street view images provided by the Baidu Street View online map platform within the 2nd ring road area of Beijing. Limitations due to inadequate camera shooting sites, the immeasurable distances between buildings on both sides of the street, urban vegetation and shadow covering problems, and street view image quality partly affected database capacity.
The following analysis is given based on the definition of the recall and precision indices and evaluation scores in the previous section from the application of the Mask-RCNN and YOLOv5 algorithms. The precision indexes describe the proportion of true positive examples in the positive examples predicted by the model classifier (i.e., the number of entities accurately identified as positive by the model classifier). The recall indexes focus on the real entity ratio after labeling and describe how many real positive examples in the training dataset are selected by the trained model classifier.
We used the Mask-RCNN and YOLOv5 algorithms, which are widely recognized as effective for target detection. Regarding the performance of Mask-RCNN, although the precision score reaches approximately 0.99, the recall score remains at approximately 0.50 and indicates that the trained model has excellent accuracy for predicting the entities selected by the recognition box as target entities but fails to identify all the required entities. The YOLOv5 algorithm is superior, with precision and recall scores reaching 0.7483 and 0.9502, respectively, but the YOLOv5 model also remains defective in predicting the correct entities regarding imperfect precision score in this study.
Regarding the four evaluation indexes’ performance shown in the previous section, the YOLOv5 network presents better comprehensive performance compared with the Mask-RCNN network. In this study, YOLOv5 is superior as YOLOv5 seems to be better at detecting smaller target entities with applying mosaic augmentation, which can effectively solve the training problem in training small sample targets. Comparing Mask-RCNN and YOLOv5, YOLOv5 has obvious advantages in its superior training speed and the small file size of the generated models, with the YOLOv5 model and Mask-RCNN model occupying 26.4 MB and 244 MB, respectively. In the application of the external air conditioner unit dataset, YOLOv5 trained faster. Regarding four indicators’ performance, as shown in the previous section, YOLOv5 generally has more splendid performance when detecting small targets.
Figure 8 shows several sample images of misidentified entities during the prediction process. The above-mentioned phenomena are due to the complex air conditioner external unit features contained in the street view images, occupying too few pixel values to extract enough features, and to the interference of different brightness areas, shooting angles, urban vegetation and shadow coverings, and the different square or circular characteristics of the fan blade shapes of external air conditioner units. All the factors affect the performance of algorithms in feature recognition and function discrimination. Thus, the discriminant feature function obtained by the classifier is lopsided in the process of the discriminant feature function induction, and the recall or precision performance of external air conditioner unit feature extraction remains defective, as shown by the indicators in the previous section. Therefore, the extraction and induction of the features of the external air conditioner unit entities remain complex in street view images. We will continue working on this topic in future studies.
Several accuracy differences are apparently reflected by the evaluation indicators between this study and other similar target street view entity detection studies [23,24,25,26]. Several studies applying deep learning networks or traditional machine learning methods to detect target entities from street view images present superior evaluating performance. The performance of binary classification using a deep learning network in crack detection on GSV pavement images is impressive, with precision, recall, and F1 scores of approximately 0.98 [23]. Additionally, the F-score of abandoned house detection using a deep learning network reaches 0.84 in a well-prepared GSV dataset collected from five different Rust Belt cities [26]. Moreover, traditional machine learning methods also acquire superior performance in datasets containing uncomplicated features. The accuracy rate of street-level sidewalk detection reaches 0.95 using a traditional random forest classifier in 2438 GSV images and 78,255 segmented image regions [24]. However, the precision and mAP scores are deficient for complex target entities (e.g., trees). The mAP and AP scores of the classification of separate trees were approximately 0.3 and 0.6, respectively [25]. In the detection task of separate trees, misidentified phenomena were also severe. Most masking errors in instance segmentation with Mask R-CNN include the phenomena of one tree split into multiple detections, hedges or shrubs detected as trees, misidentified small trees, undetected trees in shadows of other entities, non-tree objects detected as trees, and masking errors [25]. In this study, the classification results are superior compared with other similar studies, with the mAP score of the Mask-RCNN and YOLOv5 training models reaching 0.99 and 0.9428, respectively. Thus, external air conditioner units could be extracted using the Mask-RCNN and YOLOv5 algorithms in the street view dataset.
Comparing the above-mentioned four different recognition performances with the performance of this study, the huge differences in experimental performance are due to the characteristic complexity of the different target entity categories. The features that trees and external air conditioner units contain are far more complex than those of cracks and abandoned houses in GSV pavement images. Additionally, the feature extraction and target object recognition of trees and external air conditioner units are more easily affected by the influence of brightness, shooting angle, other entities, and shadow covering compared with abandoned houses and cracks. However, the disturbances of brightness, shooting angle, other entities, and shadow covering are common in GSV images. Additionally, object size in images dramatically affects the recognition performance. These phenomena confirm that distinguishing between visually overlapping and small objects is a difficult task. Detecting objects using multiple street-level perspectives potentially offsets this problem, as occluded or overlapping objects can either be seen in the foreground or are distinguishable from other perspectives and images. Regarding the limitation of inflexible and discontinuous street view image shooting points, we will continue working on this topic in future studies.
Because of the complex types of objects contained in street view images and multiple sources of street scenes, the number of street view images containing external air conditioner units is limited; additionally, the number of external air conditioner units that meet the size requirements of training samples is insufficient. The source of the training dataset will continue to expand in future studies. The classification characteristics of external air conditioner units are extremely complex and include circular or square fan blades and several external air conditioner units equipped with metal external frames for hanging and fixing. The additional characteristics of these disturbances will significantly impact identification efficiency. We will continue to work on the removal of these noise features and introduce other auxiliary information to achieve better recognition performance.
During the street view image shooting process, the influence of brightness, shooting angle, urban vegetation cover, and shadow covering affected feature extraction and target object recognition. In future experiments, we will continue to mitigate the interference of these factors. Additionally, we will conduct further research on spatial air conditioner extraction in a large area in Beijing and other cities to expand the robustness of our datasets. Thus, our training model, which contains highly generalized external air conditioner unit features, could accurately acquire the number of air conditioners in other cities all over the world. Meanwhile, the street view platform has not clearly explained the update time and update frequency of new street view datasets. The update frequency has great randomness. Street view data published by the platform have the characteristic of time lag, which leads to the extracted air conditioner data also presenting the characteristic of time lag. Additionally, the update frequency of the street view dataset in different regions also varies significantly. Street view data in some regions are vacant for a long period, leading to a phenomenon of severe information lag. Although the timeliness of the dataset is deficient, the establishment of a monographic dataset is significative. Our study demonstrated the feasibility of street view images in air conditioner detection and showed great potential to detect air conditioners in the future. In future studies, we will continue working on extracting air conditioner popularity data from street view datasets, which can be used to assist urban disaster prevention and disaster mitigation, evaluate urban infrastructure improvement, monitor urban electricity consumption, and help energy-saving planning in consideration of other parameters such as locations, household numbers, and population numbers.
Overall, extracting air conditioners from street view images to accurately assess the ability of residents to mitigate the impacts of heat waves will improve the accuracy of heat wave risk to human safety and of urban heat island impact assessment at an extremely fine scale.
5. Conclusions
The frequent occurrence of heat waves has presented challenges to human safety, economic activities, and transportation. Air conditioners are one of the most important ways to mitigate heat waves. The existing technical schemes of external air conditioner unit extraction are generally presented by the form of manual census methods to evaluate the air conditioner coverage rate in diverse regions. The traditional registration method is complicated and of expensive time-cost. Therefore, convenient and efficient registration methods are in urgent demand in order to promptly and efficiently extract the spatial distribution of air conditioner usage.
Meanwhile, the existing studies of air conditioners generally involve the perspectives of controlling devices of air conditioners, air conditioner system configuration, and protecting devices of air conditioner external units. There are few studies in the air conditioner information extraction field. Monographic datasets and feature extraction algorithms for air conditioner external unit feature extraction are also deficient.
This study firstly establishes a monographic dataset to detect air conditioner external unit features. In addition, this study proposes two convenient low-cost methods for identifying external air conditioner units that apply the Mask-RCNN and YOLOv5 algorithms to the target detection field for successful low-cost and rapid feature extraction. The result can efficiently assist local governors in formulating heat wave relief policies and heat wave forecasts that are adapted to local conditions in a combination of household numbers and population densities. We will continue working on the extraction of other parameters such as household numbers and population density on this street view dataset in future studies.
The recognition and classification results of the training model were reasonable. The mAP score of the Mask-RCNN and YOLOv5 training models reached 0.99 and 0.9428 in the validation dataset, respectively. Thus, air conditioners could be extracted from street view images using the Mask-RCNN and YOLOv5 algorithms.
In this study, the prediction performance of YOLOv5 being superior can be attributed to the YOLOv5 model seeming to be better at detecting smaller target entities when applying several advanced processing theories such as mosaic augmentation, which can effectively solve the training problem in training small sample targets. YOLOv5 has obvious advantages such as its splendid training speed and the file size of the generated models.
The annotated dataset of this study remains partially deficient due to complex image features, deficient pixel sizes of the target entities, and multiple street view background entities. In future experiments, we will continue to improve the feature extraction algorithms and datasets to achieve better recognition performance.
This study provides a new method and inspiration for the subsequent extraction and spatial distribution of external air conditioner units. This study starts with air conditioner applications and links air conditioner distribution and heat wave disasters by regarding air conditioner spatial distribution as an index to evaluate the ability of tolerance and resilience to heat waves in certain regions. This study provides a great data source for the highly accurate assessment of heat wave risk and heat island impact, supporting scientific endeavors by the community or government to address heat waves.
Author Contributions
Conceptualization, F.Y. and M.W.; methodology, M.W.; software, M.W.; validation, F.Y. and M.W.; formal analysis, M.W.; investigation, M.W.; resources, F.Y.; data curation, M.W.; writing—original draft preparation, M.W. and F.Y.; writing—review and editing, M.W. and F.Y.; visualization, M.W.; supervision, F.Y.; project administration, M.W.; funding acquisition, F.Y. All authors have read and agreed to the published version of the manuscript.
Funding
This research was funded by the construction project of China Knowledge Center for Engineering Sciences and Technology, grant number CKCEST-2021-2-18; the strategic priority research program of the Chinese Academy of Sciences, grant number XDA20030302; and the strategic priority research program of Chinese Academy of Sciences, grant number XDA20020402.
Acknowledgments
The present study’s street view image data are from Baidu Map, which we thank for sharing the images online.
Conflicts of Interest
The authors declare no conflict of interest.
References
- Kondo, H.; Genchi, Y.; Kikegawa, Y.; Ohashi, Y.; Yoshikado, H.; Komiyama, H. Development of a multi-layer urban canopy model for the analysis of energy consumption in a big city: Structure of the urban canopy model and its basic performance. Boundary-Layer Meteorol. 2005, 116, 395–421. [Google Scholar] [CrossRef]
- Chen, Y.; Zhang, N.; Zhu, Y. Simulation of urban high temperature heat wave regulation mechanism. J. Nat. Disasters 2020, 29, 193–202. [Google Scholar] [CrossRef] [PubMed] [Green Version]
- McElroy, S.; Schwarz, L.; Green, H.; Corcos, I.; Guirguis, K.; Gershunov, A.; Benmarhnia, T. Defining heat waves and extreme heat events using sub-regional meteorological data to maximize benefits of early warning systems to population health. Sci. Total Environ. 2020, 721, 137678. [Google Scholar] [CrossRef] [PubMed]
- Zhang, N.; Gao, Z.; Wang, X.; Chen, Y. Modeling the impact of urbanization on the local and regional climate in Yangtze River Delta, China. Theor. Appl. Climatol. 2010, 102, 331–342. [Google Scholar] [CrossRef]
- Wu, K.; Yang, X.Q. Urbanization and surface non-uniform warming in eastern China. Chin. Sci. Bull. 2013, 58, 642–652. [Google Scholar]
- Si, P.; Li, Q.X.; Xuan, C.Y.; Yin, H. Contribution of urbanization to temperature change in Beijing. J. Nat. Disasters 2009, 18, 138–144. [Google Scholar]
- Benmarhnia, T.; Deguen, S.; Kaufman, J.S.; Smargiassi, A. Review article: Vulnerability to heat-related mortality: A systematic review, meta-analysis, and meta-regression analysis. Epidemiology 2015, 26, 781–793. [Google Scholar] [CrossRef] [PubMed]
- Cheng, J.; Xu, Z.; Bambrick, H.; Prescott, V.; Wang, N.; Zhang, Y.; Su, H.; Tong, S.; Hu, W. Cardiorespiratory effects of heatwaves: A systematic review and meta-analysis of global epidemiological evidence. Environ. Res. 2019, 177, 108610. [Google Scholar] [CrossRef] [PubMed]
- Ponjoan, A.; Blanch, J.; Alves-Cabratosa, L.; Martí-Lluch, R.; Comas-Cufí, M.; Parramon, D.; del Mar Garcia-Gil, M.; Ramos, R.; Petersen, I. Effects of extreme temperatures on cardiovascular emergency hospitalizations in a Mediterranean region: A self-controlled case series study. Environ. Health 2017, 16, 32. [Google Scholar] [CrossRef] [PubMed] [Green Version]
- Knowlton, K.; Rotkin-Ellman, M.; King, G.; Margolis Helene, G.; Smith, D.; Solomon, G.; Trent, R.; English, P. The 2006 California Heat Wave: Impacts on Hospitalizations and Emergency Department Visits. Environ. Health Perspect. 2009, 117, 61–67. [Google Scholar] [CrossRef] [PubMed]
- Garcia-Garcia, A.; Orts-Escolano, S.; Oprea, S.; Villena-Martinez, V.; Martinez-Gonzalez, P.; Garcia-Rodriguez, J. A survey on deep learning techniques for image and video semantic segmentation. Appl. Soft Comput. 2018, 70, 41–65. [Google Scholar] [CrossRef]
- Farabet, C.; Couprie, C.; Najman, L.; LeCun, Y. Learning hierarchical features for scene labeling. IEEE Trans. Pattern Anal. Mach. Intell. 2012, 35, 1915–1929. [Google Scholar] [CrossRef] [PubMed] [Green Version]
- Park, S.J.; Hong, K.S. Video semantic object segmentation by self-adaptation of DCNN. Pattern Recognit. Lett. 2018, 112, 249–255. [Google Scholar] [CrossRef] [Green Version]
- Girshick, R.; Donahue, J.; Darrell, T.; Malik, J. Rich feature hierarchies for accurate object detection and semantic segmentation. In Proceedings of the IEEE Conference on Computer Vision and Pattern Recognition, Columbus, OH, USA, 23–28 June 2014; IEEE: New York, NY, USA, 2014; pp. 580–587. [Google Scholar]
- Ren, S.; He, K.; Girshick, R.; Sun, J. Faster r-cnn: Towards real-time object detection with region proposal networks. Adv. Neural Inf. Process. Syst. 2015, 28, 91–99. [Google Scholar] [CrossRef] [Green Version]
- Lin, T.Y.; Dollár, P.; Girshick, R.; He, K.; Hariharan, B.; Belongie, S. Feature pyramid networks for object detection. In Proceedings of the IEEE Conference on Computer Vision and Pattern Recognition, Honolulu, HI, USA, 21–26 July 2017; IEEE: New York, NY, USA, 2017; pp. 2117–2125. [Google Scholar]
- He, K.; Gkioxari, G.; Dollar, P.; Girshick, R. Mask R-CNN, international conference on computer vision. In Proceedings of the 2017 IEEE International Conference on Computer Vision (ICCV), Venice, Italy, 5 June 2017; IEEE: New York, NY, USA, 2017; pp. 2980–2988. [Google Scholar]
- Redmon, J.; Divvala, S.; Girshick, R.; Farhadi, A. You only look once: Unified, real-time object detection. In Proceedings of the IEEE Conference on Computer Vision and Pattern Recognition, Las Vegas, NV, USA, 27–30 June 2016; IEEE: New York, NY, USA, 2016; pp. 779–788. [Google Scholar]
- Redmon, J.; Farhadi, A. YOLO9000: Better, faster, stronger. In Proceedings of the IEEE Conference on Computer Vision and Pattern Recognition, Honolulu, HI, USA, 21–26 July 2017; IEEE: New York, NY, USA, 2017; pp. 7263–7271. [Google Scholar]
- Redmon, J.; Farhadi, A. Yolov3: An incremental improvement. arXiv 2018, arXiv:1804.02767. [Google Scholar]
- Bochkovskiy, A.; Wang, C.Y.; Liao, H.Y.M. Yolov4: Optimal speed and accuracy of object detection. arXiv 2020, arXiv:2004.10934. [Google Scholar]
- yolov5. Available online: https://github.com/ultralytics/yolov5 (accessed on 26 June 2020).
- Maniat, M.; Camp, C.V.; Kashani, A.R. Deep learning-based visual crack detection using Google street view images. Neural Comput. Appl. 2021. [Google Scholar] [CrossRef]
- Kang, B.; Lee, S.; Zou, S. Developing Sidewalk Inventory Data Using Street View Images. Sensors 2021, 21, 3300. [Google Scholar] [CrossRef] [PubMed]
- Lumnitz, S.; Devisscher, T.; Mayaud, J.R.; Radic, V.; Coops, N.C.; Griess, V.C. Mapping trees along urban street networks with deep learning and street-level imagery. ISPRS J. Photogramm. Remote Sens. 2021, 175, 144–157. [Google Scholar] [CrossRef]
- Zou, S.; Wang, L. Detecting individual abandoned houses from google street view: A hierarchical deep learning approach. ISPRS J. Photogramm. Remote Sens. 2021, 175, 298–310. [Google Scholar] [CrossRef]
- Dick, K.; Charih, F.; Woo, J.; Green, J.R. Gas prices of America: The machine-augmented crowd-sourcing era. In Proceedings of the 2020 17th Conference on Computer and Robot Vision (CRV), Ottawa, ON, Canada, 13–15 May 2020; IEEE: New York, NY, USA, 2020; pp. 158–165. [Google Scholar]
- Liu, S.; Qi, L.; Qin, H.; Shi, J.; Jia, J. Path aggregation network for instance segmentation. In Proceedings of the IEEE Conference on Computer Vision and Pattern Recognition, Salt Lake City, UT, USA, 18–23 June 2018; IEEE: New York, NY, USA, 2018; pp. 8759–8768. [Google Scholar]
- Rezatofighi, H.; Tsoi, N.; Gwak, J.; Sadeghian, A.; Reid, I.; Savarese, S. Generalized intersection over union: A metric and a loss for bounding box regression. In Proceedings of the IEEE/CVF Conference on Computer Vision and Pattern Recognition, Long Beach, CA, USA, 15–20 June 2019; IEEE: New York, NY, USA, 2019; pp. 658–666. [Google Scholar]
Figure 1.
Examples of deficient performance of several street view images, including: (a) occupying a small proportion of several street view images; (b) excessive deviation of the camera angle value; (c) urban street vegetation covering; (d) covering by other objects.
Figure 1.
Examples of deficient performance of several street view images, including: (a) occupying a small proportion of several street view images; (b) excessive deviation of the camera angle value; (c) urban street vegetation covering; (d) covering by other objects.
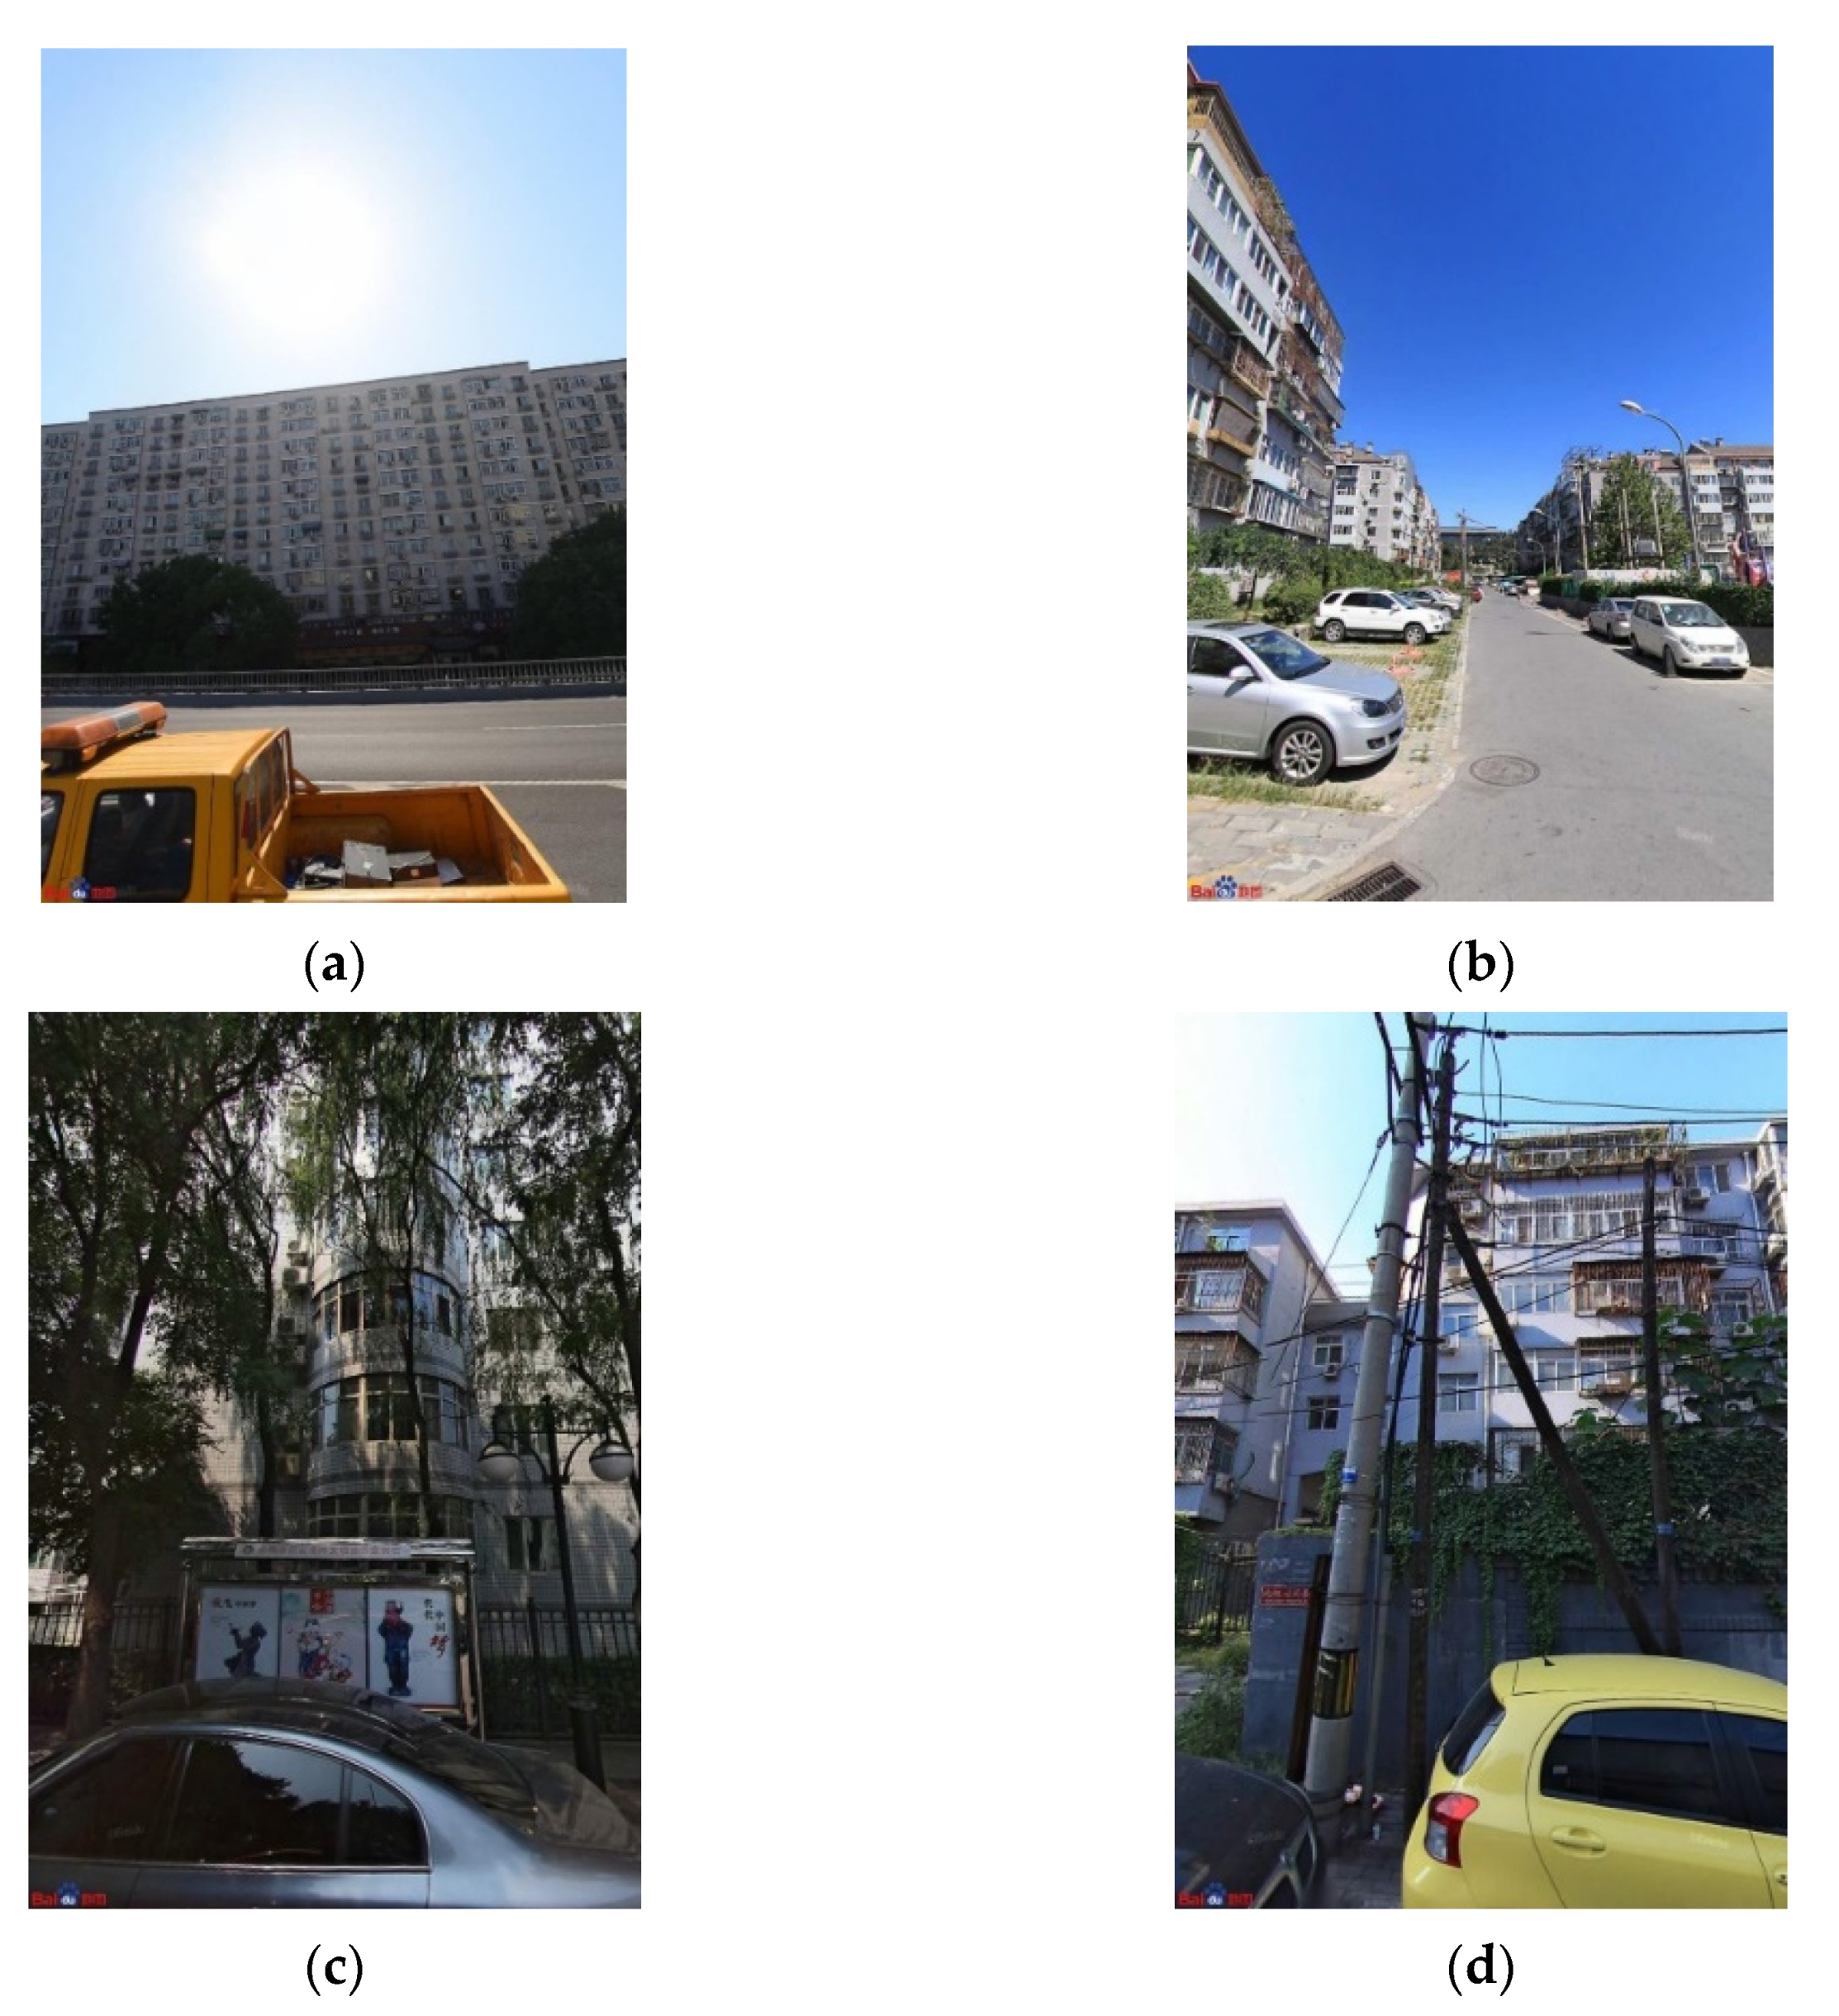
Figure 2.
An example of the labeled images with Labelme. The background is covered with a black mask. Each target entity is covered with masks in different colors.
Figure 2.
An example of the labeled images with Labelme. The background is covered with a black mask. Each target entity is covered with masks in different colors.

Figure 3.
The visualization results of four normalized indexes. (a) presents visualization results of normalized X index and Y index; (b) presents visualization results of normalized width index and height index.
Figure 3.
The visualization results of four normalized indexes. (a) presents visualization results of normalized X index and Y index; (b) presents visualization results of normalized width index and height index.

Figure 4.
Example expectation result graphs in our recognition task. (a) indicates a combination example of several original unclassified pictures; (b) indicates a combination example of several classified pictures that are predicted by training models.
Figure 4.
Example expectation result graphs in our recognition task. (a) indicates a combination example of several original unclassified pictures; (b) indicates a combination example of several classified pictures that are predicted by training models.

Figure 5.
Numerical variation diagram of loss values in the Mask-RCNN training process.

Figure 6.
Numerical variation diagram of loss values in the YOLOv5 training process. The GIoU loss value curve in training dataset (a) and validation dataset (c); Target detection loss mean curve in training dataset (b) and validation dataset (d).
Figure 6.
Numerical variation diagram of loss values in the YOLOv5 training process. The GIoU loss value curve in training dataset (a) and validation dataset (c); Target detection loss mean curve in training dataset (b) and validation dataset (d).

Figure 7.
Several sample recognition result images using training model predictions by Mask-RCNN (a,b) and YOLOv5 (c,d) algorithms.
Figure 7.
Several sample recognition result images using training model predictions by Mask-RCNN (a,b) and YOLOv5 (c,d) algorithms.

Figure 8.
(a–d) all present several sample images of misidentified entities during the predicting process; (a,b) present several small unidentified external air conditioner units and phenomenon of lacking labeling; (c,d) present a phenomenon of excessive and incorrect labeling.
Figure 8.
(a–d) all present several sample images of misidentified entities during the predicting process; (a,b) present several small unidentified external air conditioner units and phenomenon of lacking labeling; (c,d) present a phenomenon of excessive and incorrect labeling.


Table 1.
Evaluation indexes of generated model files by Mask-RCNN and YOLOv5 algorithms.
| Indexes | Mask-RCNN | YOLOv5 |
|---|---|---|
| Precision | 0.9935 | 0.7483 |
| Recall | 0.4986 | 0.9502 |
| F1 Score | 0.6640 | 0.8373 |
| mAP | 0.9879 | 0.9428 |
Publisher’s Note: MDPI stays neutral with regard to jurisdictional claims in published maps and institutional affiliations. |
© 2021 by the authors. Licensee MDPI, Basel, Switzerland. This article is an open access article distributed under the terms and conditions of the Creative Commons Attribution (CC BY) license (https://creativecommons.org/licenses/by/4.0/).
Share and Cite
MDPI and ACS Style
Yang, F.; Wang, M. Deep Learning-Based Method for Detection of External Air Conditioner Units from Street View Images. Remote Sens. 2021, 13, 3691. https://doi.org/10.3390/rs13183691
AMA Style
Yang F, Wang M. Deep Learning-Based Method for Detection of External Air Conditioner Units from Street View Images. Remote Sensing. 2021; 13(18):3691. https://doi.org/10.3390/rs13183691
Chicago/Turabian StyleYang, Fei, and Meng Wang. 2021. "Deep Learning-Based Method for Detection of External Air Conditioner Units from Street View Images" Remote Sensing 13, no. 18: 3691. https://doi.org/10.3390/rs13183691
Note that from the first issue of 2016, this journal uses article numbers instead of page numbers. See further details here.