Article

Geometric Evolution of the Chongce Glacier during 1970–2020, Detected by Multi-Source Satellite Observations

1
School of Civil Architectural Engineering, Shandong University of Technology, Zibo 255000, China
2
MOE Key Laboratory of Fundamental Physical Quantities Measurement and Hubei Key Laboratory of Gravitation and Quantum Physics, PGMF and School of Physics, Huazhong University of Science and Technology, Wuhan 430074, China
3
School of Civil Engineering, Anhui Jianzhu University, Hefei 230601, China
*
Author to whom correspondence should be addressed.
Remote Sens. 2021, 13(18), 3759; https://doi.org/10.3390/rs13183759
Submission received: 6 August 2021 / Revised: 14 September 2021 / Accepted: 16 September 2021 / Published: 19 September 2021

Abstract

:
Glacier surge, which causes a quick movement of ice mass from high to low elevation, is closely associated to the glacial hazards of debris flows and glacial lake outburst floods. Over the West Kunlun Shan, surge events have been detected for some glaciers, however, the characteristics (e.g., the active phase) of the identified surge-type glaciers are not fully understood due to the paucity of long-term observations of glacier changes. In this study, we investigated the geometric evolution of the Chongce Glacier (a surge-type glacier) over the past five decades. Glacier elevation changes were observed by comparing topographic data from different times. Surface velocity and terminus position were derived using a cross-correlation algorithm and band ratio method, respectively. A decreasing rate of glacier surface thinning was found for the Chongce Glacier during the studied period. Glacier elevation changes of −0.46 ± 0.12, −0.12 ± 0.05, and 0.27 ± 0.11 m yr−1 were estimated for the periods of 1970–2000, 2000–2012, and 2012–2018, respectively. Moreover, this glacier experienced obvious surface lowering over the terminus zone and clear surface thickening over the upper zone during 1970–2000, and the opposite during 2000–2018. Surface velocity of the Chongce Glacier was less than 300 m yr−1 in 1990–1993, and then quickly increased to more than 1000 m yr−1 between 1994 and 1998, and dropped to less than 50 m yr−1 in 1999–2020. Over the past five decades, the Chongce Glacier generally experienced a slight retreat, except for a terminus advance from 1995 to 1999. According to the spatial pattern of glacier elevation changes in 1970–2000 and the long-term changes of glacier velocity and terminus position, the recent surge event at the Chongce Glacier likely initiated in winter 1993 and terminated in winter 1998. Furthermore, the start date, end date, and duration of the active phase indicate that the detected surge event was likely triggered by a thermal mechanism.

Graphical Abstract

1. Introduction

Surge-type glaciers feature periodically alternating long quiescent phases and short active phases [1,2,3]. During the active phase, a large amount of ice mass quickly moves from high to low elevation, which causes a lengthening or thickening of the terminus zone [4,5,6,7]. As a result, a surge event can threaten the safety of the downstream communities, and can also result in river blocking [8,9,10,11]. For example, a surge event at the Kyagar Glacier in the Chinese Karakoram mountains during 2015–2016 caused the formation of an ice-dammed lake and subsequent glacial lake outburst floods [9]. Moreover, a surge event at the Kutiah Glacier in the Karakoram mountains led to an advancement of about 12 km in three months, and thus engulfed the villages, farmland, and forest downstream [10]. In summer 2016, a surge event was recorded in the western Tibetan Plateau, where two massive glaciers suddenly collapsed at Aru Range, resulting in ice avalanches advancing up to 7 km in horizontal distance, killing nine herders and hundreds of animals [12,13,14]. Consequently, the study of the process and characteristics of glacier surge is important for water resources, early disaster recognition, and disaster prevention.
The West Kunlun Shan (WKS) located on the northwestern Tibetan Plateau, with a glacier area of about 8817.78 km2, accounts for more than 70% of the total glacier area in the Kunlun Mountain [15]. During the past few decades, glaciers in the WKS have generally experienced a balanced or slightly negative mass change [16,17,18,19,20]. Over a similar time period, surge events have been detected for many glaciers in the WKS [17,21,22,23,24]. Specifically, according to the temporal changes of surface velocity and terminus position from 1972 to 2014, Yasuda and Furuya (2015) identified nine surge-type glaciers in the WKS [22]. Moreover, by extracting the glacier surface elevation changes of the WKS from the 1970s to 1999, Wang et al. (2018) confirmed that nine glaciers experienced surge events during this time period [17]. However, it is noteworthy that four of these glaciers were not identified as surge-type glaciers by Yasuda and Furuya (2015) [22]. In addition, for the observed glacier surface elevation changes between 2000 and 2014, Lin et al. (2017) detected surge events at four glaciers in the WKS [25].
In general, by detecting the temporal changes of the glacier surface elevation or surface velocity, the glaciers which have experienced surge events since the 1970s in the WKS have been detected in previous studies. However, the characteristics (e.g., start time and duration) of the detected surge events are not fully understood, especially for those events that occurred between the 1970s and 2000. The time period of the observed glacier surface elevation change, which is about 30 years in Wang et al. (2016) [17] and 15 years in Lin et al. (2017) [25], is much longer than the duration of a surge event in this region. The results of the glacier surface velocities used to detect surge events were mainly derived from satellite images after the year 2000 [22,23]. Importantly, a long-term observation of the changes in glacier surface elevations, surface velocities, and terminus positions, which is needed to investigate the trigger mechanism for the occurred surge events, has not been conducted in the WKS.
Chongce Glacier, which is one of the highest and largest ice caps in the mid-low latitude regions, has been identified as having experienced a surge event in the 1990s [22]. In this study, our aim was to conduct a comprehensive analysis of the spatial-temporal variability of the glacier surface elevation, surface velocity, and terminus position over the past five decades. The glacier surface elevation changes during the periods of 1970–2000, 2000–2012, and 2012–2018 were derived by comparing topographic data from different times. The glacier surface velocities were obtained by the use of a cross-correlation algorithm with 46 pairs of Landsat optical images which were acquired during 1990–2020. Glacier terminus positions between 1977 and 2020 were also delineated using the Landsat optical images. By comprehensively analyzing these observed results, we identified the active and quiescent phases of the Chongce Glacier over the recent decades and investigated the possible trigger mechanism for the surge event.

2. Study Area

The Chongce Glacier (from 35°10′N to 35°25′N and from 81°E to 81°15′E) is situated in the southeastern part of the WKS, which is one of the highest regions in the world (Figure 1). This glacier is one of the most famous glaciers in the region [26], with a length of about 29 km and an area of about 166 km2, which were estimated from the glacier area in the Second Chinese Glacier Inventory (SCGI) [27]. The Chongce Glacier is a polythermal (subpolar) glacier, with the altitude spanning from 5300 to over 6800 m a.s.l. [23]. This glacier has been identified as having experienced a surge event in the 1990s, however, the definite time of the start date or the duration of the surge event was not detected [22]. The surface of the Chongce Glacier is almost debris free, with clean ice or snow covering the upper and middle areas of the glacier and some debris covering the terminus of the glacier [26,28]. The climate of the study area is mainly monsoon type, with the precipitation mainly occurring in summer [26]. The annual temperature and precipitation are, respectively, about −14.7 °C and 460 mm around the glacier equilibrium-line altitude (ELA), which is located at 5930 m above sea level (a.s.l.) [26,29].

3. Data and Method

3.1. Data Sets Used in This Study

In order to investigate the changes of the glacier surface topography over past five decades, we employed the topographic map from 1970 and the Shuttle Radar Topography Mission (SRTM) digital elevation model (DEM) from 2000, and generated more recent DEMs with TanDEM-X interferometric synthetic aperture radar (InSAR) data from 2012 and a ZiYuan-3 (ZY-3) tri-stereo optical image from 2018 (Table 1). The DEM for 1970 with a 50 m resolution was obtained by digitizing the topographic map (at a scale of 1:100,000), which was generated from aerial stereo scenes. In recent years, two SRTM DEMs, i.e., the SRTM-C DEM and SRTM-X DEM, have been released by the United States Geological Survey and German Aerospace Center, respectively [30]. In this study, we used the SRTM-X DEM of a 30 m resolution because the horizontal and vertical accuracy of this topographic product is better than that of the SRTM-C DEM.
The DEM for 2012 was generated from a pair of TanDEM-X InSAR images acquired in bistatic mode on 30 January 2012. The TanDEM-X mission, which is made up of the two identical satellites of TerraSAR-X and TanDEM-X, is the first single-pass InSAR satellite system. The bistatic InSAR co-registered single look slant range complex imagery was provided by the German Aerospace Center, with a pixel spacing of ~3 m in both the azimuth and ground ranges. The incidence angle, perpendicular baseline, height ambiguity, and average coherence of the bistatic InSAR data were 36.08°, 84.01 m, 68.12 m, and 0.76, respectively. In this study, the TanDEM-X DEM of a 10-m resolution was produced using the bistatic synthetic aperture radar (SAR) interferometric method proposed by Liu et al. (2016) [31].
The DEM for 2018 was reconstructed from a ZY-3 tri-stereo optical image collected on 31 January 2018. The ZY-3 series of satellites are the first Chinese civilian high-resolution stereo mapping satellites [32]. The tri-stereo optical data used in this study were acquired by the ZY-3-02 satellite. The spatial resolution of the optical images collected by the forward and backward cameras was 2.5 m, and that of the nadir observation was 2.1 m. The ZY-3 DEM of a 10-m resolution was produced using Space Data Processor software from the Land Satellite Remote Sensing Application Center of the Ministry of Natural Resources of the People’s Republic of China. Moreover, the void areas caused by the lack of image contrast over the glacier accumulation zones were not filled by interpolation.
The global coverage and continuous acquisition make Landsat satellite series images a key data source for studies of glacier motion and the change of glacier boundaries [33,34,35,36,37]. In this study, 46 Landsat image pairs acquired from 1990 to 2020 with little cloud contamination were used to obtain the flow velocity of the Chongce Glacier (Table S1). The Landsat images were preprocessed using the USGS Level 1T (L1T) product generation system, which includes radiometric and geometric correction and transformation to the Universal Transverse Mercator projection [38]. Band 4 (near-infrared band) of the Landsat Thematic Mapper (TM) images and band 8 (panchromatic band) of the Landsat Enhanced Thematic Mapper Plus (ETM+)/Operational Land Imager (OLI) images were used to derive the surface velocity, with resolutions of 30 m and 15 m, respectively, which can satisfy the requirement of velocity acquisition [39]. The temporal thresholds of most of the image pairs were approximately one or two years, to reduce the seasonal effect. In addition, considering the rapid feature changes over the glacier surface during the surge period, temporal thresholds of less than a year or even as low as 16 days were also used for some image pairs (Table S1). To minimize the geometrical distortion, only images from the same path/row (145/36) were used in this study.
In addition to estimating the changes in glacier thickness and flow velocity, the changes in the glacier boundary are also valuable information for studying the evolution of a glacier. In this study, 11 Landsat Multispectral Scanner System (MSS)/TM/ETM+/OLI images were employed to acquire the changes of the glacier boundary from 1977 to 2020 (Table S2).

3.2. Glacier Elevation Change and Mass Balance Estimation

The elevation changes were detected by comparing the topographic data from different times. For example, the elevation changes between 2000 and 2012 were derived by subtracting the SRTM-X DEM for 2000 from the TanDEM-X DEM for 2012. Before the process of DEM differencing, we resampled the DEMs for 1970, 2012, and 2018 to the spatial resolution of the SRTM-X DEM (30 m). Moreover, the penetration depth for the X-band radar signal into the glacier surface was corrected for the SRTM-X DEM and TanDEM-X DEM. The X-band radar penetration depth is usually neglected by the use of a simple “no penetration” assumption [40]; however, a penetration depth of more than 1 m over the accumulation zone was observed in the Puruogangri ice field of the interior Tibetan Plateau [41]. We corrected the radar penetration bias of the SRTM-X DEM and TanDEM-X DEM by employing the polynomial function between the X-band radar penetration depth and altitude estimated in the Puruogangri ice field [41]. In addition, in order to eliminate the influence of geometric errors between each pair of DEMs, we employed the universal co-registration method proposed by Nuth and Kääb (2011) [42] to accurately match the two DEMs.
Surface elevation changes of the glacierized regions were detected using the glacier boundaries obtained from the SCGI to mask the results of the DEM differencing. The SCGI outlines were retrieved from Landsat optical images acquired between 2006 and 2010 [27] Therefore, considering the typical advance and retreat of a surge-type glacier, the glacier terminus locations of the SCGI needed to be modified. Specifically, when a surge event had occurred during the study period, we revised the glacier terminus locations by the use of the Landsat scenes acquired on a similar date to the more recent DEM. Otherwise, if this was not possible, we corrected the terminus locations using the optical satellite images collected on a similar date to the earlier topographic data.
The glacier mass balance of a particular study period was estimated from the mean glacier elevation change using the conversion factor of 850 kg m−3 proposed by Huss (2013) [43]. The average value of the glacier elevation changes was calculated at 50 m altitude bands because the elevation changes of all the glacier pixels over an altitude band are generally subject to a Gaussian distribution [44,45]. In order to accurately calculate the mean glacier elevation change, we excluded the glacier surface pixels with a slope angle of greater than 25 degrees from the results of the glacier elevation changes [31]. Moreover, over an altitude band, we only used the pixels where the elevation changes differed by less than three standard deviations from the mean values, to minimize the impact of random errors.
The annual rate of glacier mass balance was calculated by dividing the estimated glacier mass balance by the integer number of years for the study period. Therefore, when the pair of DEMs were generated from images obtained in different months of the year, seasonal glacier mass change was a possible bias. In this study, the TanDEM-X InSAR data and ZY-3 optical images were acquired on 30 January 2012 and 31 January 2018, respectively. The SRTM InSAR data were obtained in mid-February 2000 [46]. For the similar dates of the year, no seasonal variation was corrected when calculating the annual rate of glacier mass balance during the periods of 2000–2012 and 2012–2018. Furthermore, considering the time period of about 30 years, seasonal variation was also neglected when calculating the annual rate of glacier mass balance between 1970 and 2000. However, the exact acquisition dates of the aerial stereo scenes used to generate the DEM for 1970 are not known.
The uncertainties of the estimated mean glacier elevation changes and annual glacier mass balances were evaluated using the standard law of error propagation. The detailed equations for the uncertainty analysis can be found in Liu et al. (2020) [47]. In this study, we employed the conversion factor uncertainty (±60 kg m−3) suggested by Huss (2013) [43]. Moreover, the uncertainty was assumed to be ±5% for the total glacier area because the glacier boundaries were delineated from satellite optical images [48].

3.3. Glacier Surface Velocity Calculation

The glacier surface displacement measurements were calculated using the cross-correlation algorithm in the frequency domain, which was proposed by Leprince et al. (2007) [49]. This method has been widely used for deriving glacier velocity [50,51,52]. The processing steps include orthorectification, co-registration, and correlation. The Landsat images were the L1T product, which has already been orthorectified by the USGS. Consequently, orthorectification was not necessary for the data processing [50]. The displacement measured using the cross-correlation algorithm relies on the feature points of the image pairs. Due to the lack of debris on the Chongce Glacier surface, a lot of experiments were conducted with different window sizes. Generally speaking, the initial window was set to a large size to roughly estimate the pixel-level displacement between the two patches, while the final window size was set as a smaller size to retrieve the subpixel displacement after the initial displacement was estimated [53]. Considering the displacement results and calculation efficiency, 64 × 64 pixels as the initial search window and 8 × 8 pixels as the final window were selected to extract the glacier displacement.
Considering the different resolutions of the Landsat TM images and the Landsat ETM+/OLI images, the sliding step was set to one pixel for the TM images and two pixels for the ETM+/OLI images, to derive horizontal displacements with the same resolution of 30 m. After the cross-correlation processing, a non-local means filter was applied to reduce the noise. Finally, the 2D glacier velocities were derived by dividing the horizontal ground displacements along the E/W and N/S directions by the time interval between the two images. The flow velocities were then converted to average annual velocities.
The main error sources for the glacier surface velocity are the image quality (due to snow cover, cloud cover, and glacier melt) and the image registration errors. Due to the lack of in-situ measurements of the glacier velocity of the Chongce Glacier, it was difficult to directly assess the results of the cross-correlation algorithm. Considering the stable properties of off-glacier areas that should not have been displaced is an approach that has been widely used to evaluate the cross-correlation performance. We used a method which is used to estimate the uncertainty of digital terrain models (DTMs) [54]. The detailed equations for the uncertainty analysis can be found in Sun et al. (2017) [50]. In this study, the uncertainty of the velocity results based on the off-glacier statistics was approximately ±10 m yr−1.

3.4. Glacier Terminus Delineation

In this study, the Landsat series data were used to quantify the terminus delineation of the Chongce Glacier, i.e., to estimate the terminus advance, stagnation, or retreat. We manually delineated the glacier terminus at different times from the Landsat images with little cloud contamination. As ice and snow have high reflectance in the visible band and low reflectance in the short-wave infrared band, the band ratio method was used to enhance the image contrast. Here, band 3 was divided by band 5 for the TM/ETM+ images, and band 4 was divided by band 5 for the OLI images. The surface of the Chongce Glacier is almost debris free, and it is easy to identify the glacier from the contrast-enhanced images. The uncertainty was assumed to be roughly the size of the image pixels, i.e., 60 m for the Landsat MSS images, 30 m for the Landsat TM images, and 15 m for the Landsat ETM+/OLI images [37].

4. Results

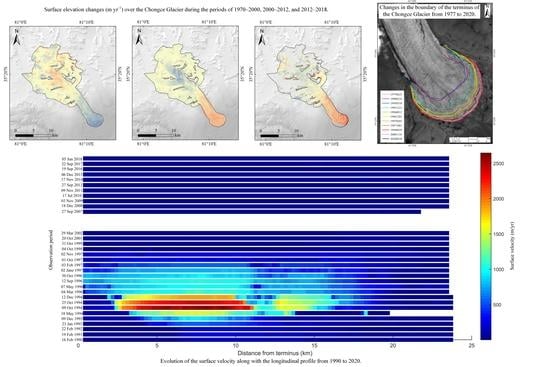
4.1. Glacier Surface Elevation Changes

Maps of the glacier surface elevation changes between 1970 and 2018 are given in Figure 2 for the Chongce Glacier. In the period of 1970–2000, pronounced glacier thickening can be observed over the terminus zone, whereas glacier thinning is apparent over the upper zone (Figure 2a). However, the spatial patterns of the glacier surface elevation changes in 2000–2012 and 2012–2018 are different from those in 1970–2000. Between 2000 and 2018, the Chongce Glacier experienced obvious surface lowering over the terminus zone, and clear surface thickening is apparent over the upper zone (Figure 2b,c). Moreover, for the terminus zone, the glacier surface elevation changes in 2012–2018 are slightly more negative than those in 2000–2012. In addition, for the upper zone, the glacier thickening in 2000–2012 is less than that in 2012–2018.
Between 1970 and 2000, we found a pronounced glacier surface thinning of −0.46 ± 0.12 m yr−1 and glacier mass loss of −0.39 ± 0.11 m w.e. yr−1 (Table 2), while a slight glacier surface thinning of −0.12 ± 0.05 m yr−1 and glacier mass loss of −0.10 ± 0.04 m w.e. yr−1 was measured in 2000–2012. During recent years (2012–2018), glacier surface thickening of 0.27 ± 0.11 m yr−1 (glacier mass gain of 0.23 ± 0.09 m w.e. yr−1) was estimated for the study site. Consequently, the estimated results between 1970 and 2018 indicates a decelerating rate of glacier surface thinning and glacier mass loss during the past five decades over the Chongce Glacier.

4.2. Glacier Surface Velocities

Figure 3, Figure 4 and Figure 5 show the temporal evolution of the flow velocities of the Chongce Glacier, as derived from the Landsat time-series images for the 1990s (Figure 3 and Figure 4), 2000s, and 2010s (Figure 5). The average annual velocity results for the Chongce Glacier during the period of 1990–2020 are provided in Figures S1–S46 (Supplementary Material). Due to the failure of the scan line corrector of the ETM+ sensor in May 2003, the velocity results in Figure S1 are missing the velocities for 2003–2007. As shown in Figure 3, the flow velocity shows obvious annual changes. During 1990–1991, the flow velocities in the mid-stream regions were about 100–150 m yr−1 (Figure 3a), after which point the velocities rose significantly. By winter 1994, the velocities in the mid-stream and downstream regions reached 2500 m yr−1 (Figure 4). However, during 1999–2020, only the velocities in the upstream were measured, and these were relatively small (at about 50 m yr−1, Figure 5), compared to the velocities in the 1990s. This can be attributed to the thin ice in the mid-stream and downstream regions of the glacier. When combined with Figure S1, it is apparent that the velocity of the Chongce Glacier increased slowly from 1990 to 1993, and the glacier then flowed rapidly during 1994–1998. Since this date, the velocity has remained very low, without obvious changes.
In order to further analyze the change of the glacier velocity, the evolution of the surface velocity along with the longitudinal profile of the Chongce Glacier (see Figure 1) from 1990 to 2020 is exhibited in Figure 6. In the early 1990s, the velocity accelerated slowly over the mid-stream area of the glacier, with an increase in velocity from 150 m yr−1 in 1990/1991 to 240 m yr−1 in 1992/1993. By December 1993, the velocity reached about 1000 m yr−1, which is about nine times more than the velocity in 1990/1991. The velocity then increased rapidly and reached a peak of 2500 m yr−1 during October to December in 1994. After this velocity peak, there was a significant deceleration, with the maximum velocity dropping to about 250 m yr−1 by 1997/1998, which represents a return to the velocity level seen in 1992/1993. This was followed by relatively low flow velocities during 1999–2020, with a maximum velocity of less than 100 m yr−1. Interestingly, the downstream of the glacier was almost stagnated, with velocities around zero, except for the period of 1996–1997.
In addition, the glacier velocity changes from 1990 to 2020 at different elevations are shown in Figure 7. Five elevation segments were selected to survey the characteristics of the glacier velocity with time at different elevations. The velocities shown in Figure 7 are the average velocity in the 100 m interval of each elevation segment. It can be found that the glacier velocity in the ablation area (5700–5800 m a.s.l. interval) and near the ELA (about 5930 m a.s.l.) increased at first in the 1990s, and then the velocity at the 5600–5700 m a.s.l. and 5400–5500 m a.s.l. intervals increased. The velocity at the 5400–6000 m a.s.l. interval showed an obvious increase from 1994 to 1998, while the velocity at the 6100–6200 m a.s.l. interval showed no significant increase. In addition, the velocity at the 5900–6000 m a.s.l. interval, which is close to the ELA, was the highest during 1998–2020 (Figure 7), which is in line with the laws of glacier movement.

4.3. Glacier Terminus Locations

The changes of the terminus boundaries of the Chongce Glacier are shown in Figure 8, where it can be found that the extent of the Chongce Glacier varied significantly from 1977 to 2020. The terminus of the glacier retreated about 1 km from June 1977 to February 1990. From February 1990 to March 1995, there was no obvious change of the terminus position of the glacier, and only a slight widening, which increased the tongue area. However, from March to December 1995, the terminus advanced significantly over the nine months. The terminus advanced by about 650 m, with the greatest speed (about 824 m yr−1) seen during the whole study period. The terminus position subsequently continued to advance up to September 1999, and then remained stable until 2007. For the period of March 1995 to September 1999, the glacier terminus advanced by about 1.6 km. After this, there was a slight retreat (about 150 m) and narrowing at the terminus of the glacier, and the terminus position in September 2020 is comparable to that in October 1997.

5. Discussion

5.1. Comparison with Previously Published Results

Between 1970 and 2000, we detected significant glacier thickening over the terminus zone and clear thinning over the upper zone, which is generally consistent with the spatial feature of the observed glacier surface elevation changes in Wang et al. (2018) [17]. Moreover, we estimated the glacier mass balance to be −0.10 ± 0.04 m w.e. yr−1 in the Chongce Glacier between 2000 and 2012, which is more negative than that (−0.048 m w.e. yr−1 in the period of 2000–2014) estimated by Lin et al. (2017) [25]. Considering the different time periods, this difference can be possibly attributed to a positive glacier mass change during 2012–2014. In this study, we obtained an obviously positive glacier mass change of 0.23 ± 0.09 m w.e. yr−1 between 2012 and 2018 (Table 2). This means that pronounced glacier mass gain is likely for the time period of 2012–2014 over the Chongce Glacier.
For 1996, we extracted a glacier surface velocity of about 1000 m yr−1, which is generally in agreement with that reported by Yasuda and Furuya (2015) [22]. By using the European Remote Sensing satellite (ERS)-1/2 InSAR data acquired in 1996, Yasuda and Furuya (2015) detected extremely rapid flow at the Chongce Glacier [22]. For the period of 2000–2020, we found that the surface flow velocity over the upper zone (about 60 m yr−1) was much higher than that over the tongue zone (less than 5 m yr−1). This spatial difference of the glacier surface flow velocity was also detected by Yasuda and Furuya (2013) from Phased Array type L-band Synthetic Aperture Radar (PALSAR) images of 2003–2011 [23]. We believe that this stagnant glacier tongue zone indicates that this region is either not thick enough to flow or is entirely frozen to the bedrock.
In this study, we found that the terminus position of the Chongce Glacier retreated during the time periods of 1977–1995 and 2000–2020, which is generally supported by the results reported in Wang et al. (2018) [17]. Specifically, Wang et al. (2018) observed pronounced terminus retreat for 1977–1990 and 2011–2016 [17]. Furthermore, our measured terminus advance between 1995 and 1999 is also consistent with the changes in terminus position during a similar time period derived by Yasuda and Furuya (2015) (1993–1999) [22] and Wang et al. (2018) (1990–2011) [17]. However, we detected a terminus advance of about 1.6 km from 1995 to 1999, which is less than that (2 km for 1992–2000) reported by Yasuda and Furuya (2015) [22]. This difference can be mainly attributed to the images used for delineating the terminus position. In this study, we delineated the terminus position using contrast-enhanced Landsat images, whereas SAR images were employed by Yasuda and Furuya (2015) [22].

5.2. Surge Event during the Study Period

During the active period of a surge-type glacier, the glacier mass in the accumulation area rapidly transfers to the ablation area, which results in thinning over the accumulation area and thickening over the ablation area. Based on the elevation changes shown in Figure 2 and the glacier surface elevation changes versus altitude shown in Figure 9, it can be found that the glacier thickened over the zones with an altitude of less than 5650 m a.s.l., whereas the glacier thinned over the zones above 5650 m a.s.l. during 1970–2000. This is consistent with the characteristics of a surge-type glacier. Consequently, it can be easily inferred that the Chongce Glacier surged in the period of 1970–2000. In addition, according to the elevation changes during 2000–2012 and 2012–2018, the glacier thinned over the zones below 5750 m a.s.l., whereas the glacier thickened over the zones above 5750 m a.s.l.. This is in agreement with either the characteristics of the quiescent phase of a surge-type glacier or a normal glacier.
Our analysis of the changes in the glacier velocity (1990–2020) and boundary (1977–2020) indicated that the Chongce Glacier surge event occurred in the 1990s. According to the changes of surface velocity along with the longitudinal profile shown in Figure 6, it can be inferred that the Chongce Glacier surged from December 1993 to October 1998. This is consistent with the findings of Yasuda and Furuya (2015), who also inferred that the Chongce Glacier surged in the 1990s [22]. However, they did not determine the start date or the duration of the surge. In addition, we found that the surge behavior of the Chongce Glacier mainly affected the velocity in the downstream area, while the effect on the velocity in the upstream area was relatively small. Specifically, the velocities in the downstream area clearly increased during the active phase, while the velocities in the upstream area showed no significant increase (Figure 6 and Figure 7).
The advancing of the terminus caused by the glacier surge lagged about one and a half years behind the increase of glacier velocity resulting from the glacier surge. The terminus advancing started in March 1995 (Figure 8), while the surface velocity increase started in December 1993 (Figure 6). This can be attributed to the fact that the ice mass was not moved to the glacier terminus directly when the glacier began to surge. Similarly, the velocity returned to the pre-surge level after October in 1998, while the terminus of the glacier continued to advance until September 1999.
It is worth noting that the velocity during the post-surge period (the average velocity was less than 20 m yr−1 during 1998–2020) was much less than the velocity during the pre-surge period (the average velocity was about 70 m yr−1 during 1990–1993). In order to better analyze the changes of glacier velocity over the last 10 years, the evolution of the surface velocity along with the longitudinal profile of the Chongce Glacier from 2007 to 2020 is provided in Figure 10. It can be found that the glacier velocity shows an increasing tendency from 2010 to 2020, which is consistent with the positive mass balance for 2012–2018 (Table 2). This pattern is also similar to the gradual increase of velocity seen during the pre-surge period of 1990–1993. Consequently, this increase of the glacier velocity in recent years may be advance warning of the next surge event of the Chongce Glacier.

5.3. Trigger Mechanism for the Detected Surge Event

Two main triggering mechanisms have been believed for glacier surge events [55,56,57]. Thermal-controlled glacier surge involves increasing basal thermal temperature, which contributes to an increase in meltwater and reduces the resistance to flow. In addition, thermal-controlled glacier surge initiates gradually and terminates at any time of the year, with a long active phase (>3 years) and a long surge cycle [22,58,59]. The thermal-controlled glacier surges are mostly recognized in Svalbard [2]. However, hydrological-controlled surge related to the changes in the efficiency of the hydrological system. The hydrological-controlled glacier surges are mostly recognized in Alaska [2]. In addition, they generally initiate in the winter months and terminate in the summer months, with a relatively short active phase (1–3 years) [22,58,59].
The changes in glacier elevation (1970–2018), glacier surface velocity (1990–2020), and terminus position (1977–2020) indicate that a surge event occurred at the Chongce Glacier in winter 1993, and this surge-type behavior continued for about five years. The velocity suddenly increased in winter 1993 and decreased in winter 1998 which suggests that the surge of the Chongce Glacier is consistent with the features of a thermal-controlled glacier surge. In addition, the surge of the Chongce Glacier lasted for about 5 years, and only one surge event occurred during 1990–2020, which indicated the long quiescent phase (at least 22 years (1998–2020)) and long surge cycle (at least 27 years (1993–2020)). This pattern also matches the characteristics of a thermal-controlled glacier surge. Consequently, we infer that the surge of the Chongce Glacier was triggered by a thermal mechanism.
The active phase of the Chongce glacier was about 5 years, and the peak velocity occurred near the terminus of the Chongce Glacier (Figure 6). These characteristics are consistent with the West Kunlun Glacier and the N2 Glacier in the WKS reported by Yasuda and Furuya (2015) [22]. In addition, Yasuda and Furuya (2015) found that the velocities of the West Kunlun Glacier and the N2 Glacier are faster in winter than those in summer, with a nearly 200% velocity increase in winter, and the surge events are modulated by a hydrological mechanism [22]. However, the velocities of the Chongce Glacier showed no significant seasonal change in the amplitude. Furthermore, Yasuda and Furuya (2015) and Chudley and Willis (2018) concluded that two kinds of mechanisms jointly drive the glacier surges in the glaciers of the WKS [22,59]. This is also the case for the surge-type glaciers in the Karakoram region, where the surges are controlled by both the thermal and hydrological conditions [36,58,60]. Without doubt, the trigger mechanisms are complex, and the trigger mechanism for the Chongce Glacier and the different mechanisms of the surge-type glaciers in the WKS are worthy of further study.

6. Conclusions

In this study, the geometric evolution of the Chongce Glacier since the 1970s was investigated by detecting the changes in glacier surface elevation, flow velocity, and terminus position through the use of multi-source satellite remote sensing data. By comparing the available topographic map, the SRTM-X DEM, and DEMs generated from TanDEM-X bistatic InSAR images and ZiYuan-3 stereo scenes, we derived glacier surface elevation changes and found that this glacier experienced obvious surface lowering over the low-altitude zone and clear surface thickening over the high-altitude zone during 1970–2000, and the opposite during the time periods of 2000–2012 and 2012–2018. Moreover, with the conversion factor of 850 kg m−3, glacier mass balances of −0.39 ± 0.11, −0.10 ± 0.04 and 0.23 ± 0.09 m w.e. yr−1 were estimated for the periods of 1970–2000, 2000–2012, and 2012–2018, respectively. It indicates a decelerating rate of glacier mass loss for the Chongce Glacier over the past five decades.
The surface flow velocity in 1990–2020 and terminus position between 1977 and 2020 were retrieved from multi-temporal Landsat optical scenes. In general, the surface velocities from winter 1993 to winter 1998 were much higher than those of the other time periods over the past three decades. The glacier terminus advanced about 1.6 km from March 1995 to September 1999, while a slight retreat was basically observed before March 1995 and after September 1999. Overall, our results indicated that the recent surge event at the Chongce Glacier started in December 1993 and ended in late 1998. The active phase of this surge-type glacier was therefore about five years. The difference in the start dates of the velocity acceleration and the terminus advance is about one and a half years, which can be attributed to the movement of the ice mass from the upper zone to the terminus. According to the start and end time of the surge and the duration of the active phase, we conclude that the recent surge event at the Chongce Glacier was likely triggered by a thermal mechanism.

Supplementary Materials

The following are available online at https://www.mdpi.com/article/10.3390/rs13183759/s1, Table S1: Landsat image pairs used for velocity determination in this study, Table S2: Landsat images used for terminus delineation in this study, Figure S1: Flow velocities of the Chongce Glacier during the period of 19900216-19910219, Figure S2: Flow velocities of the Chongce Glacier during the period of 19910219-19920222, Figure S3: Flow velocities of the Chongce Glacier during the period of 19920222-19930224, Figure S4: Flow velocities of the Chongce Glacier during the period of 19930123-19931225, Figure S5: Flow velocities of the Chongce Glacier during the period of 19930123-19930429, Figure S6: Flow velocities of the Chongce Glacier during the period of 19931209-19931225, Figure S7: Flow velocities of the Chongce Glacier during the period of 19940518-19940619, Figure S8: Flow velocities of the Chongce Glacier during the period of 19941009-19941025, Figure S9: Flow velocities of the Chongce Glacier during the period of 19941009-19941212, Figure S10: Flow velocities of the Chongce Glacier during the period of 19941025-19941212, Figure S11: Flow velocities of the Chongce Glacier during the period of 19941212-19950318, Figure S12: Flow velocities of the Chongce Glacier during the period of 19960304-19960507, Figure S13: Flow velocities of the Chongce Glacier during the period of 19960304-19960912, Figure S14: Flow velocities of the Chongce Glacier during the period of 19960304-19961030, Figure S15: Flow velocities of the Chongce Glacier during the period of 19960304-19961115, Figure S16: Flow velocities of the Chongce Glacier during the period of 19960304-19961201, Figure S17: Flow velocities of the Chongce Glacier during the period of 19960507-19960912, Figure S18: Flow velocities of the Chongce Glacier during the period of 19960507-19961030, Figure S19: Flow velocities of the Chongce Glacier during the period of 19960507-19961115, Figure S20: Flow velocities of the Chongce Glacier during the period of 19960507-19961201, Figure S21: Flow velocities of the Chongce Glacier during the period of 19960912-19961030, Figure S22: Flow velocities of the Chongce Glacier during the period of 19960912-19961115, Figure S23: Flow velocities of the Chongce Glacier during the period of 19960912-19961201, Figure S24: Flow velocities of the Chongce Glacier during the period of 19961030-19961201, Figure S25: Flow velocities of the Chongce Glacier during the period of 19961201-19971102, Figure S26: Flow velocities of the Chongce Glacier during the period of 19970102-19970203, Figure S27: Flow velocities of the Chongce Glacier during the period of 19970203-19971001, Figure S28: Flow velocities of the Chongce Glacier during the period of 19971001-19971102, Figure S29: Flow velocities of the Chongce Glacier during the period of 19971001-19981004, Figure S30: Flow velocities of the Chongce Glacier during the period of 19971001-19991031, Figure S31: Flow velocities of the Chongce Glacier during the period of 19981004-19990929, Figure S32: Flow velocities of the Chongce Glacier during the period of 19991031-20011020, Figure S33: Flow velocities of the Chongce Glacier during the period of 20001204-20011020, Figure S34: Flow velocities of the Chongce Glacier during the period of 20011020-20021124, Figure S35: Flow velocities of the Chongce Glacier during the period of 20020329-20030401, Figure S36: Flow velocities of the Chongce Glacier during the period of 20070927-20091002, Figure S37: Flow velocities of the Chongce Glacier during the period of 20081218-20101224, Figure S38: Flow velocities of the Chongce Glacier during the period of 20091103-20111109, Figure S39: Flow velocities of the Chongce Glacier during the period of 20100717-20110805, Figure S40: Flow velocities of the Chongce Glacier during the period of 20111109-20131130, Figure S41: Flow velocities of the Chongce Glacier during the period of 20130927-20140930, Figure S42: Flow velocities of the Chongce Glacier during the period of 20141117-20151120, Figure S43: Flow velocities of the Chongce Glacier during the period of 20151206-20161208, Figure S44: Flow velocities of the Chongce Glacier during the period of 20160919-20170922, Figure S45: Flow velocities of the Chongce Glacier during the period of 20170922-20180925, Figure S46: Flow velocities of the Chongce Glacier during the period of 20180605-20200626.

Author Contributions

Conceptualization, Y.S. and L.L.; Data curation, Y.P. and K.W.; Formal analysis, Y.S. and L.L.; Funding acquisition, Y.S., L.L. and Y.P.; Methodology, Y.S. and L.L.; Supervision, L.L.; Validation, Y.P. and K.W.; Visualization, Y.S. and L.L.; Writing—original draft, Y.S. and L.L.; Writing—review & editing, L.L. All authors have read and agreed to the published version of the manuscript.

Funding

This study was jointly supported by the National Natural Science Foundation of China [41904008, 41704023] and the Key Research Program of the Department of Education of Anhui Province, China [KJ2018A0503] and the State Key Laboratory of Geodesy and Earth’s Dynamics [SKLGED2019-2-2-E].

Institutional Review Board Statement

Not applicable.

Informed Consent Statement

Not applicable.

Data Availability Statement

The TanDEM-X bistatic InSAR data sets and the SRTM-X DEM were provided by the German Aerospace Center (DLR); The Landsat optical images were downloaded from the United States Geological Survey (USGS, https://earthexplorer.usgs.gov/, accessed on 3 August 2021); The 1:100,000 topographic map were provided by the Ministry of Natural Resources of the People’s Republic of China.

Conflicts of Interest

The authors declare no conflict of interest.

References

  1. Meier, M.F.; Post, A. What are glacier surges? Can. J. Earth Sci. 1969, 6, 807–817. [Google Scholar] [CrossRef]
  2. Quincey, D.J.; Glasser, N.F.; Cook, S.J.; Luckman, A. Heterogeneity in Karakoram glacier surges. J. Geophys. Res. Earth Surf. 2015, 120, 1288–1300. [Google Scholar] [CrossRef] [Green Version]
  3. Copland, L.; Sylvestre, T.; Bishop, M.P.; Shroder, J.F.; Seong, Y.B.; Owen, L.A.; Bush, A.; Kamp, U. Expanded and Recently Increased Glacier Surging in the Karakoram. Arct. Antarct. Alp. Res. 2011, 43, 503–516. [Google Scholar] [CrossRef] [Green Version]
  4. Guo, L.; Li, J.; Wu, L.; Li, Z.; Liu, Y.; Li, X.; Miao, Z.; Wang, W. Investigating the Recent Surge in the Monomah Glacier, Central Kunlun Mountain Range with Multiple Sources of Remote Sensing Data. Remote Sens. 2020, 12, 966. [Google Scholar] [CrossRef] [Green Version]
  5. Hewitt, K. Glacier surges in the Karakoram Himalaya (Central Asia). Can. J. Earth Sci. 1969, 6, 1009–1018. [Google Scholar] [CrossRef]
  6. Post, A. The Recent Surge of Walsh Glacier, Yukon and Alaska. J. Glaciol. 1966, 6, 375–381. [Google Scholar] [CrossRef] [Green Version]
  7. Schytt, V. Some comments on glacier surges in eastern Svalbard. Can. J. Earth Sci. 1969, 6, 867–873. [Google Scholar] [CrossRef]
  8. Yao, X.; Iqbal, J.; Li, L.-J.; Zhou, Z.-K. Characteristics of mountain glacier surge hazard: Learning from a surge event in NE Pamir, China. J. Mt. Sci. 2020, 16, 1515–1533. [Google Scholar] [CrossRef]
  9. Round, V.; Leinss, S.; Huss, M.; Haemmig, C.; Hajnsek, I. Surge dynamics and lake outbursts of Kyagar Glacier, Karakoram. Cryosphere 2017, 11, 723–739. [Google Scholar] [CrossRef] [Green Version]
  10. Desio, A. An Exceptional Glacier Advance in the Karakoram—Ladakh Region. J. Glaciol. 1954, 2, 383–385. [Google Scholar] [CrossRef] [Green Version]
  11. Leclercq, P.W.; Kääb, A.; Altena, B. Brief Communication: Detection of glacier surge activity using cloud computing of Sentinel-1 radar data. Cryosphere Discuss. 2021, 1–10. [Google Scholar] [CrossRef]
  12. Bai, X.; He, S. Dynamic process of the massive Aru glacier collapse in Tibet. Landslides 2020, 17, 1353–1361. [Google Scholar] [CrossRef]
  13. Zhang, Z.; Liu, S.; Zhang, Y.; Wei, J.; Jiang, Z.; Wu, K. Glacier variations at Aru Co in western Tibet from 1971 to 2016 derived from remote-sensing data. J. Glaciol. 2018, 64, 397–406. [Google Scholar] [CrossRef] [Green Version]
  14. Tian, L.; Yao, T.; Gao, Y.; Thompson, L.; Mosley-Thompson, E.; Muhammad, S.; Zong, J.; Wang, C.; Jin, S.; Li, Z. Two glaciers collapse in western Tibet. J. Glaciol. 2016, 63, 194–197. [Google Scholar] [CrossRef] [Green Version]
  15. Ma, Q. Monitoring Glacier Change on West Kunlun Shan Based on Multi-Source Remote Sensing Data; Nanjing University: Nanjing, China, 2018. [Google Scholar]
  16. Cao, B.; Guan, W.; Li, K.; Wen, Z.; Han, H.; Pan, B. Area and Mass Changes of Glaciers in the West Kunlun Mountains Based on the Analysis of Multi-Temporal Remote Sensing Images and DEMs from 1970 to 2018. Remote Sens. 2020, 12, 2632. [Google Scholar] [CrossRef]
  17. Wang, Y.; Hou, S.; Huai, B.; An, W.; Pang, H.; Liu, Y. Glacier anomaly over the western Kunlun Mountains, Northwestern Tibetan Plateau, since the 1970s. J. Glaciol. 2018, 64, 624–636. [Google Scholar] [CrossRef] [Green Version]
  18. Ke, L.; Ding, X.; Song, C. Heterogeneous changes of glaciers over the western Kunlun Mountains based on ICESat and Landsat-8 derived glacier inventory. Remote Sens. Environ. 2015, 168, 13–23. [Google Scholar] [CrossRef]
  19. Brun, F.; Berthier, E.; Wagnon, P.; Kääb, A.; Treichler, D. A spatially resolved estimate of High Mountain Asia glacier mass balances from 2000 to 2016. Nat. Geosci. 2017, 10, 668–673. [Google Scholar] [CrossRef] [PubMed]
  20. Shangguan, D.; Liu, S.; Ding, Y.; Li, J.; Zhang, Y.; Ding, L.; Wang, X.; Xie, C.; Li, G. Glacier changes in the west Kunlun Shan from 1970 to 2001 derived from Landsat TM/ETM+ and Chinese glacier inventory data. Ann. Glaciol. 2007, 46, 204–208. [Google Scholar] [CrossRef] [Green Version]
  21. Muhammad, S.; Tian, L. Mass balance and a glacier surge of Guliya ice cap in the western Kunlun Shan between 2005 and 2015. Remote Sens. Environ. 2020, 244, 111832. [Google Scholar] [CrossRef]
  22. Yasuda, T.; Furuya, M. Dynamics of surge-type glaciers in West Kunlun Shan, Northwestern Tibet. J. Geophys. Res. Earth Surf. 2015, 120, 2393–2405. [Google Scholar] [CrossRef] [Green Version]
  23. Yasuda, T.; Furuya, M. Short-term glacier velocity changes at West Kunlun Shan, Northwest Tibet, detected by Synthetic Aperture Radar data. Remote Sens. Environ. 2013, 128, 87–106. [Google Scholar] [CrossRef] [Green Version]
  24. Fu, X.; Li, Z.; Zhou, J. Characterizing the surge behavior of Alakesayi Glacier in the West Kunlun Shan, Northwestern Tibetan Plateau, from remote-sensing data between 2013 and 2018. J. Glaciol. 2019, 65, 168–172. [Google Scholar] [CrossRef] [Green Version]
  25. Lin, H.; Li, G.; Cuo, L.; Hooper, A.; Ye, Q. A decreasing glacier mass balance gradient from the edge of the Upper Tarim Basin to the Karakoram during 2000-2014. Sci. Rep. 2017, 7, 6712. [Google Scholar] [CrossRef] [PubMed]
  26. Yan, S.; Ruan, Z.; Liu, G.; Deng, K.; Lv, M.; Perski, Z. Deriving Ice Motion Patterns in Mountainous Regions by Integrating the Intensity-Based Pixel-Tracking and Phase-Based D-InSAR and MAI Approaches: A Case Study of the Chongce Glacier. Remote Sens. 2016, 8, 611. [Google Scholar] [CrossRef] [Green Version]
  27. Guo, W.; Liu, S.; Xu, J.; Wu, L.; Shangguan, D.; Yao, X.; Wei, J.; Bao, W.; Yu, P.; Liu, Q. The second Chinese glacier inventory: Data, methods and results. J. Glaciol. 2015, 61, 357–372. [Google Scholar] [CrossRef] [Green Version]
  28. Scherler, D.; Bookhagen, B.; Strecker, M.R. Spatially variable response of Himalayan glaciers to climate change affected by debris cover. Nat. Geosci. 2011, 4, 156–159. [Google Scholar] [CrossRef]
  29. Kang, X.; Xie, Y. The character of the weather and climate in the West Kulun Mountains area in summer, 1987. Bull. Glacier Res. 1989, 7, 77–81. [Google Scholar]
  30. Walker, W.S.; Kellndorfer, J.M.; Pierce, L.E. Quality assessment of SRTM C-and X-band interferometric data: Implications for the retrieval of vegetation canopy height. Remote Sens. Environ. 2007, 106, 428–448. [Google Scholar] [CrossRef]
  31. Liu, L.; Jiang, L.; Sun, Y.; Yi, C.; Wang, H.; Hsu, H. Glacier elevation changes (2012–2016) of the Puruogangri Ice Field on the Tibetan Plateau derived from bi-temporal TanDEM-X InSAR data. Int. J. Remote Sens. 2016, 37, 5687–5707. [Google Scholar] [CrossRef]
  32. Pan, H.; Zhang, G.; Tang, X.; Li, D.; Zhu, X.; Zhou, P.; Jiang, Y. Basic Products of the ZiYuan-3 Satellite and Accuracy Evaluation. Photogramm. Eng. Remote Sens. 2013, 79, 1131–1145. [Google Scholar] [CrossRef]
  33. Paul, F. Revealing glacier flow and surge dynamics from animated satellite image sequences: Examples from the Karakoram. Cryosphere 2015, 9, 2201–2214. [Google Scholar] [CrossRef] [Green Version]
  34. Dehecq, A.; Gourmelen, N.; Trouve, E. Deriving large-scale glacier velocities from a complete satellite archive: Application to the Pamir–Karakoram–Himalaya. Remote Sens. Environ. 2015, 162, 55–66. [Google Scholar] [CrossRef] [Green Version]
  35. Heid, T.; Kääb, A. Repeat optical satellite images reveal widespread and long term decrease in land-terminating glacier speeds. Cryosphere 2012, 6, 467–478. [Google Scholar] [CrossRef] [Green Version]
  36. Mayer, C.; Fowler, A.C.; Lambrecht, A.; Scharrer, K. A surge of North Gasherbrum Glacier, Karakoram, China. J. Glaciol. 2011, 57, 904–916. [Google Scholar] [CrossRef] [Green Version]
  37. Wychen, W.V.; Davis, J.; Burgess, D.O.; Copland, L.; Gray, L.; Sharp, M.; Mortimer, C. Characterizing interannual variability of glacierdynamics and dynamic discharge (1999–2015)for the ice masses of Ellesmere and AxelHeiberg Islands, Nunavut, Canada. J. Geophys. Res. Earth Surf. 2015, 121, 39–63. [Google Scholar] [CrossRef] [Green Version]
  38. Zhou, Y.; Li, Z.; Li, J.I.A. Slight glacier mass loss in the Karakoram region during the 1970s to 2000 revealed by KH-9 images and SRTM DEM. J. Glaciol. 2017, 63, 331–342. [Google Scholar] [CrossRef] [Green Version]
  39. Wendt, A.; Mayer, C.; Lambrecht, A.; Floricioiu, D. A Glacier Surge of Bivachny Glacier, Pamir Mountains, Observed by a Time Series of High-Resolution Digital Elevation Models and Glacier Velocities. Remote Sens. 2017, 9, 388. [Google Scholar] [CrossRef] [Green Version]
  40. Gardelle, J.; Berthier, E.; Arnaud, Y. Impact of resolution and radar penetration on glacier elevation changes computed from DEM differencing. J. Glaciol. 2012, 58, 419–422. [Google Scholar] [CrossRef] [Green Version]
  41. Liu, L.; Jiang, L.; Jiang, H.; Wang, H.; Ma, N.; Xu, H. Accelerated glacier mass loss (2011–2016) over the Puruogangri ice field in the inner Tibetan Plateau revealed by bistatic InSAR measurements. Remote Sens. Environ. 2019, 231, 111241. [Google Scholar] [CrossRef]
  42. Nuth, C.; Kääb, A. Co-registration and bias corrections of satellite elevation data sets for quantifying glacier thickness change. Cryosphere 2011, 5, 271–290. [Google Scholar] [CrossRef] [Green Version]
  43. Huss, M. Density assumptions for converting geodetic glacier volume change to mass change. Cryosphere 2013, 7, 877–887. [Google Scholar] [CrossRef] [Green Version]
  44. Gardelle, J.; Berthier, E.; Arnaud, Y. Slight mass gain of Karakoram glaciers in the early twenty-first century. Nat. Geosci. 2012, 5, 322–325. [Google Scholar] [CrossRef]
  45. Berthier, E.; Arnaud, Y.; Baratoux, D.; Vincent, C.; Rémy, F. Recent rapid thinning of the “Mer de Glace” glacier derived from satellite optical images. Geophys. Res. Lett. 2004, 31, L17401. [Google Scholar] [CrossRef] [Green Version]
  46. Rabus, B.; Eineder, M.; Roth, A.; Bamler, R. The shuttle radar topography mission—A new class of digital elevation models acquired by spaceborne radar. ISPRS J. Photogramm. Remote Sens. 2003, 57, 241–262. [Google Scholar] [CrossRef]
  47. Liu, L.; Jiang, L.; Wang, H.; Ding, X.; Xu, H. Estimation of glacier mass loss and its contribution to river runoff in the source region of the Yangtze River during 2000–2018. J. Hydrol. 2020, 589, 125207. [Google Scholar] [CrossRef]
  48. Paul, F.; Barrand, N.E.; Baumann, S.; Berthier, E.; Bolch, T.; Casey, K.; Frey, H.; Joshi, S.; Konovalov, V.; Le Bris, R. On the accuracy of glacier outlines derived from remote-sensing data. Ann. Glaciol. 2013, 54, 171–182. [Google Scholar] [CrossRef] [Green Version]
  49. Leprince, S.; Barbot, S.; Ayoub, F.; Avouac, J.-P. Automatic and Precise Orthorectification, Coregistration, and Subpixel Correlation of Satellite Images, Application to Ground Deformation Measurements. IEEE Trans. Geosci. Remote Sens. 2007, 45, 1529–1558. [Google Scholar] [CrossRef] [Green Version]
  50. Sun, Y.; Jiang, L.; Liu, L.; Sun, Y.; Wang, H. Spatial-Temporal Characteristics of Glacier Velocity in the Central Karakoram Revealed with 1999–2003 Landsat-7 ETM+ Pan Images. Remote Sens. 2017, 9, 1064. [Google Scholar] [CrossRef] [Green Version]
  51. Nobakht, M.; Motagh, M.; Wetzel, H.-U.; Roessner, S.; Kaufmann, H. The Inylchek Glacier in Kyrgyzstan, Central Asia: Insight on Surface Kinematics from Optical Remote Sensing Imagery. Remote Sens. 2014, 6, 841–856. [Google Scholar] [CrossRef] [Green Version]
  52. Scherler, D.; Leprince, S.; Strecker, M. Glacier-surface velocities in alpine terrain from optical satellite imagery—Accuracy improvement and quality assessment. Remote Sens. Environ. 2008, 112, 3806–3819. [Google Scholar] [CrossRef]
  53. Ayoub, F.; Leprince, S.; Keene, L. User’s Guide to COSI-CORR Co-Registration of Optically Sensed Images and Correlation; California Institute of Technology: Pasadena, CA, USA, 2009; Volume 38. [Google Scholar]
  54. Bolch, T.; Pieczonka, T.; Benn, D.I. Multi-decadal mass loss of glaciers in the Everest area (Nepal Himalaya) derived from stereo imagery. Cryosphere 2011, 5, 349–358. [Google Scholar] [CrossRef] [Green Version]
  55. Clarke, G.K.; Schmok, J.P.; Ommanney, C.S.L.; Collins, S.G. Characteristics of surge-type glaciers. J. Geophys. Res. Solid Earth 1986, 91, 7165–7180. [Google Scholar] [CrossRef]
  56. Kamb, B.; Raymond, C.; Harrison, W.; Engelhardt, H.; Echelmeyer, K.; Humphrey, N.; Brugman, M.; Pfeffer, T. Glacier surge mechanism: 1982–1983 surge of Variegated Glacier, Alaska. Science 1985, 227, 469–479. [Google Scholar] [CrossRef] [PubMed] [Green Version]
  57. Xu, J.; Shangguan, D.; Wang, J. Recent surging event of a glacier on Geladandong Peak on the Central Tibetan Plateau. J. Glaciol. 2021, 1–7. [Google Scholar] [CrossRef]
  58. Quincey, D.J.; Braun, M.; Glasser, N.F.; Bishop, M.P.; Hewitt, K.; Luckman, A. Karakoram glacier surge dynamics. Geophys. Res. Lett. 2011, 38, L18504. [Google Scholar] [CrossRef] [Green Version]
  59. Chudley, T.R.; Willis, I.C. Glacier surges in the north-west West Kunlun Shan inferred from 1972 to 2017 Landsat imagery. J. Glaciol. 2018, 65, 1–12. [Google Scholar] [CrossRef] [Green Version]
  60. Paul, F.; Strozzi, T.; Schellenberger, T.; Kääb, A. The 2015 Surge of Hispar Glacier in the Karakoram. Remote Sens. 2017, 9, 888. [Google Scholar] [CrossRef] [Green Version]
Figure 1. The geographic location of the study area. The coverages of the TanDEM-X, ZiYuan-3, and Landsat TM/ETM+/OLI data are shown as purple, black, and red triangles, respectively, in (a). The inset picture in (a) shows the general location of the Chongce Glacier, and the red area in the inset map indicates the position of the study area. The background in (b) is the Landsat ETM+ image acquired on 3 July 2002, with the red and blue lines respectively marking the outlines and the centerline of the Chongce Glacier, which were acquired from the Second Chinese Glacier Inventory [27].
Remotesensing 13 03759 g001
Figure 2. Observed surface elevation changes (m yr−1) over the Chongce Glacier during the periods of 1970–2000 (a), 2000–2012 (b), and 2012–2018 (c). Note that the coverage of the ZY-3 images (see Figure 1) resulted in the data missing in the southwest part (c).
Remotesensing 13 03759 g002
Figure 3. Flow velocities (m yr−1) of the Chongce Glacier during the periods of 16 February 1990–19 February 1991 (a), 19 February 1991–22 February 1992 (b), and 22 February 1992–24 February 1993 (c).
Remotesensing 13 03759 g003
Figure 4. Flow velocities (m yr−1) of the Chongce Glacier during the periods of 9 October 1994–25 October 1994 (a), 25 October 1994–12 December 1994 (b), and 12 December 1994–18 March 1995 (c).
Remotesensing 13 03759 g004
Figure 5. Flow velocities (m yr−1) of the Chongce Glacier during the periods of 31 October 1999–20 October 2001 (a), 18 December 2008–24 December 2010 (b), and 5 June 2018–26 June 2020 (c).
Remotesensing 13 03759 g005
Figure 6. Evolution of the surface velocity along with the longitudinal profile (see Figure 1) from 1990 to 2020. Note that the scale is logarithmic.
Remotesensing 13 03759 g006
Figure 7. The glacier velocity changes from 1990 to 2020 at different elevations.
Remotesensing 13 03759 g007
Figure 8. Changes in the boundary of the terminus of the Chongce Glacier from 1977 to 2020. The background is the Landsat ETM+ image acquired on 29 September 1999.
Remotesensing 13 03759 g008
Figure 9. Glacier surface elevation changes versus altitude over the Chongce Glacier during the periods of 1970–2000, 2000–2012, and 2012–2018.
Remotesensing 13 03759 g009
Figure 10. Evolution of surface velocity along with the longitudinal profile (see Figure 1) from 2007 to 2020.
Remotesensing 13 03759 g010
Table 1. DEM data used in this study.
DataDatePixel Size
Topographic map197050 m
SRTM-X DEMFebruary 200030 m
TanDEM-X DEM30 January 201210 m
ZY-3 DEM31 January 201810 m
Table 2. Estimated average glacier elevation change and glacier mass balance between 1970 and 2018 over the Chongce Glacier.
Time PeriodGlacier Elevation Change
(m yr−1)
Glacier Mass Balance
(m w.e. yr−1)
1970–2000−0.46 ± 0.12−0.39 ± 0.11
2000–2012−0.12 ± 0.05−0.10 ± 0.04
2012–20180.27 ± 0.110.23 ± 0.09
Publisher’s Note: MDPI stays neutral with regard to jurisdictional claims in published maps and institutional affiliations.

