Article

Reduction of Air Pollution in Poland in Spring 2020 during the Lockdown Caused by the COVID-19 Pandemic

by
Patryk Tadeusz Grzybowski
1,*,
Krzysztof Mirosław Markowicz
1 and
Jan Paweł Musiał
2
1
Institute of Geophysics, Faculty of Physics, University of Warsaw, 02-093 Warsaw, Poland
2
Remote Sensing Centre, Institute of Geodesy and Cartography, 02-679 Warsaw, Poland
*
Author to whom correspondence should be addressed.
Remote Sens. 2021, 13(18), 3784; https://doi.org/10.3390/rs13183784
Submission received: 23 August 2021 / Revised: 16 September 2021 / Accepted: 19 September 2021 / Published: 21 September 2021

Abstract

:
The COVID-19 pandemic has affected many aspects of human well-being including air quality. The present study aims at quantifying this effect by means of ground-level concentrations of NO2, PM2.5, as well as aerosol optical depth (AOD) measurements and tropospheric NO2 column number density (NO2 TVCD), during the imposed governmental restrictions in spring 2020. The analyses were performed for both urban and non-built-up areas across the whole of Poland accompanied by Warsaw (urban site) and Strzyzow (a background site). The results revealed that mean PM2.5 concentrations in spring 2020 for urban and non-built-up areas across Poland and for Warsaw were 20%, 23%, 15% lower than the 10-year average, respectively. Analogous mean NO2 concentrations were lower by 20%, 18%, 30% and NO2 TVCD revealed 9%, 4%, 9% reductions in 2020 as compared to 2019. Regarding mean AOD, retrieved from MERRA-2 reanalysis, it was found that for the whole of Poland during spring 2020 the reduction in AOD as compared to the 10-year average was 15%. The contribution of the lockdown within total air pollution reduction is not easily assessable due to anomalous weather conditions in 2020 which resulted in advection of clean air masses identified from MERRA-2 reanalysis and Strzyzow observatory.

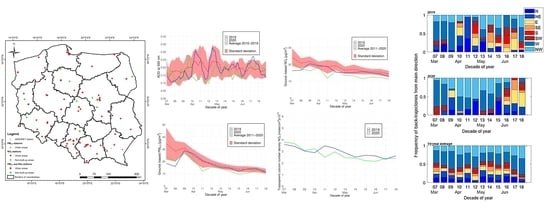
Graphical Abstract

1. Introduction

Air pollution is a severe threat to public health and has been proven to be the main cause of many fatal diseases. Air quality in Poland is one of the worst in the European Union. In this respect, the report of the National Health Fund (NFZ) has revealed that a potential reason for increased mortality in January and February 2017 was related to high air pollution [1]. Similar findings regarding those suffering from cardiovascular problems were reported by Sroczyński in 1988 [2], while the higher frequency of influenza is positively correlated with air pollution [1]. Furthermore, the European Environmental Agency (EEA) has quantified that around 47,000 people die every year due to poor air quality in Poland [3] leading to the conclusion that it has a negative impact on the human immune system [1]. Apart from particles less than 10 µm in diameter (PM10) and particles less than 2.5 µm in diameter (PM2.5), the main air pollutant that causes deaths in Poland is nitrogen dioxide (NO2). Poor air quality became an even more significant threat when the coronavirus (COVID-19) pandemic started in spring 2020, which was the main motivation for the present study.
The COVID-19 outbreak first occurred in December 2019 in the city of Wuhan, capital of the Chinese province of Hubei with more than 11 million citizens. This new coronavirus spread all over the world and by the end of March 2020 the World Health Organization (WHO) declared COVID-19 to be a global pandemic [4]. In Poland, the first pandemic restrictions, commonly known as ‘lockdown’ [5], were imposed on 15 March 2020 when the state borders were closed. One day later it was decided to close schools. The increasing number infected resulted in the most stringent restrictions being imposed from 11th to 20th April, when it was forbidden to go outdoors and to commute except for work. The restrictions were gradually removed from 20 April 2020 when going outdoors was allowed and on 6th June lockdown ceased apart from the requirement to wear face masks in indoor public places [6].
The indirect impact of the pandemic on air pollution has been investigated in numerous studies and Bauwens et al. [7] have analysed the distribution of NO2 in China, South Korea, USA, Iran and Western Europe. They confirmed that a significant reduction in tropospheric NO2 columns (NO2 TVCD) occurred during the lockdown in 2020 as compared to 2019. This decrease was attributed to a reduction in traffic and industrial emissions while meteorological conditions were found to be less significant. Ultimately, it was emphasized that further research focusing on other variables like aerosol optical depth (AOD) would further facilitate the analysis of observed air pollution reduction. Similar results were reported by National Aeronautics and Space Administration (NASA) [8] and Dutheil et al. [9] regarding the reduction in tropospheric NO2 column concentrations that were initially noticed around the area of Wuhan, and later in the whole of China. Worldwide reduction in NO2 pollution was also reported by Fu et al. [10] based on an analysis of twenty cities across the world, confirming the reduction in NO2 at all locations. However, the magnitude of this reduction varied from ca. −60% in Delhi to ca. −10% in Sydney. Venter et al. [11] studied NO2 and PM2.5 pollution in 34 countries worldwide using in-situ measurements and satellite products generated from the TROPOMI instrument onboard the Sentinel-5P platform and from the Moderate Resolution Imaging Spectroradiometer (MODIS) onboard the TERRA platform. They found that due to the lockdown the population-weighted concentration of NO2 dropped by 60% and the PM2.5 concentration dropped by 31%.
Studies on reductions in pollutants due to the COVID-19 lockdown were also carried out for Poland. Menut et al. [12] studied PM2.5 and NO2 reduction in March 2020, based on the WRF-CHIMERE model, with and without lockdown restrictions. There was a confirmed 27% NO2 reduction over urban areas and a 26% NO2 reduction over rural areas in comparison with expected concentrations, and additionally a 5% reduction in PM2.5 over rural areas. On the other hand, PM2.5 concentration was 4% higher in 2020 than expected without the lockdown effect over urban areas. Further, Filonchyk et al. [13] analysed changes of AOD derived from the MODIS sensor mounted onboard the AQUA and TERRA satellites, as well as NO2 columns derived from the OMI sensor mounted onboard the AURA satellite in 2020 across five main polish cities: Gdansk, Łodz, Krakow, Warsaw and Wroclaw. This study revealed 60%, 50% and 33% reduction in AOD over Warsaw during March, April and May 2020 respectively as compared to the same periods within 2019. Furthermore, the authors reported a ~6% increase of NO2 TVCD over Warsaw in the first half of March, ~ 5% decrease in the second half of March, ~9% increase in the first half of April and ~110% decrease in the second half of April in 2020 as compared to 2019. Moreover, concentrations of PM2.5 and NO2 were verified. Filonchyk et al. [13] claimed that PM2.5 concentration in Warsaw had changed by +25%, −20%, −12% in March, April and May, and NO2 concentration by −15%, −9%, −20%.
The main objective of the presented study is to analyse the reduction in atmospheric concentration of NO2, PM2.5 and AOD caused by the COVID-19 lockdown during spring 2020. A second objective is to establish a relationship between the reduction in air pollution during the lockdown and average meteorological conditions across the last decade. The study areas covered both urban and non-built-up areas across Poland and regional sites at Warsaw and the Strzyzow background observatory. The aforementioned studies covered a short time frame and did not analyse the specific weather conditions which occurred in Poland during spring 2020 (see Section 3). In this respect, the present study provides a broader perspective covering 10 years, utilises the novel TROPOMI sensor featuring finer spatial and spectral resolutions than OMI, and relates the estimated air pollution reduction to the Strzyzow background station. Section 2 of this paper describes the experiment in respect to the study area and input datasets, and describes its methodology including data (pre)processing. Section 3 describes the weather conditions that occurred in Poland during spring 2020 and discusses the results of the experiment. Final conclusions are included in Section 4.

2. Materials and Methods

2.1. Description of the Datasets Analyzed

This research consists of data analysis obtained from ground-based (PM2.5, NO2, AOD, equivalent black carbon concentration, aerosol scattering coefficient) and satellite observation for the NO2 column, as well as from model simulations and reanalysis (meteorological conditions including anomalies of temperatures in respect to climatology, relative frequencies of back-trajectories, frequency of surface inversions and AOD). The research focuses on the period of COVID-19 restrictions from 1st of March 2020 to 30th of June 2020.

2.1.1. Study Area

Poland is the study area for the research (Figure 1). Analyses for the whole country were made for PM2.5, NO2 and AOD, and to recognise the distribution of PM2.5 and NO2 pollution over differing types of land use, analyses were made both for urban areas and non-built-up areas. Moreover, concentrations of PM2.5 and NO2 were recorded over Warsaw to recognise any changes in pollution in the most populated city in Poland. Data on AOD, equivalent black carbon (eBC) concentration and the aerosol scattering coefficient at 525 nm were obtained from a station located in south-east of Poland (Strzyzow, 444 m a.s.l., 49.88°N, 21.86°E), which is in a non-built-up area.

2.1.2. In-Situ Air Quality Measurements

Air pollution in Poland is monitored by the Chief Inspectorate of Environmental Protection (GIOS) at 130 stations for NO2 and 40 stations for PM2.5 [14]. The number of stations is constantly changing, as some new ones are added and some old ones are discontinued. In this respect, in the present study only stations that have been continuously operating for an extensive period were used. In the case of the NO2, there were 68 urban stations and 10 non-built-up operational stations for the last 10 years (2011–2020). For PM2.5, the figures were 15 urban stations operational for the last 10 years (2011–2020), but there was only one non-built-up operational station for just 8 years (2013–2020). The 10 s measurements at a height of 2 m a.g.l. provided by GIOS as hourly means were further grouped into four subsets: (1) all stations in Poland, (2) urban stations, (3) non-built-up stations, (4) stations located in Warsaw.
GIOS measurements were complemented by a unique set of measurements from the Strzyzow background station, which is a part of the Aerosol Robotic Network (AERONET) [15]. The station is equipped with a CIMEL sun photometer [16], Aurora 4000 Nephelometer [17] and AE-31 Aethalometer [18] to measure AOD (at 340, 440, 500, 675, 870, 1020, 1640 nm), the aerosol scattering coefficient (at 450, 525 and 635 nm), and the eBC concentrations (370, 470, 520, 590, 660, 880, 950 nm). In cases of AOD from AERONET, the level of 2.0 and ver. 3.0 is used.

2.1.3. Tropospheric NO2 Column Density (NO2 TVCD) Retrieved from Sentinel-5P TROPOMI Measurements

The Sentinel-5P satellite was launched on 13 October 2017, as a part of the Copernicus Earth Observation Programme coordinated and managed by the European Commission and the European Space Agency (ESA). This satellite mission supports global monitoring of the atmosphere and climate by means of the hyperspectral Tropospheric Monitoring Instrument (TROPOMI) sensor dedicated to air quality and ozone layer observations. The TROPOMI instrument consists of four spectrometers measuring radiation in the ultraviolet (270–320 nm), visible (310–500 nm), near-infrared (675–775 nm), and shortwave infrared (2305–2385 nm) electromagnetic spectrums. Its spatial resolution is 3.5 km × 7 km (for all products except methane) and 7 km × 7 km (methane) and spectral resolutions vary from 1 nm in the UV band, through 0.5 nm in the VIR and NIR bands to 0.25 nm in the SWIR band. The swath width is 2600 km, which allows for daily monitoring of air pollution at global scale [19]. Over Poland, Sentinel-5P imagery is acquired between 10:00 a.m. and 1:00 p.m. UTC. Acquisition time was obtained by an application written in Google Earth Engine as well as NO2 TVCD. The Sentinel-5P tropospheric NO2 column density (L3_NO2) expressed in mol/m2 used in this study features a spatial resolution of 0.01 arc degrees (as provided by the Google Earth Engine: Sentinel-5P NRTI NO2: Near Real-Time Nitrogen Dioxide product [20]) and covers two periods: 1 March 2019 to 30 June 2019 and 1 March 2020 to 30 June 2020. It is generated by the Dutch OMI NO2 data products of KNMI for OMI (DOMINO) [21,22], and Quality Assurance for Essential Climate Variables (QA4ECV) [23] algorithms. Procedure of retrieval consists of three steps:
  • NO2 slant columns from the measured radiance and irradiance spectra is retrieved by Differential Optical Absorption Spectroscopy (DOAS) method; Fitting function of DOAS for TROPOMI follows the current non-linear fitting approach for OMI [22,24];
  • Tropospheric and stratospheric columns are separated;
  • Tropospheric and stratospheric slant columns are converted into tropospheric vertical column density and stratospheric vertical column density.
Vertical profiles of NO2 are based on the chemistry transport model (CTM)—TM5-MP [24,25] and are calculated for the centre of a pixel featuring a spatial resolution of 1° × 1° [25]. Finally, cloud cover filtering is performed by the FRESCO-S algorithm [26].

2.1.4. Ancillary Data from Models and Radiosondes

To support the interpretation of the GIOS measurements additional datasets were used:
  • Modern-Era Retrospective analysis for Research and Applications, Version 2 (MERRA-2) [27,28] at 0.5° × 0.625° spatial and at 1 h temporal resolution (product M2T1NXAER). MERRA-2 assimilates MODIS on Terra and Aqua [29] reflectance and direct solar flux measurements at AERONET sites [15].
  • NOAA Hybrid Single-Particle Lagrangian Integrated Trajectory (HYSPLIT) model [30] to estimate transport of air masses. This included 96 trajectories for Warsaw at 0.5 km based on the Global Land Data Assimilation System GLDAS meteorological data at 1° × 1° spatial resolution.
  • The World Meteorological Organisation (WMO) radiosonde measurements for temperature profiles from the Legionowo weather station 20 km from Warsaw to identify surface air temperature inversions.

2.2. Methods of Data Processing

2.2.1. Analysis of In-Situ PM2.5 and NO2 Measurements

Daily mean atmospheric PM2.5 and NO2 concentrations provided for each GIOS air quality station were aggregated to decadal averages. The decadal estimates were generated by averaging measurements taken across specific station types: (1) mean estimates for all stations over Poland; (2) mean estimates for stations over urban areas; (3) mean estimates for stations over non-built-up areas; (4) mean estimates for stations in Warsaw. Furthermore, the decadal estimates were temporally aggregated into:
  • 10-year decadal averages and standard deviations (2011–2020) for each decade from 7 to 18 for all analysed cases (except for the PM2.5 estimates for non-built-up areas which featured a shorter time series);
  • 8-year decadal averages and standard deviations (2013–2020) for each decade from 7 to 18 for PM2.5 decadal estimates for non-built-up areas;
  • annual averages from the 7 to 18 decade (March–June), which were further used to derive linear temporal trends. If a temporal trend was statistically significant according to a t-test [31], it was used to derive annual anomalies of PM2.5 and NO2 concentrations. On the contrary, if the temporal trend was statistically insignificant, then a multi-annual average was used to compute annual anomalies.

2.2.2. Analysis of the Sentinel-5 Tropospheric NO2 Column Density

The Sentinel-5P NO2 product (L3_NO2) was analysed using the Google Earth Engine (GEE) cloud platform, which combines the large earth observation (EO) archive with the computing environment [20]. L3_NO2 products were aggregated into decadal composites by averaging pixels with a cloud fraction lower than 40%, as suggested by Bauwens et al. [7] Other studies by Boersma et al. [23] and van Geffen et al. [32] revealed that a threshold lower than 40% leads to more accurate NO2 retrievals. However, Copernolle et al. [33] claimed that low thresholds lead to the exclusion of aerosol and NO2-polluted Sentinel-5P scenes, which are essential from the perspective of the present study. Based on the decadal product, the following statistics were computed:
  • decadal median NO2 for Poland;
  • decadal median NO2 for urban areas in Poland where GIOS air quality stations are located;
  • decadal median NO2 for non-built-up areas in Poland where GIOS air quality stations are located;
  • decadal median NO2 from S-5P pixels located within Warsaw administrative borders.

2.2.3. Analysis of Aerosol Optical Properties

AOD data in the MERRA-2 reanalysis is defined at 1 h intervals. Such data were averaged over Poland (from 13.5° E to 24.5° E and from 48.5° N to 55° N) and then further averaged into decadal composites. AOD, aerosol scattering coefficients, and eBC measured at Strzyzow background station were averaged to daily means and then into decadal estimates.

3. Results and Discussion

3.1. Meteorological Conditions in Poland during Spring 2020

Due to the fact that atmospheric pollution concentration and emission rates (especially from heating systems) are a function of atmospheric parameters, this section includes a brief description of weather conditions in 2019 and 2020 relative to long-term means. The mean annual temperature anomalies were +2.0 °C and +1.8 °C, respectively, for 2019 and 2020. The winter of 2020 was extremely warm (4.1 °C above the long-term average) in contrast to the winter of 2019 (2.0 °C above average). Air temperature anomalies during spring were significantly lower (+1.1 °C in 2019 and 0.0 °C in 2020). Comparison of air temperatures across all spring months indicates higher temperatures in 2020 than in 2019. Only in May, there were observed negative anomalies(−1.1 °C in 2019 and −2.3 °C in 2020); however, this has not influenced emission rates because the heating season in Poland ends in March/April (Table 1).
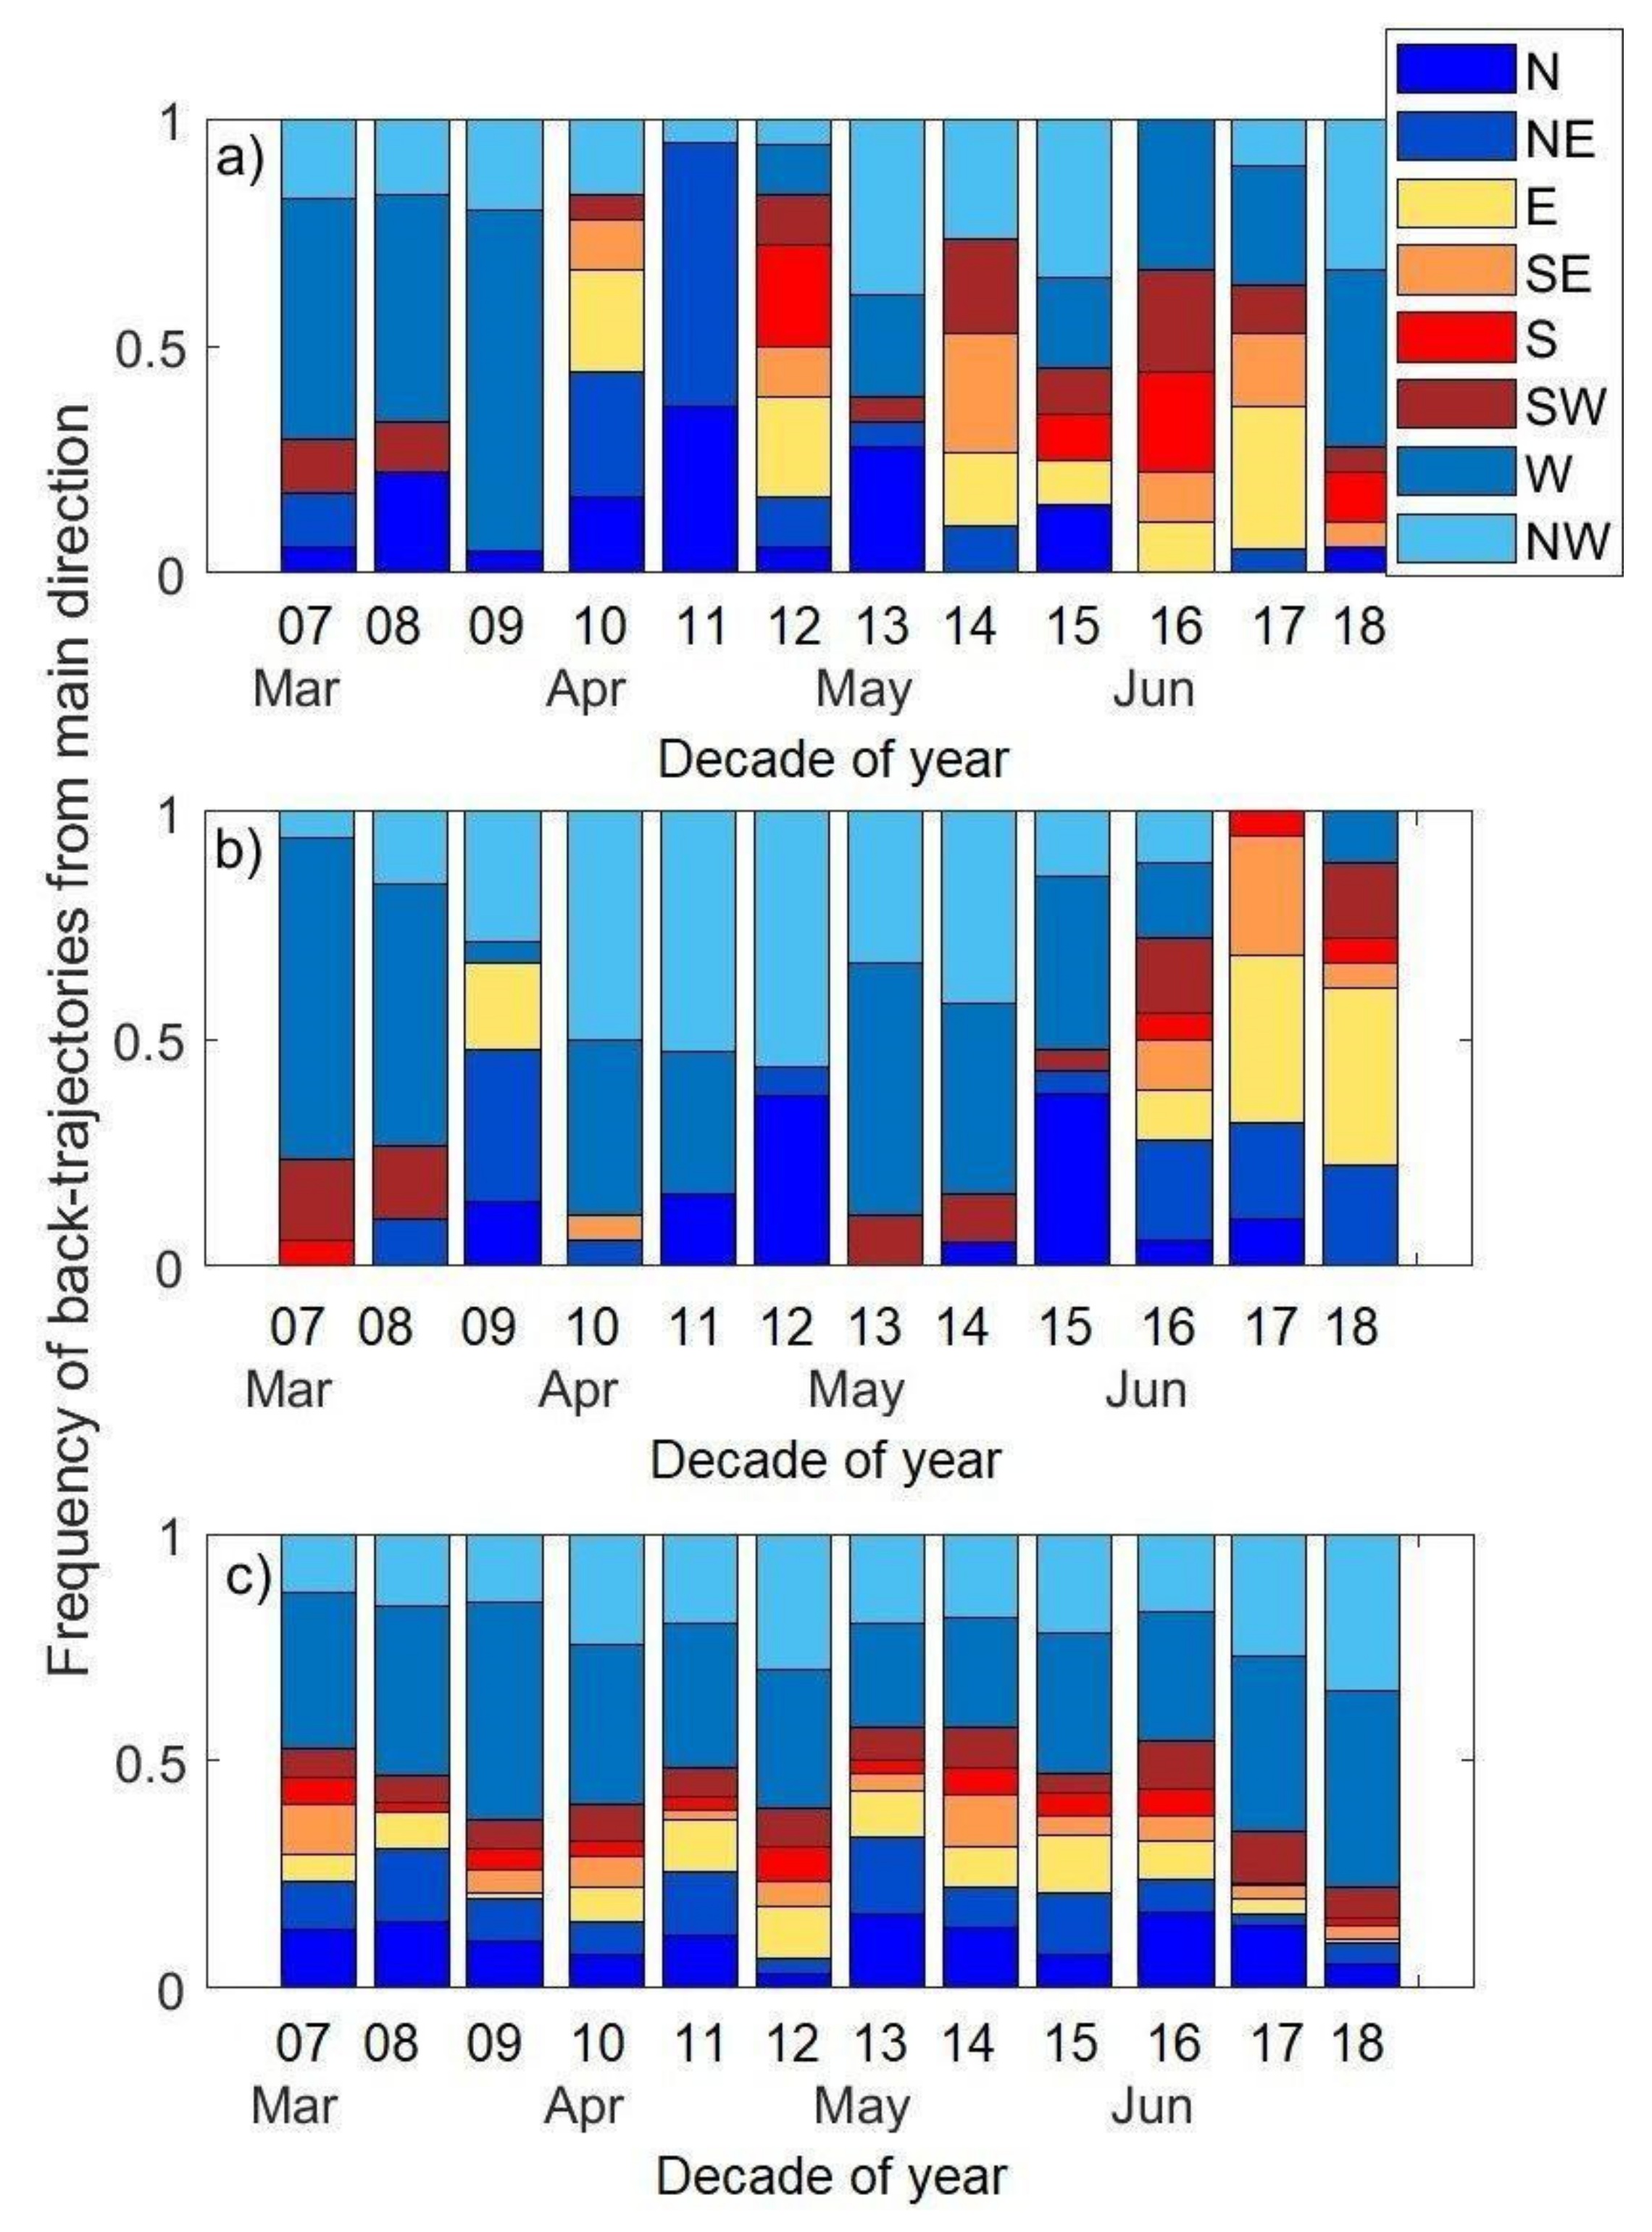
Advection of air pollution was assessed on the basis of wind direction in Warsaw at 0.5 km derived from a 96-h back-trajectory from the HYSPLIT model (Figure 2). Wind directions were further averaged to decadal estimates for 2019 and 2020 and for the 2010–2019 reference period. Comparison of data from 2019 and 2020 in reference to long-term means shows some significant anomalies. For example, in April and at the beginning of May (2020), transport from NW and W dominated and advection from this direction usually brings clean Atlantic air masses to Central Europe. In contrast, during the same period in 2019 (Figure 2a), more frequent transport from S, SE and E was observed; however, between 11 and 20 April and between 1 and 10 May (2019) the circulation changed to N.
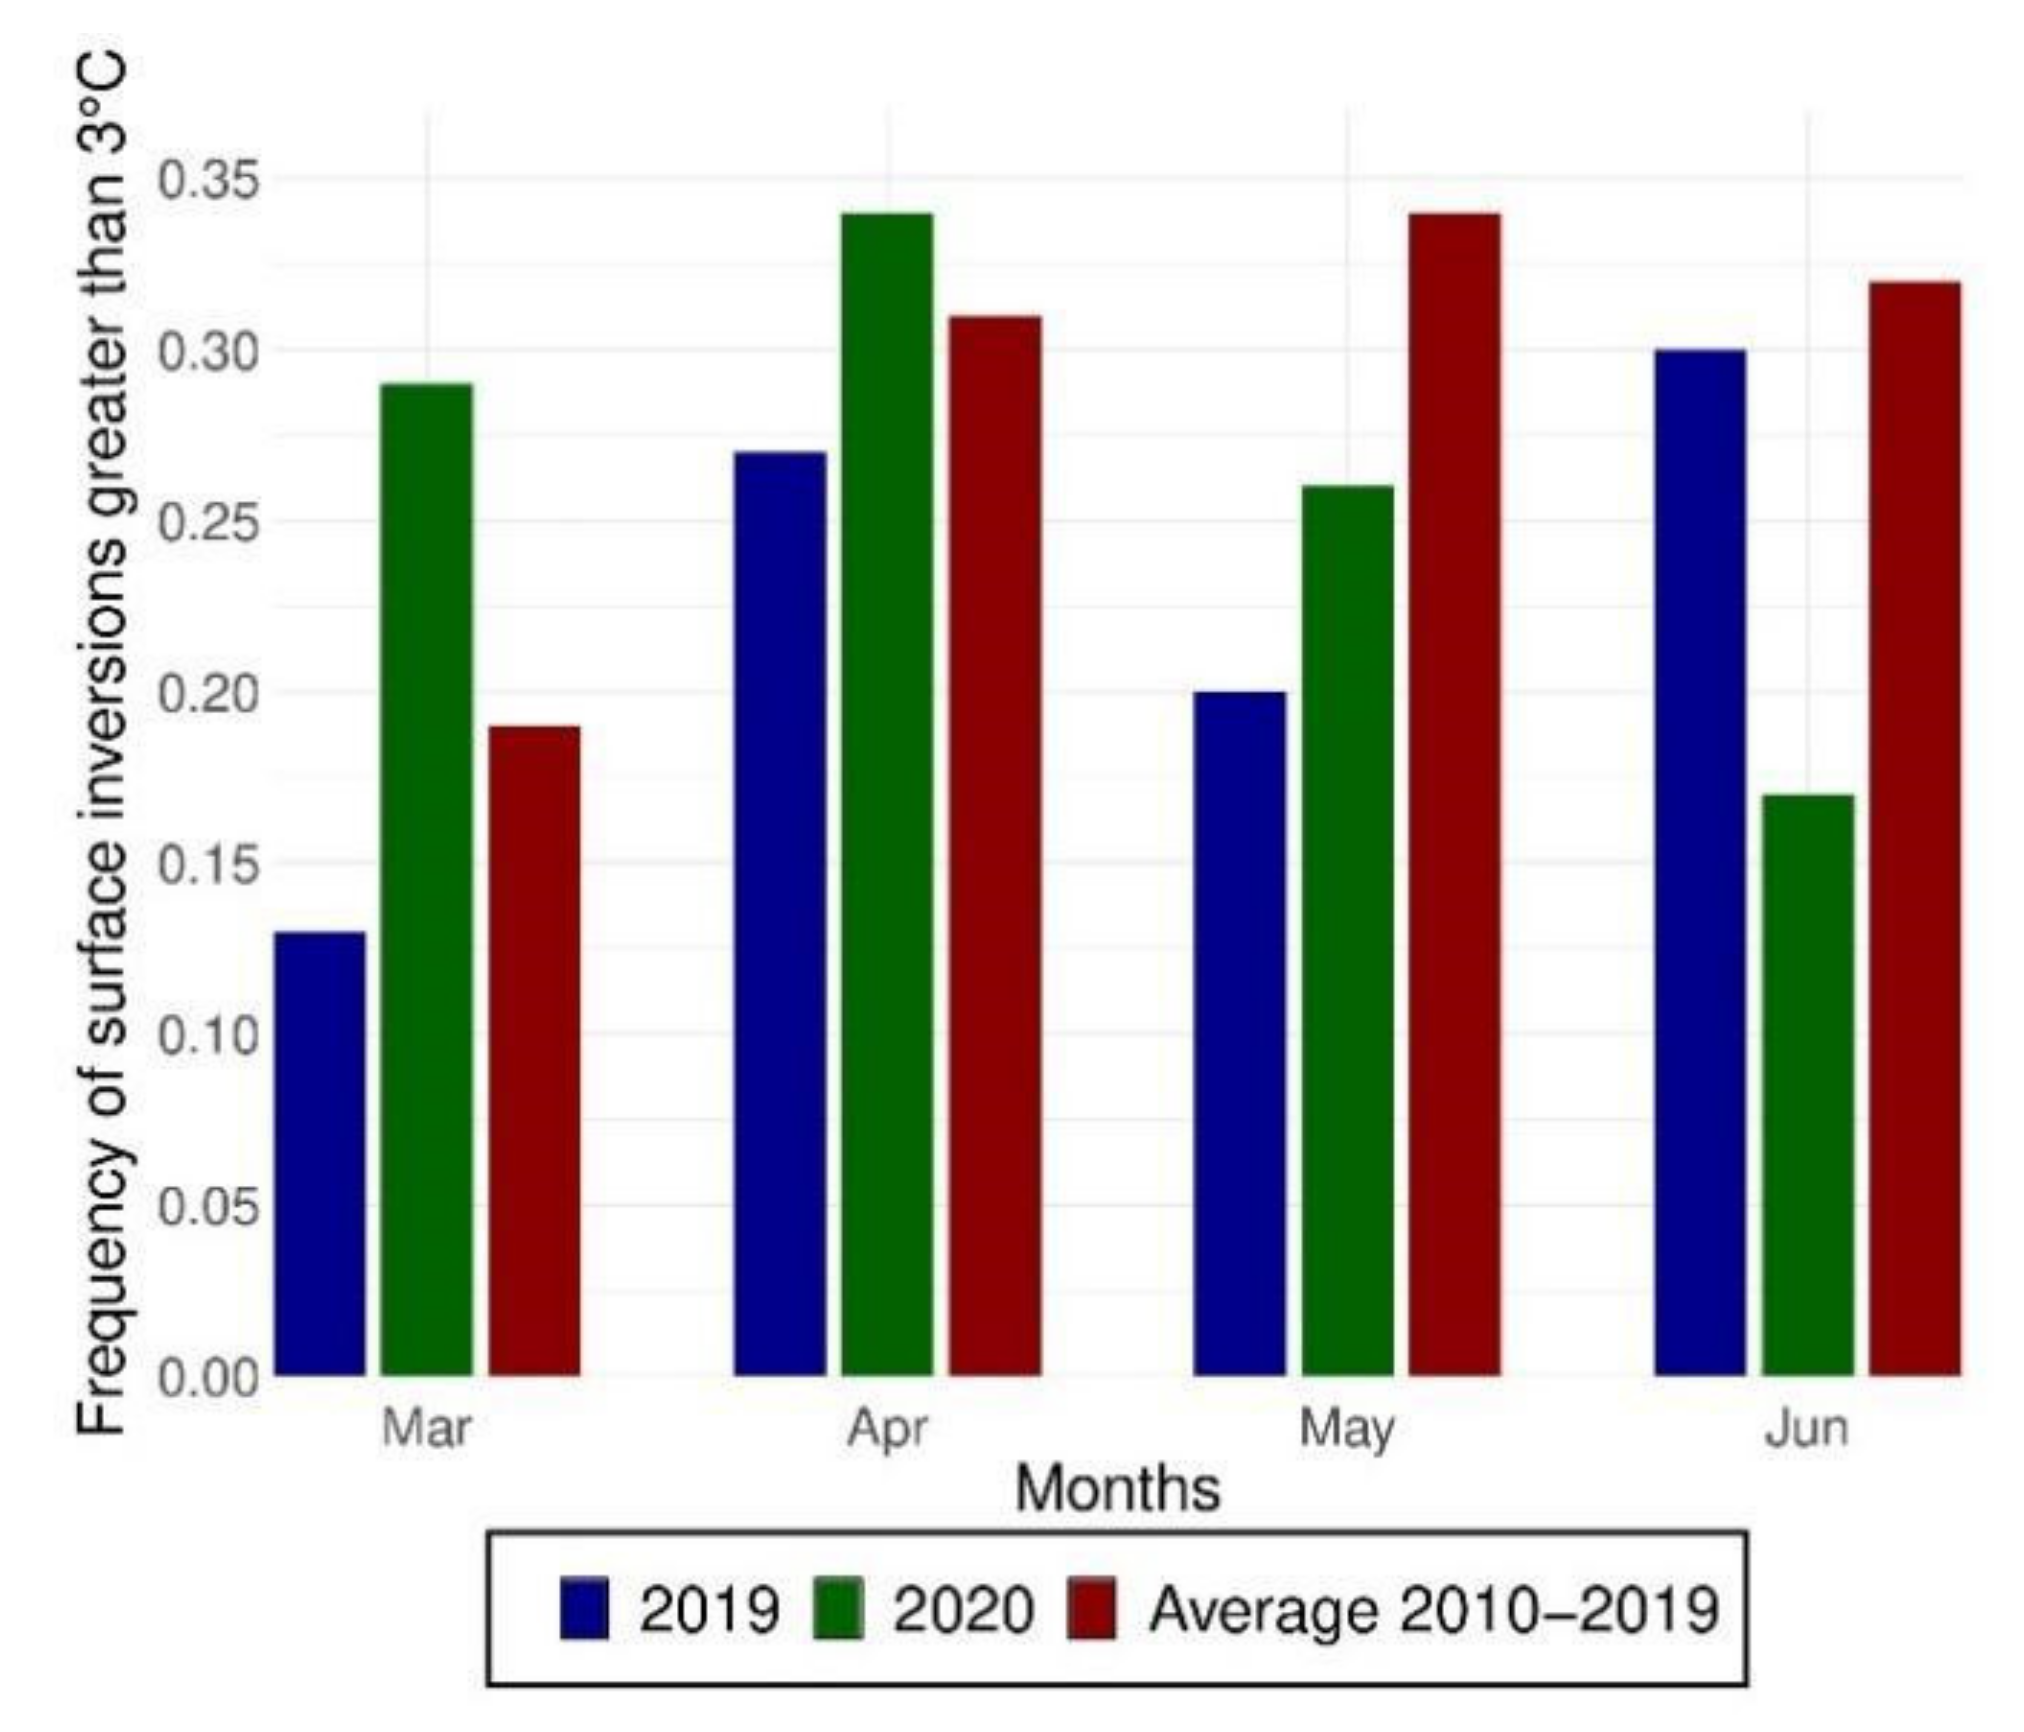
The HYSPLIT model revealed a variability of advection typical for Central Europe and significant differences between spring 2019 and 2020. Similar differences between 2019 and 2020 were found on radiosonde measurements taken at the Legionowo weather station 25 km from Warsaw. Figure 3 shows the frequency of surface inversions (temperature gradient greater than 3 °C/100 m). In March 2020 the occurrence of temperature inversions was twice that of 2019 and above the 2010–2019 average. In April the differences between 2019, 2020 and the 2010–2019 average are low. In May 2020 temperature inversions were more frequent than in 2019 but less frequent than the 2010–2019 average. On the contrary, in June 2019, inversions were twice as frequent as in June 2020. The number of surface inversions in June 2020 was about 50% less than the 2010–2019 average.

3.2. Background Aerosol Concentration in Poland

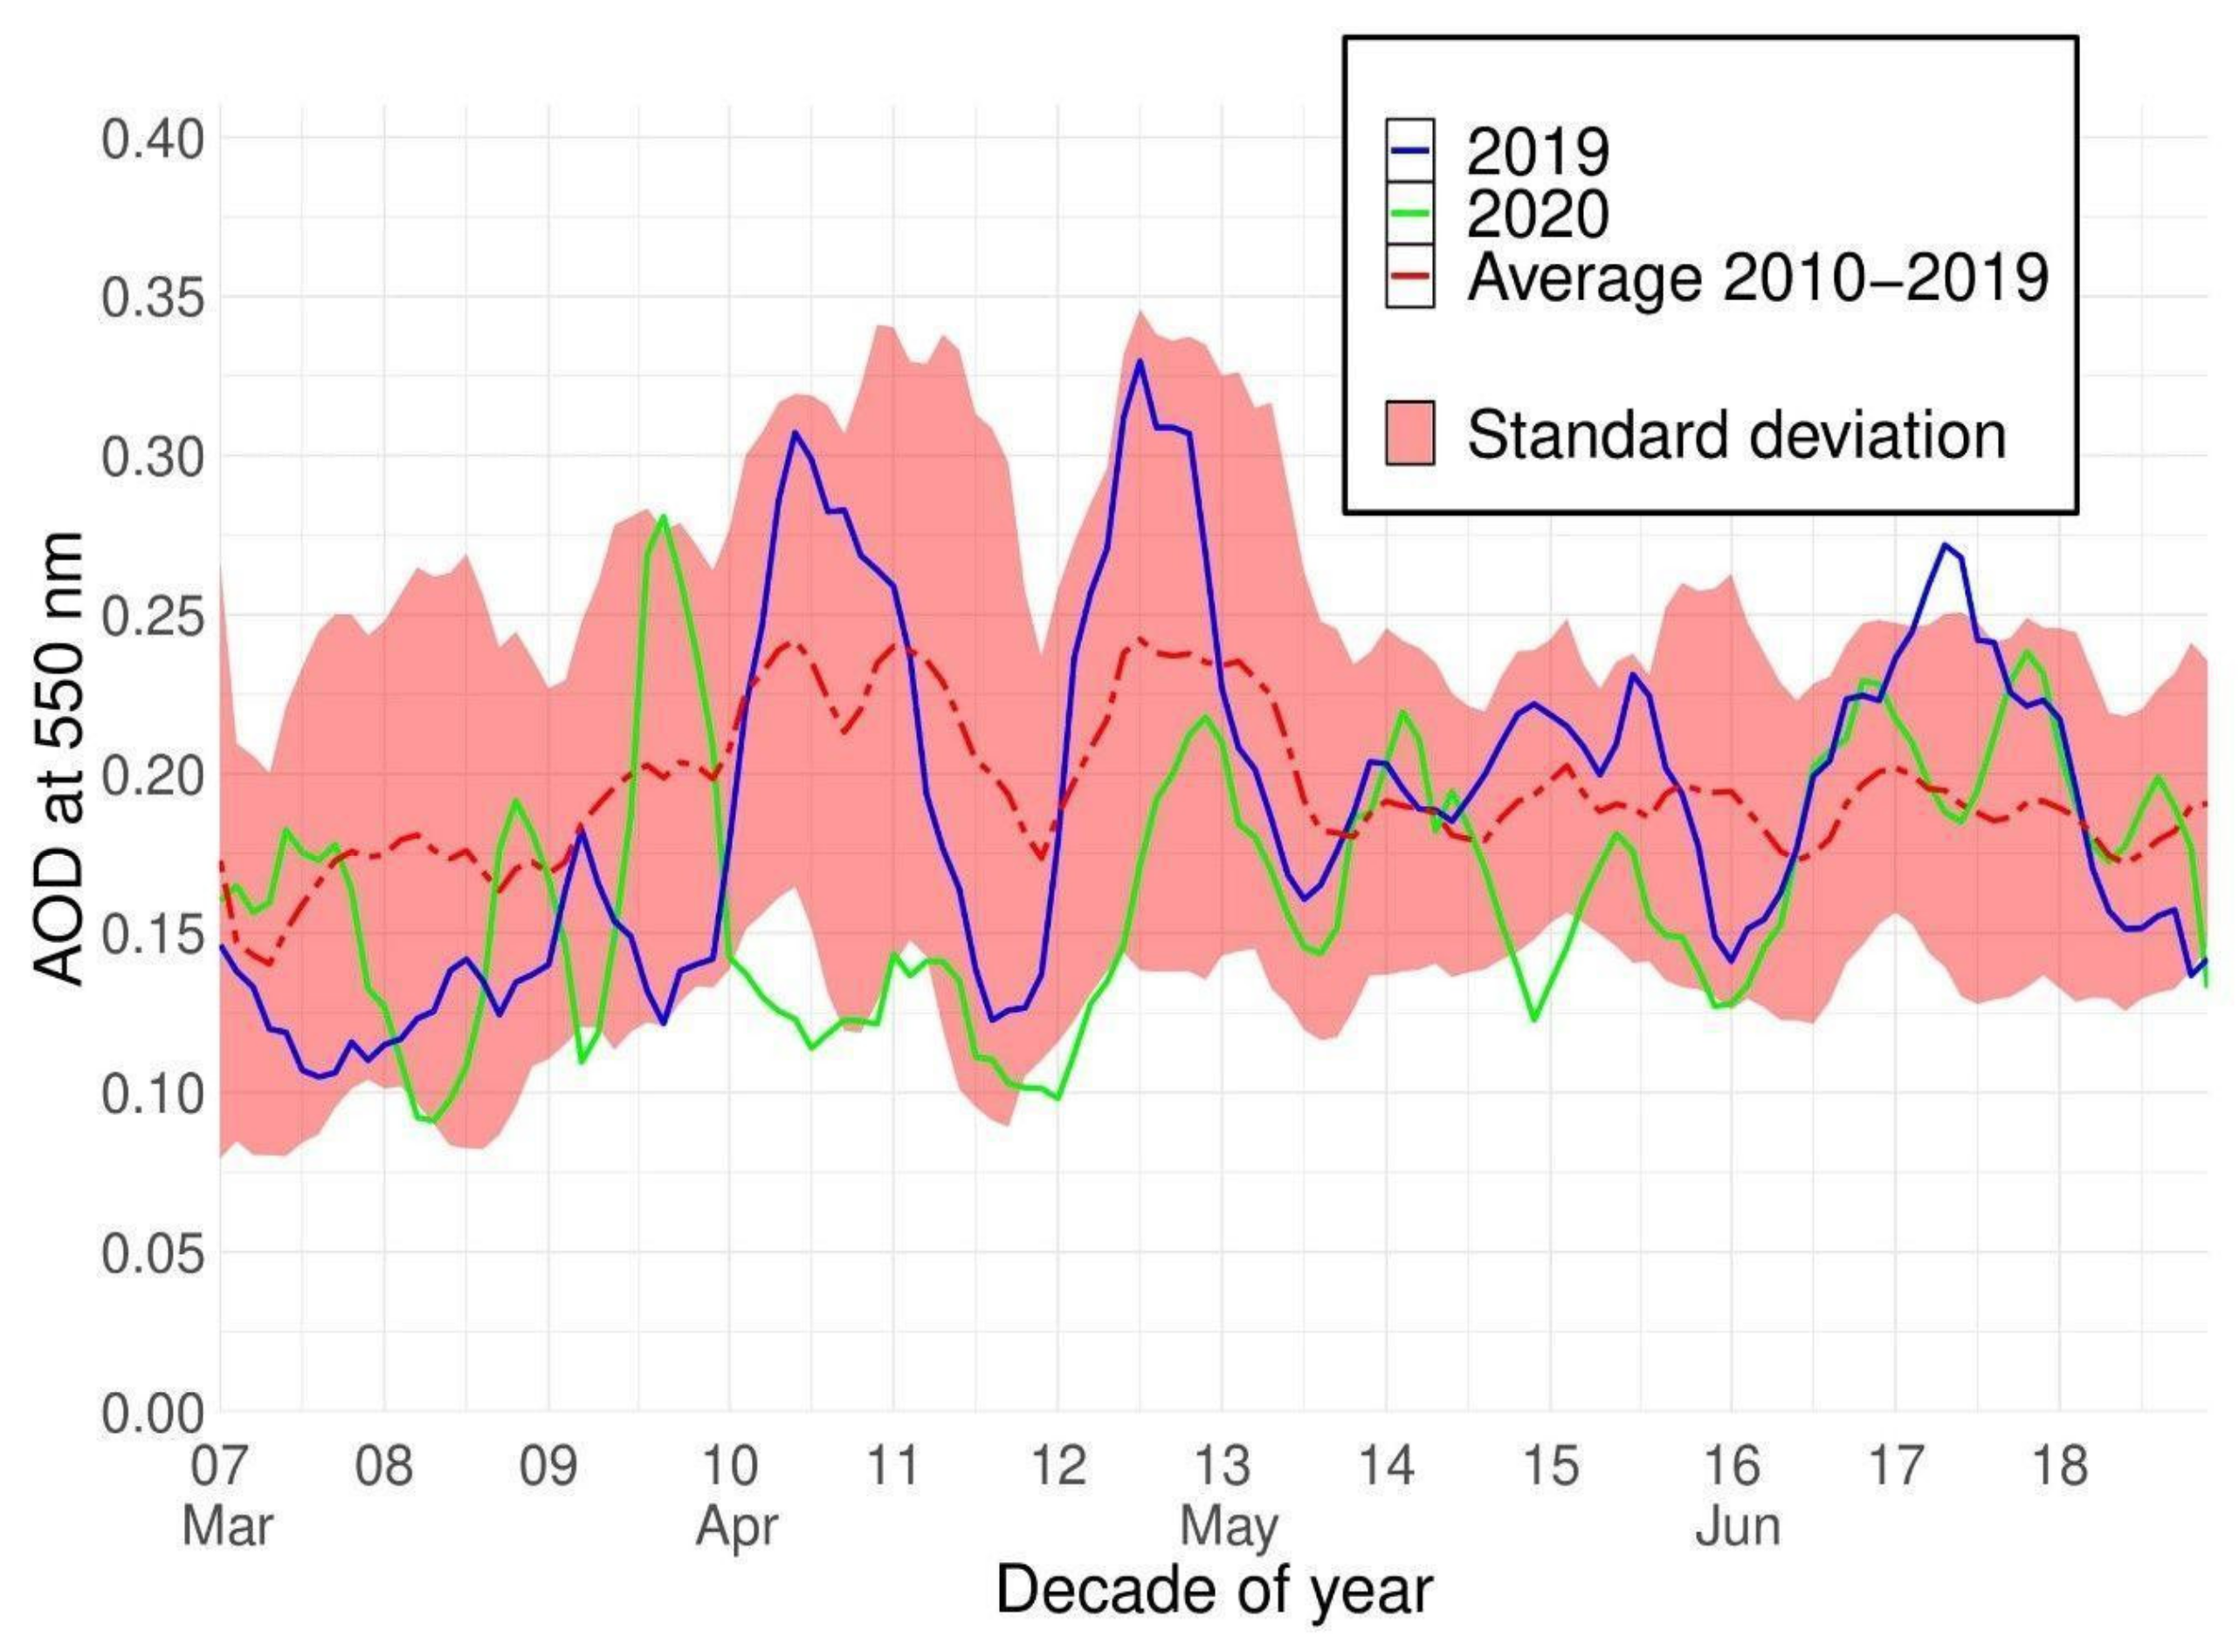
Preliminary results for PM2.5 atmospheric concentration within this study revealed a need for an extended analysis of background aerosol concentration in order to facilitate interpretation of the unusual fluctuations, which occurred in spring 2020. In this respect, it was decided to include MERRA-2 reanalysis, complemented with unique measurements of background aerosol properties from the AERONET station located in Strzyzow. Mean spring (March–June) AOD at 550 nm, derived from MERRA-2 reanalysis and averaged across Poland, revealed a 14% reduction for 2020 (0.165) in respect to 2019 (0.191) and a 15% reduction in respect to the 2010–2019 average (0.194). Temporal variability of MERRA-2 AOD over Poland is presented on Figure 4. Results for 2020 indicate a significant reduction in AOD in April and May (red line) with respect to the 2010–2019 average (blue line) and to 2019 (black line).
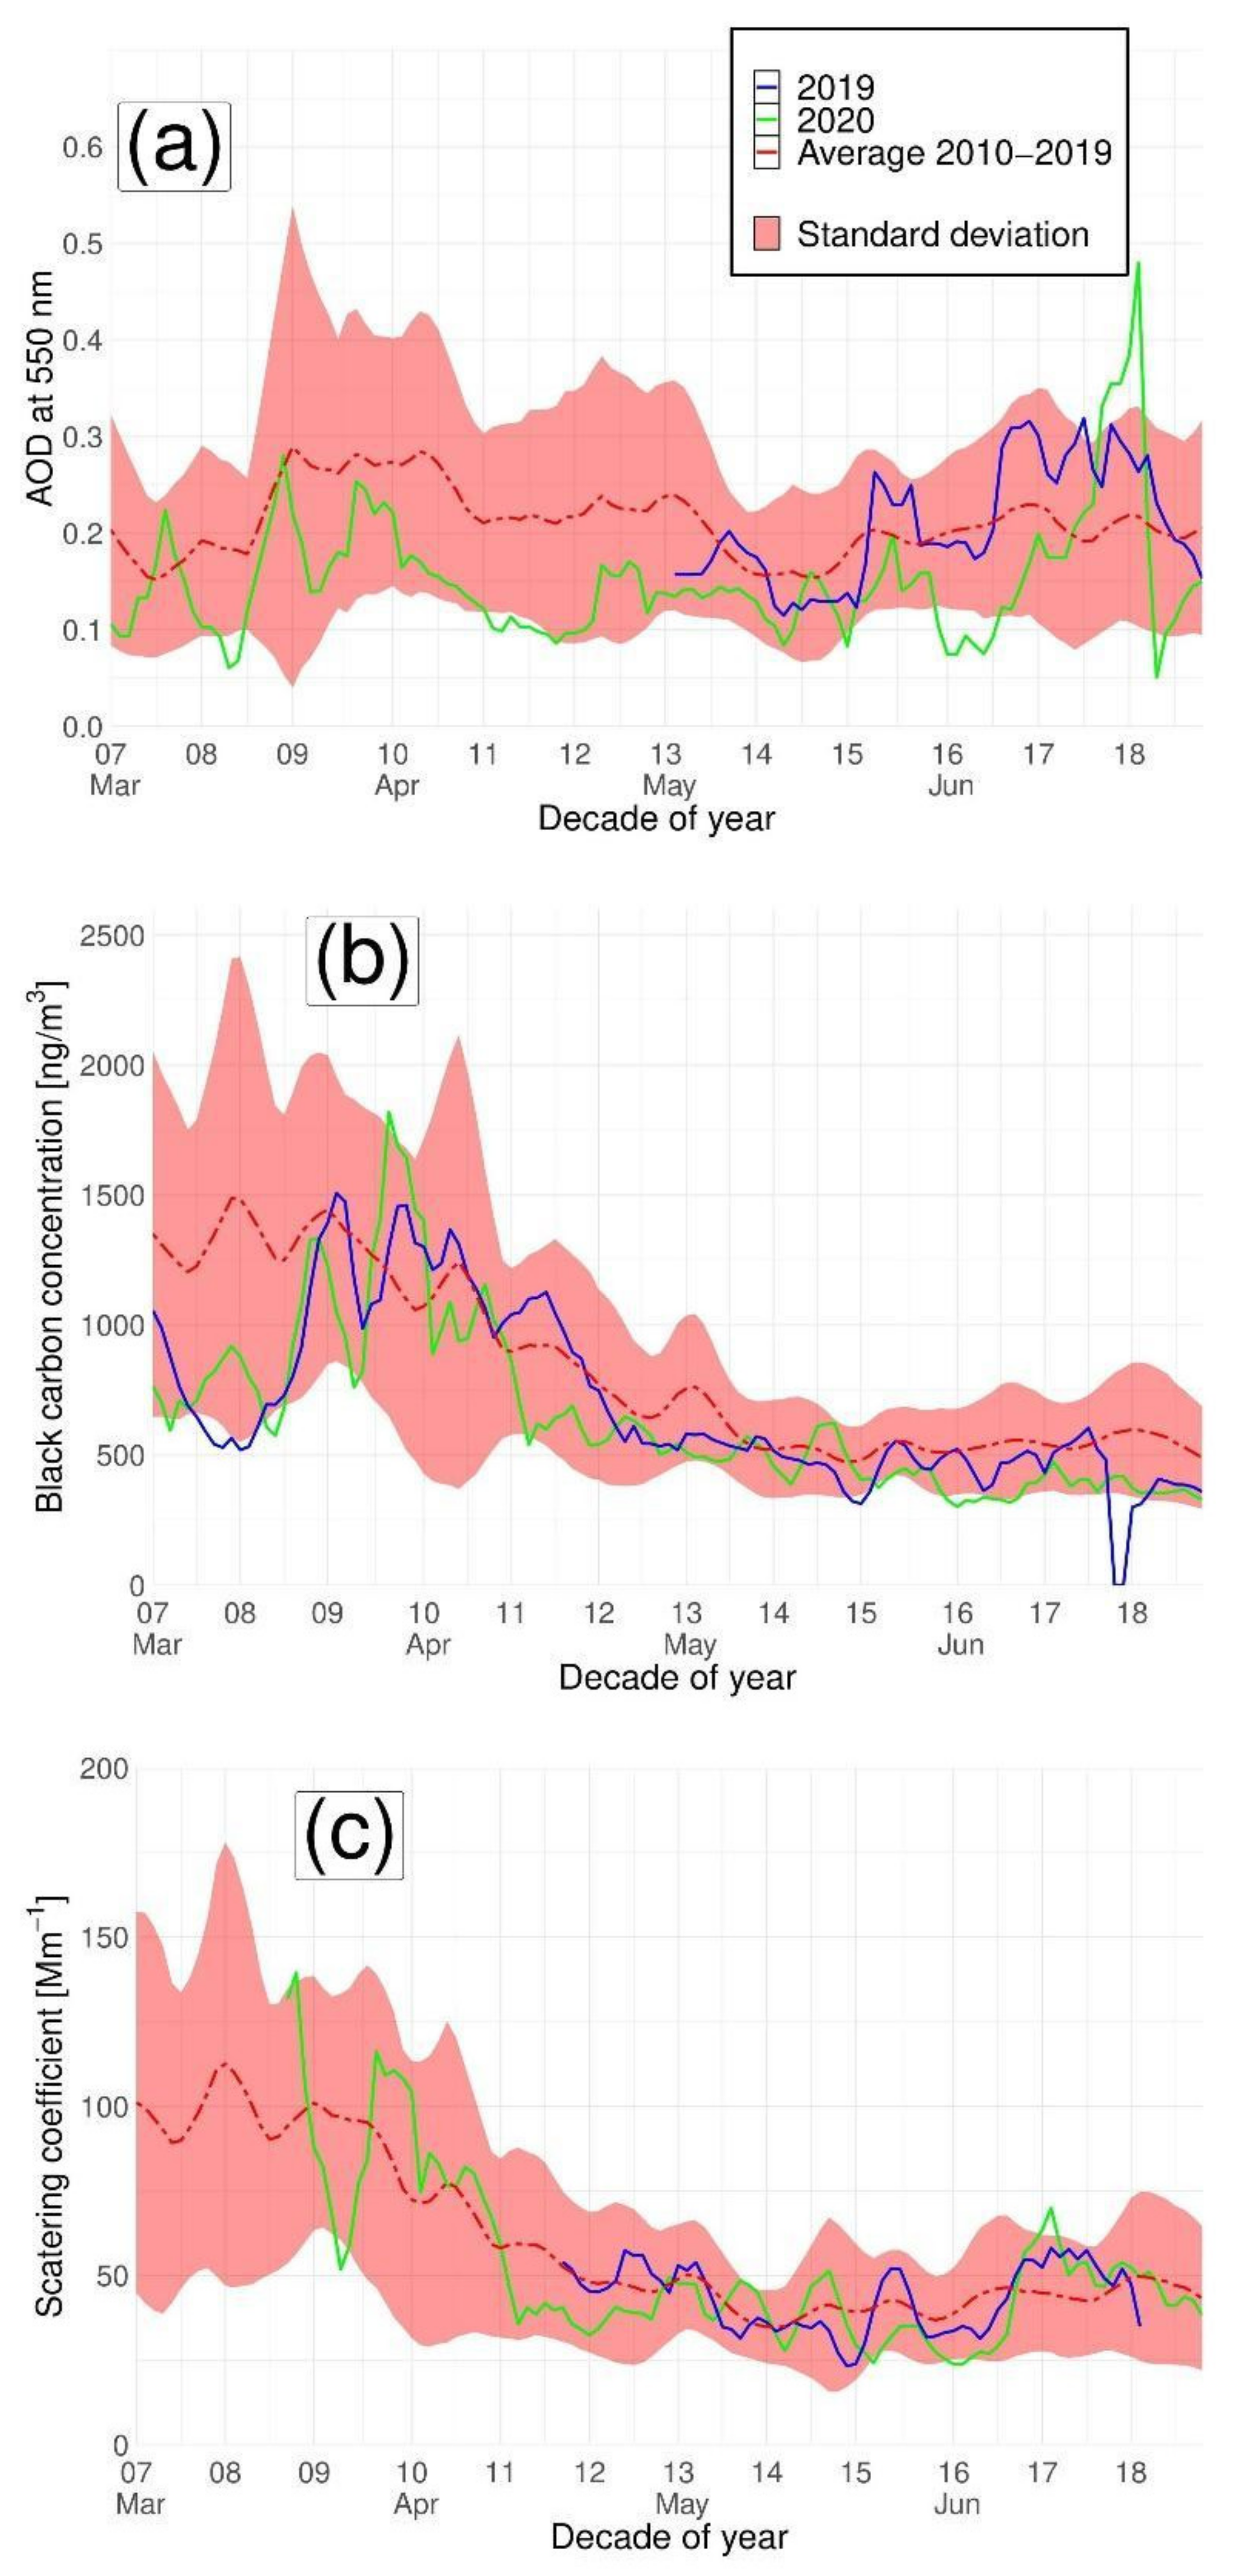
The main drivers for AOD reduction in 2020 with respect to the 2010–2019 average were sulphates (−18%), mineral dust (−16%) and organic carbon (−15%), black carbon (−8%) while sea salt increased by 18% (Table 2). This indicates the advection of clear atlantic air masses from NW and W which dominated Poland in April–May 2020 (Figure 2b). The same reduction in AOD at 500 nm in spring 2020 was observed at the background AERONET station located at Strzyzow far from main roads, industrial and domestic heating emissions. In this respect, AOD during April was about 50% of the 2010–2019 mean (Figure 5). Unfortunately, due to a sun photometer calibration issue, data from 2019 are not available in March and April. Mean AODs from March to June are 0.14, 0.23, 0.21, for 2020, 2019 and the 2010–2019 average, respectively. Ultimately, it has to be stated that the impact of COVID-19 lockdown on columnar AOD, induced by the reduction in vehicle traffic, is expected to be marginal across Poland. This conclusion can be drawn from the study of Zawadzka et al. [34] where it was proven that the variability in AOD during spring and summer in Warsaw is rather small (0.01–0.02 at 500 nm) and that the differences between the city center and rural areas are less than 10–15%. Only during very slow advection of air masses coinciding with a temperature inversion does vehicle traffic emission increase the difference.
To better understand the reason for reduction in AOD in 2020, the surface black carbon (eBC) concentration from AE-31 aethalometer and the aerosol scattering coefficient from Aurora 4000 nephelometer were analysed at the Strzyzow background station. Both instruments recorded lower measurements in the middle of April 2020 in comparison to the same period in 2019 and the 2010–2019 mean. However, during the end of March and the beginning of April, values in 2020 were close to 2010–2019 means. For eBC there was a significant drop in values in the first half of March 2019 and 2020 compared to the 2010–2019 mean. This can be partly explained by the reduction in emissions from heating systems (2–3 °C air temperature anomaly) but also by the transport of relatively clean air masses (Figure 2). On the other hand, it is less likely that reduction of eBC in 2020 is due to COVID-19 restriction, because Strzyzow station is localized in a large distance to road traffic. The mean eBC for spring (March–June) was 641 ng/m3, 701 ng/m3, and 826 ng/m3, respectively for the 2020, 2019 and 2010–2019 means. Temporal variability of the aerosol scattering coefficient is similar to eBC. Due to instrument calibration issues, these data are not available in March 2020 and in March–April of 2019. Based on the available data, we estimated the mean scattering coefficient (during March–June): for 2020 (57.5 mm−1) slightly lower than for 2019 (60.3 mm−1) and for long-term data (60.0 mm−1).

3.3. Decadal Variability in Ground-Based PM2.5 Concentration Measurements

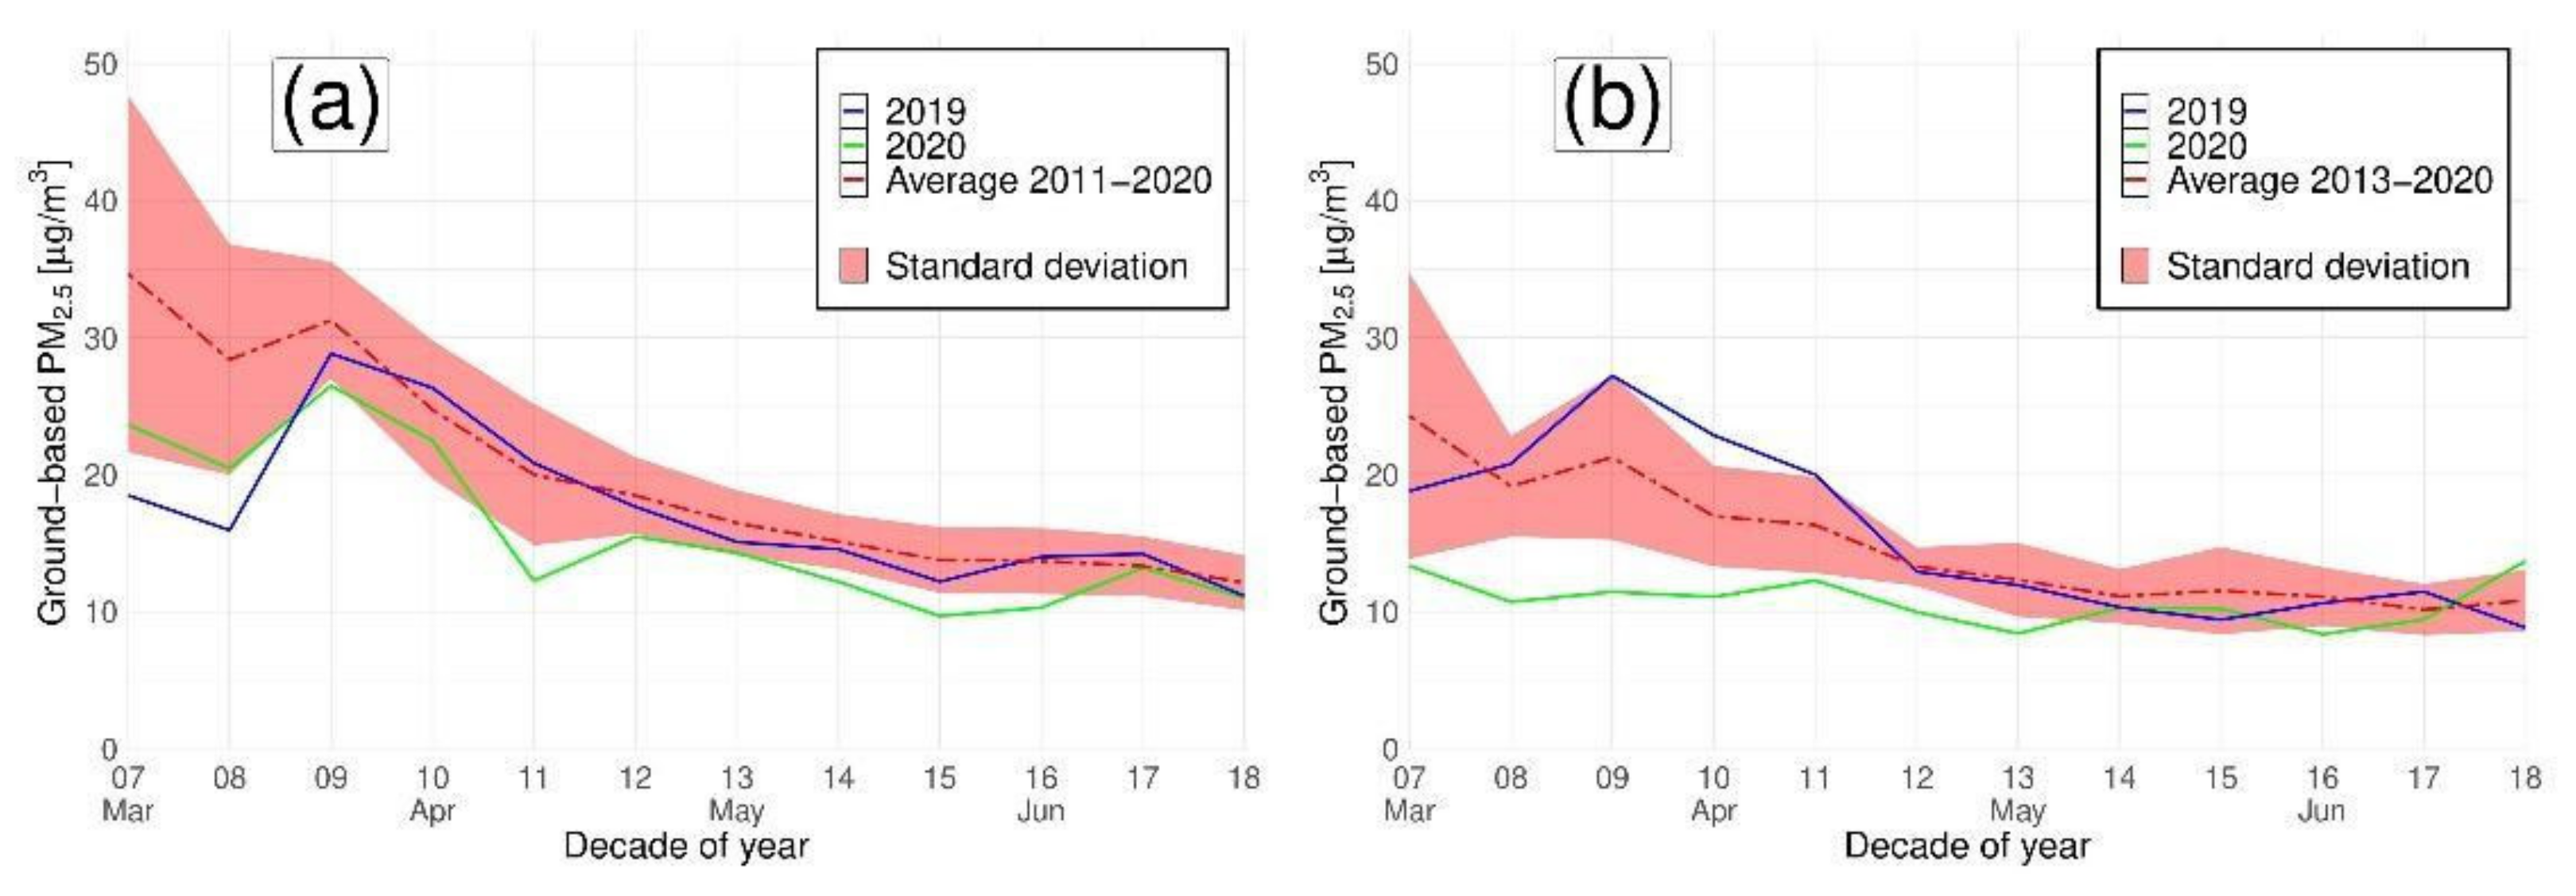
Magnitude and variability of mean decadal PM2.5 atmospheric concentration mostly declines between decade 7th and 17th (Figure 6), which can be attributed to a reduction in emissions from heating systems between winter and summer [35].
Over urban areas in Poland, the mean PM2.5 concentration was significantly lower (−20%) in 2020 as compared to the 10-year average, whereas in 2019 this difference was less noticeable (−8%). The largest differences in respect to the 10-year average were observed in the 11th decade (−39%), just after the lockdown restrictions had been imposed in 2020. However, these differences were also large before the lockdown, during the 7th decade (−32%) and the 8th decade (−38%). This implies that the meteorological conditions in 2020 were particularly favourable for air quality due to lower emissions and dispersion of air pollutants. This is apparent in Figure 2, where advection of clear and warm oceanic (atlantic) air masses from N, NW, and W dominated completely. Consequently, a drastic reduction in AOD concentration as compared to the 2010–2019 average occurred during April 2020, which is clearly noticeable in the MERRA-2 reanalysis (Figure 4) and in background measurements obtained at the Strzyzow AERONET station (Figure 5a). Due to the relationship between AOD and PM2.5 concentrations [36,37,38,39,40], the same pattern is noticeable for the background (non-built-up) station (Figure 6b) where PM2.5 concentration in spring 2020 is almost constant, whereas in 2019 and for 2011–2020, average values decline with time (analogous to urban stations). Unusually frequent advection of warm atlantic air masses from N, NW and W, as opposed to cold continental ones from E and NE, led to the positive air temperature anomalies for 2019 (2.9 °C) and 2020 (1.7 °C) reported in Table 1. This in turn leads to lower emissions from heating systems and a further reduction of AOD and PM2.5 concentrations in urban areas.
Decadal mean PM2.5 concentrations in 2020 for urban areas are almost within a single standard deviation from the 2011–2020 average. Consequently, it is hard to confirm and quantify the direct impact of the COVID-19 lockdown on PM2.5 concentrations beyond doubt.
These findings are reinforced by an analysis of PM2.5 concentrations in Warsaw (Figure 7), where the reduction in vehicle traffic due to COVID-19 was abrupt and drastic [41]. Despite more frequent temperature inversions (Figure 3) than the 2011–2020 average (which should increase air pollution), PM2.5 concentrations for Warsaw are (again) within a single standard deviation of the 2011–2020 average. Nevertheless, there is a significant decrease in PM2.5 concentrations between the 10th and the 11th decade of 2020 (Figure 7), which corresponds to the introduction of lockdown restrictions, but also to an unusually frequent advection of oceanic air masses from the N, NW and W (Figure 2). Moreover, before the COVID-19 lockdown in the 7th and 8th decade of 2020, PM2.5 concentrations for urban stations (including Warsaw) were significantly lower than the 10-year average (Figure 6a and Figure 7). For the same period in 2019 these differences were even larger, which can be attributed to the advection of warm atlantic air masses, positive temperature anomalies (i.e., >2 °C) and infrequent temperature inversions (Figure 3).

3.4. Multi-Annual Variability of Ground-Based PM2.5 Concentration Measurements

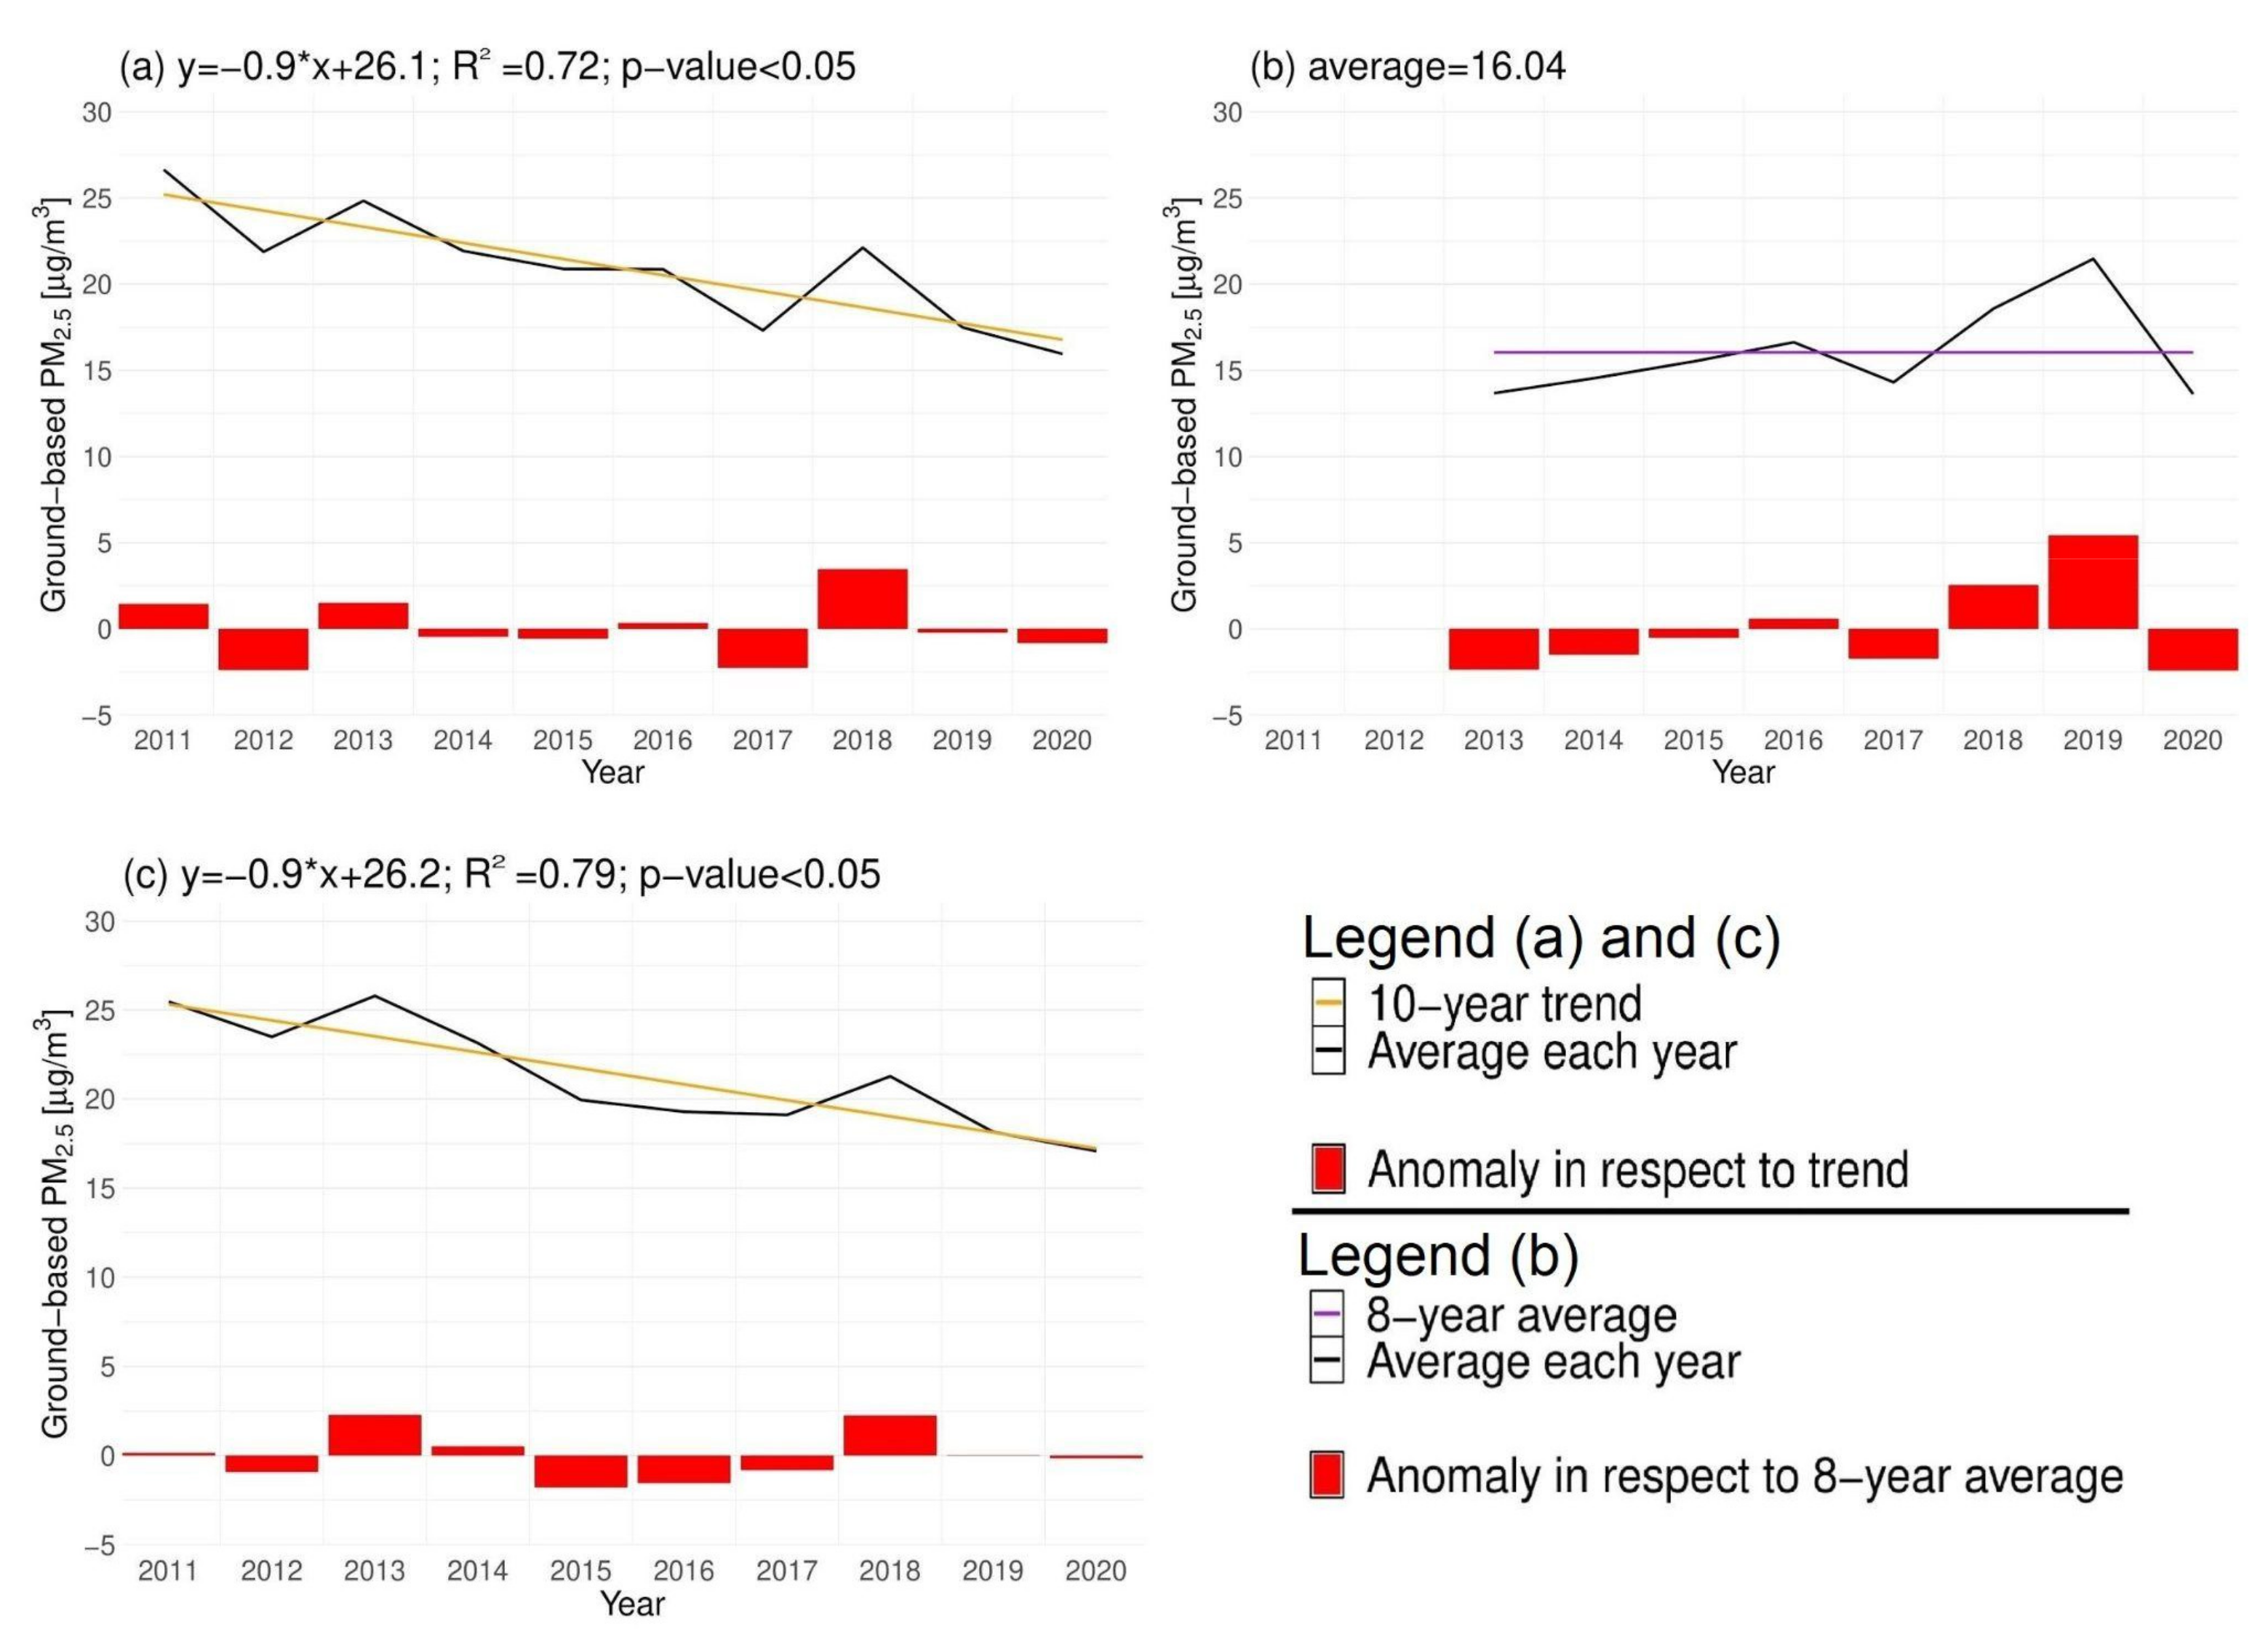
Average PM2.5 concentrations from March to June for the years from 2011 to 2020 revealed a statistically significant (p-value < 0.05) negative temporal trend (Figure 8a,c) for urban air quality stations (−0.9 μg/m3 per 10 years) including Warsaw (−0.9 μg/m3 per 10 years). These negative trends in Polish cities are related to cleaner technologies implemented in heating systems and more efficient air pollution filters installed in cars. On the contrary, for non-built-up area stations (Figure 8b), the 8-year temporal trend was not statistically significant (p-value > 0.05). The average for that case was 16.04 μg/m3. This indicates that background PM2.5 concentrations in Poland have been stable over the last eight years.
The temporal trends for urban stations and multi-annual average for non-built-up stations were used to compute anomalies of PM2.5 concentrations during spring for each year (red bars on Figure 8). The acquired results revealed that in 2020 the anomalies were not large for urban areas (−0.8 μg/m3) and Warsaw (−0.2 μg/m3). For 2019, they were even smaller. However, the background (non-built-up) station revealed significant (−2.4 μg/m3) reductions in PM2.5 concentrations in 2020, which again support the hypothesis that weather conditions in spring 2020 were particularly favorable for air quality in Poland.

3.5. Decadal Variability of Ground-Based NO2 Concentration Measurements

Temporal pattern of mean decadal NO2 concentrations reveals a similar decline, along with the spring period for PM2.5 concentrations. A significant source of NO2 air pollution is from vehicle traffic [11,42], whereas variations in PM2.5 concentrations are more related to power generation and mesoscale conditions [43,44]. In this respect, traffic measured at 32 sites across various locations in Poland during the COVID-19 lockdown in 2020 decreased by 8776 vehicles per day as compared to year 2019 and by 7355 vehicles per day as compared to 2018 [45].
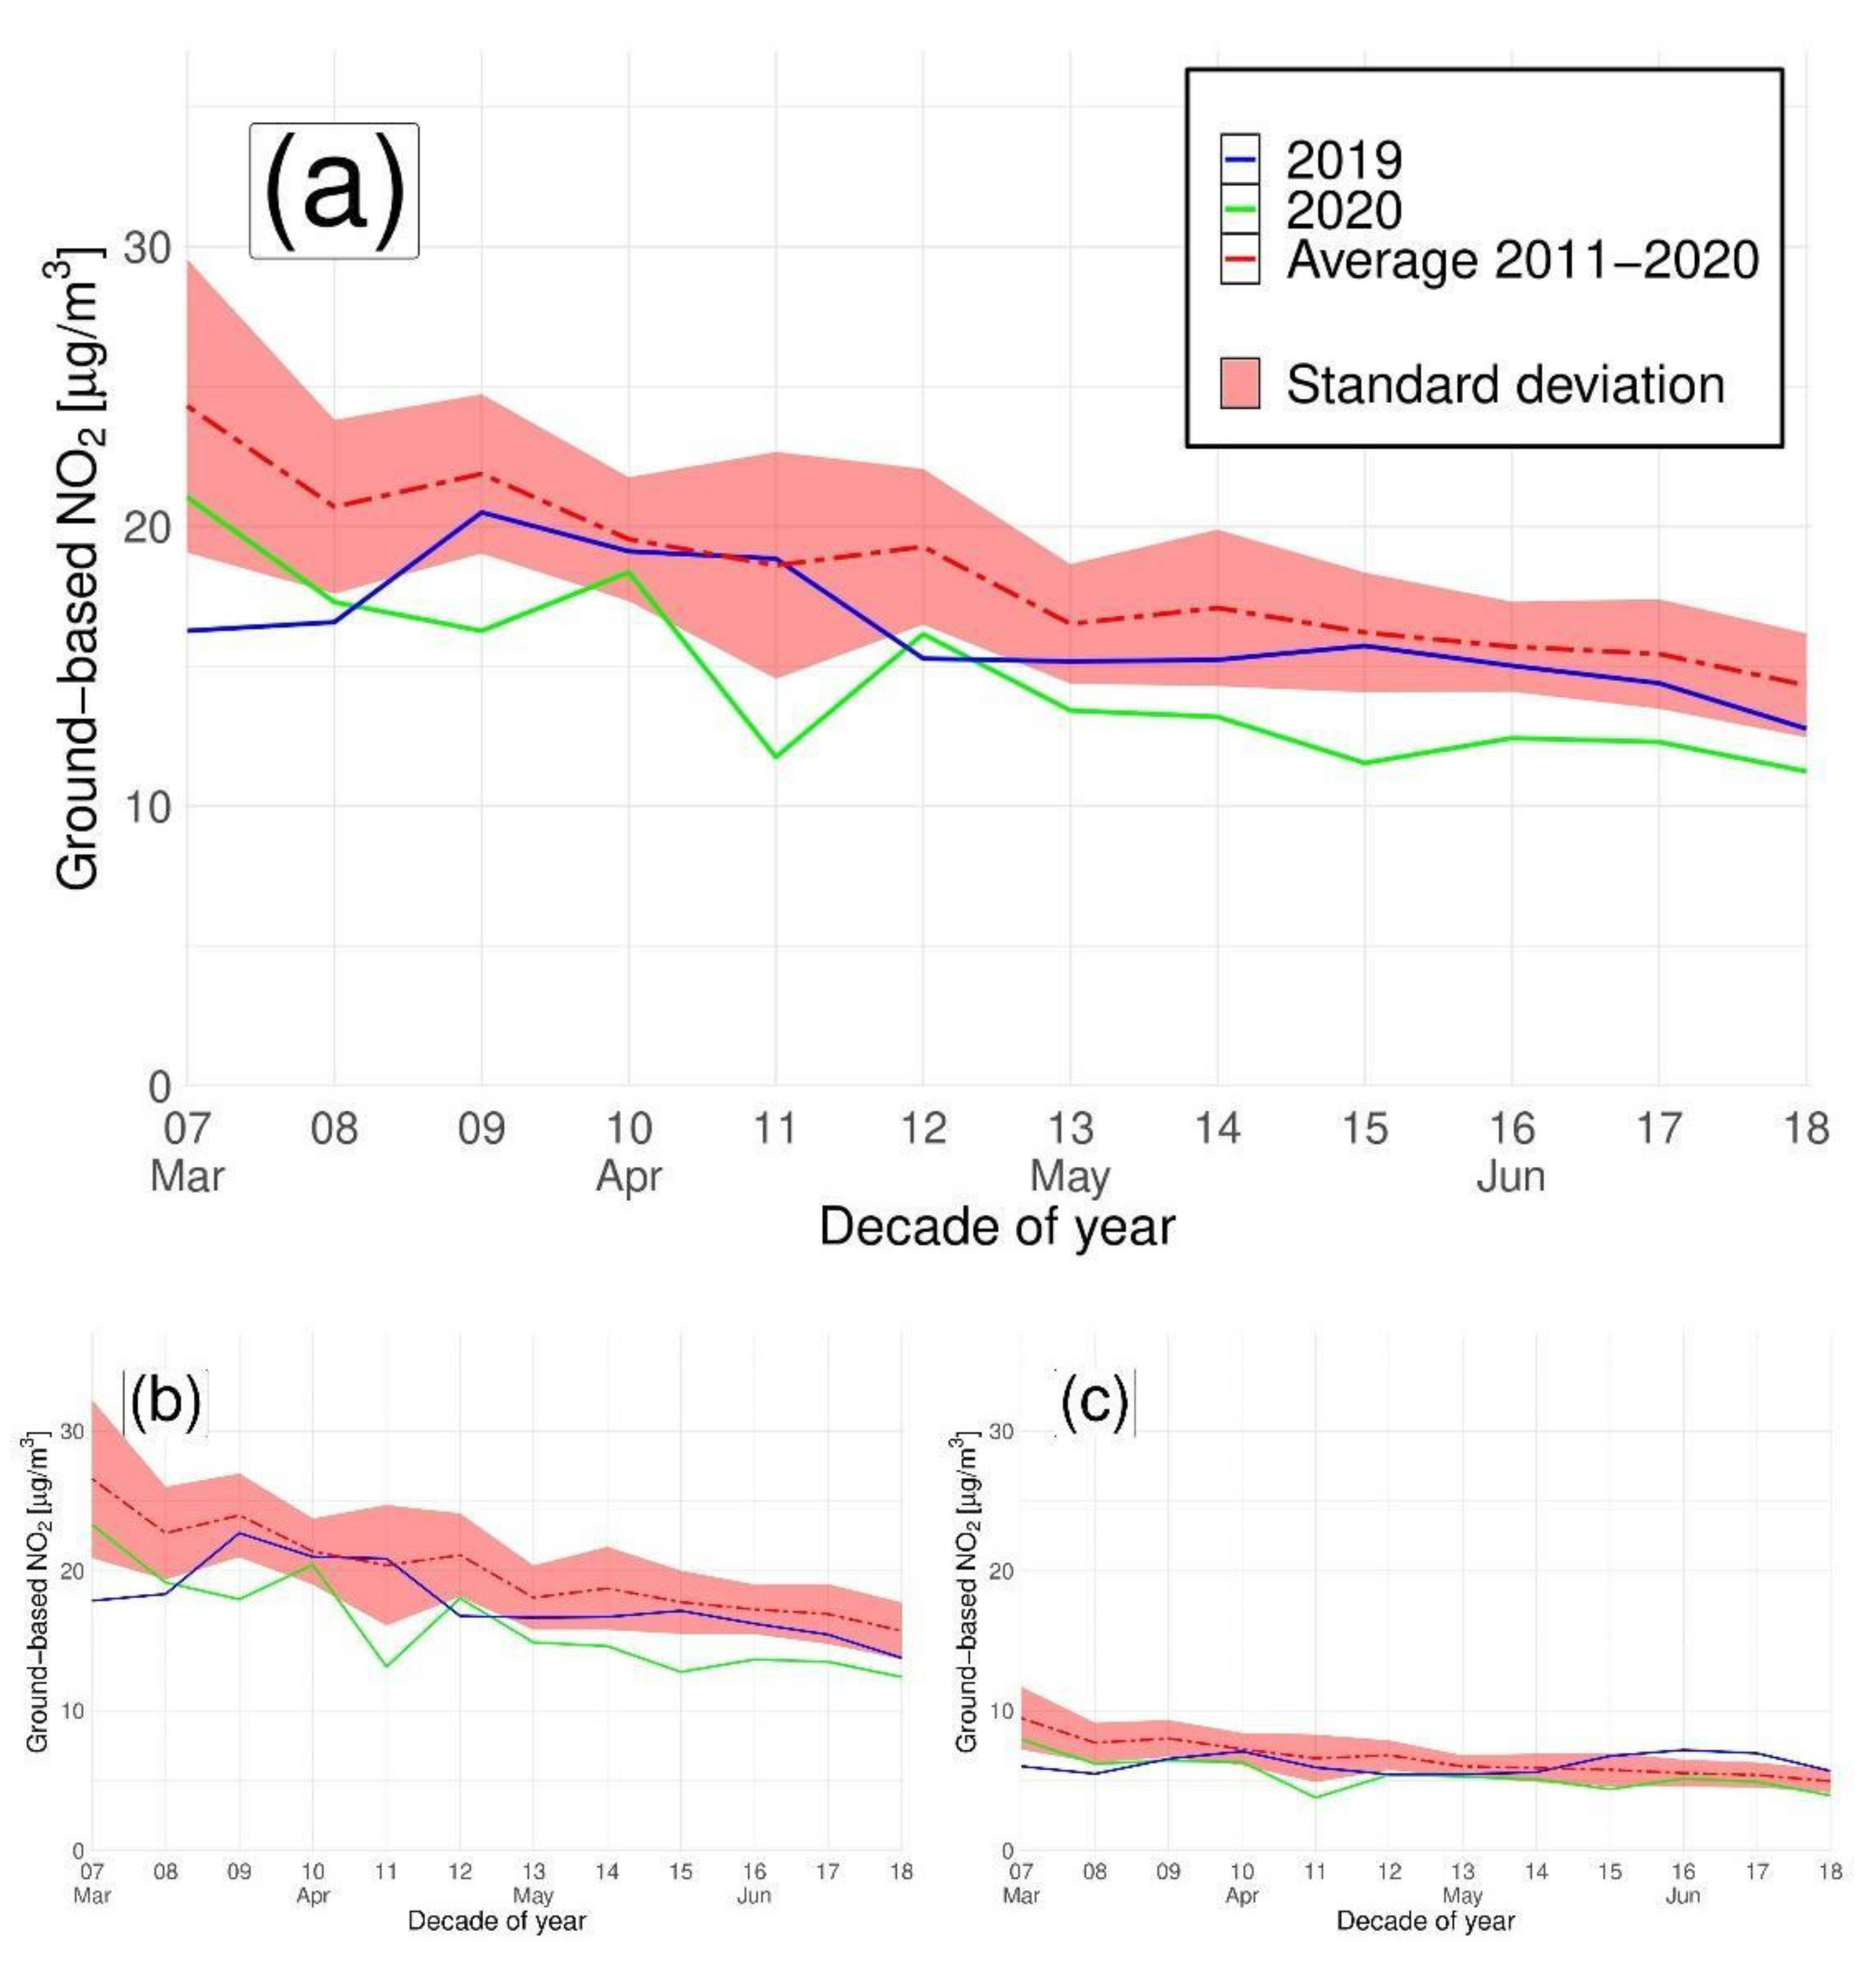
This is noticeable in Figure 9b, where the mean decadal ground-based NO2 concentration for urban stations is significantly below any single standard deviation from the 2011–2020 mean decadal value. On the contrary, background (non-built-up) stations followed the 10-year mean decadal NO2 concentrations more closely (within a single standard deviation). Dissimilarity of patterns between urban and background (non-built-up) stations may indicate that there was an additional factor (i.e., COVID-19 lockdown) apart from meteorological conditions that affected the NO2 concentration in Poland during spring 2020. In this respect, the largest differences from the 10-year average for urban stations were observed in the 11th decade (−36%) during the most stringent lockdown period (Figure 9b). Nevertheless, significant reductions in a range of 20–30% continued throughout the spring 2020.
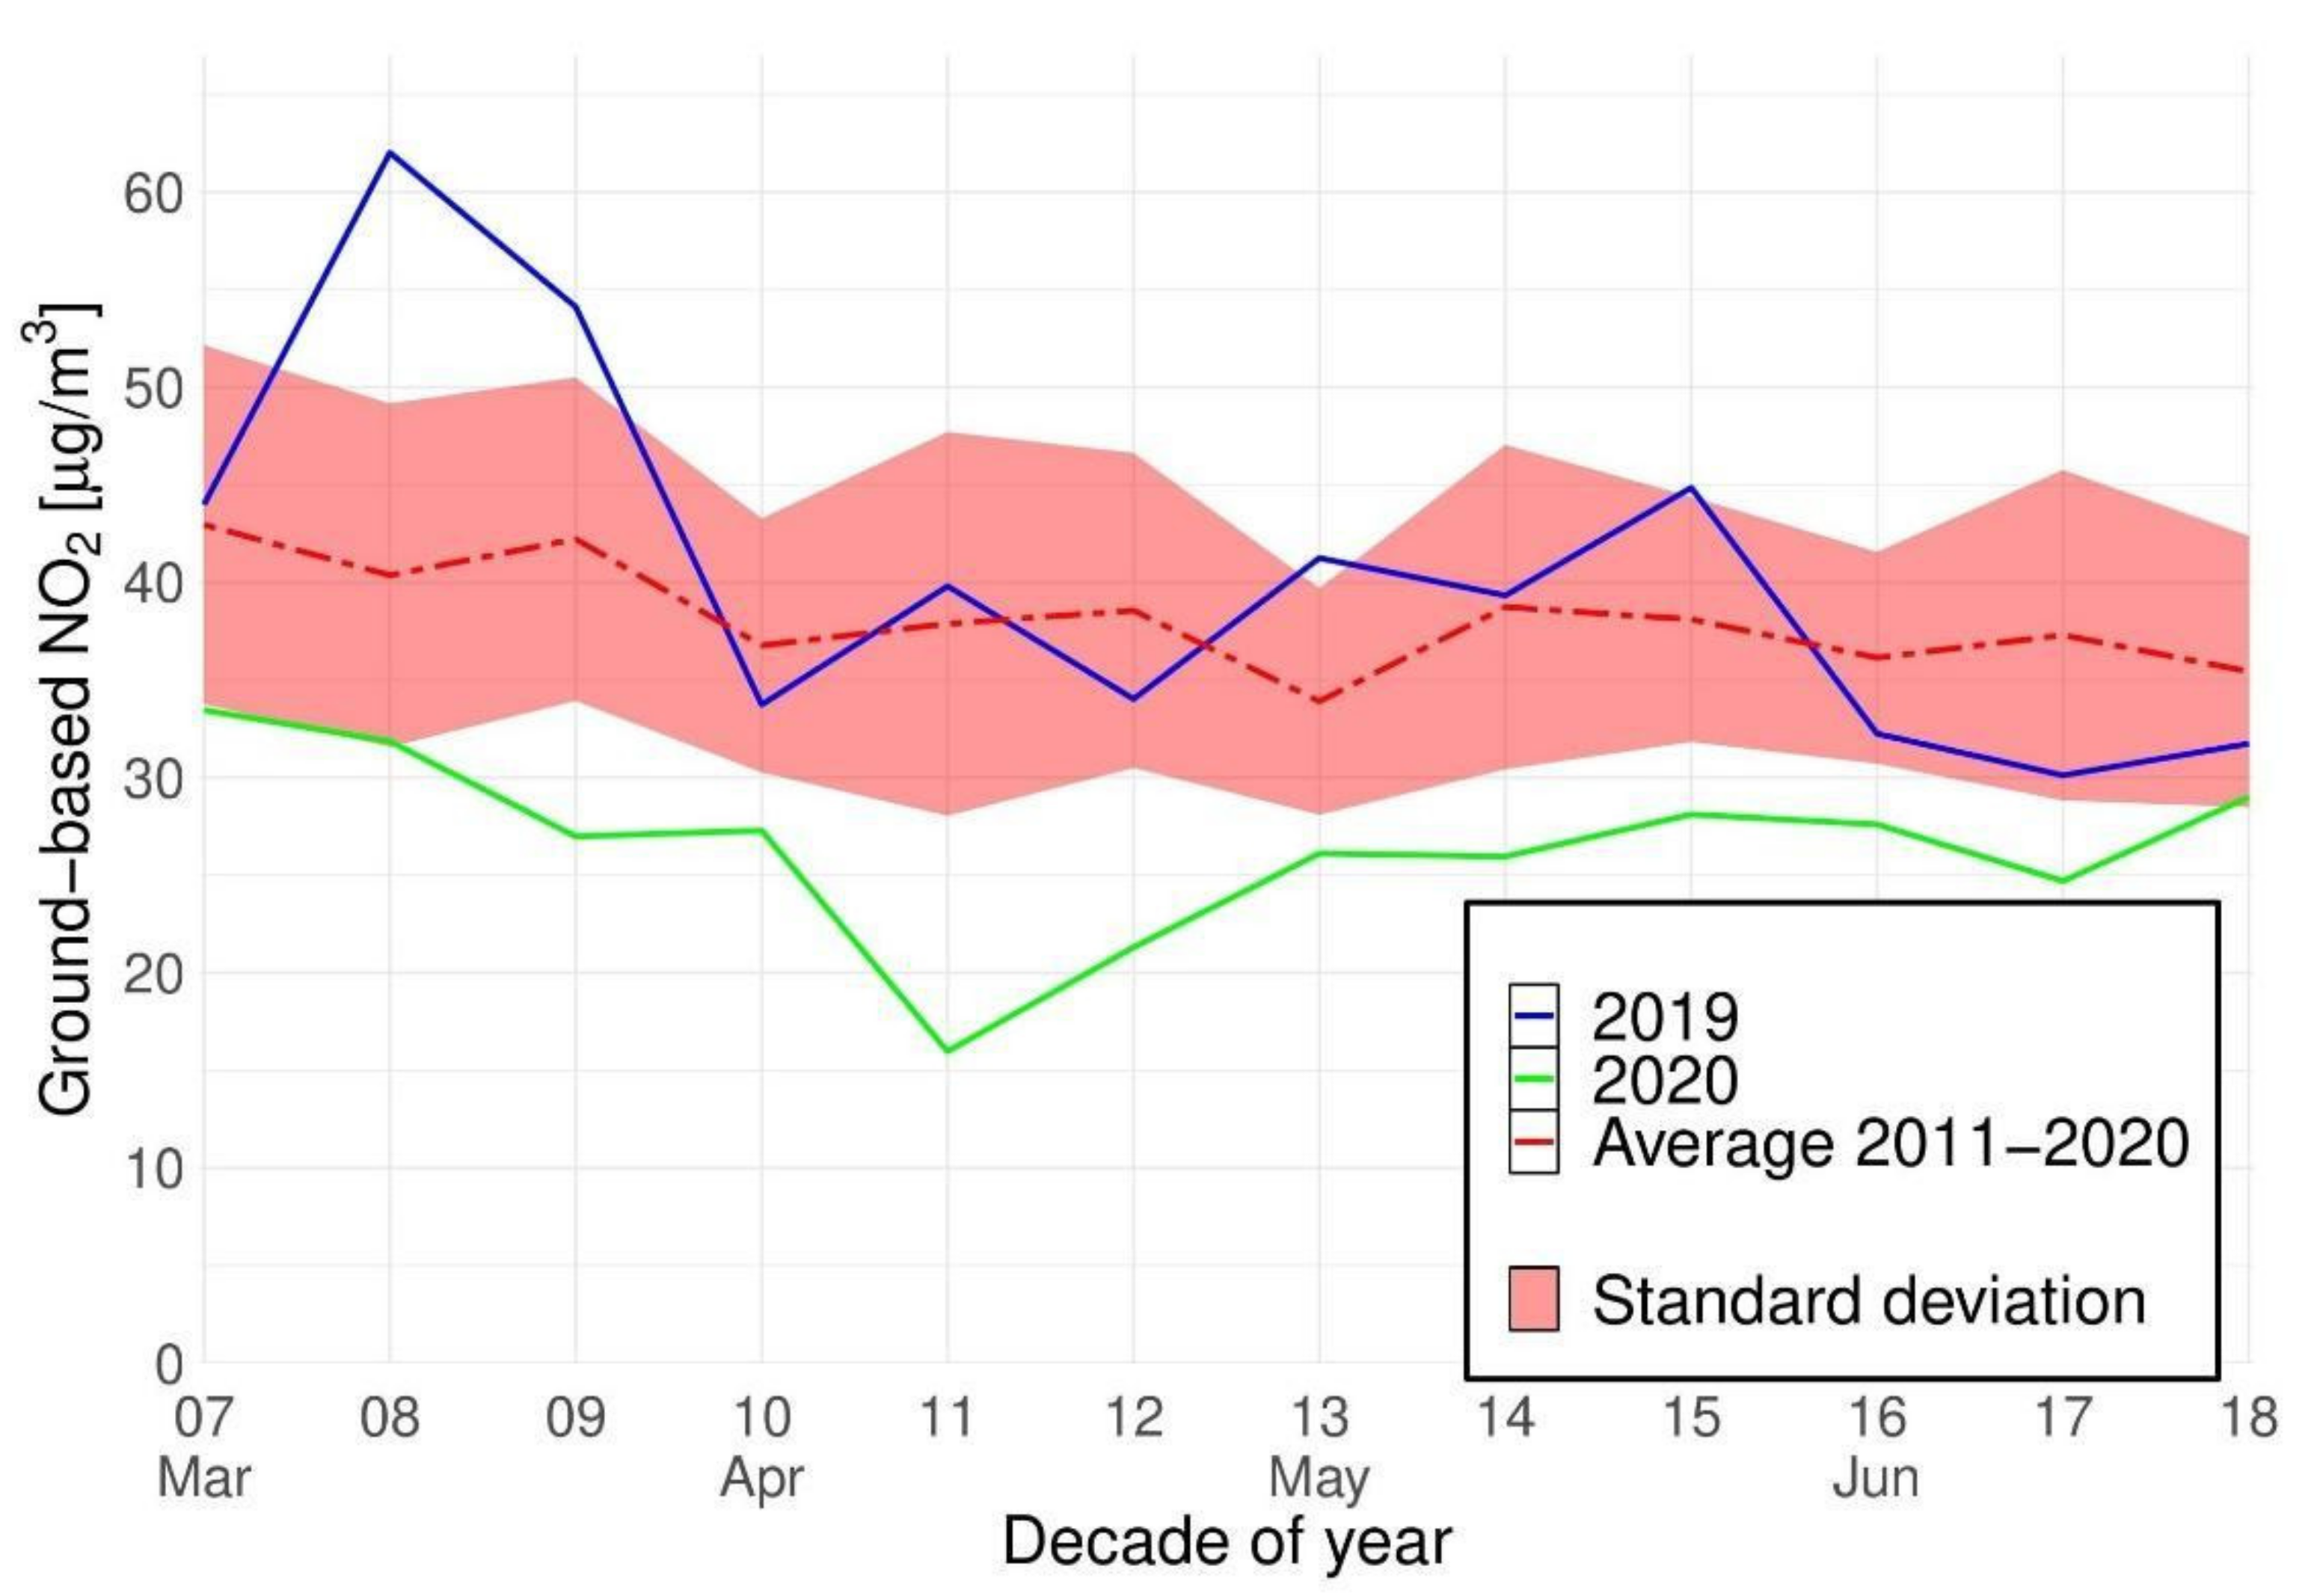
These differences were even more pronounced for stations located in Warsaw during the 11th decade (−58%) and 12th decade (−45%) of 2020. Overall, NO2 concentrations in Warsaw during spring 2020 were reduced by 30% as compared to the 2011–2020 average and by 32% as compared to 2019 (Figure 10). Across the whole of Poland, NO2 concentrations in spring 2020 were 21% lower than the 2011–2020 average and 10% lower than in 2019 (Figure 9a). Gradual lifting of COVID-19-related restrictions resulted in a 52% increase in vehicle traffic between April and May 2020 and a 19% increase between May and June [46,47]. This in turn corresponds well with the increase of NO2 concentrations in Warsaw between 11th and 18th decades (Figure 10), but is opposite to the decreasing trend across all urban stations in Poland (Figure 9b). This may indicate that the COVID-19 lockdown in Poland had a significant effect on NO2 concentrations only in large cities with busy traffic.
NO2 pollution is more related to local emissions, and thus a mesoscale airmass advection direction is less important than local meteorological conditions. Nevertheless, the local temperature inversions measured at Legionowo weather station (25 km from Warsaw) seem not to be related to NO2 concentrations in Warsaw. For example, in June 2020, temperature inversions were around 50% less frequent than in 2019 (Figure 3), but the differences in NO2 concentrations were smallest (Figure 10). Furthermore, unusually frequent advection of warm atlantic air masses from W and NW in spring 2019 (Figure 2) did not directly influence NO2 concentrations measured at urban stations, which followed closely the 2011–2020 average from the 9th to the 18th decade. However, the indirect effect of this event was related to increased mean air temperature by 2.9 °C in March 2019 (Table 1) and less intense fossil fuel burning by heating systems, which resulted in low NO2 concentrations in the 7th and 8th decades of 2019 (Figure 9b). Thus, it can be concluded that in Poland factors such as vehicle traffic intensity and air temperature during the heating season influence the NO2 concentrations during spring more significantly than temperature inversions and the direction of air masses advection.

3.6. Multi-Annual Variability of Ground-Based NO2 Concentration Measurements

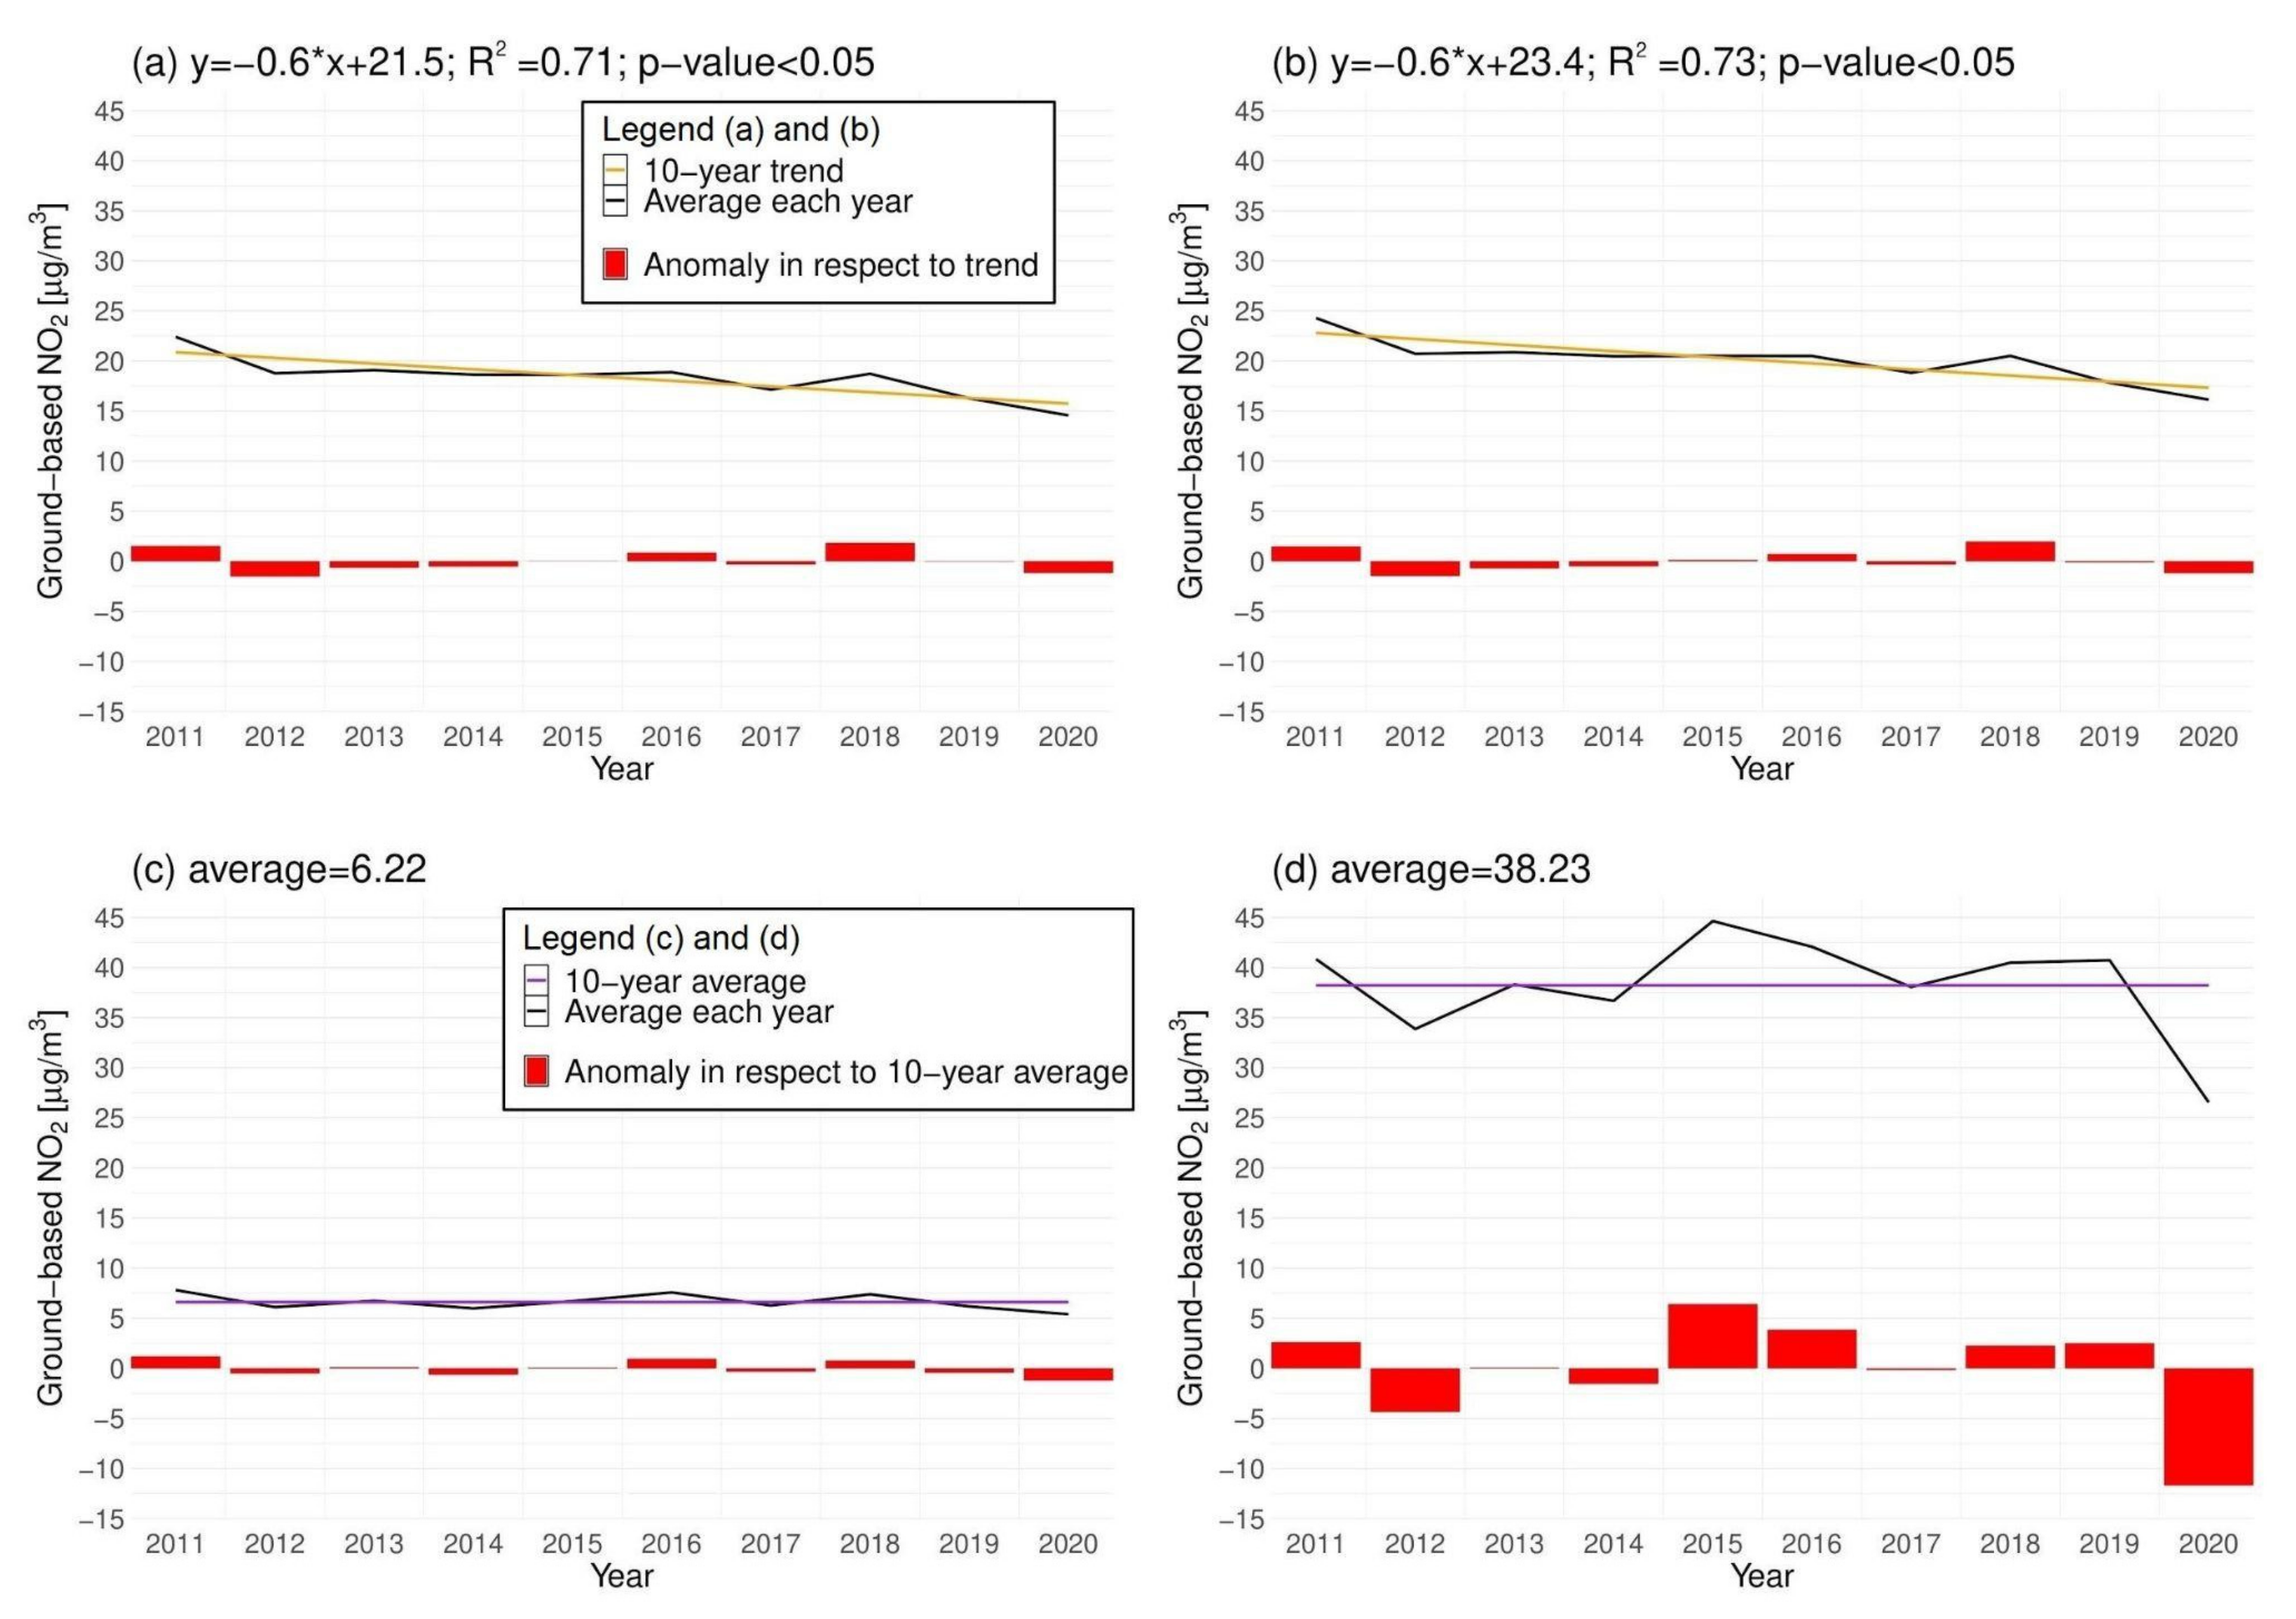
From the 10-year perspective (2011–2020), atmospheric NO2 concentration was smallest in 2020 for urban stations (including Warsaw) and the background station. For urban stations this can be explained by a statistically significant negative trend (−0.6 μg/m3 per 10 years) that can be related to the implementation of more environmentally friendly heating systems and to more efficient NO2 filters mounted in cars. It is even more expressed in the last 5 years. Absolute values had decreased from 20.50 μg/m3 in 2016 to 18.83 μg/m3 in 2017. There had been an increase in 2017, but in 2019 pollution decreased (to 17.83 μg/m3). However, the anomaly in 2020 was still the second largest in 10 years and the largest in the last 5 years. More interestingly, there is no statistically significant temporal trend in NO2 concentrations in Warsaw (Figure 11d) as opposed to other urban stations in Poland (Figure 11a). This can be explained by the constantly increasing number of vehicles in Warsaw, related to its growth, and to the increasing income of Polish households. The lack of statistically significant temporal trends in NO2 concentrations is also apparent for non-built-up stations, which implies that in Poland, NO2 background concentrations during spring was stable within the 2011–2020 time frame. On the other hand, there was a similar pattern of fluctuations of NO2 concentrations over non-built-up areas as over urban areas. Pollution had decreased in 2017, increased in 2018 and decreased in 2019 and 2020 when the largest anomaly in respect to the average was observed. Analogous to the analysis of PM2.5 concentrations presented in Section 3.4, the mean anomalies of NO2 concentrations during spring for each year were computed using either temporal trends (if they were statistically significant) or long-term averages. The anomalies revealed that NO2 concentrations during spring 2020 in Warsaw were exceptionally low compared to the 2011–2020 period (Figure 11d). For other urban stations, the anomalies for spring 2020 were also negative but less pronounced. This again confirms that vehicle traffic in Warsaw is a significant source of NO2 emissions and that this was drastically reduced due to the COVID-19 lockdown. In this respect, an increasing intensity of vehicle traffic in Warsaw was noticeable in spring 2019, where mean NO2 concentrations are above the 2011–2020 average, regardless of favourable weather conditions such as less frequent temperature inversions (Figure 3) and positive (>1.5 °C) temperature anomalies during the heating season in March and April (Table 1). Therefore, the significant reduction in NO2 concentrations in spring 2020 can be attributed to the COVID-19 lockdown.
Within the last few years, after the maximum of NO2 concentrations in 2015, pollution had started to decrease. Then, it increased, but anomalies were still lower than anomalies in 2015 and 2016. However, the reduction in 2020 is extraordinary even with respect to the negative trend observed within the last five years.

3.7. Decadal Variability of Tropospheric NO2 Column Number Density Derived from Sentinel-5P Satellite Data

Air quality data derived from the TROPOMI sensor mounted onboard the Sentinel-5 satellite provide unique capabilities in terms of large scale atmospheric NO2 concentration monitoring.
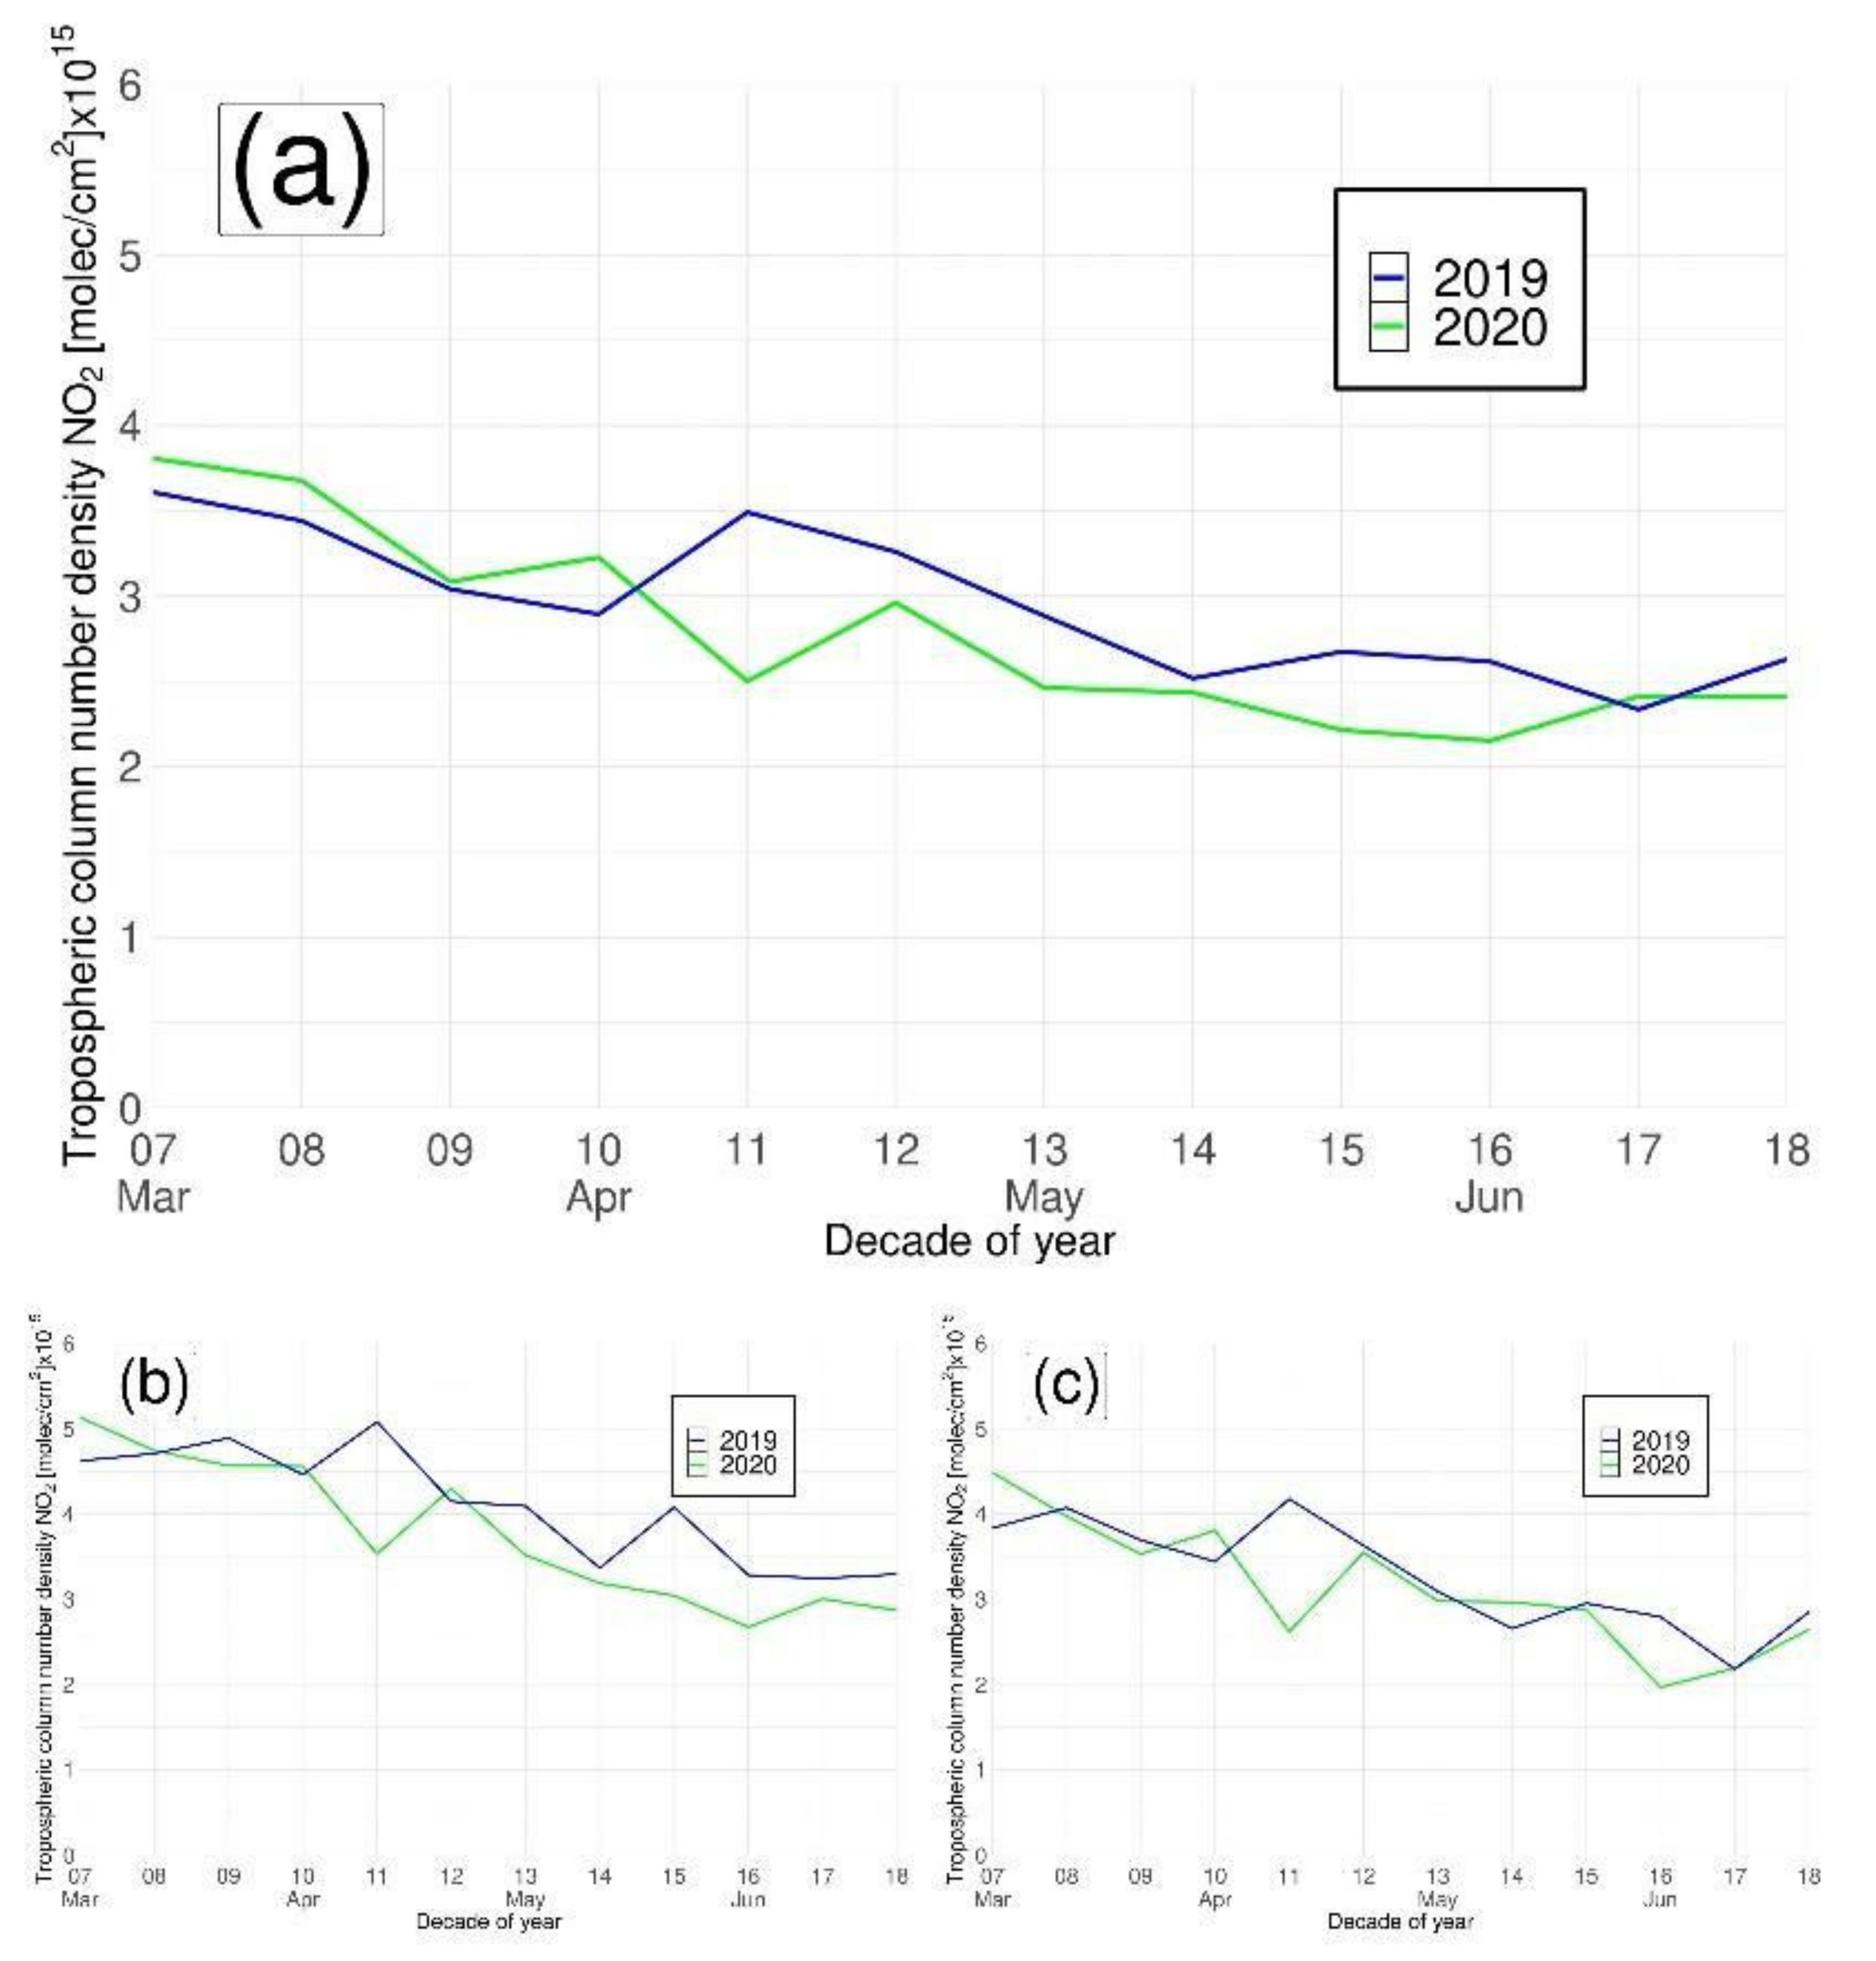
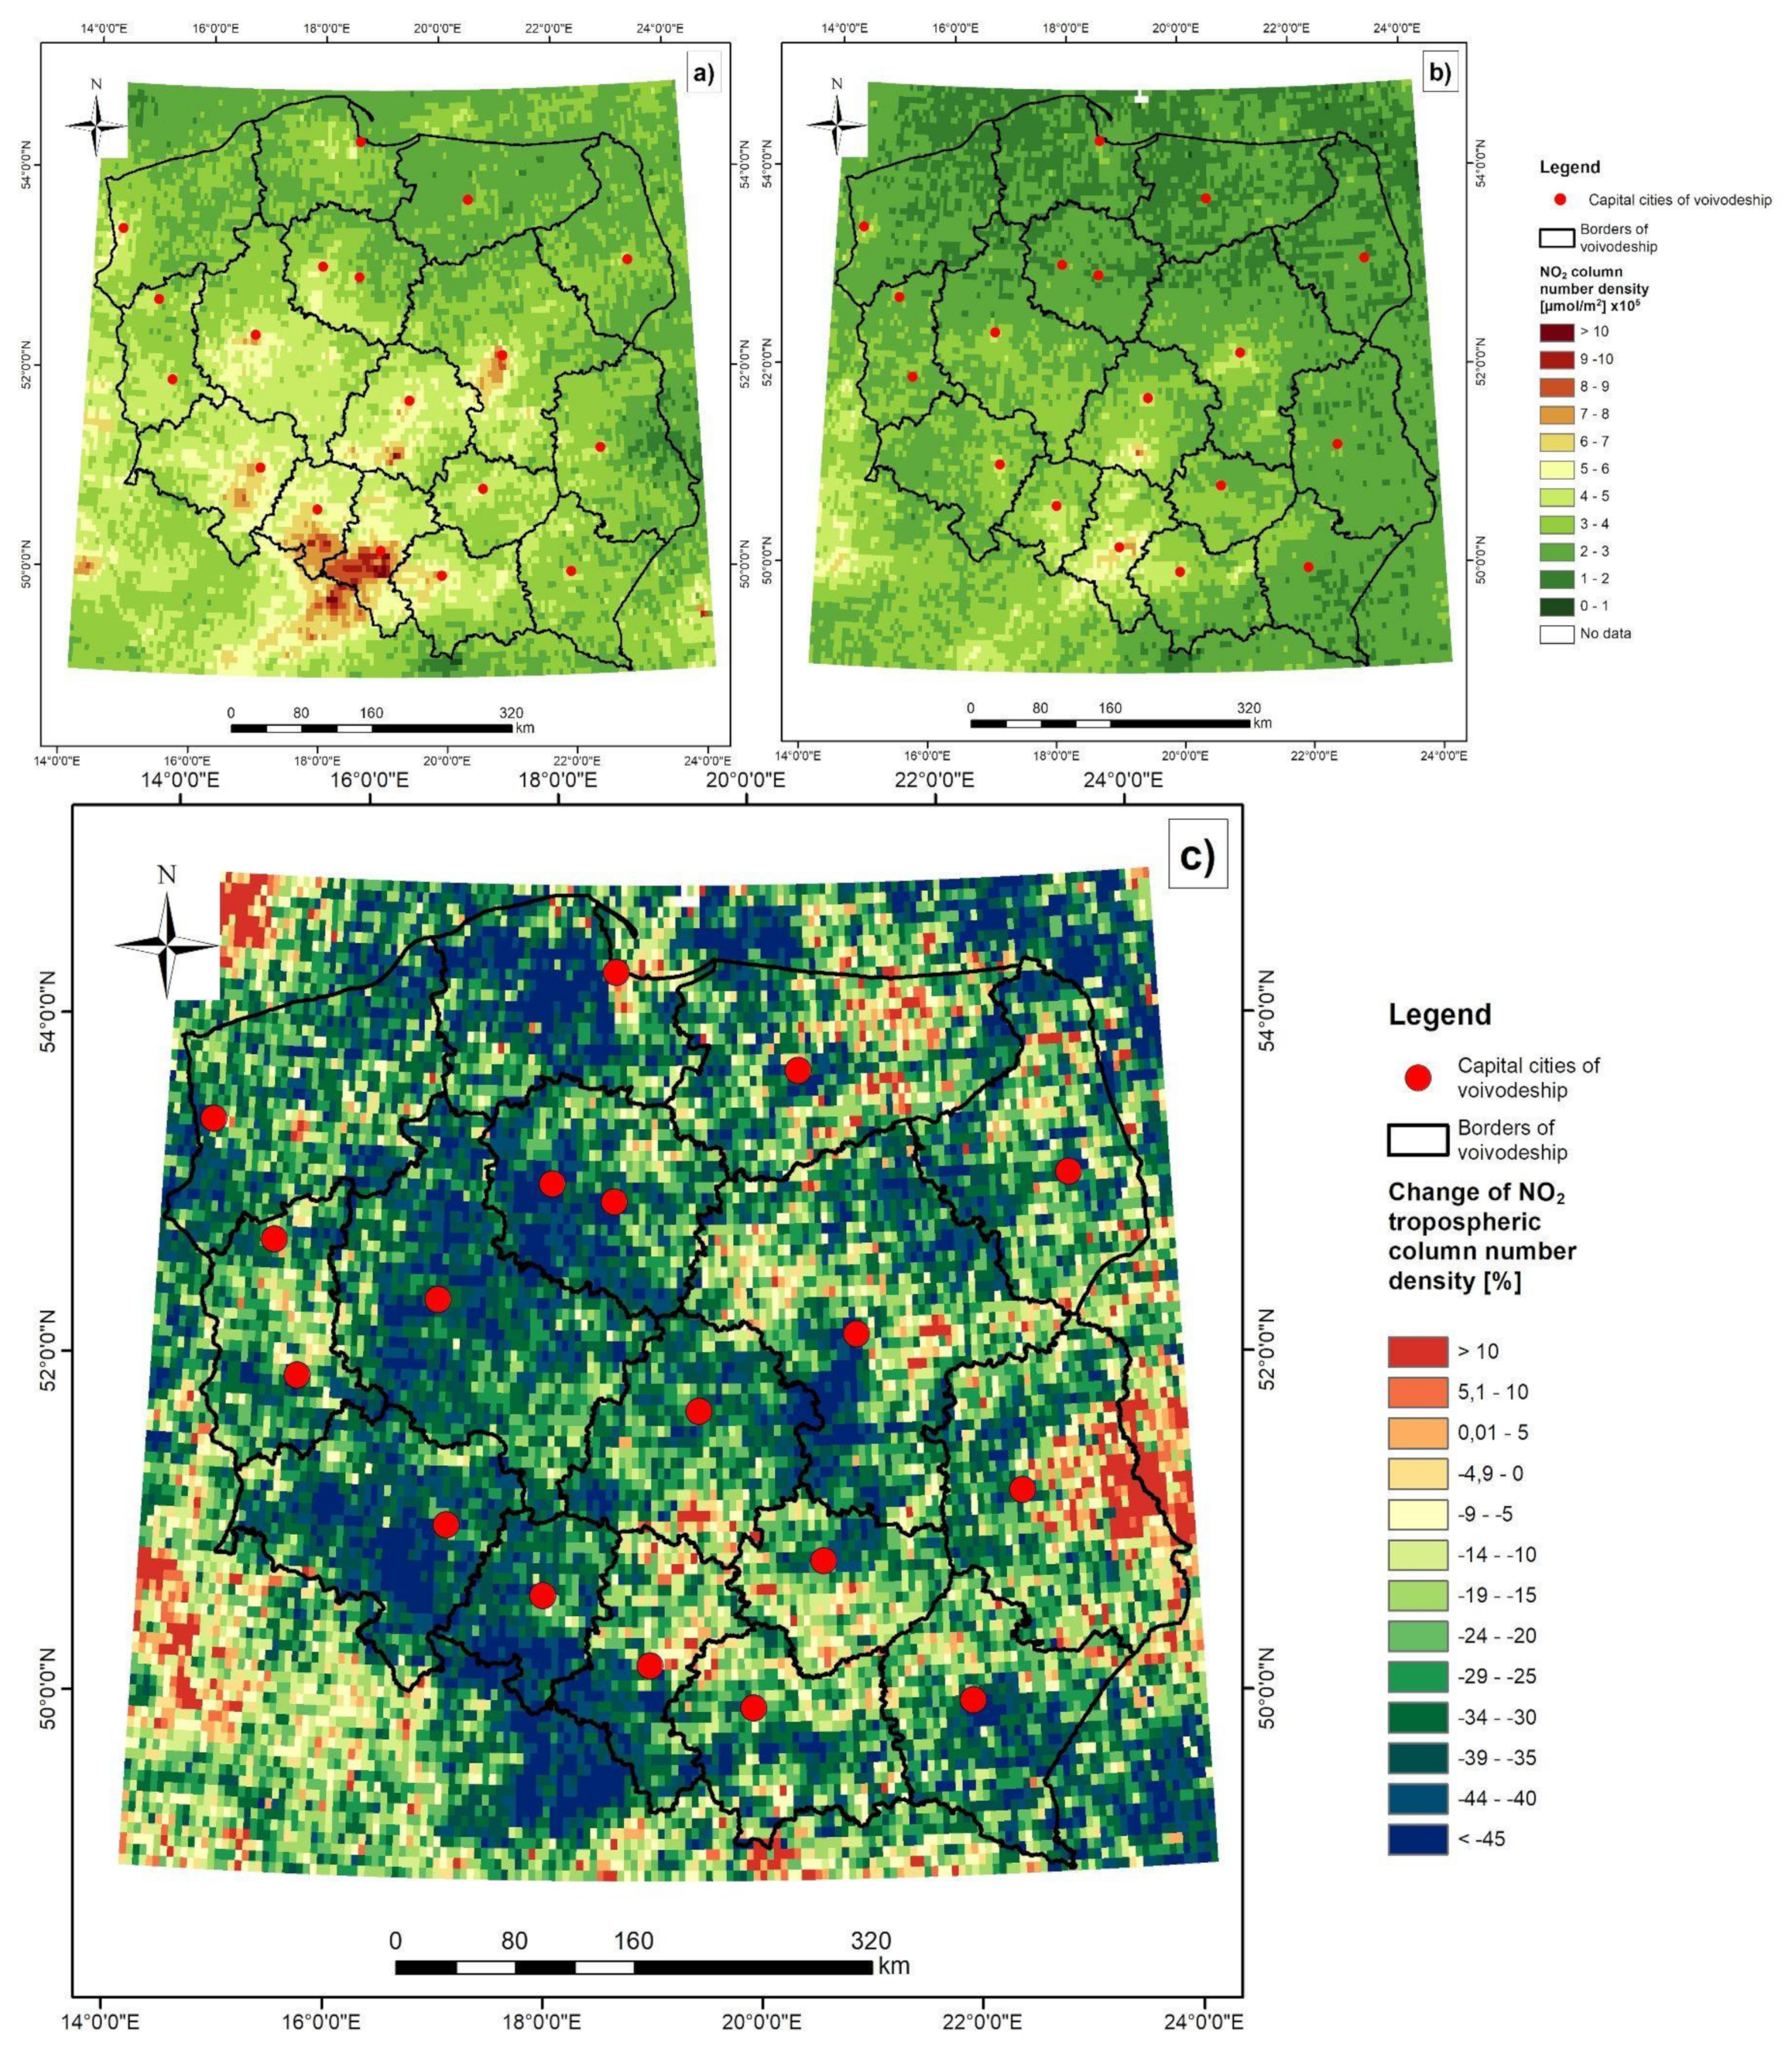
The short time series of Sentinel-5P data (since July 2018) allows a comparison of only two spring seasons without a reference to long-term decadal variabilities. In this respect, NO2 concentrations derived from satellite measurements (Figure 12) reveal a similar decline through the spring season to ground measurements (Figure 9). The agreement between satellite and ground observations is also noticeable for mean differences in NO2 concentrations between the spring seasons in 2019 and 2020. NO2 concentrations derived from Sentinel-5P data were 6% lower in 2020 than in 2019 (Figure 12a) across the whole of Poland, and were 9% lower for urban areas (including Warsaw) and 4% lower for non-built-up areas. Furthermore, a distinct drop of NO2 concentrations during the 11th decade of 2020, which coincides with the introduction of COVID-19-related restrictions, is visible in both datasets for urban and background stations. In this decade, NO2 concentrations were lower in 2020 than in 2019 by 28% across the whole of Poland, by 30% across the urban stations, by 37% across non-built-up areas and by 45% in Warsaw (Figure 13).
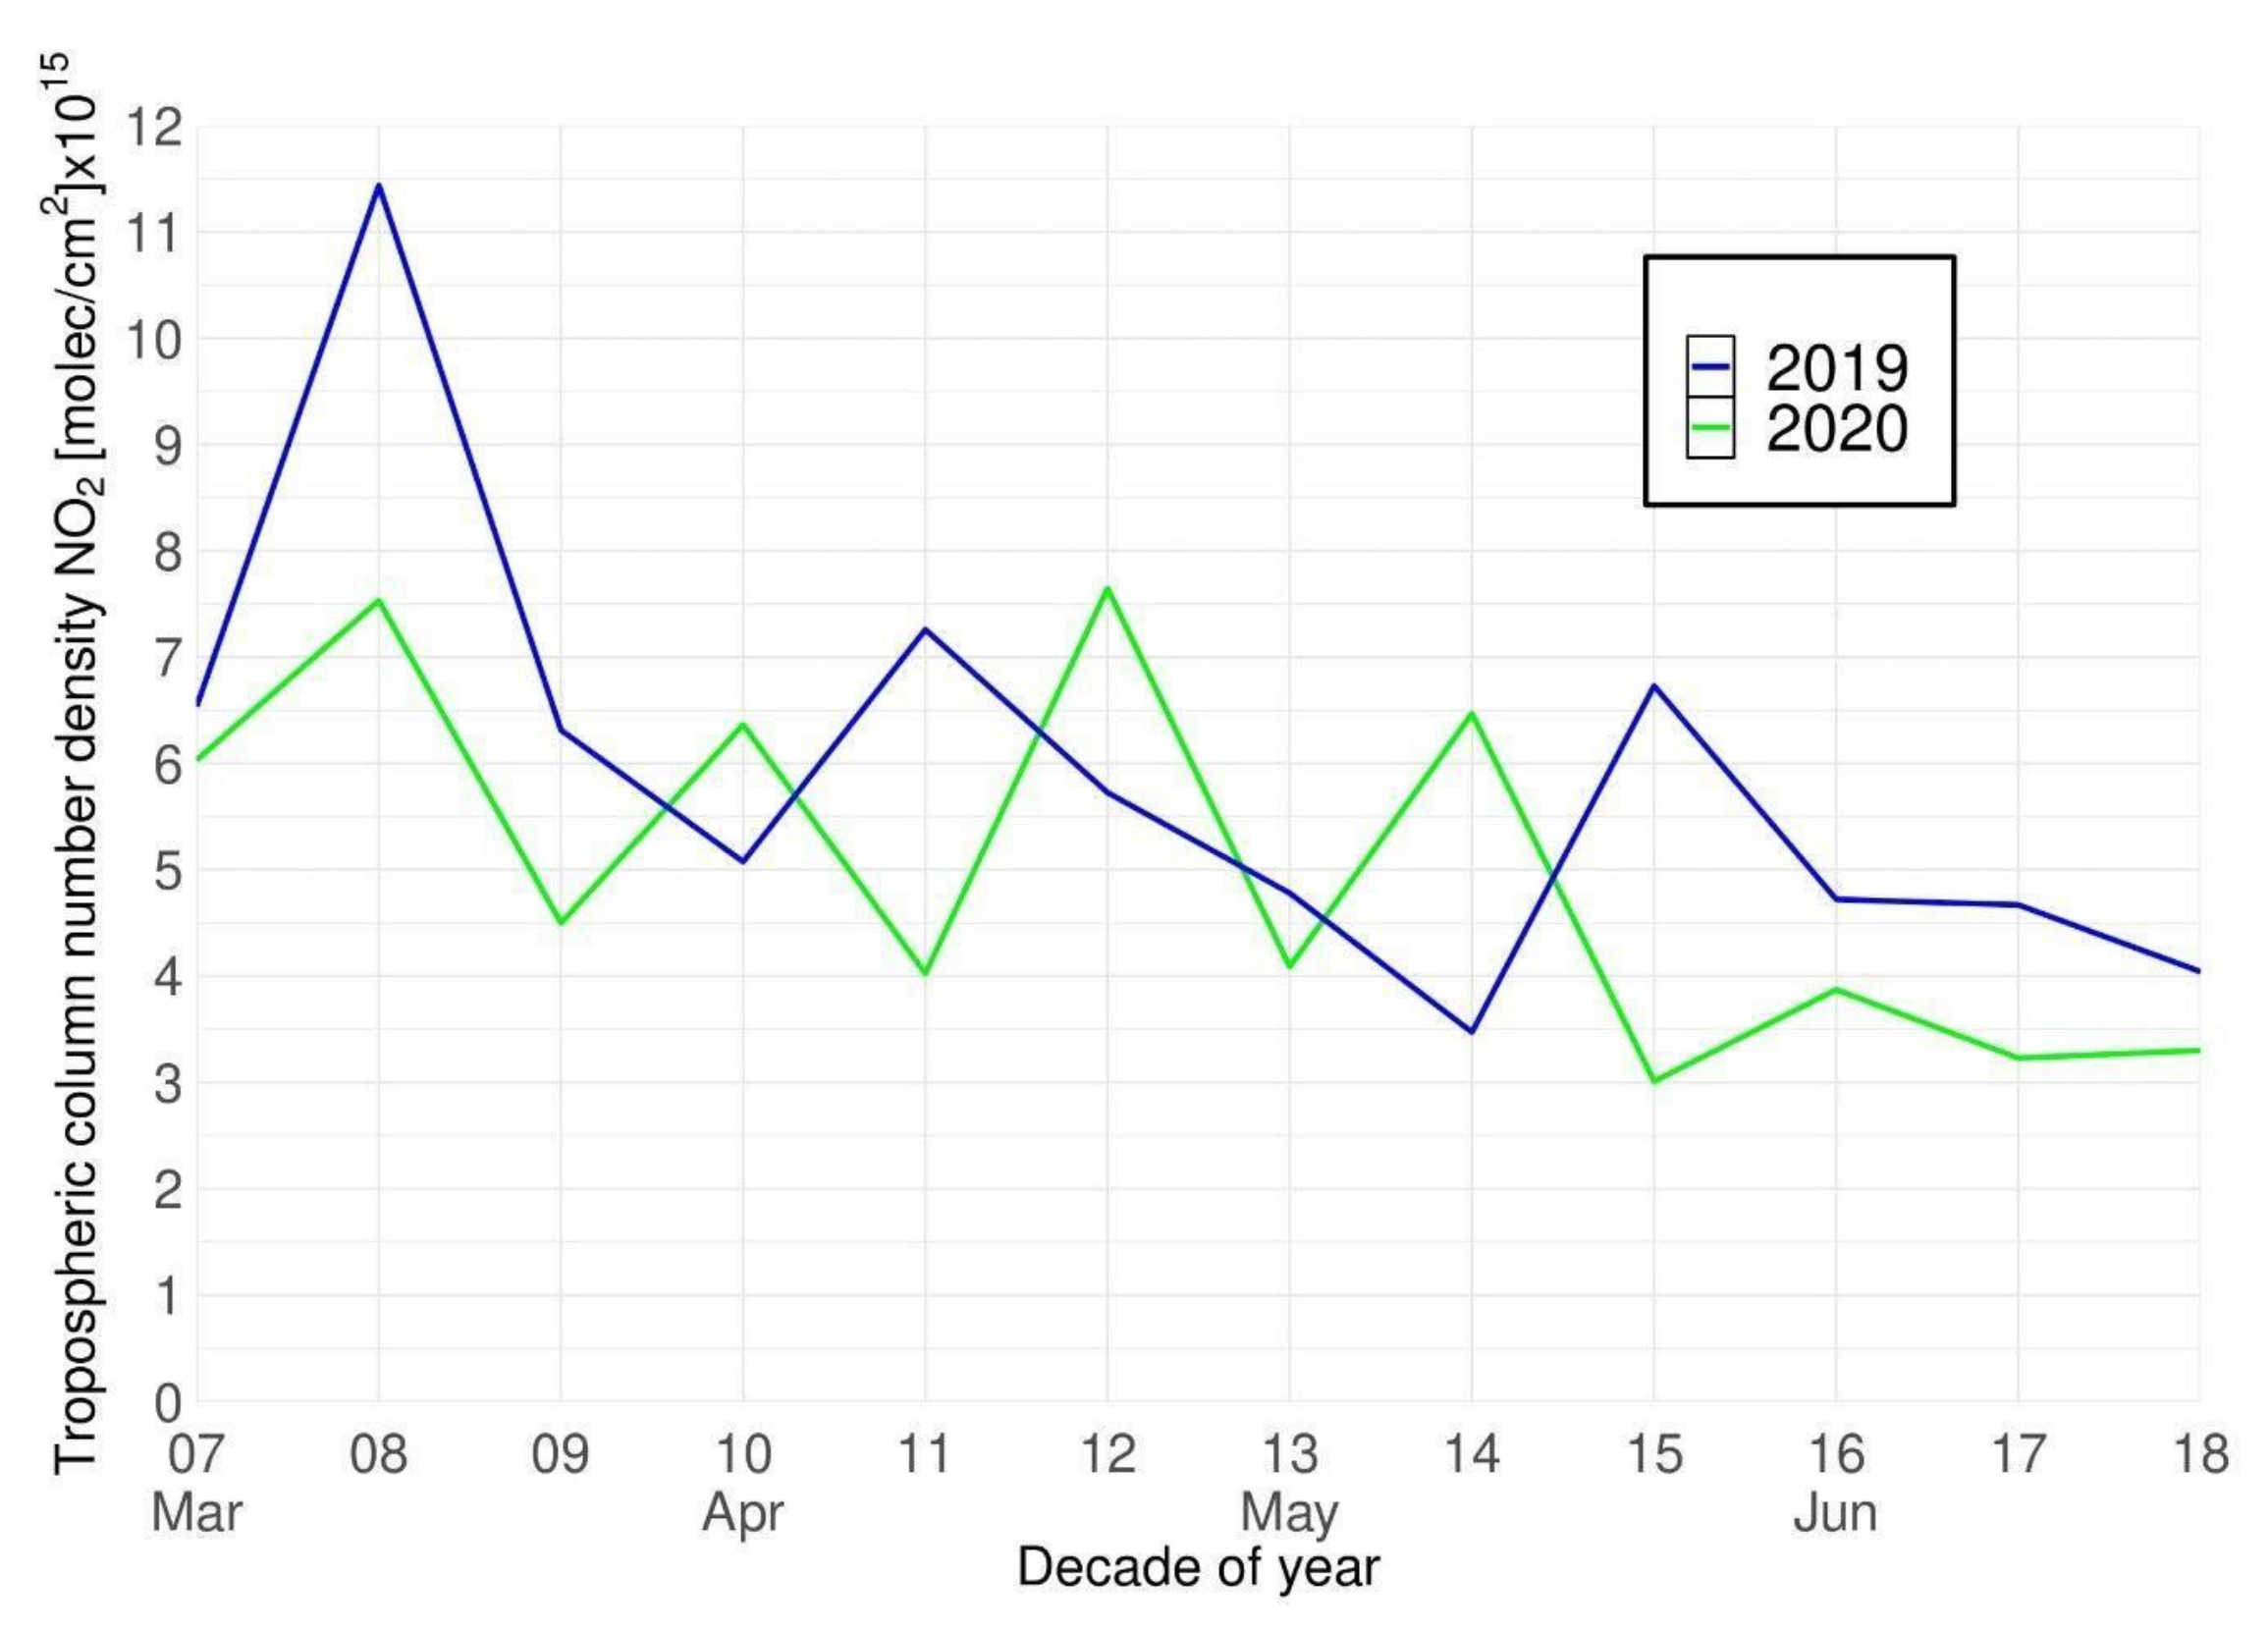
Cross-decadal variability of NO2 concentrations derived from Sentinel-5P satellite data is greater than analogous variability derived from ground station measurements. This is related to the averaging of a different number of Sentinel-5 pixels masked due to cloud cover and pixel geolocation inaccuracies. Due to pixels from subsequent orbits not overlapping, a fraction of urban and rural areas within a pixel are changing. In general, land cover over urban areas (including Warsaw) is very diversified—there are a lot of green areas within an urban fabric. It is particularly visible for small spatial domains such as the Warsaw agglomeration (Figure 14), where cross decadal NO2 variability, derived from coarse resolution satellite imagery, is much greater than for ground stations (Figure 10).

4. Discussion

This study aimed at quantifying the impact of the restrictions imposed by the COVID-19 lockdown during spring 2020 on PM2.5 and NO2 atmospheric concentrations. In Poland, the restrictions caused a significant reduction in vehicle traffic by switching from work-based to a remote work system (35% reduction as compared to 2019). The analyses were based on multi-source datasets consisting of in-situ measurements from GIOS air quality stations, in-situ aerosol properties measured at the Strzyzow AERONET site, NO2 derived from Sentinel-5P satellite data, MERRA-2 climatic reanalysis, climatic statistics based on surface synoptic observations, directions of airmass advections from HYSPLIT model reanalysis, radiosonde measurements from Legionowo weather station, and ancillary data on vehicle traffic. The results revealed that PM2.5 and NO2 atmospheric concentrations during spring 2020 decreased significantly in comparison to 2011–2020 average concentrations. In this respect, reductions in PM2.5 concentrations during the COVID-19 lockdown were −20% at urban air quality stations and −15% at stations located in Warsaw. Another study by Filonchyk et al. [13] showed that compared to 2019, PM2.5 concentrations increased by 23% in March 2020, then decreased by 20% in April and further by 12% in May. In this study, we estimated a 7% increase in March, 23% decrease in April and a 12% decrease in May. However, we used data only from stations where complete 10-year time series was available, while in 2019–2020 the number of stations increased. On a national scale, other studies have reported a 19% reduction of PM2.5 concentrations in China [48], a 21% reduction in Italy and a 20% reduction in Chile [49]. Although agreement between different studies is encouraging, it has to be noted that environmental conditions across different countries differ significantly, COVID-19-related restrictions were not imposed exactly at the same time worldwide and the time span of analysed time series differed (in this study the longest being a 10-year perspective).
Regarding non-built-up (background) air quality stations in Poland, which should not be affected by anthropogenic pollution, a 23% reduction in PM2.5 concentrations was estimated for spring 2020. Similar decreases to PM2.5 concentrations were found for AOD, which decreased by 14% across Poland according to MERRA-2 reanalysis and 14% according to measurements taken at Strzyzow AERONET background site. This leads to the conclusion that the COVID-19 lockdown was not the only reason for the decrease of aerosol concentrations during spring 2020. This hypothesis was verified by an analysis of wind direction from the HYSPLIT model, which revealed unusually frequent advection of clean atlantic air masses from the NW, W and N, which prevailed from March to June 2020. Significant weather anomalies in Western Europe were also reported by van Heerwaarden et al. [50], who found that during spring 2020 solar irradiance over the Netherlands was the highest since 1928. The advection of warm atlantic air masses and a positive solar irradiance anomaly in spring 2020 resulted in positive temperature anomalies in Poland (see Table 1), which in turn decreased the intensity of fossil fuel burning for heating systems and consequently further improved air quality.
In terms of NO2 atmospheric concentrations, the mesoscale air mass advections are less influential than local factors such as temperature inversions and emissions from fires and heating systems [43,44]. However, within this study, no clear correlation between NO2 concentrations in Warsaw and the frequency of deep temperature inversions (>3 °C) derived from radiosonde measurements taken at Legionowo weather station (25 km from Warsaw) were confirmed. On the contrary, reduction in vehicle traffic in Warsaw due to the COVID-19 lockdown seems to correspond well with the decrease of NO2 concentrations which for the 11th decade of 2020 (the time of the most stringent restrictions) was 58% compared to 2011–2020 average. From the perspective of the spring season in 2020, this reduction was 30% in Warsaw, 21% across Poland, 20% across urban air quality stations and 18% across background stations. For comparison, a 40% NO2 concentration reduction was reported for London, 35% for Milan, 50% for Paris [51], 56% for Madrid, 46% for Barcelona [52], 35% for Warsaw, 35% for Beijing, 30% for New York, 20% for Berlin, 20% for Tokyo and 10% for Sydney [10]. At a national scale Solberg et al. [53] estimated by means of a General Additive Model (GAM) that with or without the COVID-19 lockdown, NO2 was reduced by 20% during spring 2020 across Poland. Similar reductions were also reported for Denmark, Hungary and Czechia. Furthermore, this study revealed strong agreement between NO2 concentrations derived from Sentinel-5P satellite data and in-situ measurements. In this respect, comparison of NO2 concentrations between the springs of 2019 and 2020 revealed 6%, 9%, 4% reductions based on Sentinel-5P product, and 10%, 9%, 12% reductions based on in-situ measurements across the whole of Poland, across urban stations and background stations, respectively.

5. Conclusions

To conclude, it has to be emphasised that COVID-19 lockdown improved air quality in Poland, but the magnitude of this effect is hard to dissociate from the unusual weather conditions related to frequent advections of relatively clean and warm atlantic air masses.
Key findings of this research are:
  • Results revealed that PM2.5 and NO2 atmospheric concentrations and AOD decreased significantly in spring 2020 in comparison with 2019 and 2011–2020 average concentrations. Overall, air quality in Poland improved during COVID-19 lockdown in spring 2020.
  • The period of the strictest restrictions (11–20th April) was the least polluted.
  • According to aerosol optical properties observed at the background station at Strzyzow, the mesoscale conditions, such as wind characteristics, in particular affected aerosol properties.
  • NO2 concentrations were not affected by advection of air masses. They were affected by reduced transport and lower emissions from heating systems caused by the positive air temperature anomalies. Particularly, reductions in vehicle traffic in Warsaw corresponds well with the decrease in NO2 surface concentrations.
  • Reduction of PM2.5, NO2 and NO2 TVCD over Poland during COVID-19 lockdown is low in comparison with reductions over other countries and cities.
  • The novel data source originating from the Sentinel-5P satellite provides a unique perspective on NO2 surface concentrations, which corresponds well with in-situ air quality measurements.
Conclusions drawn from this study will be further used to model ground-based concentrations of NO2 by means of a fusion of S-5P and meteorological data. Ultimately, a system for air quality monitoring in Poland based on multisource datasets will be created.

Author Contributions

P.T.G.: Conceptualization, Methodology, Formal analysis, Investigation, Data curation, Writing—Original Draft, Visualization, Project administration. K.M.M.: Conceptualization, Methodology, Formal analysis, Investigation, Data curation, Writing—Review and Editing, Supervision. J.P.M.: Conceptualization, Methodology, Data curation, Writing—Review and Editing, Supervision. All authors have read and agreed to the published version of the manuscript.

Funding

This research was carried out partly within Polish Grant No. 2017/27/B/ST10/00549 of the National Science Centre coordinated by the Institute of Geophysics, Faculty of Physics, University of Warsaw.

Institutional Review Board Statement

Not applicable.

Informed Consent Statement

Not applicable.

Data Availability Statement

Not applicable.

Acknowledgments

We would like to thank: Chief Inspectorate of Environmental Protection (GIOS) for sharing the PM2.5 and NO2 ground concentration data; European Space Agency (ESA) for sharing the NO2 TVCD Sentinel-5P data; National Aeronautics and Space Administration (NASA) for sharing the MERRA-2 reanalysis data; Institute of Meteorology and Water Management (IMGW-PIB) for sharing radiosonde data and National Oceanic and Atmospheric Administration (NOAA) for sharing back-trajectories obtained from HYSPLIT simulation.

Conflicts of Interest

The authors declare no conflict of interest.

References

  1. National Health Fund. Reasons of the Increase Number of Deaths in Poland in 2017. Available online: https://zdrowedane.nfz.gov.pl/course/view.php?id=10 (accessed on 5 November 2020). (In Polish)
  2. Sroczyński, J. The Impact of Atmos. Air Pollution on Human Health; PAN: Wrocław, Poland, 1988. (In Polish) [Google Scholar]
  3. European Environment Agency. Air Quality in Europe—2016 Report. Report No 28/2016. Available online: https://www.eea.europa.eu/publications/air-quality-in-europe-2016 (accessed on 3 December 2020).
  4. World Health Organisation. Coronavirus Disease (COVID-19) Situational Report 51. Available online: https://www.who.int/docs/default-source/coronaviruse/situation-reports/20200311-sitrep-51-covid-19.pdf?sfvrsn=1ba62e57_10 (accessed on 16 March 2020).
  5. Merriam-Webster.com. Lockdown. Available online: https://www.merrian-webster.com/dictionary/lockdown (accessed on 27 February 2021).
  6. Council of Ministers. Available online: https://monitorpolski.gov.pl/MP (accessed on 11 March 2021).
  7. Bauwens, M.; Compernolle, S.; Stavrakou, T.; Müller, J.; Van Gent, J.; Eskes, H.; Levelt, P.F.; van der A, R.; Veefkind, J.P.; Vlietinck, J.; et al. Impact of Coronavirus Outbreak on NO2 Pollution Assessed Using TROPOMI and OMI Observations. Geophys. Res. Lett. 2020, 47. [Google Scholar] [CrossRef]
  8. National Aeronautics and Space Administration. Airborne Nitrogen Dioxide Plummets over China. Available online: https://earthobservatory.nasa.gov/images/146362/airborne-nitrogen-dioxide-plummets-over-china (accessed on 15 December 2020).
  9. Dutheil, F.; Baker, J.S.; Navel, V. COVID-19 as a factor influencing air pollution? Environ. Pollut. 2020, 263, 114466. [Google Scholar] [CrossRef]
  10. Fu, F.; Purvis-Roberts, K.; Williams, B. Impact of the COVID-19 Pandemic Lockdown on Air Pollution in 20 Major Cities around the World. Atmosphere 2020, 11, 1189. [Google Scholar] [CrossRef]
  11. Venter, Z.S.; Aunan, K.; Chowdhury, S.; Lelieveld, J. COVID-19 lockdowns cause global air pollution declines. Proc. Natl. Acad. Sci. USA 2020, 117, 18984–18990. [Google Scholar] [CrossRef]
  12. Menut, L.; Bessagnet, B.; Siour, G.; Mailler, S.; Pennel, R.; Cholakian, A. Impact of lockdown measures to combat Covid-19 on air quality over western Europe. Sci. Total Environ. 2020, 741, 140426. [Google Scholar] [CrossRef]
  13. Filonchyk, M.; Hurynovich, V.; Yan, H. Impact of Covid-19 lockdown on air quality in the Poland, Eastern Europe. Environ. Res. 2020, 198, 110454. [Google Scholar] [CrossRef]
  14. Chief Inspectorate of Environmental Protection. Available online: http://www.gios.gov.pl/pl (accessed on 20 December 2020).
  15. Holben, B.; Eck, T.; Slutsker, I.; Tanré, D.; Buis, J.; Setzer, A.; Vermote, E.; Reagan, J.; Kaufman, Y.; Nakajima, T.; et al. AERONET—A Federated Instrument Network and Data Archive for Aerosol Characterization. Remote Sens. Environ. 1998, 66, 1–16. [Google Scholar] [CrossRef]
  16. Barreto, A.; Cuevas, E.; Granados-Muñoz, M.-J.; Alados-Arboledas, L.; Romero, P.M.; Gröbner, J.; Kouremeti, N.; Almansa, A.F.; Stone, T.; Toledano, C.; et al. The new sun-sky-lunar Cimel CE318-T multiband photometer—A comprehensive performance evaluation. Atmos. Meas. Tech. 2016, 9, 631–654. [Google Scholar] [CrossRef] [Green Version]
  17. Müller, T.; Laborde, M.; Kassell, G.; Wiedensohler, A. Design and performance of a three-wavelength LED-based total scatter and backscatter integrating nephelometer. Atmos. Meas. Tech. 2011, 4, 1291–1303. [Google Scholar] [CrossRef] [Green Version]
  18. Saturno, J.; Pöhlker, C.; Massabò, D.; Brito, J.; Carbone, S.; Cheng, Y.; Chi, X.; Ditas, F.; de Angelis, I.H.; Morán-Zuloaga, D.; et al. Comparison of different Aethalometer correction schemes and a reference multi-wavelength absorption technique for ambient aerosol data. Atmos. Meas. Tech. 2017, 10, 2837–2850. [Google Scholar] [CrossRef] [Green Version]
  19. Veefkind, J.; Aben, I.; McMullan, K.; Förster, H.; de Vries, J.; Otter, G.; Claas, J.; Eskes, H.; de Haan, J.; Kleipool, Q.; et al. TROPOMI on the ESA Sentinel-5 Precursor: A GMES mission for global observations of the Atmos. composition for climate, air quality and ozone layer applications. Remote Sens. Environ. 2012, 120, 70–83. [Google Scholar] [CrossRef]
  20. Gorelick, N.; Hancher, M.; Dixon, M.; Ilyushchenko, S.; Thau, D.; Moore, R. Google Earth Engine: Planetary-scale geospatial analysis for everyone. Remote Sens. Environ. 2017, 202, 18–27. [Google Scholar] [CrossRef]
  21. Boersma, K.F.; Eskes, H.J.; Veefkind, J.P.; Brinksma, E.J.; van der A, R.; Sneep, M.; Oord, G.H.J.V.D.; Levelt, P.F.; Stammes, P.; Gleason, J.F.; et al. Near-real time retrieval of tropospheric NO2 from OMI. Atmos. Chem. Phys. Discuss. 2007, 7, 2103–2118. [Google Scholar] [CrossRef] [Green Version]
  22. Boersma, K.F.; Eskes, H.J.; Dirksen, R.J.; van der A, R.; Veefkind, J.P.; Stammes, P.; Huijnen, V.; Kleipool, Q.L.; Sneep, M.; Claas, J.; et al. An improved tropospheric NO2 column retrieval algorithm for the Ozone Monitoring Instrument. Atmos. Meas. Tech. 2011, 4, 1905–1928. [Google Scholar] [CrossRef] [Green Version]
  23. Boersma, K.F.; Eskes, H.J.; Richter, A.; De Smedt, I.; Lorente, A.; Beirle, S.; van Geffen, J.H.G.M.; Zara, M.; Peters, E.; Van Roozendael, M.; et al. Improving algorithms and uncertainty estimates for satellite NO2 retrievals: Results from the quality assurance for the essential climate variables (QA4ECV) project. Atmos. Meas. Tech. 2018, 11, 6651–6678. [Google Scholar] [CrossRef] [Green Version]
  24. Van Geffen, J.H.G.M.; Boersma, K.F.; Van Roozendael, M.; Hendrick, F.; Mahieu, E.; De Smedt, I.; Sneep, M.; Veefkind, J.P. Improved spectral fitting of nitrogen dioxide from OMI in the 405–465 nm window. Atmos. Meas. Tech. 2015, 8, 1685–1699. [Google Scholar] [CrossRef] [Green Version]
  25. Williams, J.E.; Boersma, K.F.; Le Sager, P.; Verstraeten, W.W. The high-resolution version of TM5-MP for optimized satellite retrievals: Description and validation. Geosci. Model. Dev. 2017, 10, 721–750. [Google Scholar] [CrossRef] [Green Version]
  26. Loyola, D.; Lutz, R.; Argyrouli, A.; Spurr, R. S5P/TROPOMI ATBD Cloud Products. German Aerospace Center 2020. Available online: https://sentinel.esa.int/documents/247904/2476257/Sentinel-5P-TROPOMI-ATBD-Clouds (accessed on 3 February 2021).
  27. Gelaro, R.; McCarty, W.; Suárez, M.J.; Todling, R.; Molod, A.; Takacs, L.; Randles, C.; Darmenov, A.; Bosilovich, M.G.; Reichle, R.; et al. The Modern-Era Retrospective Analysis for Research and Applications, Version 2 (MERRA-2). J. Clim. 2017, 30, 5419–5454. [Google Scholar] [CrossRef]
  28. Randles, C.; Da Silva, A.M.; Buchard, V.; Colarco, P.R.; Darmenov, A.; Govindaraju, R.; Smirnov, A.; Holben, B.; Ferrare, R.; Hair, J.; et al. The MERRA-2 Aerosol Reanalysis, 1980 Onward. Part I: System Description and Data Assimilation Evaluation. J. Clim. 2017, 30, 6823–6850. [Google Scholar] [CrossRef]
  29. Levy, R.C.; Remer, L.A.; Dubovik, O. Global aerosol optical properties and application to Moderate Resolution Imaging Spectroradiometer aerosol retrieval over land. J. Geophys. Res. Space Phys. 2007, 112, D13210. [Google Scholar] [CrossRef] [Green Version]
  30. Stein, A.F.; Draxler, R.R.; Rolph, G.D.; Stunder, B.J.B.; Cohen, M.; Ngan, F. NOAA’s HYSPLIT Atmos. Transport and Dispersion Modeling System. Bull. Am. Meteorol. Soc. 2015, 96, 2059–2077. [Google Scholar] [CrossRef]
  31. Goulden, C.H. Methods of Statistical Analysis, 2nd ed.; Wiley and Sons: New York, NY, USA, 1956; pp. 50–55. [Google Scholar]
  32. Van Geffen, J.; Eskes, H.J.; Boersma, K.F.; Maasakkers, J.D.; Veefkind, J.P. TROPOMI ATBD of the Total and Tropospheric NO2 Data Products. Royal Netherlands Meteorological Institute, 1.4. Available online: https://sentinel.esa.int/documents/247904/2476257/Sentinel-5P-TROPOMI-ATBD-NO2-data-products (accessed on 20 January 2021).
  33. Compernolle, S.; Verhoelst, T.; Pinardi, G.; Granville, J.; Hubert, D.; Keppens, A.; Niemeijer, S.; Rino, B.; Bais, A.; Beirle, S.; et al. Validation of Aura-OMI QA4ECV NO2 climate data records with ground-based DOAS networks: The role of measurement and comparison uncertainties. Atmos. Chem. Phys. Discuss. 2020, 20, 8017–8045. [Google Scholar] [CrossRef]
  34. Zawadzka, O.; Markowicz, K.; Pietruczuk, A.; Zielinski, T.; Jaroslawski, J. Impact of urban pollution emitted in Warsaw on aerosol properties. Atmos. Environ. 2012, 69, 15–28. [Google Scholar] [CrossRef]
  35. Markowicz, K.M.; Zawadzka, O.; Posyniak, M.; Uscka-Kowalkowska, J. Long-Term Variability of Aerosol Optical Depth in the Tatra Mountain Region of Central Europe. J. Geophys. Res. Atmos. 2019, 124, 3464–3475. [Google Scholar] [CrossRef]
  36. Szczepanik, D.; Markowicz, K. The relation between columnar and surface aerosol optical properties in a background environment. Atmos. Pollut. Res. 2018, 9, 246–256. [Google Scholar] [CrossRef]
  37. Van Donkelaar, A.; Martin, R.; Park, R. Estimating ground-level PM2.5 using aerosol optical depth determined from satellite remote sensing. J. Geophys. Res. Space Phys. 2006, 111. [Google Scholar] [CrossRef]
  38. Liu, Y.; Paciorek, C.; Koutrakis, P. Estimating Regional Spatial and Temporal Variability of PM2.5 Concentrations Using Satellite Data, Meteorology, and Land Use Information. Environ. Health Perspect. 2009, 117, 886–892. [Google Scholar] [CrossRef] [Green Version]
  39. Xie, Y.; Wang, Y.; Zhang, K.; Dong, W.; Lv, B.; Bai, Y. Daily Estimation of Ground-Level PM2.5 Concentrations over Beijing Using 3 km Resolution MODIS AOD. Environ. Sci. Technol. 2015, 49, 12280–12288. [Google Scholar] [CrossRef] [Green Version]
  40. Guo, J.; Xia, F.; Zhang, Y.; Liu, H.; Li, J.; Lou, M.; He, J.; Yan, Y.; Wang, F.; Min, M.; et al. Impact of diurnal variability and meteorological factors on the PM2.5—AOD Relationship: Implications for PM2.5 Remote Sensing. Environ. Pollut. 2017, 221, 94–104. [Google Scholar] [CrossRef] [PubMed] [Green Version]
  41. Warsaw Municipal Roads Management. Little Traffic on the Roads. Available online: https://zdm.waw.pl/aktualnosci/maly-ruch-na-drogach/ (accessed on 2 March 2021). (In Polish).
  42. Piccoli, A.; Agresti, V.; Balzarini, A.; Bedogni, M.; Bonanno, R.; Collino, E.; Colzi, F.; Lacavalla, M.; Lanzani, G.; Pirovano, G.; et al. Modeling the Effect of COVID-19 Lockdown on Mobility and NO2 Concentration in the Lombardy Region. Atmosphere 2020, 11, 1319. [Google Scholar] [CrossRef]
  43. Khuzestani, R.B.; Schauer, J.J.; Wei, Y.; Zhang, L.; Cai, T.; Zhang, Y.; Zhang, Y. Quantification of the sources of long-range transport of PM2.5 pollution in the Ordos region, Inner Mongolia, China. Environ. Pollut. 2017, 229, 1019–1031. [Google Scholar] [CrossRef] [PubMed]
  44. Gao, M.; Beig, G.; Song, S.; Zhang, H.; Hu, J.; Ying, Q.; Liang, F.; Liu, Y.; Wang, H.; Lu, X.; et al. The impact of power generation emissions on ambient PM2.5 pollution and human health in China and India. Environ. Int. 2018, 121, 250–259. [Google Scholar] [CrossRef] [PubMed]
  45. General Director for National Roads and Motorways. Traffic on National Roads During the Epidemic. Data Analysis from the Beginning of the Epidemic. Available online: https://www.gddkia.gov.pl/pl/a/37675/Ruch-na-drogach-krajowych-w-czasie-epidemii-Analiza-danych-od-poczatku-epidemii (accessed on 15 February 2021). (In Polish)
  46. General Director for National Roads and Motorways. Traffic on National Roads During the Epidemic. A Summary for May. Available online: https://www.gddkia.gov.pl/pl/a/37842/Ruch-na-drogach-krajowych-w-czasie-epidemii-Publikujemy-podsumowanie-za-maj (accessed on 1 April 2021). (In Polish)
  47. General Director for National Roads and Motorways. Traffic on National Roads during the Epidemic. The Turn of June and July. Available online: https://www.gddkia.gov.pl/pl/a/38380/Ruch-na-drogach-krajowych-w-czasie-epidemii-Przelom-czerwca-i-lipca (accessed on 1 April 2021). (In Polish)
  48. Chu, B.; Zhang, S.; Liu, J.; Ma, Q.; He, H. Significant concurrent decrease in PM2.5 and NO2 concentrations in China during COVID-19 epidemic. J. Environ. Sci. 2020, 99, 346–353. [Google Scholar] [CrossRef] [PubMed]
  49. He, C.; Hong, S.; Zhang, L.; Mu, H.; Xin, A.; Zhou, Y.; Liu, J.; Liu, N.; Su, Y.; Tian, Y.; et al. Global, continental, and national variation in PM2.5, O3, and NO2 concentrations during the early 2020 COVID-19 lockdown. Atmos. Pollut. Res. 2021, 12, 136–145. [Google Scholar] [CrossRef] [PubMed]
  50. Van Heerwaarden, C.C.; Mol, W.B.; Veerman, M.A.; Benedict, I.; Heusinkveld, B.G.; Knap, W.H.; Kazadzis, S.; Kouremeti, N.; Fiedler, S. Record high solar irradiance in Western Europe during first COVID-19 lockdown largely due to unusual weather. Commun. Earth Environ. 2021, 2, 1–7. [Google Scholar] [CrossRef]
  51. Collivignarelli, M.C.; De Rose, C.; Abbà, A.; Baldi, M.; Bertanza, G.; Pedrazzani, R.; Sorlini, S.; Miino, M.C. Analysis of lockdown for CoViD-19 impact on NO2 in London, Milan and Paris: What lesson can be learnt? Process. Saf. Environ. Prot. 2020, 146, 952–960. [Google Scholar] [CrossRef]
  52. Baldasano, J.M. COVID-19 lockdown effects on air quality by NO2 in the cities of Barcelona and Madrid (Spain). Sci. Total Environ. 2020, 741, 140353. [Google Scholar] [CrossRef]
  53. Solberg, S.; Walker, S.-E.; Schneider, P.; Guerreiro, C. Quantifying the Impact of the Covid-19 Lockdown Measures on Nitrogen Dioxide Levels throughout Europe. Atmosphere 2021, 12, 131. [Google Scholar] [CrossRef]
Figure 1. Location of GIOS stations measuring NO2, PM2.5 and the AERONET station. Red squares correspond to urban stations where PM2.5 and NO2 are measured, while green squares correspond to non-built-up stations. Red triangles correspond to PM2.5 urban stations. Red circles to NO2 urban stations, while green circles are for NO2 non-built-up stations. A green cross gives the location of the AERONET background station in Strzyzow where aerosol optical properties were measured.
Remotesensing 13 03784 g001
Figure 2. Relative frequency of 96 h back-trajectories at 500 m over Warsaw obtained from HYSPLIT simulation for (a) 2019, (b) 2020, and (c) for 2010–2019. Different colors show the direction of air mass transport.
Remotesensing 13 03784 g002
Figure 3. Frequency of surface inversions (temperature gradient greater than 3 °C/100 m) obtained from radiosonde launches at Legionowo weather station 25 km from Warsaw. The blue, red, and orange bars correspond to the springs of 2019, 2020, and to the reference period 2010–2019.
Remotesensing 13 03784 g003
Figure 4. Temporal variability of 5-day running means of total AOD at 550 nm over Poland obtained from MERRA-2 reanalysis. Blue, green and red lines show data for 2019, 2020 and 2010–2019, respectively. The pink shadow indicates standard deviations of AOD for the 2010–2019 period.
Remotesensing 13 03784 g004
Figure 5. Temporal variability of 5-day running means (a) AOD at 500 nm obtained from the CIMEL sun photometer; (b) equivalent black carbon concentration (ng/m3) from the AE-31 aethalometer; and (c) the aerosol scattering coefficient at 525 nm from the Aurora 4000 nephelometer, all at the Strzyzow station. Blue, green, and red lines correspond to 2019, 2020, and 2010–2019. The pink shadow indicates standard deviations for the 2010–2019 period.
Remotesensing 13 03784 g005
Figure 6. Mean decadal ground-based PM2.5 concentrations (µg/m3) from GIOS air quality stations in Poland in 2019 (blue line), 2020 (green line) and the multi-annual average (dashed red line). Standard deviations corresponding to multi-annual averages are marked in pink. Panel (a) depicts the average from 15 urban stations with respect to a 10-year multi-annual mean. Panel (b) depicts a single non-built-up station with respect to an 8-year multi-annual mean.
Remotesensing 13 03784 g006
Figure 7. Mean decadal ground-based PM2.5 concentrations (µg/m3) from two GIOS air quality stations located in Warsaw in 2019 (blue line), 2020 (green line) and the 10-year multi-annual averages (dashed red line). Standard deviations corresponding to multi-annual averages are marked in pink.
Remotesensing 13 03784 g007
Figure 8. March to June mean ground-based PM2.5 concentrations (µg/m3) (black line: (ac)), linear regression (orange line: (a,c)) and anomalies (red bars: (ac)) with respect to trends over: (a) urban areas (b) non-built-up areas; (c) Warsaw. For statistically insignificant trends, anomalies with respect to averages were calculated (purple line: (b)).
Remotesensing 13 03784 g008
Figure 9. Mean decadal ground-based NO2 concentrations (µg/m3) from GIOS air quality stations in Poland in 2019 (blue line), 2020 (green line), and the 10-year multi-annual average (dashed red line). Standard deviations corresponding to multi-annual averages are marked in pink. Panel (a) depicts the average from all 78 stations in Poland; panel (b) depicts the average from 68 urban stations; panel (c) depicts the average from 10 non-built-up stations.
Remotesensing 13 03784 g009
Figure 10. Mean decadal ground-based NO2.5 concentrations (µg/m3) from three GIOS air quality stations located in Warsaw in 2019 (blue line), 2020 (green line) and the 10-year multi-annual average (dashed red line). Standard deviations corresponding to multi-annual averages are marked in pink.
Remotesensing 13 03784 g010
Figure 11. Mean ground-based NO2 concentrations (µg/m3) every year (black line: (ad)), trends (orange line: (a,b)) and anomalies (red bars: (ad)) with respect to trends across Poland (a); urban areas (b); non-built-up areas (c); and Warsaw (d). For statistically insignificant trends, anomalies were calculated with respect to averages (purple line: (c,d)).
Remotesensing 13 03784 g011
Figure 12. Decade variability of median tropospheric NO2 column number density (molec/cm2·1015) over Poland (a); urban areas in Poland (b); and non-built-up areas in Poland (c); in 2020 (green line) and 2019 (blue line). The X axis corresponds to a decade of the year.
Remotesensing 13 03784 g012
Figure 13. NO2 TVCD (molec/cm2) over Poland during 11th decade of the year: 2019 (a) and 2020 (b). Changes in NO2 TVCD (%) over Poland during the 11th decade (c) (difference of NO2 TVCD during the 11th decade in 2020 (b) with respect to 2019 (a).
Remotesensing 13 03784 g013
Figure 14. Decade variability of median NO2 TVCD (molec/cm2·1015) in Warsaw in 2020 (green) and 2019 (blue).
Remotesensing 13 03784 g014
Table 1. Mean air temperature anomalies in °C (compared to the 1991–2020 reference period) by month in Poland. Data source: https://meteomodel.pl/ (accessed on 10 April 2021).
YearsIIIIIIIVVVIVIIVIIIIXXXIXIIAnnual
20190.13.72.91.6−1.15.30.22.00.92.02.93.62.0
20204.04.81.70.5−2.31.9−0.12.01.82.02.42.41.8
Table 2. Statistics of AOD components (at 550 nm) obtained from MERRA-2 reanalysis between March and June over Poland.
AOD StatisticsSulphatesMineral DustOrganic CarbonBlack CarbonSea SaltTotal AOD
2010–2019 mean0.1110.0360.0280.0110.0080.194
2020 mean0.0910.0300.0240.0100.0090.165
2010–2019 to 2020 relative change (%)−18−16−15−8+1815
Publisher’s Note: MDPI stays neutral with regard to jurisdictional claims in published maps and institutional affiliations.