Assessing Drought Vegetation Dynamics in Semiarid Grass- and Shrubland Using MESMA
Abstract
:1. Introduction
2. Materials and Methods
2.1. Study Site
2.2. Data
2.2.1. Field Spectroscopy
2.2.2. Imagery Collection and Pre-Processing
2.2.3. Vegetation Community Map
2.3. Analysis
2.3.1. Spectral Library Creation and Optimization
2.3.2. Multiple Endmember Spectral Mixture Analysis
2.3.3. Accuracy Assessment
2.3.4. Changes in Fractional Cover by Vegetation Community
3. Results
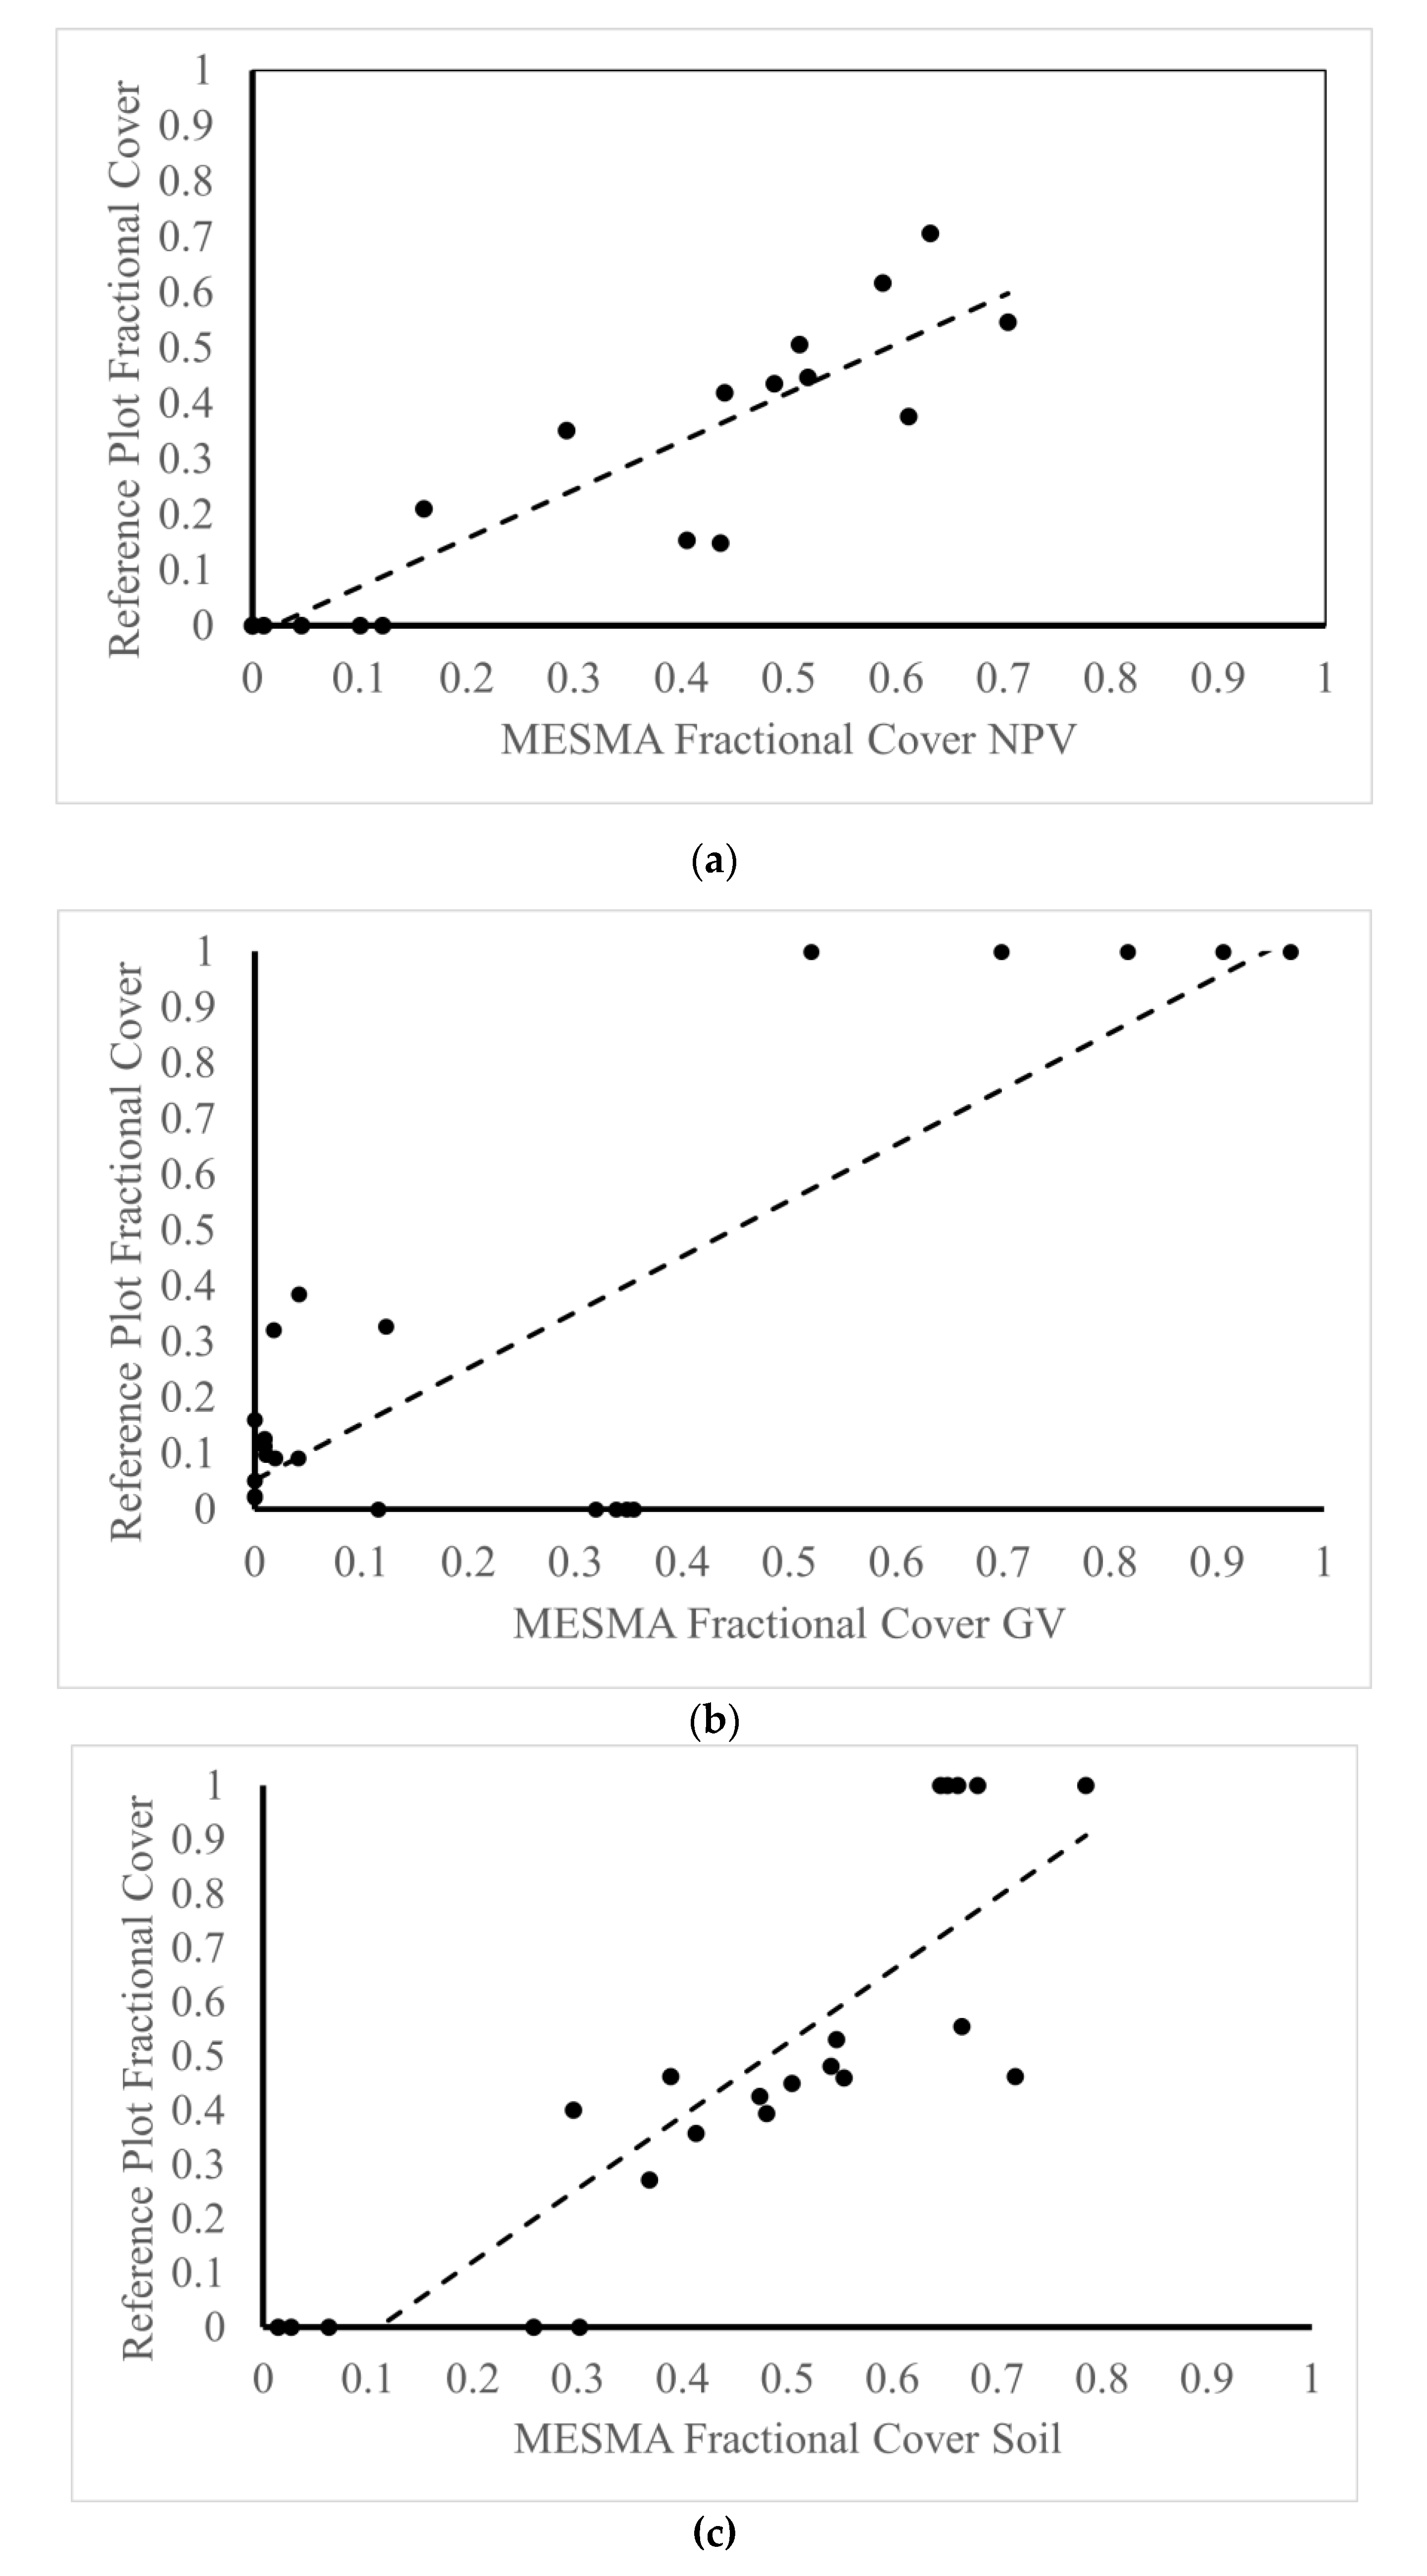
3.1. Accuracy Assessment
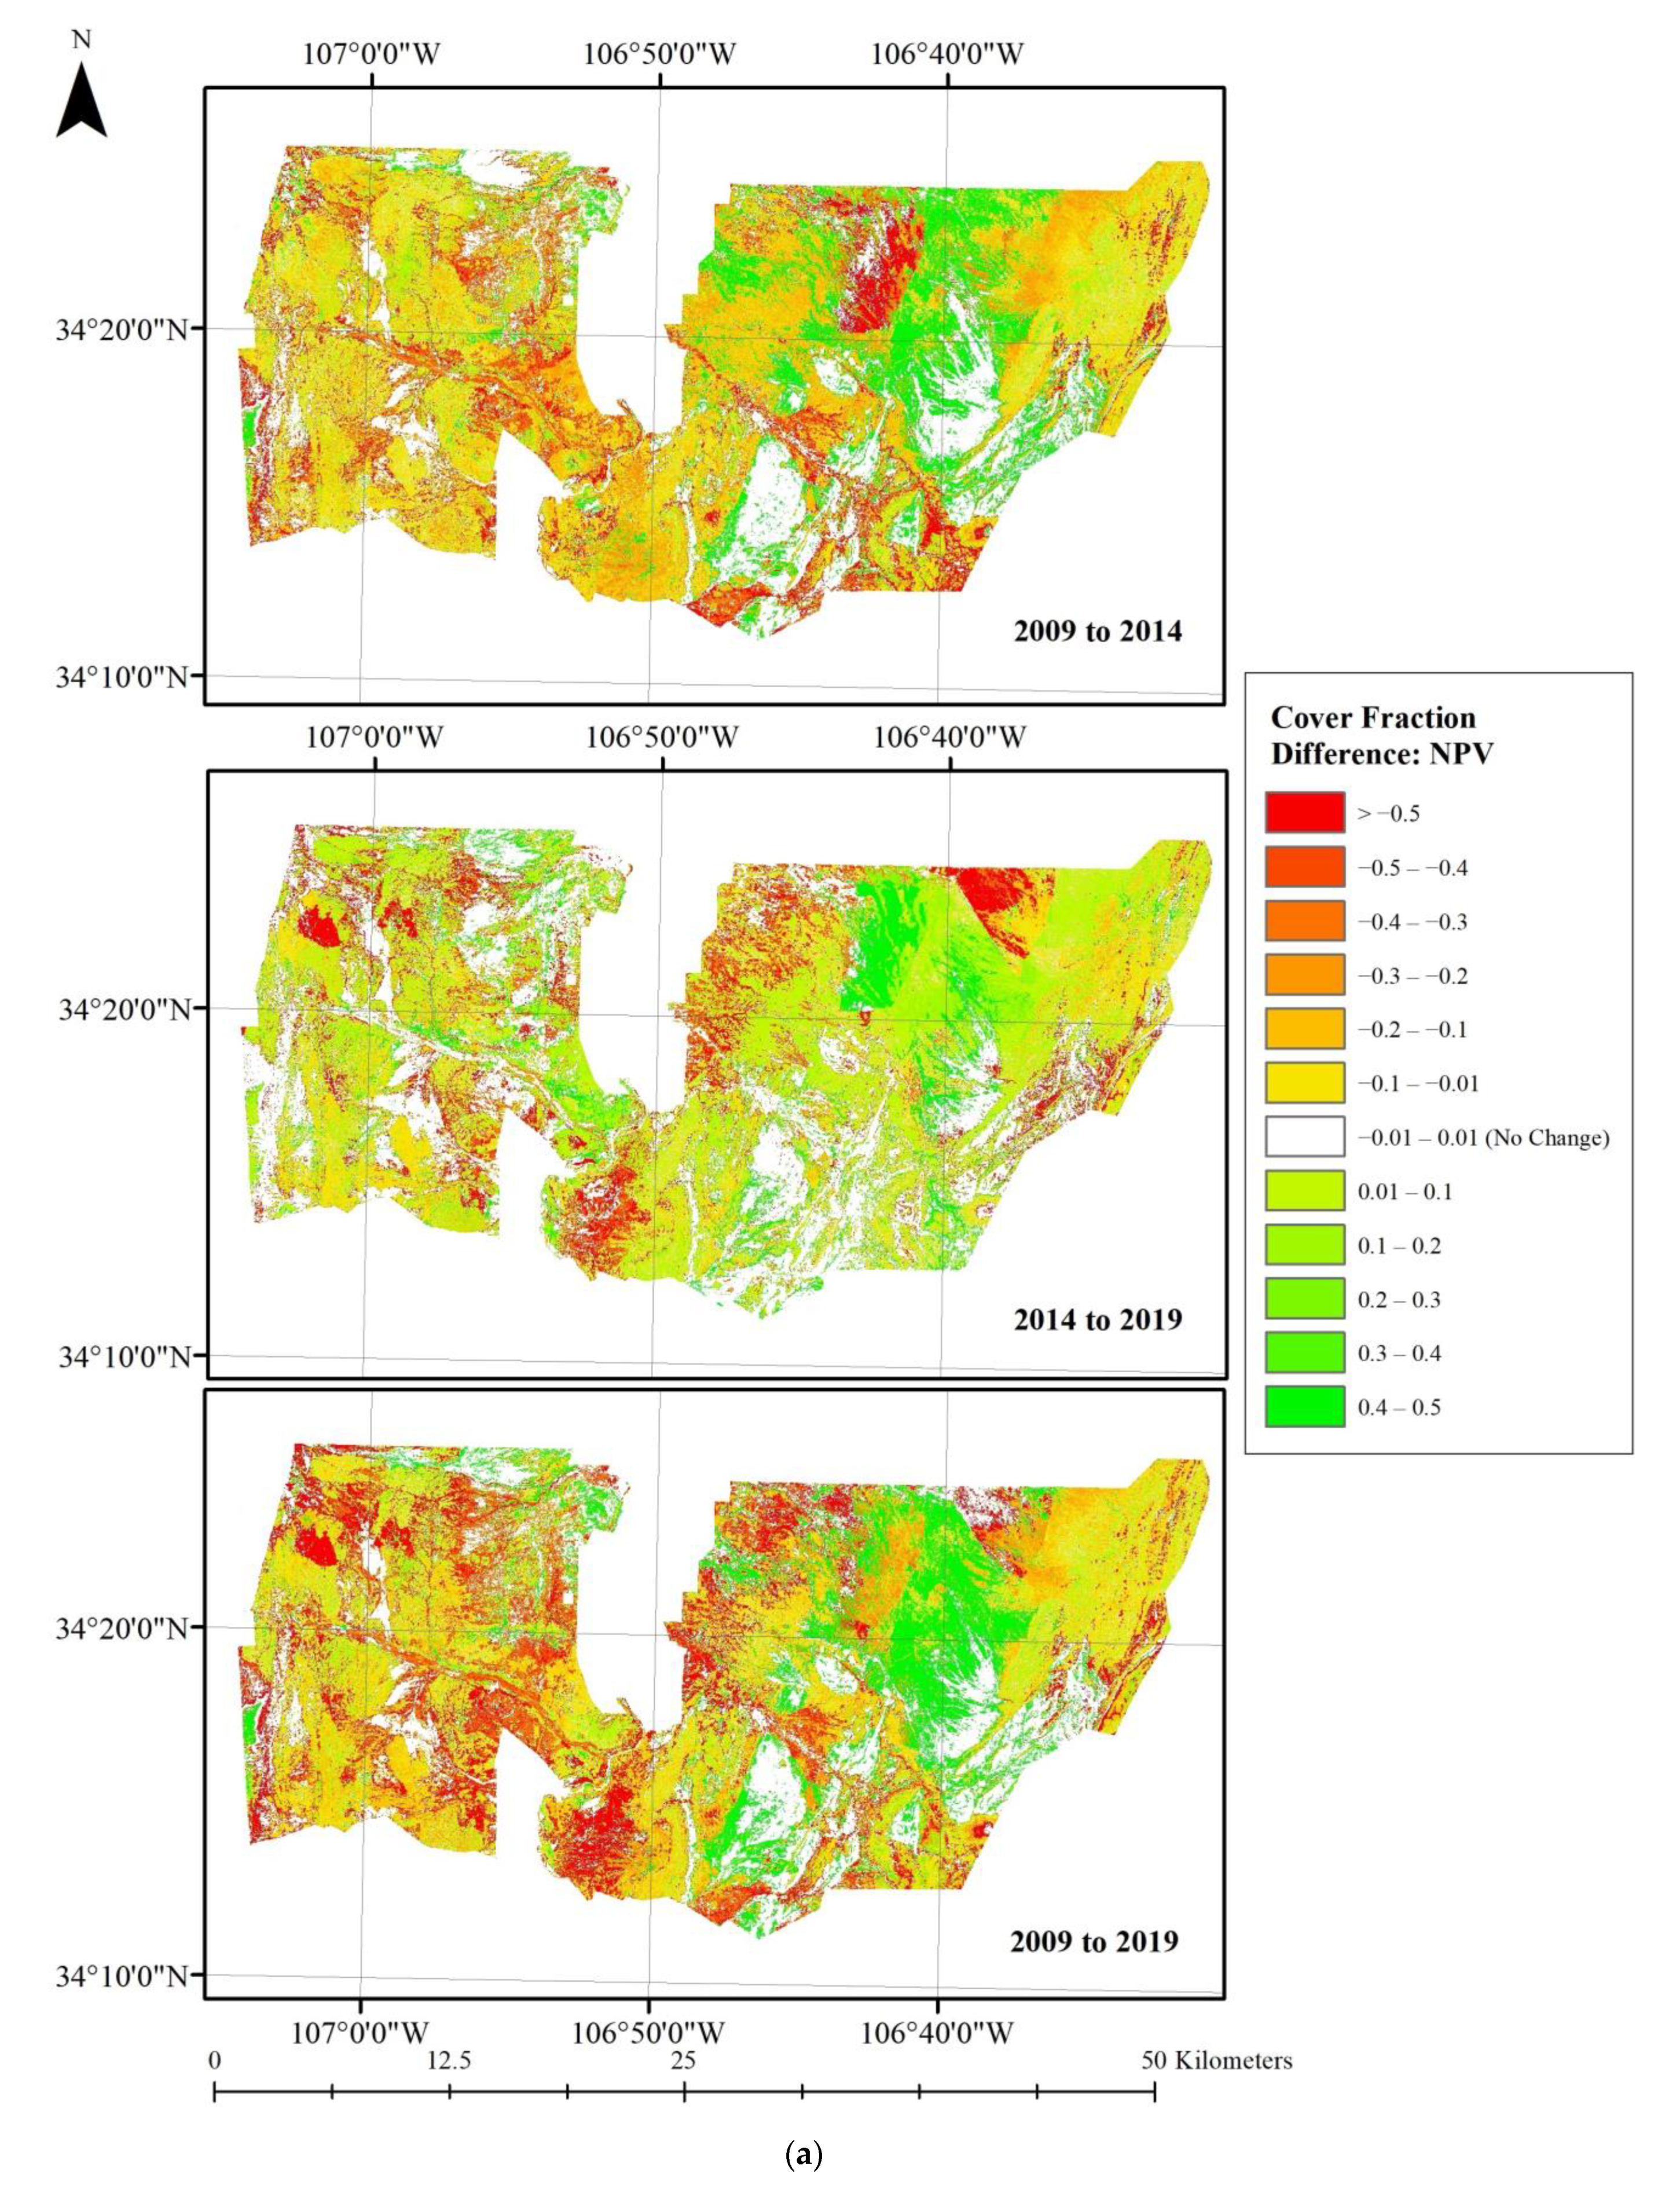
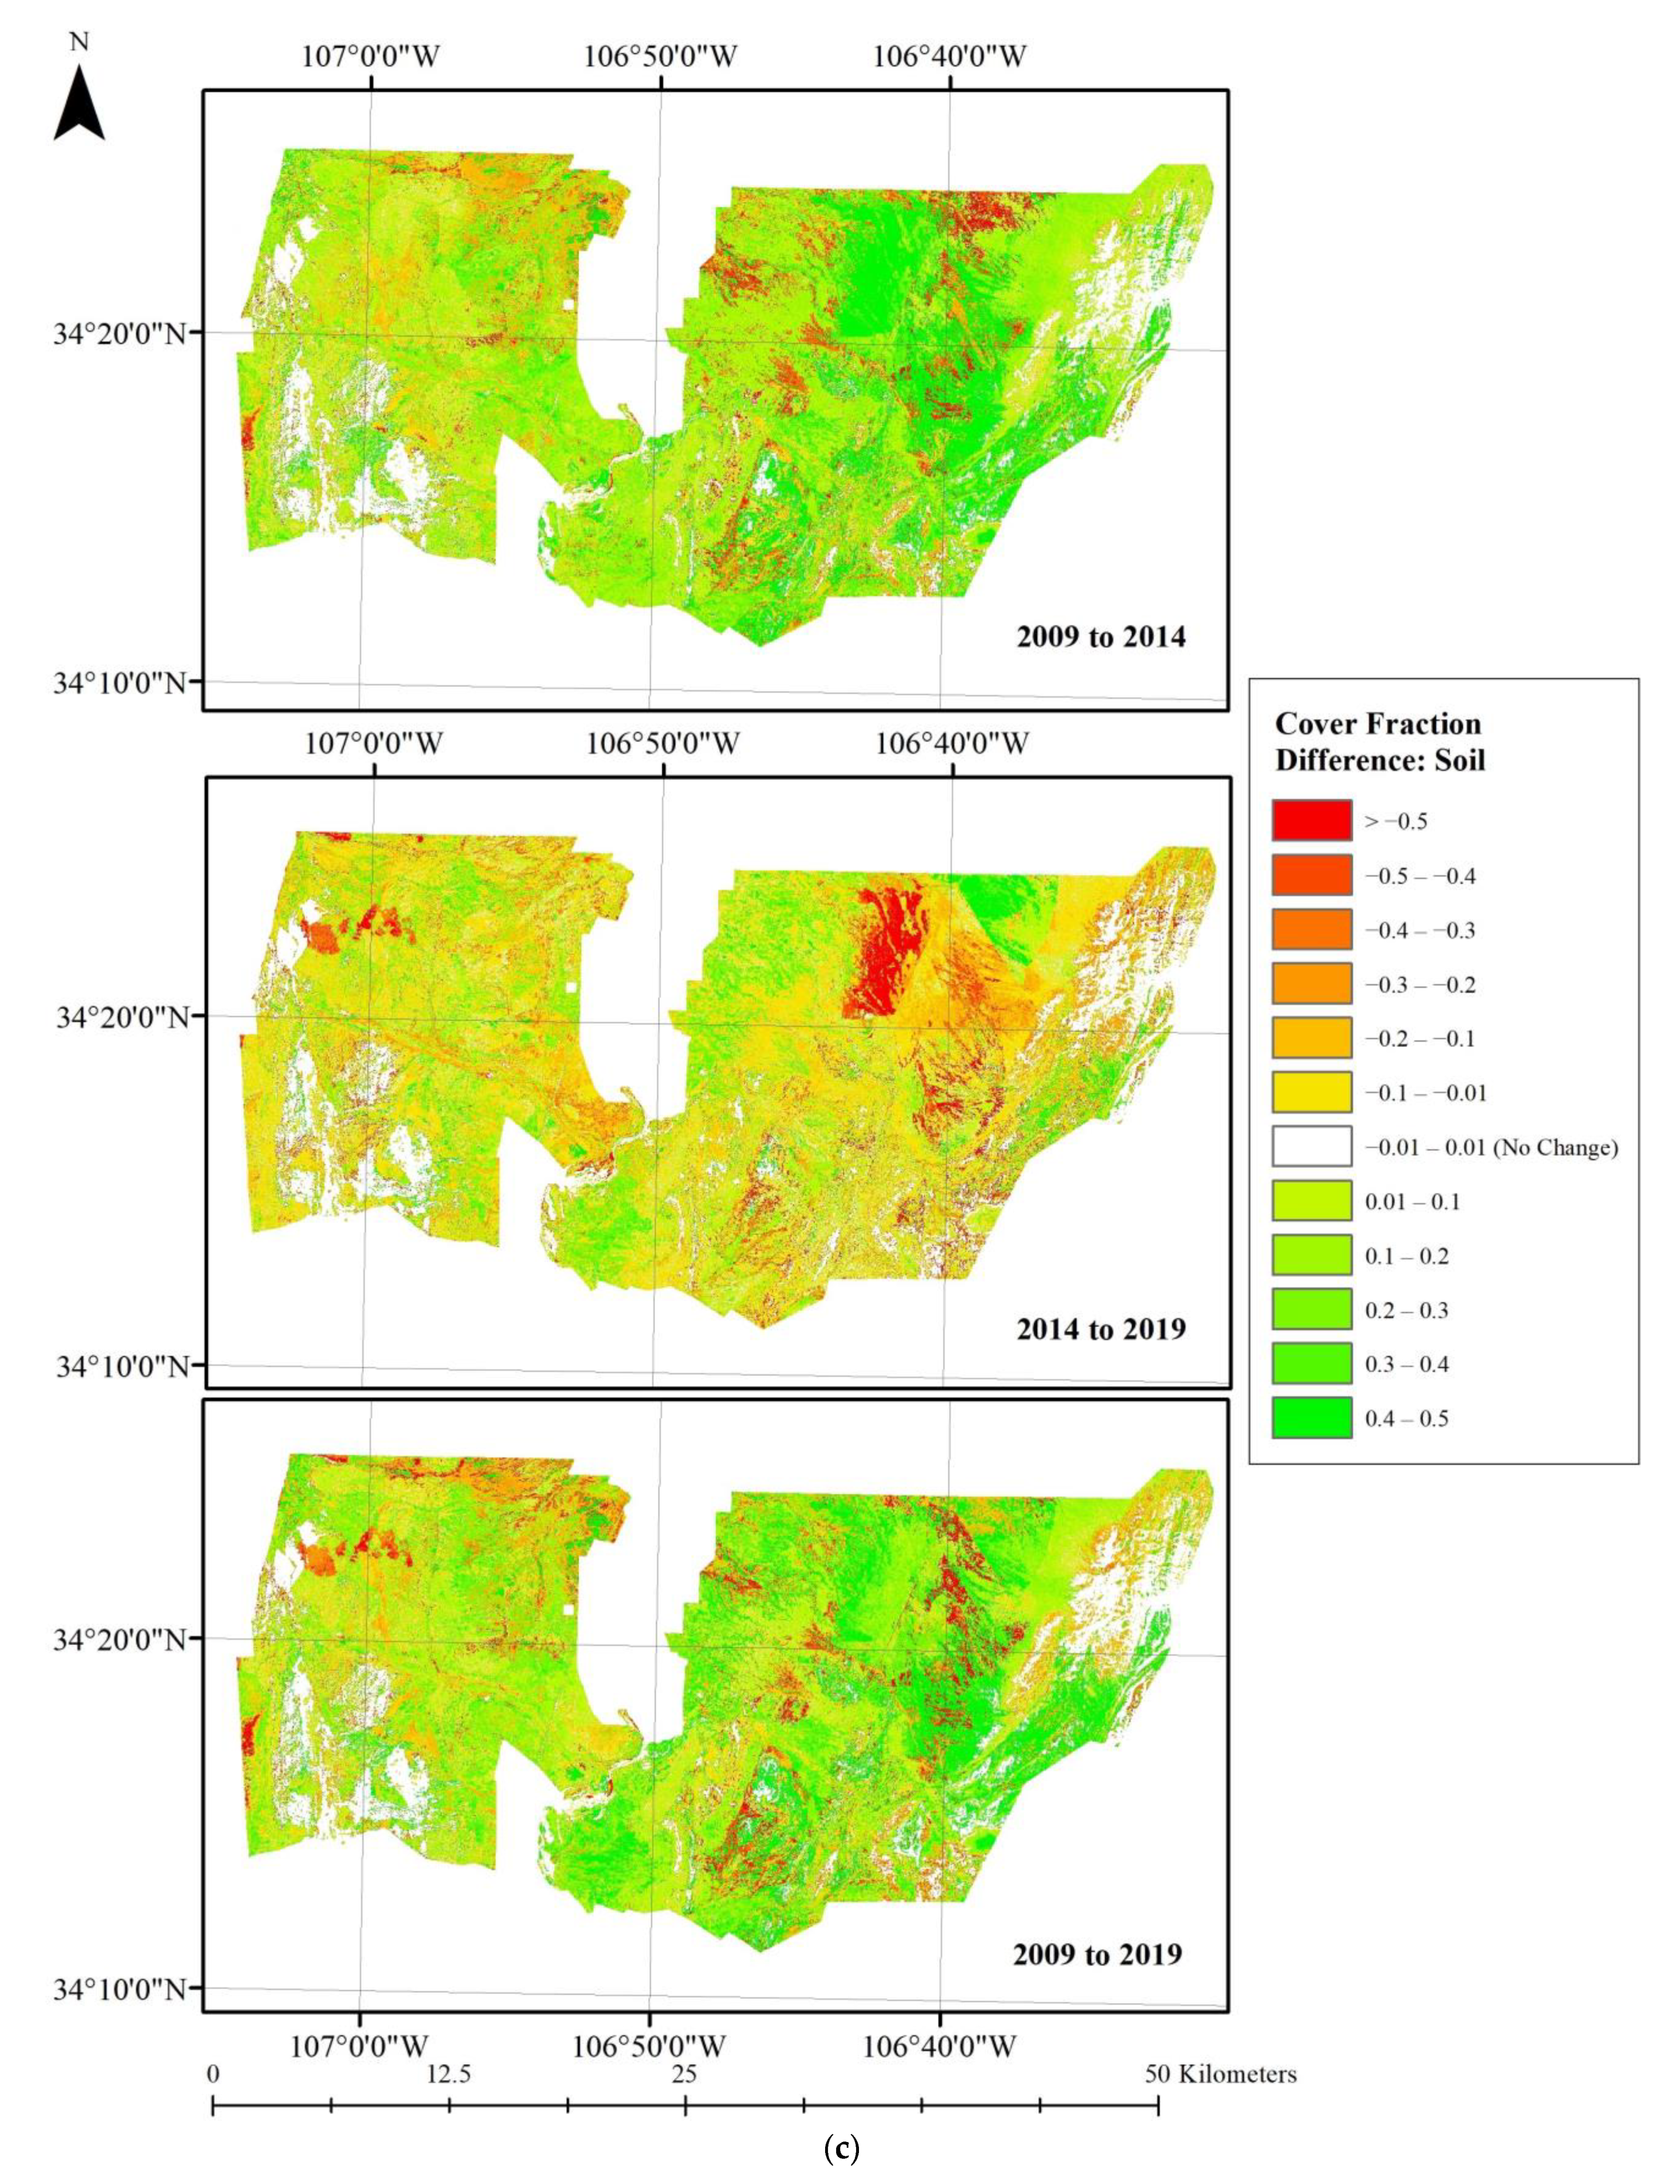
3.2. Changes in Fractional Cover by Vegetation Community
4. Discussion
5. Conclusions
Author Contributions
Funding
Data Availability Statement
Acknowledgments
Conflicts of Interest
Appendix A
| Model ID | Endmember Selection Method | RMSE Threshold | Multifusion Threshold | Stable Zone Unmixing? | Accuracy Assessment Performed? |
|---|---|---|---|---|---|
| 1 | EMC | 0.025 | 0.025 | No | Yes |
| 2 | EMC | 0.007 | 0.025 | No | No, 67% unmodeled |
| 3 | EMC | 0.007 | 0.007 | No | No, 67% unmodeled |
| 4 | EMC | 0.025 | 0.007 | No | Yes |
| 5 | EMC | 0.025 | 0.025 | Yes | Yes |
| 6 | EMC | 0.007 | 0.025 | Yes | No, 47% unmodeled |
| 7 | EMC | 0.007 | 0.007 | Yes | No, 47% unmodeled |
| 8 | EMC | 0.025 | 0.007 | Yes | Yes |
| 9 | inCOB | 0.025 | 0.025 | No | No, 25% unmodeled |
| 10 | inCOB | 0.007 | 0.025 | No | No, 84% unmodeled |
| 11 | inCOB | 0.007 | 0.007 | No | No, 84% unmodeled |
| 12 | inCOB | 0.025 | 0.007 | No | No, 25% unmodeled |
| 13 | inCOB | 0.025 | 0.025 | Yes | No, 25% unmodeled |
| 14 | inCOB | 0.007 | 0.025 | Yes | No, 78% unmodeled |
| 15 | inCOB | 0.007 | 0.007 | Yes | No, 78% unmodeled |
| 16 | inCOB | 0.025 | 0.007 | Yes | No, 25% unmodeled |
| 17 | IES | 0.025 | 0.025 | No | Yes |
| 18 | IES | 0.007 | 0.025 | No | No, 66% unmodeled |
| 19 | IES | 0.007 | 0.007 | No | No, 66% unmodeled |
| 20 | IES | 0.025 | 0.007 | No | Yes |
| 21 | IES | 0.025 | 0.025 | Yes | Yes |
| 22 | IES | 0.007 | 0.025 | Yes | No, 62% unmodeled |
| 23 | IES | 0.007 | 0.007 | Yes | No, 62% unmodeled |
| 24 | IES | 0.025 | 0.007 | Yes | Yes |
| 25 | Reduced IES | 0.025 | 0.025 | No | Yes |
| 26 | Reduced IES | 0.007 | 0.025 | No | No, 78% unmodeled |
| 27 | Reduced IES | 0.007 | 0.007 | No | No, 78% unmodeled |
| 28 | Reduced IES | 0.025 | 0.007 | No | Yes |
| 29 | Reduced IES | 0.025 | 0.025 | Yes | Yes |
| 30 | Reduced IES | 0.007 | 0.025 | Yes | No, 69% unmodeled |
| 31 | Reduced IES | 0.007 | 0.007 | Yes | No, 69% unmodeled |
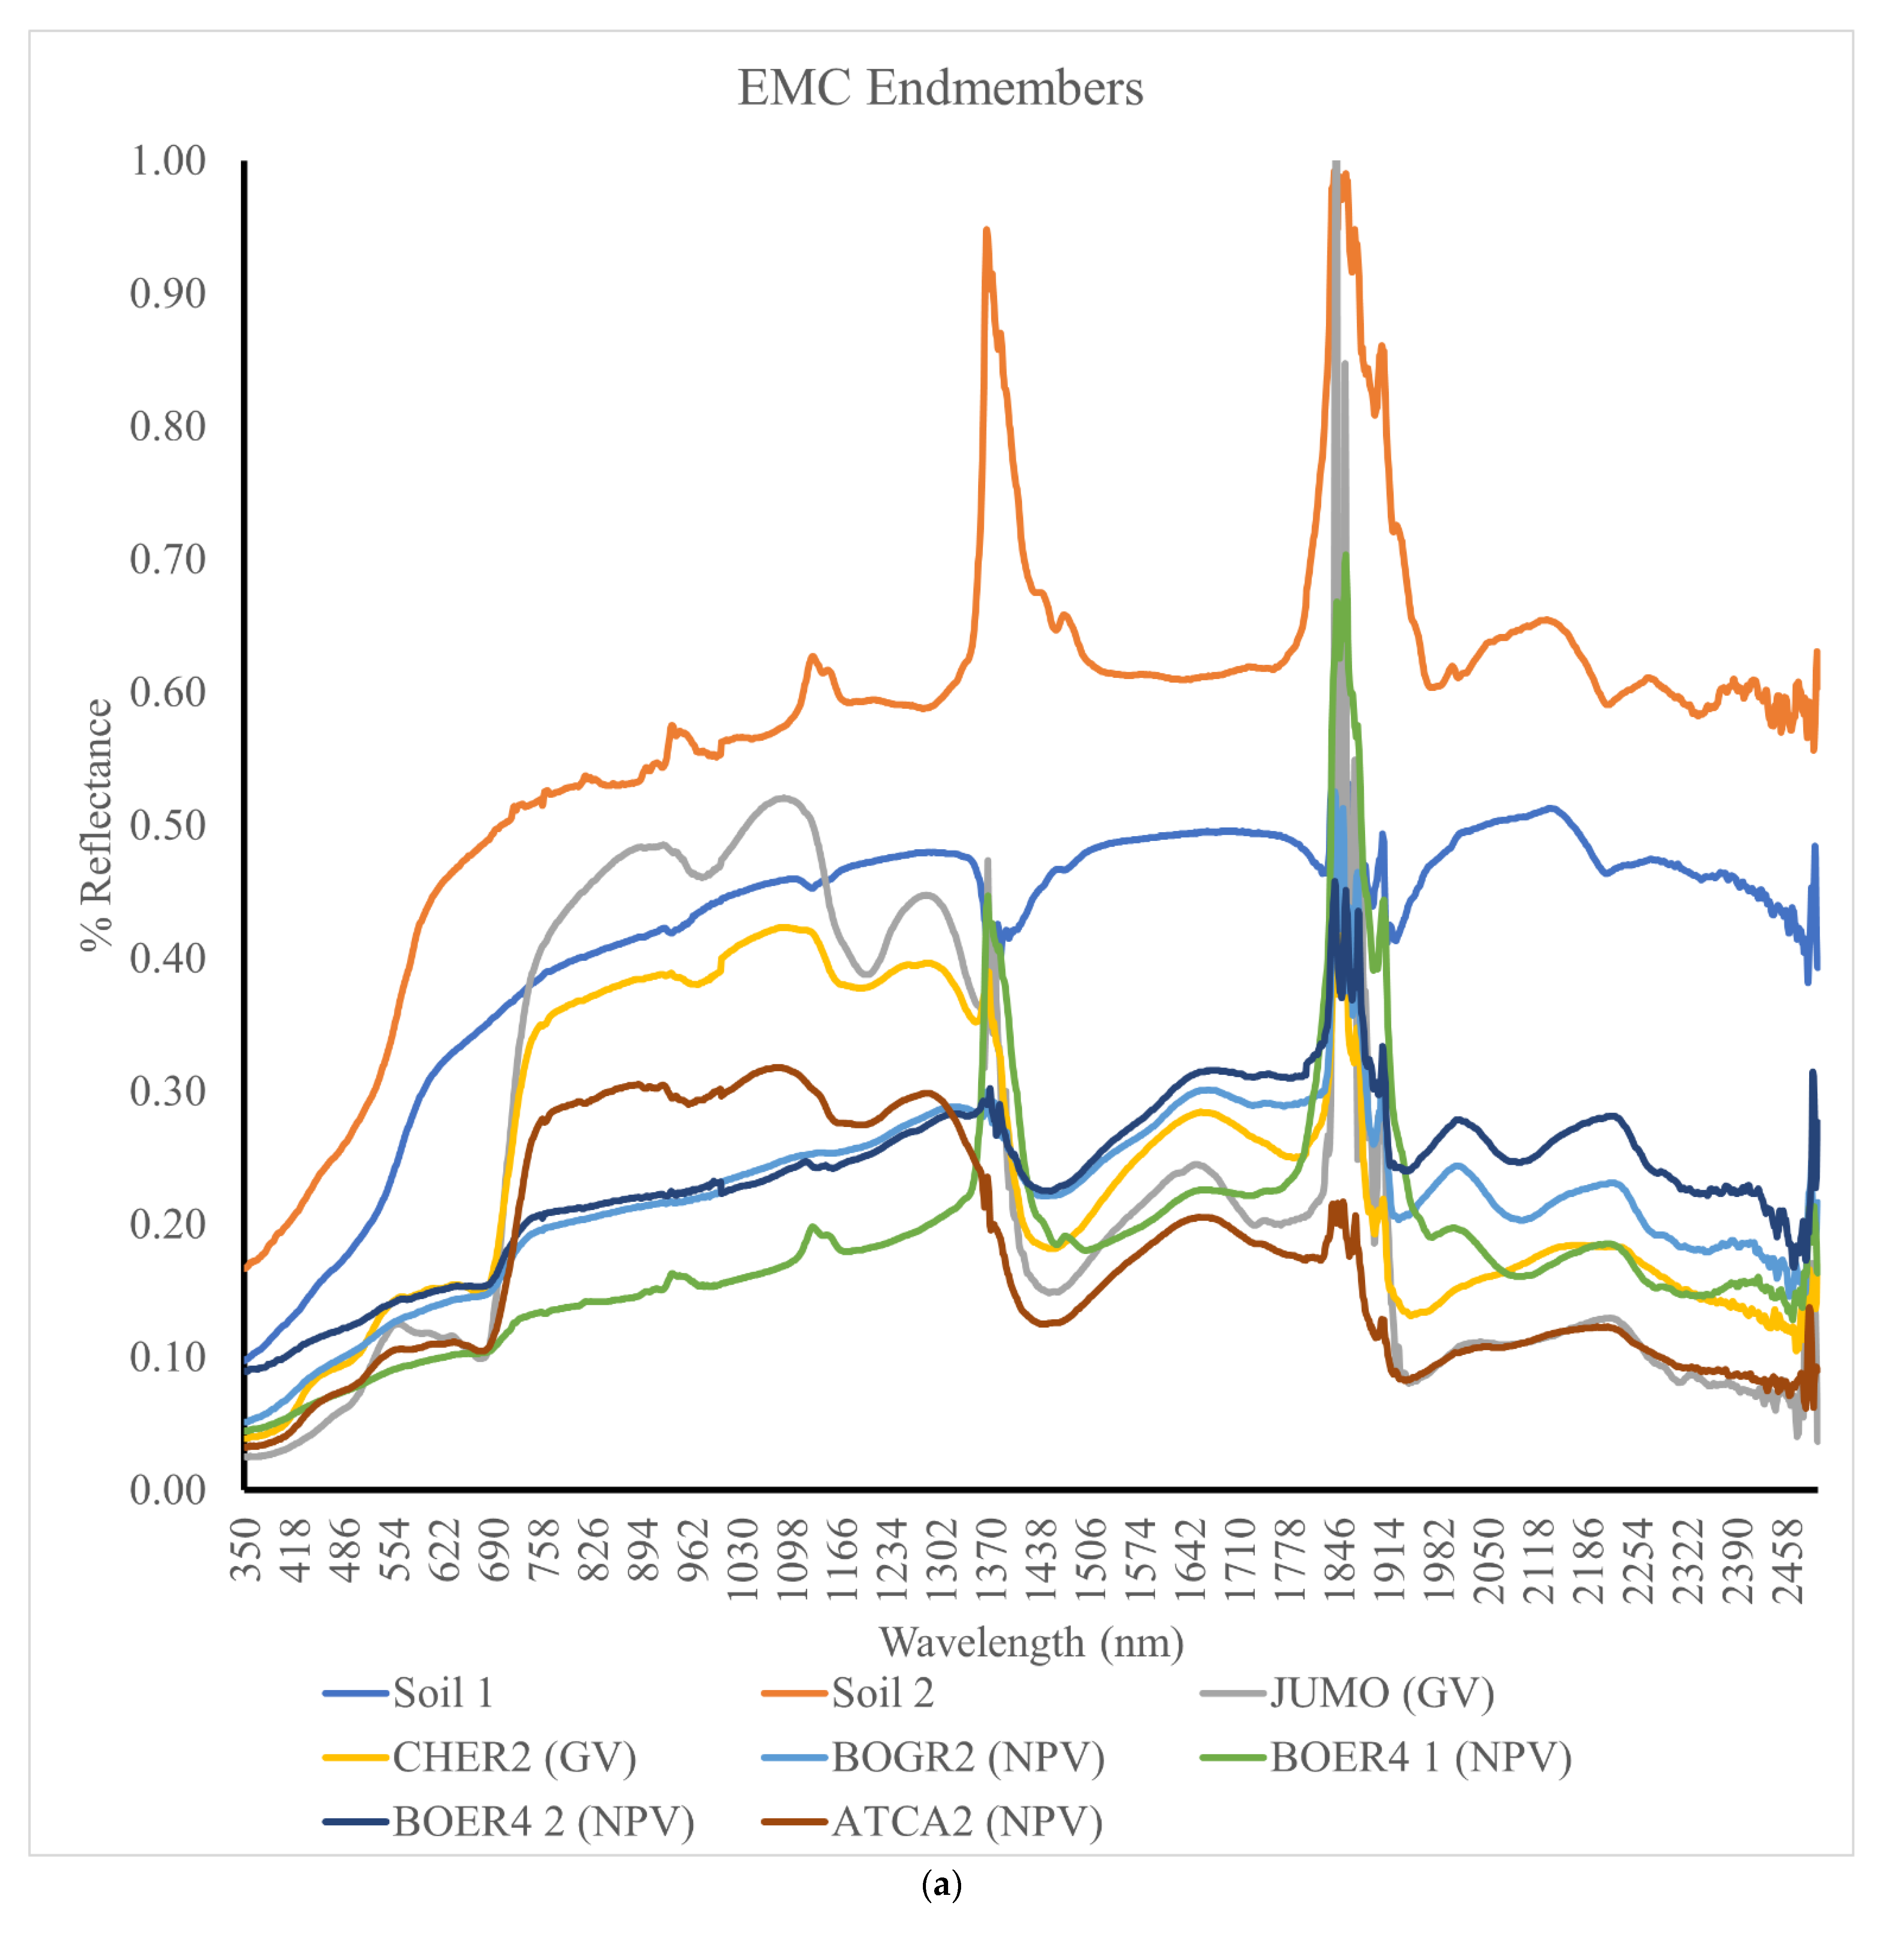
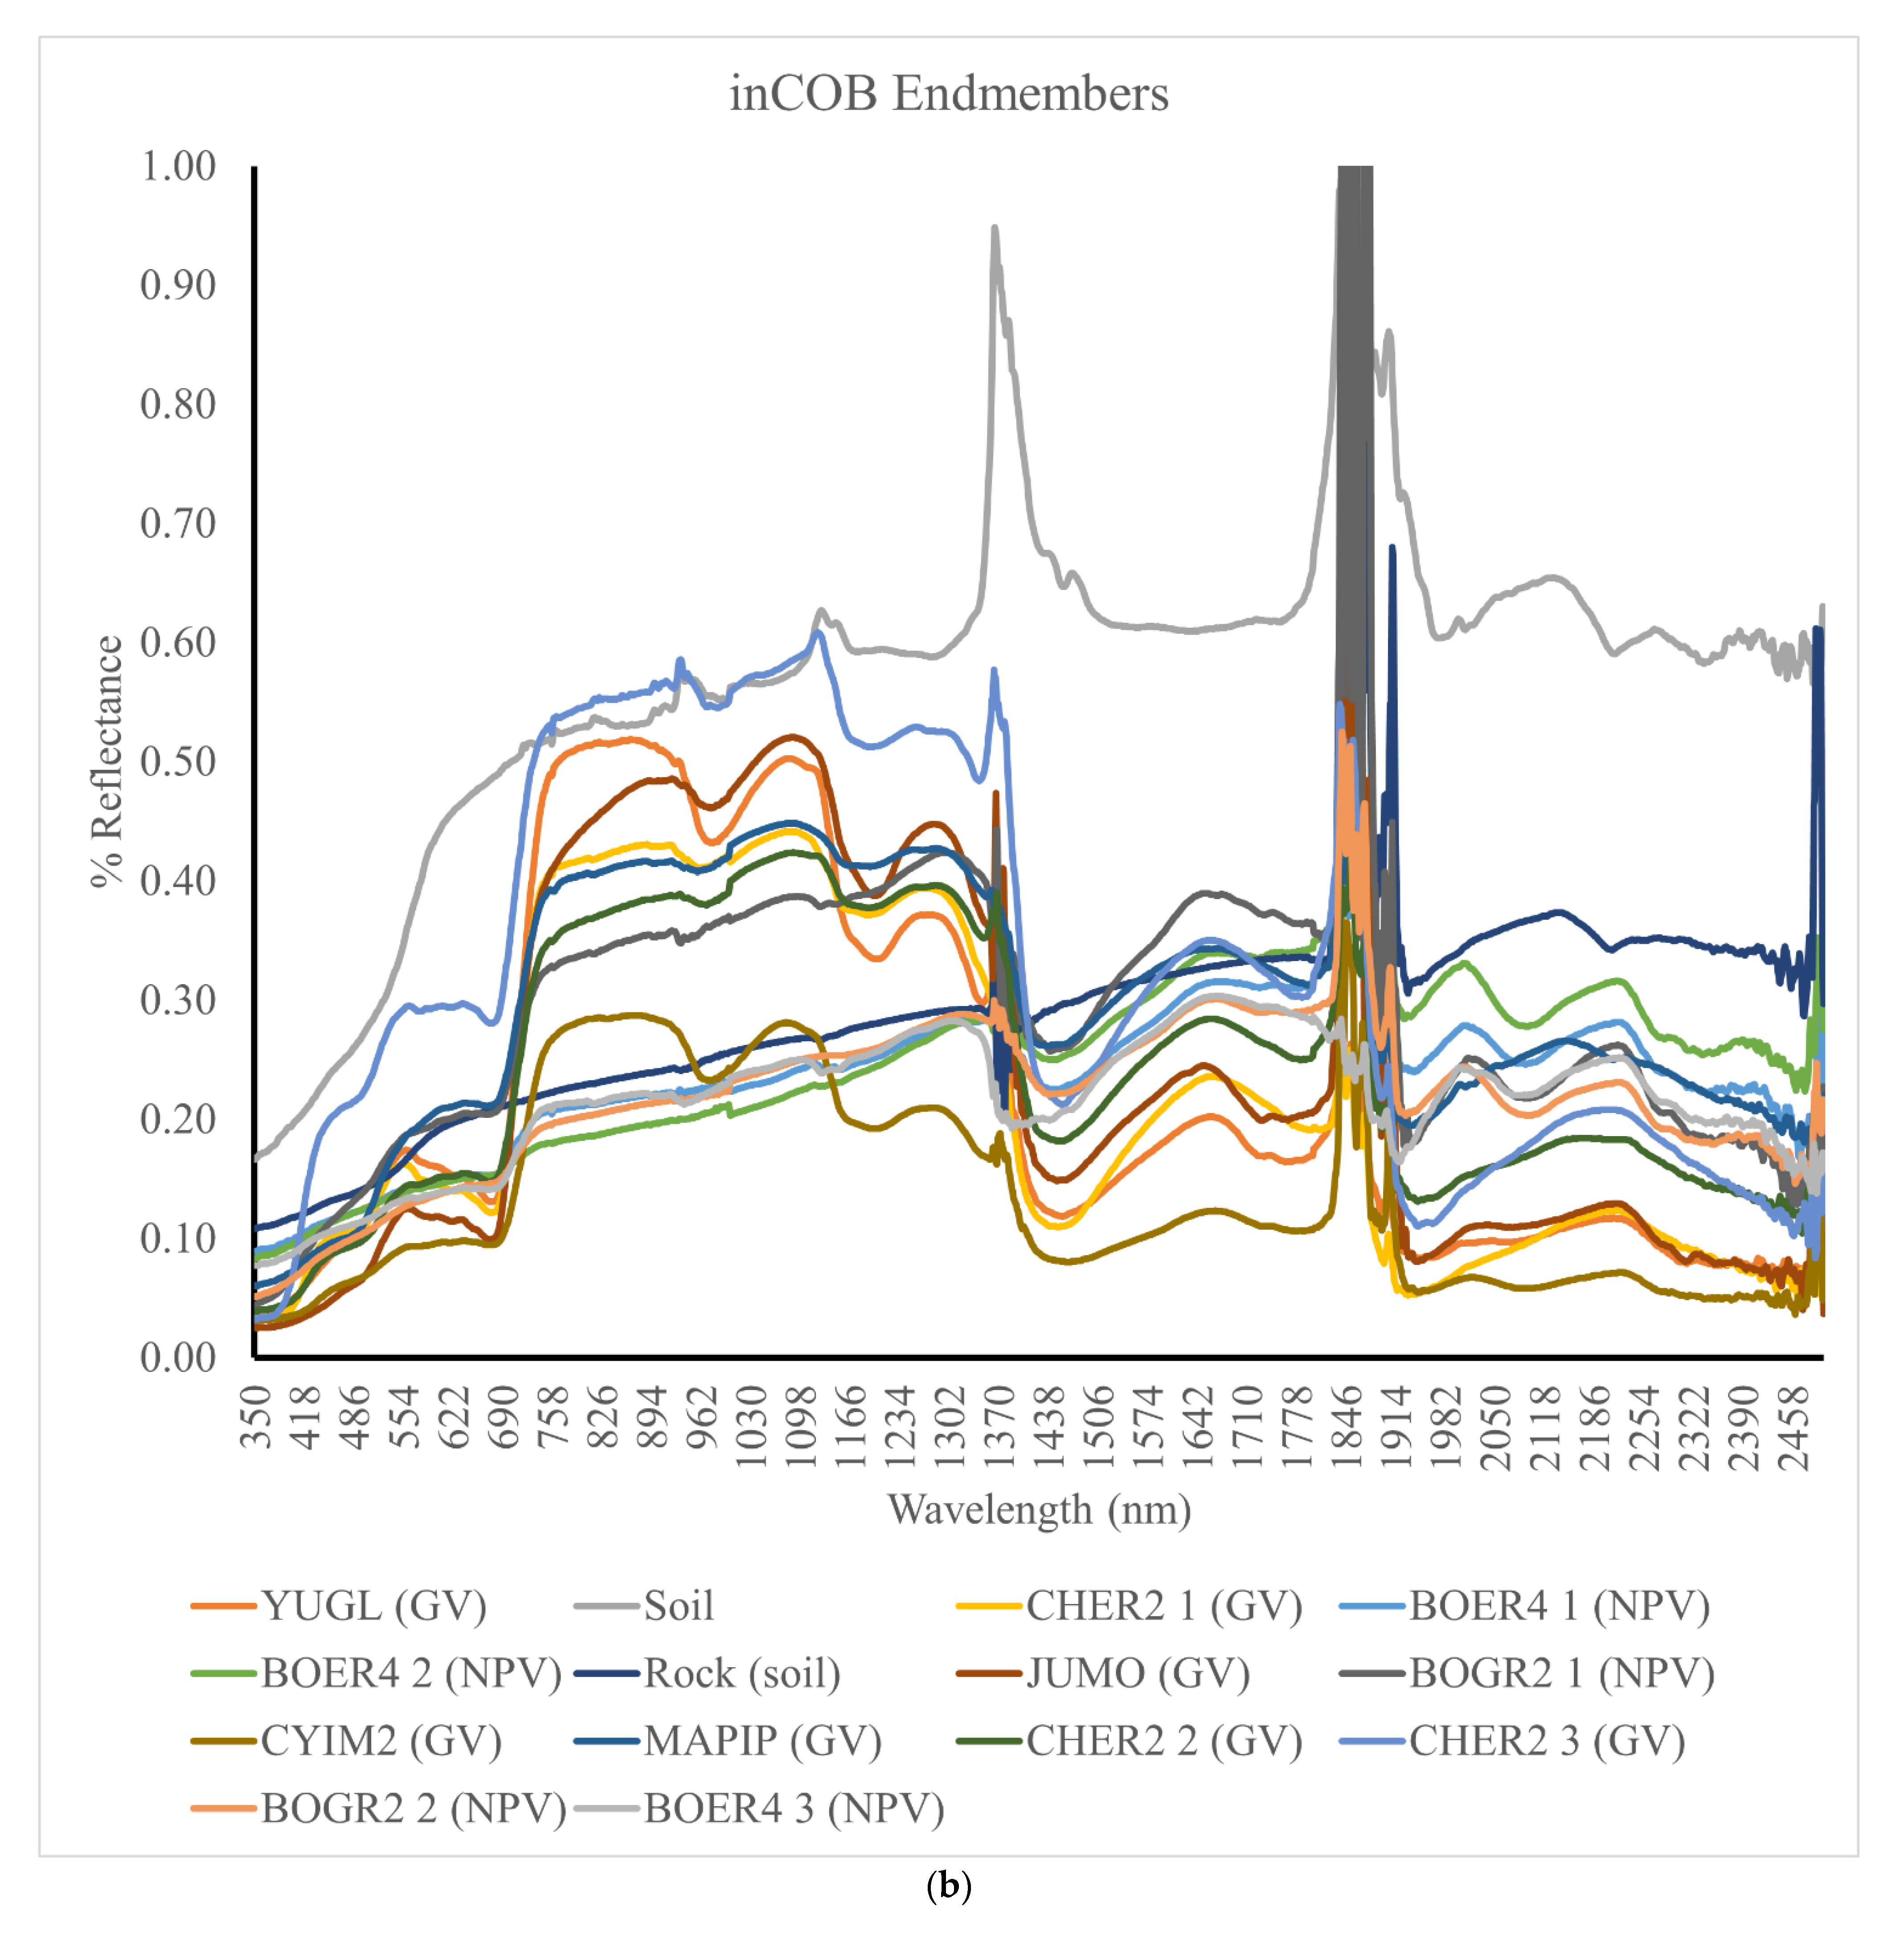
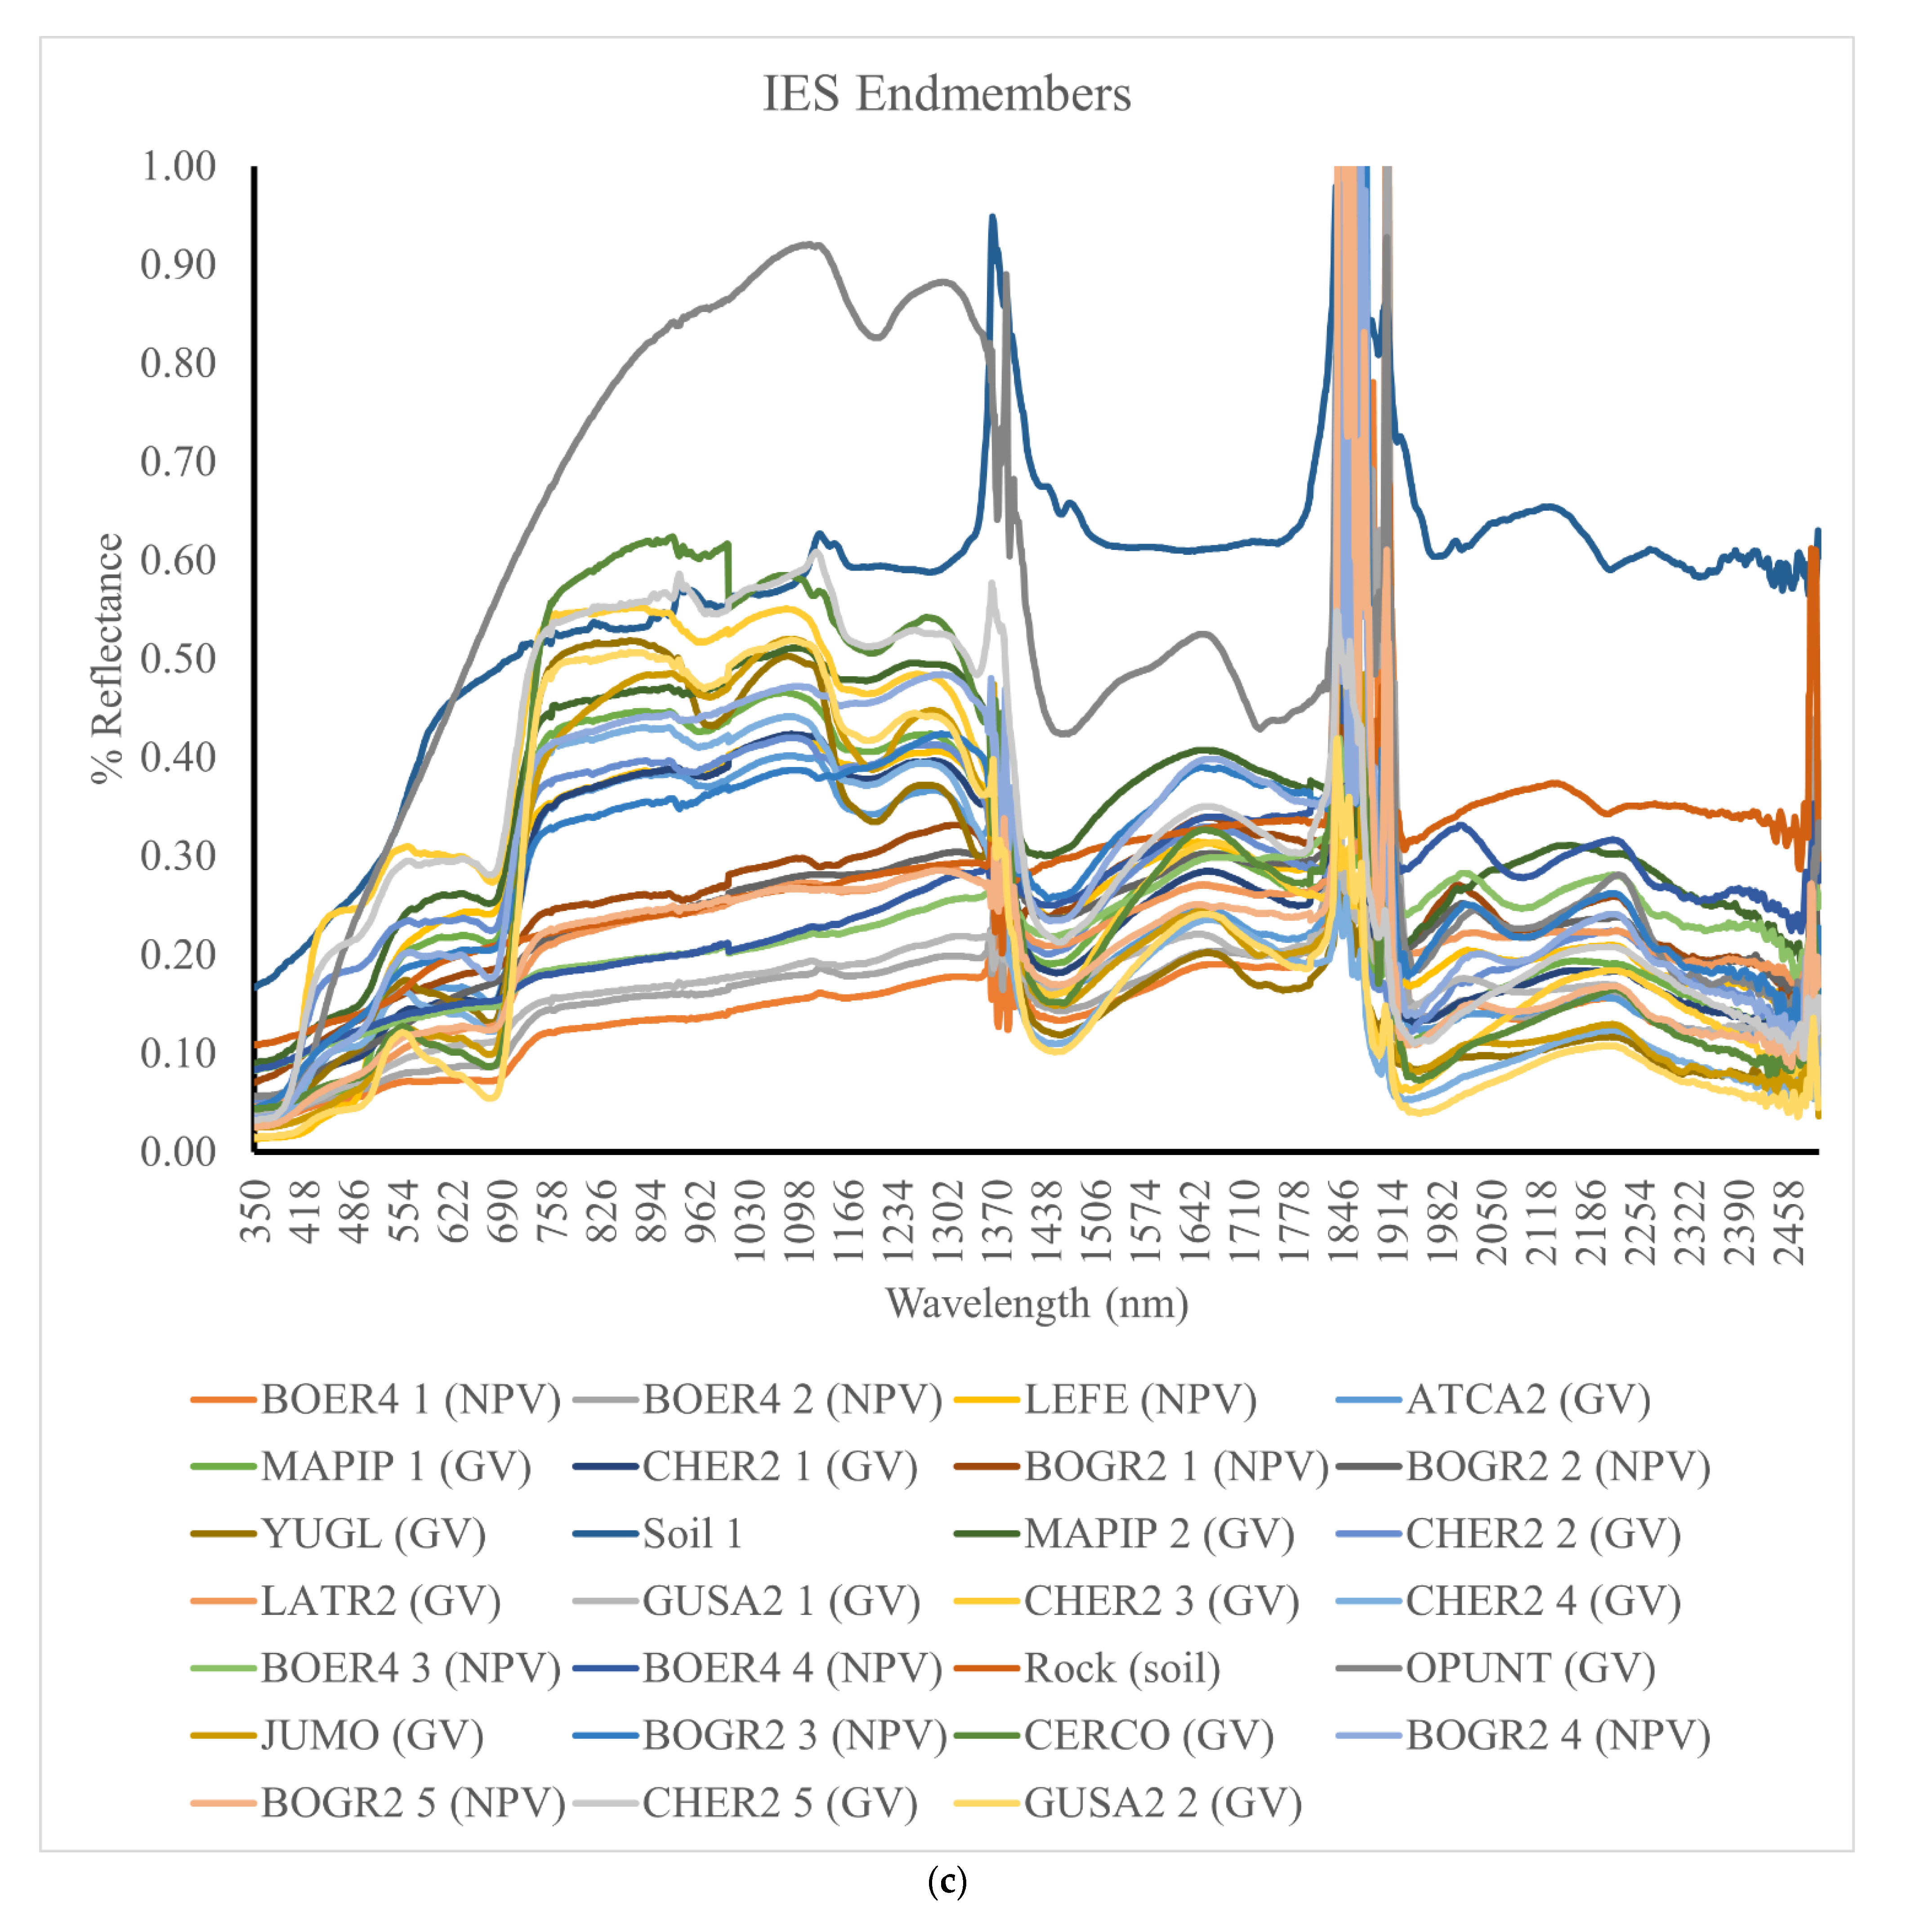

| Model ID | RMSE NPV | RMSE GV | RMSE Soil | MAE NPV | MAE GV | MAE Soil | R2 NPV | R2 GV | R2 Soil |
|---|---|---|---|---|---|---|---|---|---|
| 1 | 0.0944 | 0.223 | 0.2056 | 0.0661 | 0.1741 | 0.1398 | 0.8953 | 0.7161 | 0.8166 |
| 4 | 0.1613 | 0.4269 | 0.2258 | 0.1020 | 0.2872 | 0.1425 | 0.6741 | 0.1321 | 0.7438 |
| 5 | 0.2063 | 0.3897 | 0.2855 | 0.1451 | 0.2547 | 0.2309 | 0.4011 | 0.2073 | 0.439 |
| 8 | 0.1893 | 0.3676 | 0.2948 | 0.1363 | 0.2452 | 0.2388 | 0.4857 | 0.2858 | 0.4142 |
| 17 | 0.2676 | 0.3474 | 0.2402 | 0.1831 | 0.2611 | 0.1835 | 0.0939 | 0.2743 | 0.6702 |
| 20 | 0.2670 | 0.3459 | 0.2401 | 0.1834 | 0.2592 | 0.1833 | 0.0943 | 0.2808 | 0.6703 |
| 21 | 0.2986 | 0.3576 | 0.2304 | 0.2213 | 0.2917 | 0.1807 | 0.0318 | 0.2454 | 0.6623 |
| 24 | 0.2832 | 0.3554 | 0.2287 | 0.2066 | 0.2896 | 0.1727 | 0.0589 | 0.2549 | 0.6965 |
| 25 | 0.2663 | 0.3348 | 0.2299 | 0.2016 | 0.2205 | 0.1840 | 0.1071 | 0.4121 | 0.6425 |
| 28 | 0.2612 | 0.3342 | 0.2244 | 0.1952 | 0.2201 | 0.1801 | 0.1239 | 0.4121 | 0.6561 |
| 29 | 0.3283 | 0.3413 | 0.2502 | 0.2563 | 0.2465 | 0.1996 | 0.0018 | 0.3484 | 0.5627 |
| 32 | 0.3133 | 0.3426 | 0.2531 | 0.2483 | 0.2488 | 0.2022 | 0.0065 | 0.3416 | 0.5635 |
References
- Masson-Delmotte, V.; Zhai, P.; Pirani, A.; Connors, S.L.; Péan, C.; Berger, S.; Caud, N.; Chen, Y.; Goldfarb, L.; Gomis, M.I.; et al. (Eds.) IPCC: Climate Change 2021: The Physical Science Basis. Contribution of Working Group I to the Sixth Assessment Report of the Intergovernmental Panel on Climate Change; Cambridge University Press: Cambridge, UK, 2021. [Google Scholar]
- Williams, A.P.; Cook, E.R.; Smerdon, J.E.; Cook, B.I.; Abatzoglou, J.T.; Bolles, K.; Baek, S.H.; Badger, A.M.; Livneh, B. Large Contribution from Anthropogenic Warming to an Emerging North American Megadrought. Science 2020, 368, 314–318. [Google Scholar] [CrossRef]
- Hurd, B.H.; Coonrod, J. Climate Change and Its Implications for New Mexico’s Water Resources and Economic Opportunities; Technical Report 45; New Mexico State University Agricultural Experiment Station: Las Cruces, NM, USA, 2008. [Google Scholar]
- Knapp, A.K.; Carroll, C.J.W.; Denton, E.M.; La Pierre, K.J.; Collins, S.L.; Smith, M.D. Differential Sensitivity to Regional-Scale Drought in Six Central US Grasslands. Oecologia 2015, 177, 949–957. [Google Scholar] [CrossRef] [Green Version]
- Okin, G.S.; Roberts, D.A. Remote Sensing in Arid Regions: Challenges and Opportunities. In Remote Sensing For Natural Resource Management and Environmental Monitoring: Manual of Remote Sensing, 1st ed.; Ustin, S.L., Ed.; John Wiley & Sons: New York, NY, USA, 2004; pp. 111–145. [Google Scholar]
- Jones, S.K.; Ripplinger, J.; Collins, S.L. Species Reordering, Not Changes in Richness, Drives Long-Term Dynamics in Grassland Communities. Ecol. Lett. 2017, 20, 1556–1565. [Google Scholar] [CrossRef]
- Willis, K.S. Remote Sensing Change Detection for Ecological Monitoring in United States Protected Areas. Biol. Conserv. 2015, 182, 233–242. [Google Scholar] [CrossRef]
- McDowell, N.G.; Coops, N.C.; Beck, P.S.A.; Chambers, J.Q.; Gangodagamage, C.; Hicke, J.A.; Huang, C.; Kennedy, R.; Krofcheck, D.J.; Litvak, M.; et al. Global Satellite Monitoring of Climate-Induced Vegetation Disturbances. Trends Plant Sci. 2015, 20, 114–123. [Google Scholar] [CrossRef] [PubMed] [Green Version]
- Eisfelder, C.; Kuenzer, C.; Dech, S. Derivation of Biomass Information for Semi-Arid Areas Using Remote-Sensing Data. Int. J. Remote Sens. 2012, 33, 2937–2984. [Google Scholar] [CrossRef]
- Weiss, J.L.; Gutzler, D.S.; Coonrod, J.E.A.; Dahm, C.N. Long-Term Vegetation Monitoring with NDVI in a Diverse Semi-Arid Setting, Central New Mexico, USA. J. Arid. Environ. 2004, 58, 249–272. [Google Scholar] [CrossRef]
- Montandon, L.M.; Small, E.E. The Impact of Soil Reflectance on the Quantification of the Green Vegetation Fraction from NDVI. Remote. Sens. Environ. 2008, 112, 1835–1845. [Google Scholar] [CrossRef]
- Okin, G.S. The Contribution of Brown Vegetation to Vegetation Dynamics. Ecology 2010, 91, 743–755. [Google Scholar] [CrossRef] [PubMed]
- Guerschman, J.P.; Scarth, P.F.; McVicar, T.R.; Renzullo, L.J.; Malthus, T.J.; Stewart, J.B.; Rickards, J.E.; Trevithick, R. Assessing the Effects of Site Heterogeneity and Soil Properties When Unmixing Photosynthetic Vegetation, Non-Photosynthetic Vegetation and Bare Soil Fractions from Landsat and MODIS Data. Remote Sens. Environ. 2015, 161, 12–26. [Google Scholar] [CrossRef]
- Dennison, P.E.; Roberts, D.A. Endmember Selection for Multiple Endmember Spectral Mixture Analysis Using Endmember Average RMSE. Remote Sens. Environ. 2003, 87, 123–135. [Google Scholar] [CrossRef]
- Okin, G.S.; Roberts, D.A.; Murray, B.; Okin, W.J. Practical Limits on Hyperspectral Vegetation Discrimination in Arid and Semiarid Environments. Remote Sens. Environ. 2001, 77, 212–225. [Google Scholar] [CrossRef]
- Yang, J.; Weisberg, P.J.; Bristow, N.A. Landsat Remote Sensing Approaches for Monitoring Long-Term Tree Cover Dynamics in Semi-Arid Woodlands: Comparison of Vegetation Indices and Spectral Mixture Analysis. Remote Sens. Environ. 2012, 119, 62–71. [Google Scholar] [CrossRef]
- Brewer, W.L.; Lippitt, C.L.; Lippitt, C.D.; Litvak, M.E. Assessing Drought-Induced Change in a Piñon-Juniper Woodland with Landsat: A Multiple Endmember Spectral Mixture Analysis Approach. Int. J. Remote Sens. 2017, 38, 4156–4176. [Google Scholar] [CrossRef]
- Xiao, J.; Moody, A. A Comparison of Methods for Estimating Fractional Green Vegetation Cover within a Desert-to-Upland Transition Zone in Central New Mexico, USA. Remote Sens. Environ. 2005, 98, 237–250. [Google Scholar] [CrossRef]
- Rudgers, J.; Litvak, M.; Luo, Y.; Miller, T.; Newsome, S. LTER: Sevilleta (SEV) Site: Climate Variability at Dryland Ecotones; National Science Foundation Project Description: Alexandria, VA, USA, 2016. [Google Scholar]
- Ryerson, D.E.; Parmenter, R.R. Vegetation Change Following Removal of Keystone Herbivores from Desert Grasslands in New Mexico. J. Veg. Sci. 2001, 12, 167–180. [Google Scholar] [CrossRef]
- LTER. Sevilleta LTER. Available online: https://lternet.edu/site/sevilleta-lter/ (accessed on 4 September 2021).
- PRISM Climate Data. Available online: http://prism.oregonstate.edu (accessed on 20 January 2020).
- Muldavin, E.H.; Moore, D.I.; Collins, S.L.; Wetherill, K.R.; Lightfoot, D.C. Aboveground Net Primary Production Dynamics in a Northern Chihuahuan Desert Ecosystem. Oecologia 2008, 155, 123–132. [Google Scholar] [CrossRef] [PubMed]
- United States Drought Monitor. Available online: https://droughtmonitor.unl.edu/ (accessed on 20 January 2020).
- Muldavin, E.H.; Shore, G.A.; Taugher, K.; Milne, B.T. A Vegetation Classification and Map for the Sevilleta National Wildlife Refuge, New Mexico: Final Report; New Mexico Natural Heritage and Sevilleta LTER: Albuquerque, NM, USA, 1998. [Google Scholar]
- Roberts, D.A.; Halligan, K.; Dennsion, P.; Dudley, K.; Somers, B.; Crabbé, A. VIPER Tools Version 2.1; UCSB Viper Lab: Santa Barbara, CA, USA, 2019. [Google Scholar]
- Richards, J.A. Feature Reduction. In Remote Sensing Digital Image Analysis: An Introduction, 4th ed.; Springer: Berlin, Germany, 2006; pp. 280–343. [Google Scholar]
- Kachmar, M.; Sánchez-Azofeifa, G.A.; Rivard, B.; Kakubari, Y. Improved Forest Cover Classification in an Industrialized Mountain Area in Japan. Mt. Res. Dev. 2005, 25, 349–356. [Google Scholar] [CrossRef]
- Tane, Z.; Roberts, D.; Veraverbeke, S.; Casas, Á.; Ramirez, C.; Ustin, S. Evaluating Endmember and Band Selection Techniques for Multiple Endmember Spectral Mixture Analysis Using Post-Fire Imaging Spectroscopy. Remote Sens. 2018, 10, 389. [Google Scholar] [CrossRef] [Green Version]
- Roberts, D.A.; Dennison, P.E.; Gardner, M.E.; Hetzel, Y.; Ustin, S.L.; Lee, C.T. Evaluation of the Potential of Hyperion for Fire Danger Assessment by Comparison to the Airborne Visible/Infrared Imaging Spectrometer. IEEE Trans. Geosci. Remote Sens. 2003, 41, 1297–1310. [Google Scholar] [CrossRef]
- Roth, K.L.; Dennison, P.E.; Roberts, D.A. Comparing Endmember Selection Techniques for Accurate Mapping of Plant Species and Land Cover Using Imaging Spectrometer Data. Remote Sens. Environ. 2012, 127, 139–152. [Google Scholar] [CrossRef]
- Roberts, D.A.; Quattrochi, D.A.; Hulley, G.C.; Hook, S.J.; Green, R.O. Synergies between VSWIR and TIR Data for the Urban Environment: An Evaluation of the Potential for the Hyperspectral Infrared Imager (HyspIRI) Decadal Survey Mission. Remote Sens. Environ. 2012, 117, 83–101. [Google Scholar] [CrossRef]
- Somers, B.; Asner, G.P.; Tits, L.; Coppin, P. Endmember Variability in Spectral Mixture Analysis: A Review. Remote Sens. Environ. 2011, 115, 1603–1616. [Google Scholar] [CrossRef]
- Lippitt, C.L.; Stow, D.A.; Roberts, D.A.; Coulter, L.L. Multidate MESMA for Monitoring Vegetation Growth Forms in Southern California Shrublands. Int. J. Remote Sens. 2018, 39, 655–683. [Google Scholar] [CrossRef]
- Xu, Z.; Ren, H.; Cai, J.; Wang, R.; Li, M.-H.; Wan, S.; Han, X.; Lewis, B.J.; Jiang, Y. Effects of Experimentally-Enhanced Precipitation and Nitrogen on Resistance, Recovery and Resilience of a Semi-Arid Grassland after Drought. Oecologia 2014, 176, 1187–1197. [Google Scholar] [CrossRef]
- Griffin-Nolan, R.J.; Carroll, C.J.W.; Denton, E.M.; Johnston, M.K.; Collins, S.L.; Smith, M.D.; Knapp, A.K. Legacy Effects of a Regional Drought on Aboveground Net Primary Production in Six Central US Grasslands. Plant Ecol. 2018, 219, 505–515. [Google Scholar] [CrossRef]
- Gosz, R.J.; Gosz, J.R. Species Interactions on the Biome Transition Zone in New Mexico: Response of Blue Grama (Bouteloua Gracilis) and Black Grama (Bouteloua Eripoda) to Fire and Herbivory. J. Arid. Environ. 1996, 34, 101–114. [Google Scholar] [CrossRef] [Green Version]
- Thorp, K.R.; French, A.N.; Rango, A. Effect of Image Spatial and Spectral Characteristics on Mapping Semi-Arid Rangeland Vegetation Using Multiple Endmember Spectral Mixture Analysis (MESMA). Remote Sens. Environ. 2013, 132, 120–130. [Google Scholar] [CrossRef]
- Okin, G.S. Relative Spectral Mixture Analysis—A Multitemporal Index of Total Vegetation Cover. Remote Sens. Environ. 2007, 106, 467–479. [Google Scholar] [CrossRef]
- Dudley, K.L.; Dennison, P.E.; Roth, K.L.; Roberts, D.A.; Coates, A.R. A Multi-Temporal Spectral Library Approach for Mapping Vegetation Species across Spatial and Temporal Phenological Gradients. Remote Sens. Environ. 2015, 167, 121–134. [Google Scholar] [CrossRef]


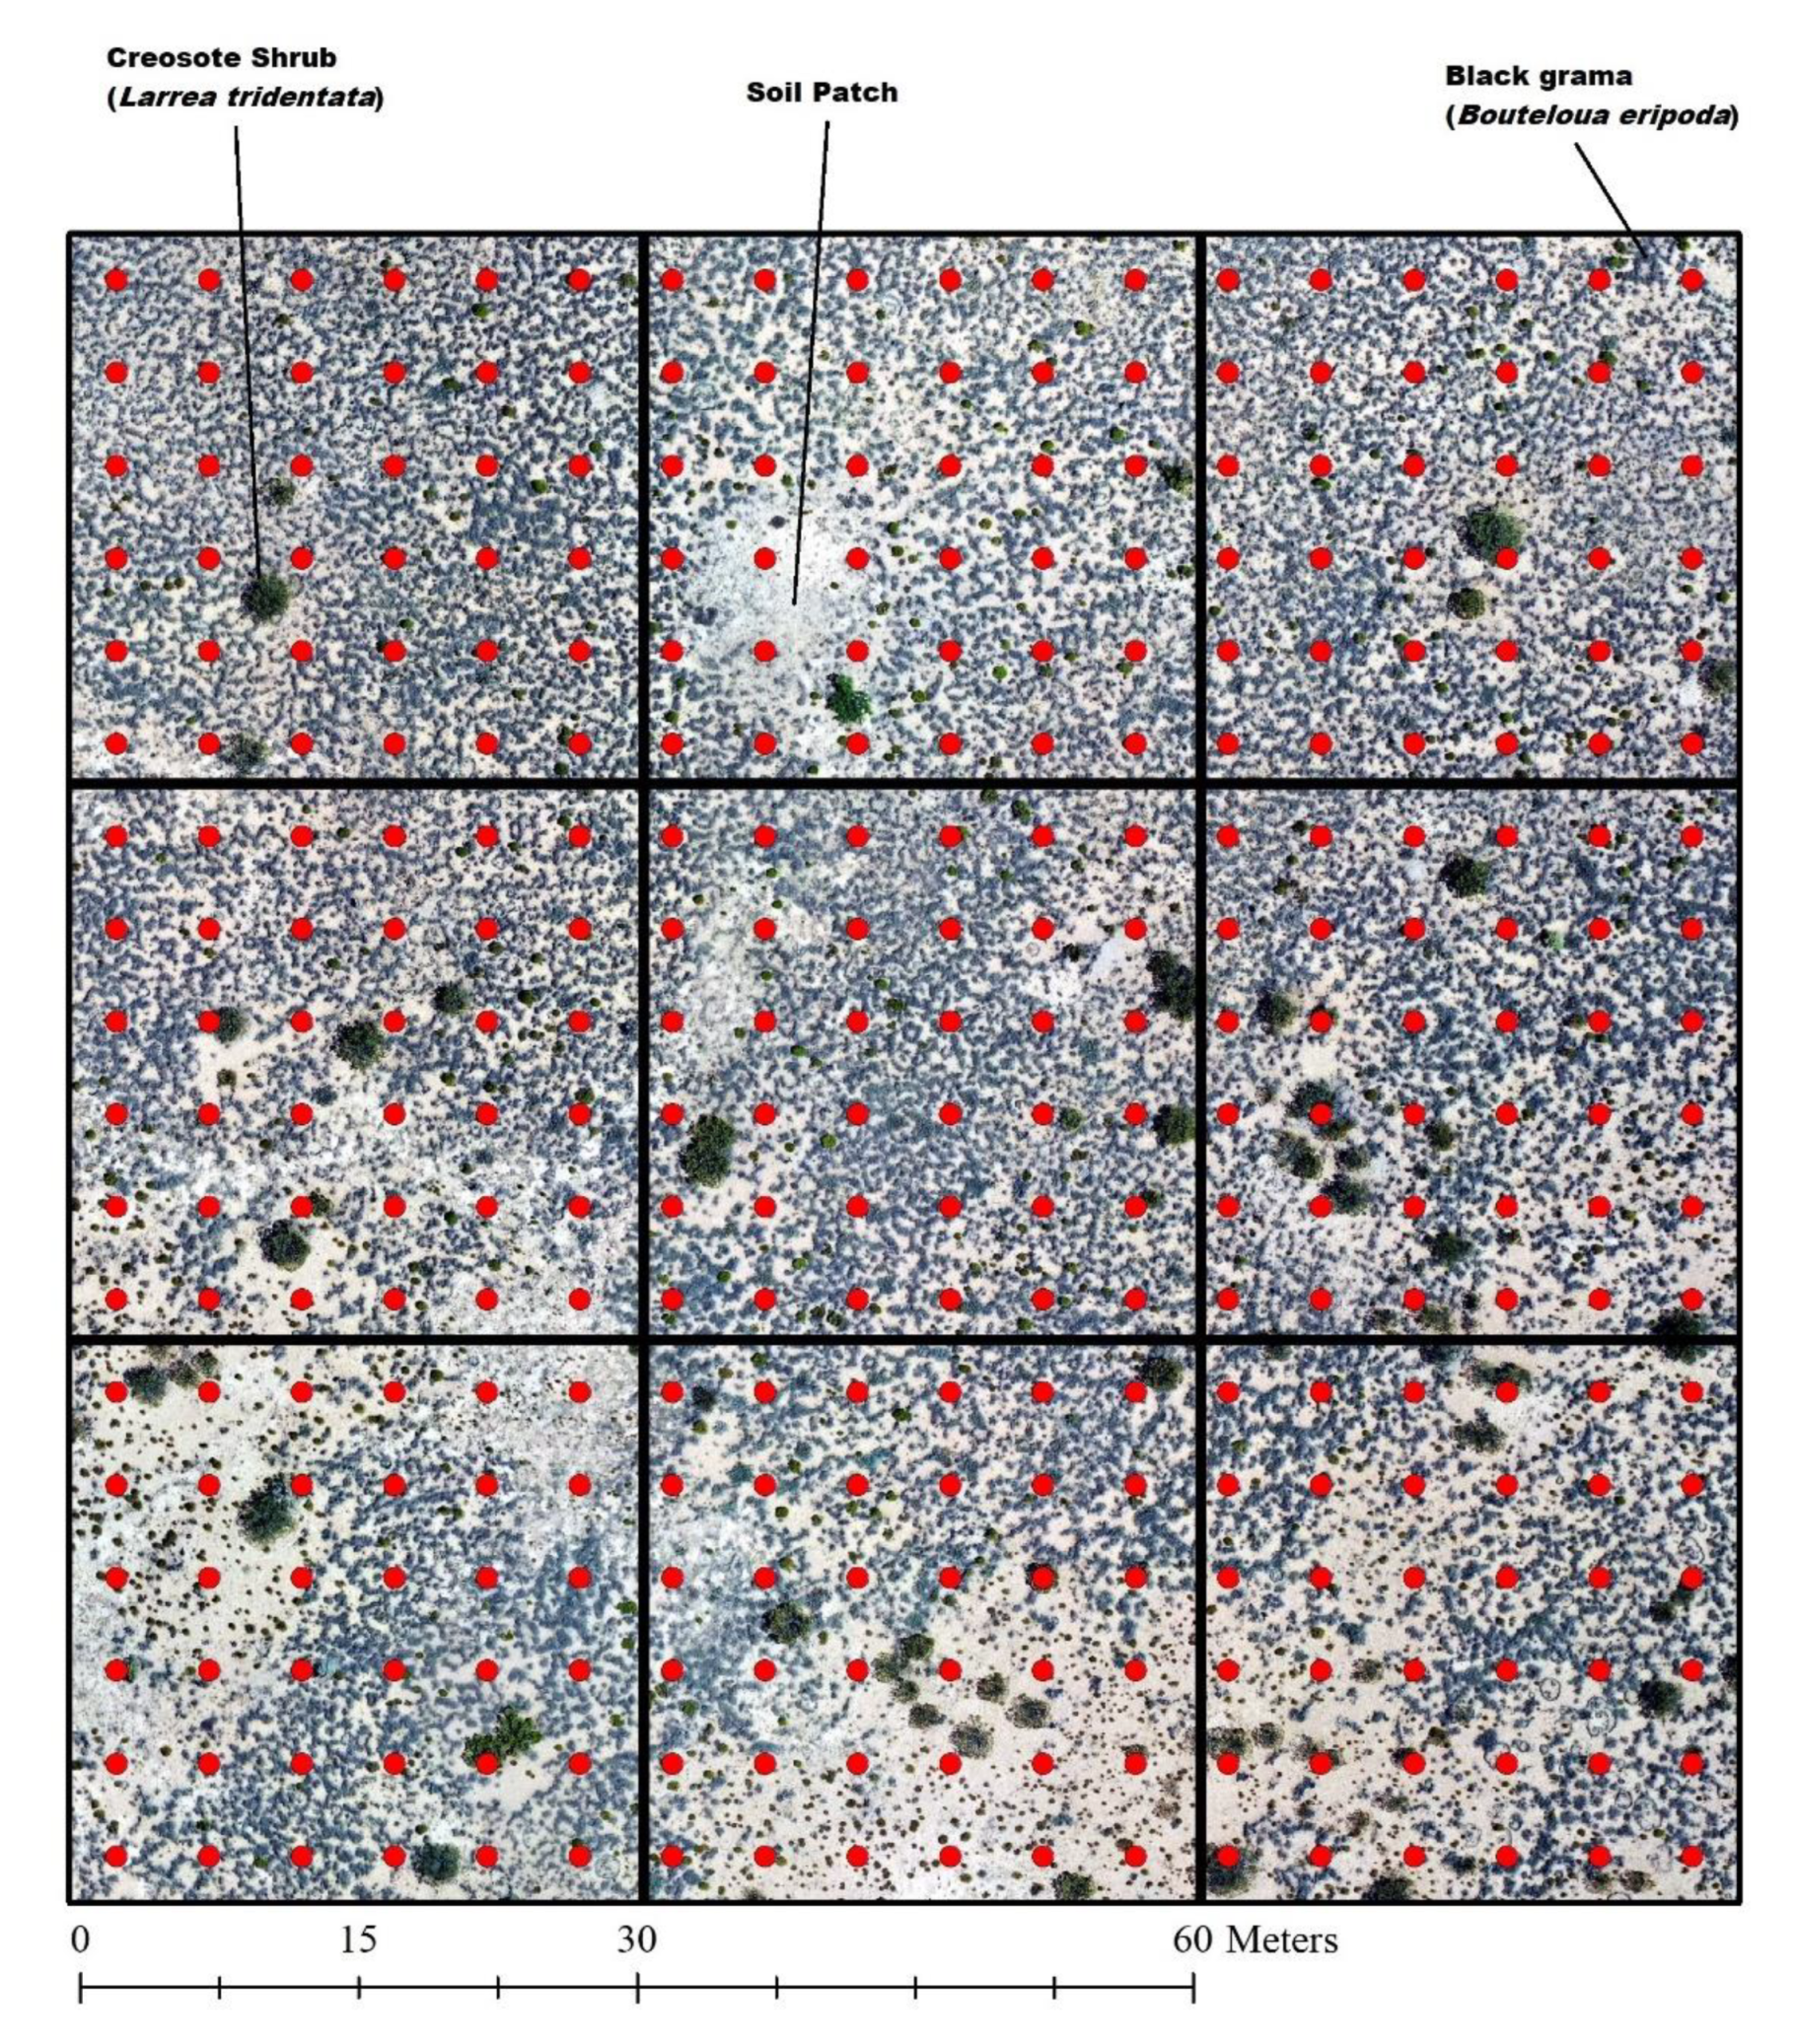



| USDA Species Code | Scientific Name | Common Name | No. Targets |
|---|---|---|---|
| BOGR2 | Bouteloua gracilis | Blue grama | 20 |
| BOER4 | Bouteloua eripoda | Black grama | 31 |
| LATR2 | Larrea tridentata | Creosotebush | 35 |
| ATCA2 | Atriplex canescens | Fourwing saltbush | 14 |
| CYIM2 | Cylindropuntia imbricata | Tree cholla | 20 |
| EPTO | Ephedra torreyana | Torrey’s jointfir | 22 |
| GUSA2 | Gutierrezia sarothrae | Broom snakeweed | 29 |
| JUMO | Juniperus monosperma | Oneseed juniper | 8 |
| CERCO | Cercocarpus montanus | Mountain mahogany | 10 |
| KRLA2 | Krascheninnikovia lanata | Winterfat | 9 |
| OPUNT | Opuntia spp | Pricklypear | 22 |
| PRGL2 | Prosopis glandulosa | Honey mesquite | 4 |
| YUGL | Yucca glauca | Soapflower yucca | 15 |
| DAPU7 | Dasyochloa pulchella | Low woolygrass | 2 |
| PLJA | Pleuraphis jamesii | James’ galleta | 7 |
| SCBR2 | Scleropogon brevifolius | Burrograss | 4 |
| SPORO | Sporobolus spp | Dropseed | 3 |
| CHER2 | Chaetopappa ericoides | Rose heath | 15 |
| MAPIP | Machaeranthera pinnatifida | Lacy tansyaster | 10 |
| Endmember Selection Method | Citation | No. NPV EM | No. GV EM | No. S EM |
|---|---|---|---|---|
| EMC | Tane et al., 2018 | 3 | 3 | 2 |
| inCOB | Roberts et al., 2003 | 4 | 8 | 2 |
| IES | Roth et al., 2012 | 5 | 21 | 2 |
| Reduced IES | Roth et al., 2012 | 3 | 11 | 2 |
| Plot ID | NPV Fraction | GV Fraction | Soil Fraction | Community Type | Imagery Source |
|---|---|---|---|---|---|
| Green 1–5 | 0% | 100% | 0% | Agriculture | Landsat / NAIP |
| Soil 1–5 | 0% | 0% | 100% | Barren (Arroyo/Wash) | Landsat / NAIP |
| BOER4_1 | 45% | 13% | 43% | Grassland | UAS |
| BOER4_2 | 55% | 5% | 40% | Grassland | UAS |
| LATR2_1 | 15% | 32% | 53% | Shrubland | UAS |
| LATR2_2 | 38% | 16% | 46% | Shrubland | UAS |
| LATR2_3 | 39% | 15% | 46% | Shrubland | UAS |
| LATR2_4 | 32% | 21% | 46% | Shrubland | UAS |
| BOGR2_1 | 71% | 2% | 27% | Grassland | UAS |
| BOGR2_2 | 51% | 10% | 40% | Grassland | UAS |
| BOGR2_3 | 62% | 2% | 36% | Grassland | UAS |
| Transition 1 | 35% | 9% | 56% | Grassland | UAS |
| Transition 2 | 44% | 11% | 45% | Grassland | UAS |
| Transition 3 | 42% | 9% | 48% | Grassland | UAS |
Publisher’s Note: MDPI stays neutral with regard to jurisdictional claims in published maps and institutional affiliations. |
© 2021 by the authors. Licensee MDPI, Basel, Switzerland. This article is an open access article distributed under the terms and conditions of the Creative Commons Attribution (CC BY) license (https://creativecommons.org/licenses/by/4.0/).
Share and Cite
Converse, R.L.; Lippitt, C.D.; Lippitt, C.L. Assessing Drought Vegetation Dynamics in Semiarid Grass- and Shrubland Using MESMA. Remote Sens. 2021, 13, 3840. https://doi.org/10.3390/rs13193840
Converse RL, Lippitt CD, Lippitt CL. Assessing Drought Vegetation Dynamics in Semiarid Grass- and Shrubland Using MESMA. Remote Sensing. 2021; 13(19):3840. https://doi.org/10.3390/rs13193840
Chicago/Turabian StyleConverse, Rowan L., Christopher D. Lippitt, and Caitlin L. Lippitt. 2021. "Assessing Drought Vegetation Dynamics in Semiarid Grass- and Shrubland Using MESMA" Remote Sensing 13, no. 19: 3840. https://doi.org/10.3390/rs13193840


