Article

Investigating Ground Subsidence and the Causes over the Whole Jiangsu Province, China Using Sentinel-1 SAR Data

1
Chinese Academy of Surveying and Mapping, Beijing 100036, China
2
Provincial Geomatics Center of Jiangsu, Nanjing 210013, China
3
Roy M. Huffington Department of Earth Sciences, Southern Methodist University, Dallas, TX 75205, USA
*
Author to whom correspondence should be addressed.
Remote Sens. 2021, 13(2), 179; https://doi.org/10.3390/rs13020179
Submission received: 28 October 2020 / Revised: 20 December 2020 / Accepted: 4 January 2021 / Published: 7 January 2021

Abstract

:
Interferometric synthetic aperture radar (InSAR) mapping of localized ground surface deformation has become an important tool to manage subsidence-related geohazards. However, monitoring land surface deformation using InSAR at high spatial resolution over a large region is still a formidable task. In this paper, we report a research on investigating ground subsidence and the causes over the entire 107, 200 km2 province of Jiangsu, China, using time-series InSAR. The Sentinel-1 Interferometric Wide-swath (IW) images of 6 frames are used to map ground subsidence over the whole province for the period 2016–2018. We present processing methodology in detail, with emphasis on the three-level co-registration scheme of S-1 data, retrieval of mean subsidence velocity (MSV) and subsidence time series, and mosaicking of multiple frames of results. The MSV and subsidence time series are generated for 9,276,214 selected coherent pixels (CPs) over the Jiangsu territory. Using 688 leveling measurements in evaluation, the derived MSV map of Jiangsu province shows an accuracy of 3.9 mm/year. Moreover, subsidence causes of the province are analyzed based on InSAR-derived subsidence characteristics, historical optical images, and field-work findings. Main factors accounting for the observed subsidence include: underground mining, groundwater withdrawal, soil consolidations of marine reclamation, and land-use transition from agricultural (paddy) to industrial land. This research demonstrates not only the capability of S-1 data in mapping ground deformation over wide areas in coastal and heavily vegetated region of China, but also the potential of inferring valuable knowledge from InSAR-derived results.

1. Introduction

Jiangsu province is located at the center of the eastern China coast area and in the Yangtze river delta region. Over 80% of its 107,200 km2 area is characterized as plain, with a terrain height of less than 50 m above sea level. Given the advanced shipping network composed by the Yangtze River, the Beijing-Hangzhou Grand Canal and other numerous inland rivers/canals, and the high percentage of cultivatable land, the Jiangsu province has been the most prosperous region in China for many centuries. Since the 1980s, with fast industrialization and economic growth, ground subsidence has emerged and gradually developed into a kind of geological disaster which increases the risk of flooding and damages to buildings and infrastructure, and causes seawater intrusion and other types of losses [1]. It is reported that 5000 km2 area has accumulative subsidence larger than 0.2 m, and the maximum accumulative subsidence reached 2 m until the year 2000 in the Suzhou-Wuxi-Changzhou region of southern Jiangsu [1].
In order to cope with the threat posed by the increasingly expanding ground subsidence, the provincial government of Jiangsu issued a 10-year plan in 2014 aiming at actions to mitigate ground subsidence, including enhancing the monitoring capability of ground subsidence. In fact, the government started to construct a ground subsidence monitoring network composed of leveling, borehole extensometers and Global Positioning System (GPS) stations in the southern part of Jiangsu as far back as the 1980s. These ground-based techniques are usually accurate in measuring subsidence, but cannot be densely deployed due to construction and maintenance costs. Because the information obtained from the ground-based network is incomplete, it has very limited value for decision-making about subsidence prevention and mitigation.
Unlike ground based methods, satellite Interferometric SAR (InSAR) has the advantage of obtaining ground deformation over an area, rather than at a discrete position. With the advent of time series InSAR (TS-InSAR) techniques, such as permanent scatterer InSAR (PS-InSAR) [2,3] and small baseline subset (SBAS) InSAR [4], InSAR has become an operationally usable tool for mapping ground deformations. Since then, TS-InSAR techniques have been used to monitor ground subsidence over many cities, such as the European cities involved in the Terrafirma project [5], Los Angeles and Houston in the US [6,7], and some Chinese cities like Beijing [8,9], Tianjing [10], Shanghai [11] and Suzhou [12]. Moreover, TS-InSAR has also been exploited for subsidence monitoring over large areas, such as the entire country of Italy [13], all of Norway (https://insar.ngu.no/), and the Beijing-Tianjing-Hebei region of China [14].
The launches of Sentinel-1A and Sentinel-1B (S-1) satellites in 2014 and 2016 respectively, further enhanced the superiority of InSAR for deformation monitoring due to the optimized features in imaging parameters, revisit time, spatial resolution, and orbital status [15,16]. The S-1 IW data, which is acquired through the novel Terrain Observation by Progressive Scans (TOPS) [17] technique, has a 250 km swath and can be regularly acquired every 6 days over most part of the world with the combination of Sentinel-1A and Sentinel-1B satellites. This superior spatial coverage, plus the free data policy, makes S-1 IW data an ideal data source for deformation monitoring over large areas. Internationally, the S-1 IW data has been used to map ground deformations over the entirety of Germany [18] and over the whole of Italy [19]. In China, most ground deformation monitoring efforts using S-1 IW data have covered relatively small areas, such as the Xiamen Airport [20] and Tianjin [21]. Therefore, the potential of S-1 IW data in monitoring ground deformation in wide areas in China has not been fully exploited.
On the other side, as a kind of geoharzards, ground subsidence may result in various damages to buildings, infrastructures and facilities. To know the spatial distribution and amplitude of ground subsidence is the first step, and many relevant InSAR researches focus on this aspect. But what is more important is to uncover some knowledge about ground subsidence, such as the causes, the tendency and so on. These knowledge can provide direct guidance for taking proper actions to prevent and mitigate subsidence hazard. In this paper, we report a research on mapping the ground subsidence and inferring the causes for the entire Jiangsu province for the period 2016–2018 with S-1 IW data.
The remainder of the paper is structured as follows. The study area and S-1 images are introduced in Section 2. Processing methodology is also given in Section 2 with emphasis on the co-registration scheme consisting of three course-to-fine registration steps and TS-InSAR retrieval over a large region. Ground subsidence results are presented in Section 3, together with the accuracy evaluation. In Section 4, the spatial-temporal characteristics and causes of subsidence over five major subsiding zones are analyzed in detail by synergetic utilization of InSAR-derived results, historical optical images and field-work findings. Finally, conclusions are drawn in Section 5.

2. Materials and Methods

2.1. S-1 Data and the Study Area

From the Sentinel-1 data archive accessed through the Copernicus Open Access Hub (https://scihub.copernicus.eu/), the descending S-1 acquisitions over Jiangsu province are very sparse and far less than the requirement for TS-InSAR analysis. Therefore, ascending orbit S-1 IW images were chosen. A standard S-1 IW frame (or slice), covering an area of 250 * 180 km2 in range and azimuth directions, consists of three sub-swaths with around 2 km overlap. Each sub-swath is composed of 8-10 slightly overlapping bursts. The S-1 data is provided in single-look complex (SLC) format with pixel spacing of 2.3 m and 14.0 m in slant range and azimuth directions, respectively. Six frames of S-1 IW data in 3 tracks (Path 142, 69 and 171) forms a complete coverage for the full territory of Jiangsu as depicted in Figure 1. Jiangsu province is composed of 13 prefectures with their names annotated in Figure 1. The numbers of S-1 IW images used, together with their acquisition time spans, are listed in Table 1. Due to strong atmospheric artifacts presented in some summer acquisitions, interferograms heavily contaminated by high-frequency tropospheric noise have been detected and discarded (please see the detail in Section 3.2). The 1-arcsec Shuttle Radar Topography Mission (SRTM) digital elevation model (DEM) is used in S-1 co-registration, geocoding and topographic phase removal.

2.2. Data Processing

The S-1 data stacks were processed using a software named “Ground Deformation mapping with SAR Interferometry (GDEMSI)” developed by the Chinese Academy of Surveying and Mapping. It is based on a time series InSAR approach—Multiple-master Coherent Target Small-Baseline InSAR (MCTSB-InSAR), which has been used to process multi-temporal strip-mode SAR images from European Remote Sensing (ERS), Envisat and Radarsat-2 sensors over the Beijing-Tianjin-Hebei region [14].
The TOPS nature of S-1 IW data imposes stringent requirements on azimuth co-registration accuracy. According to De Zan et al. [22], at least one thousandth of one pixel co-registration accuracy is required to avoid phase discontinuity at burst edges. Therefore, a three-level course-to-fine co-registration module has been integrated into the GDEMSI software to specifically handle the S-1 co-registration.
The first-level co-registration is conducted based on a look up table (LUT) generated from the orbit information of master and slave S-1 slices and the SRTM DEM data. Given the 5 cm 3-D 1-sigma accuracy of S-1 precise orbit data [23] and the flat terrain in Jiangsu, the initial LUT can deliver around 0.5 pixel co-registration accuracy. In the second-level co-registration, offsets are measured over evenly distributed patches using cross-correlation between the master amplitude and the resampled slave amplitude. A linear model was adopted to fit these offsets measured in all bursts within the slice. Then the initial LUT was then refined accordingly. The third-level co-registration involved applying the enhanced spectral diversity (ESD) method [24] to determine the residual azimuth co-registration error to the required one thousandth of one pixel accuracy. The ESD method estimates the co-registration residual by exploiting the interferometric phase difference over the burst overlap region between master and slave bursts. The azimuth co-registration residual Δ y p at pixel p in the overlap region between the ith and (i + 1)th burst is [16]:
Δ y p = Δ ϕ p f a z 2 π Δ f D C , p ,
where f a z is the azimuth sampling frequency or pulse repetition frequency (PRF), Δ f D C , p is the Doppler centroid difference of the two bursts at pixel p , Δ ϕ p is the unwrapped phase of a double differential interferogram like this:
Δ ϕ p = { ( m i , p s i , p * ) ( m i + 1 , p s i + 1 , p * ) * } u n w ,
where m , s mean master and slave images, subscript refers to complex conjugate. Since the azimuth co-registration residual between the two bursts can be regarded as a constant [24], it can be determined by taking into consideration all pixels with coherence larger than a threshold in the overlap region by
Δ y = f a z 2 π Δ ϕ p Δ f D C , p ,
where denotes ensemble average. Please note, here we choose to unwrap the differential interferogram defined in Equation (2), because the interferogram is only generated for the overlap region, thus the computation cost for phase unwrapping over such a small region is trivial.
Up to now, this is the procedure to calculate the co-registration residual between one master and one slave images. When tackling time series S-1 images, we need to choose small-baseline interferograms to connect all S-1 images with redundancy and estimate the co-registration residual for every interferogram. Finally, the co-registration residual of every other S-1 image relative to a common master can be jointly estimated with the weighted least squares approach [25].
When the S-1 images have been co-registered, they are ready to be processed by GDEMSI like conventional stripmap images for time series InSAR analysis. The flowchart of S-1 stack time series processing is shown in Figure 2. For more processing details, please refer to Reference [14].
As S-1 IW images can be acquired regularly every 12 days over most areas in China, there are redundant small-baseline interferogram combinations. But, we have found that atmosphere can bring in very strong artifacts on S-1 interferograms formed by two images acquired both in the summer season, that is, from June to September. This may be caused by dramatic tropospheric condition variations in summer in the mid-latitude coastal Jiangsu province. As an illustration, three consecutive interferograms with 12-day separation are shown in Figure 3a–c. Strong and temporally uncorrelated fringes are present in the interferograms, which are obviously originated from varying atmosphere turbulence. For comparison, a good interferogram with very slight atmosphere artifacts is shown in Figure 3d, in which the master and slave images were both acquired in winter. Therefore, those interferograms heavily contaminated by tropospheric anomalies were discarded, so did S-1 acquisitions not connected to the final interferograms. This is why the number of used S-1 acquisitions is smaller than the available in the archive.
For deformation monitoring over a large area covered by multiple SAR frames, the mean deformation velocity along SAR line-of-sight (LOS) direction at selected coherent pixels (CP) over each SAR frame is estimated firstly, and then an adjustment process is implemented to harmonize the mean deformation velocity estimates from overlapping frames. Since the SAR viewing angle is different for different tracks, we need to project the LOS mean deformation velocity of overlapping tracks into a common direction. Projecting LOS mean deformation velocity into the vertical direction according to the following equation, which is actually equivalent to calculate the mean subsidence velocity, is a good solution.
v u d ( x , y ) = v L O S ( x , y ) / cos θ ( x , y ) ,
where v u d ( x , y ) and v L O S ( x , y ) are the up-down mean subsidence velocity (MSV) and LOS mean deformation velocity respectively, θ ( x , y ) is the SAR viewing angle at position ( x , y ) . Of course, the transformation in Equation (4) is only valid under the assumption that ground uplift or subsidence is the sole deformation. For this study, this assumption is reasonably true, because it has been reported that ground subsidence and uplift are the dominant ground deformation in Jiangsu province [26]. Therefore, the mean deformation velocity of the 6 S-1 frames is estimated respectively, and the mean deformation velocity is transformed as the mean subsidence velocity. Finally, the MSVs over the 6 frames are adjusted and mosaicked to generate a MSV map covering the full Jiangsu province.
After knowing the adjusted mean deformation velocity and DEM error, the nonlinear deformation associated with every SAR acquisition of a CP can be estimated by temporal and spatial filtering of the residual phase. Finally, the deformation time series of a CP is obtained by combining the mean deformation velocity and the nonlinear deformations. Again we can project the LOS deformation time series into the vertical direction to obtain the subsidence time series.

3. Results

3.1. InSAR Results

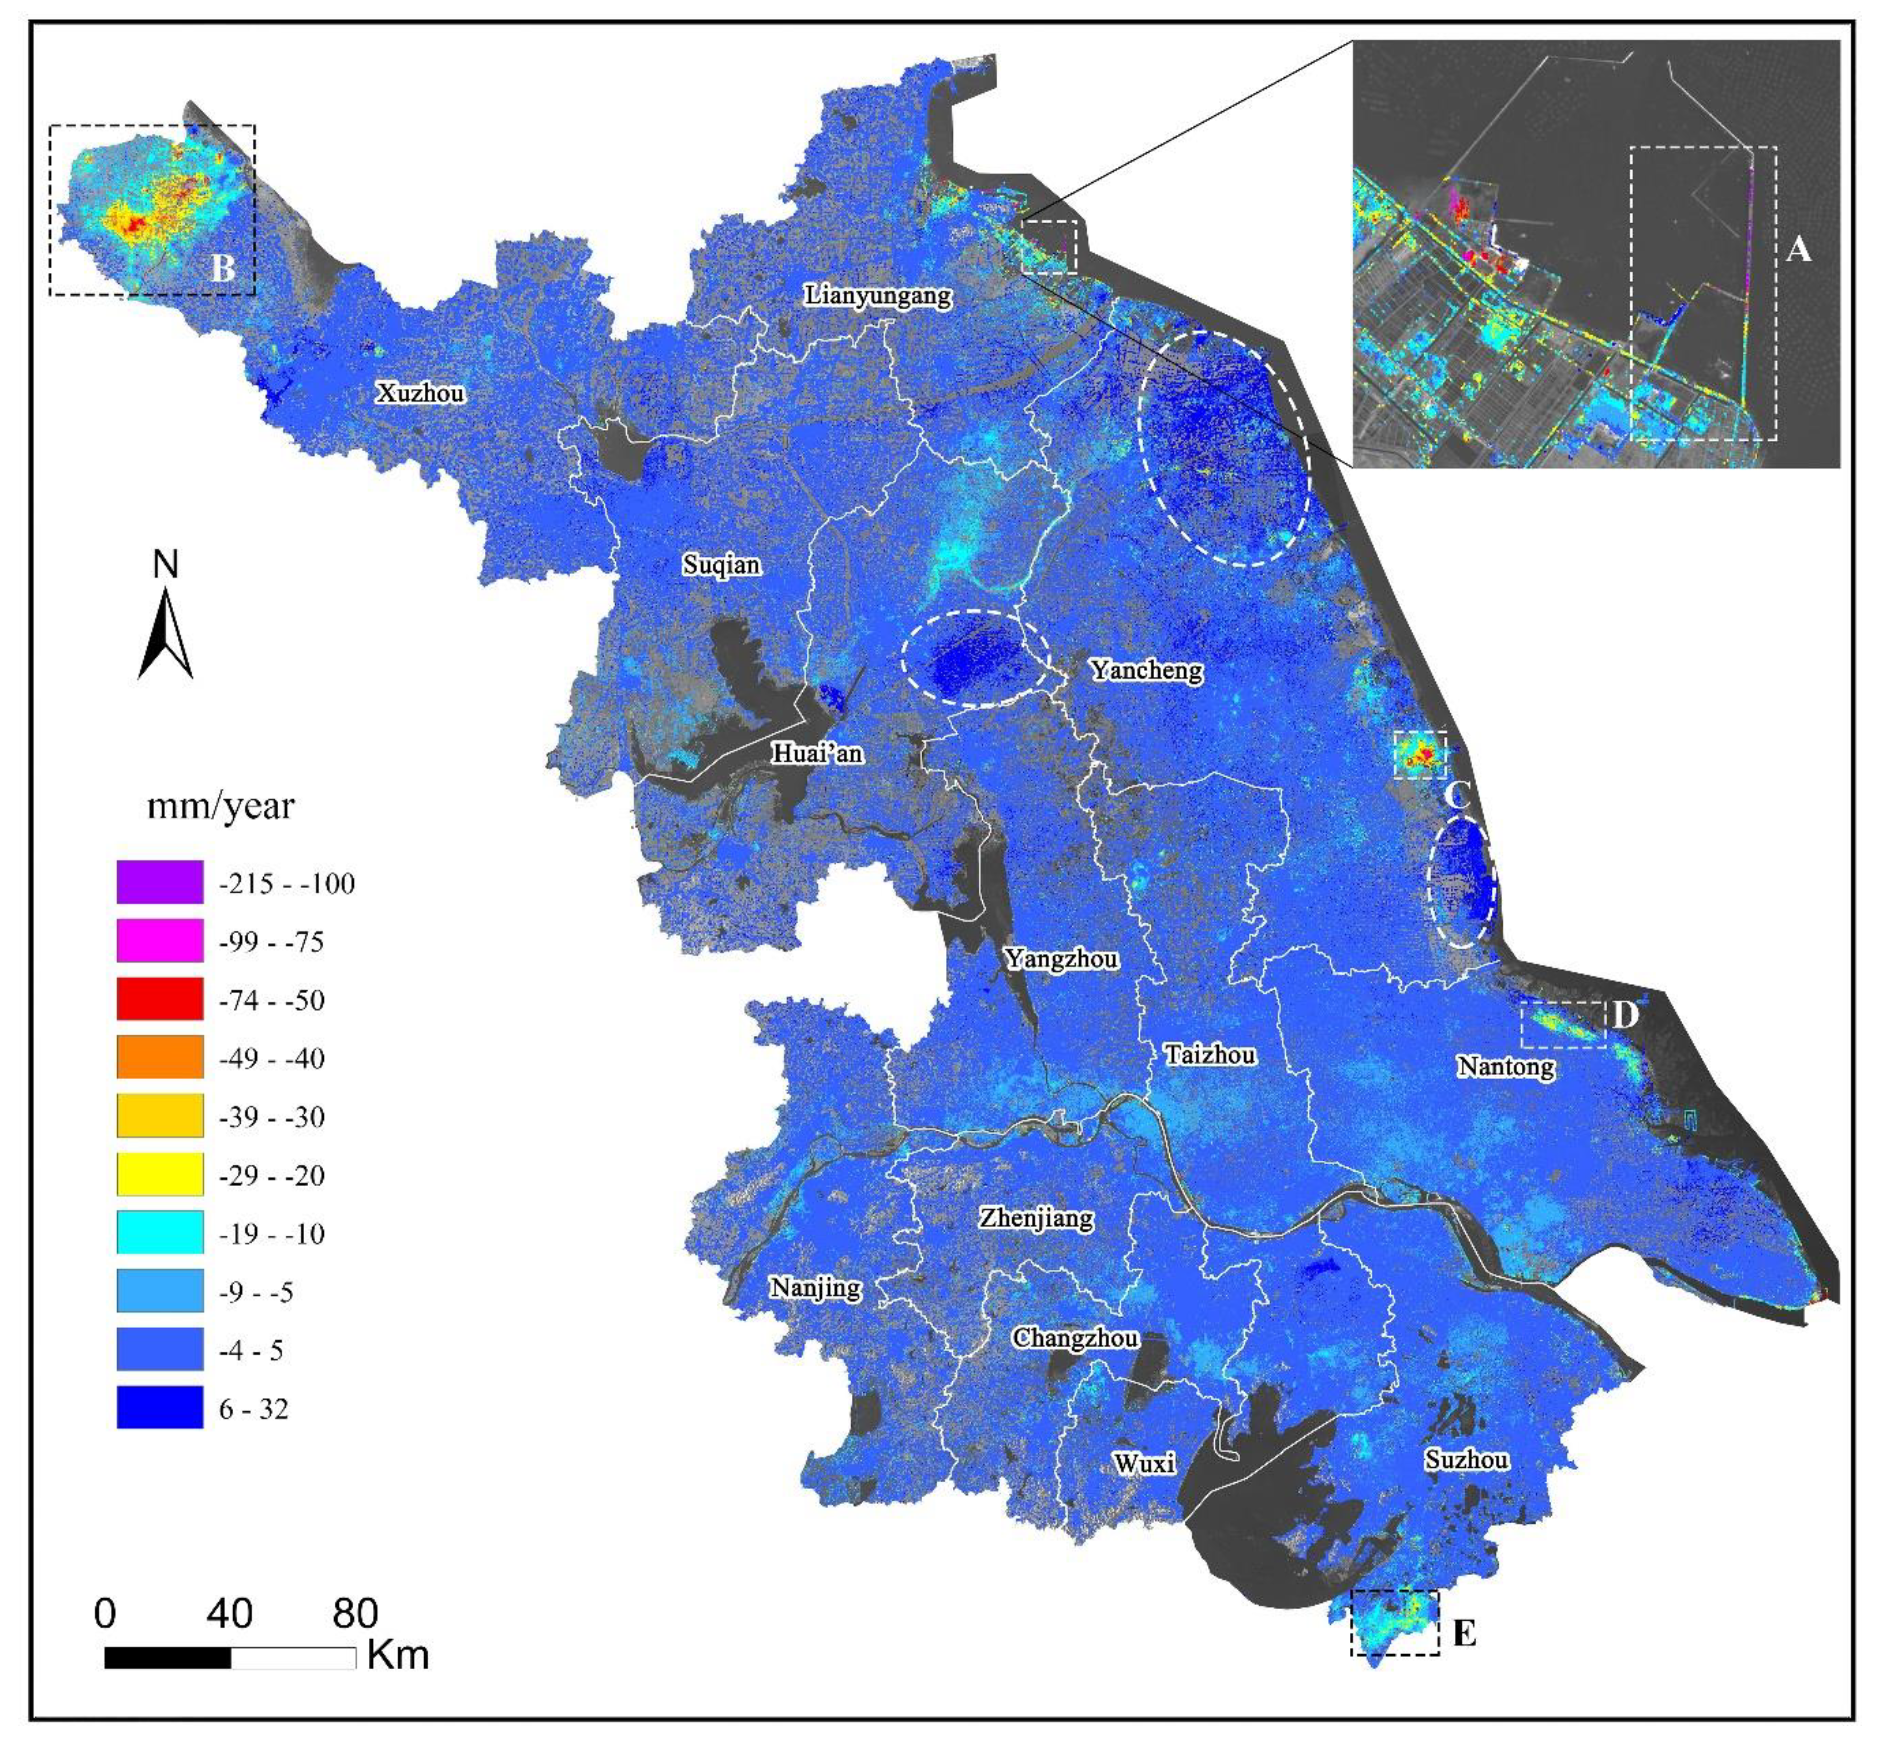
Figure 4 displays the resulting MSV mosaic over the full territory of Jiangsu province. The mosaic contains 9,276,214 CPs, or roughly 120 CPs in every square kilometer of non-water area. The largest subsidence rate was 215 mm/year, located at a newly constructed dock road in the Lianyungang port within zone A of Figure 4. The majority (around 82%) of the CPs have MSV in the range of [ 5 , 5 ] mm/year, which suggests that most Jiangsu territory were stable during the period of 2016 to 2018. 1,319,077 (14.22%) of the CPs encountered moderate subsidence with MSV in the range of [ 30 , 5 ] mm/year. There are 30,975 (0.33%) and 7934 (0.086%) CPs having severe subsidence with MSV in the range of [ 50 , 30 ] and [ 215 , 50 ] mm/year respectively. Major subsiding zones (zone A to E) with severe subsidence are marked out with dash-line rectangle in Figure 4. Each of these major subsiding zones is located within a region with moderate subsidence, which confirms that severe subsidence is a localized phenomenon. There are 313,005 (3.37%) CPs showing uplift with MSV in the range of [ 5 , 32 ] mm/year. Furthermore, 80% of the uplift CPs have MSV in the range of [ 5 , 10 ] mm/year, which suggests that ground uplift is local and slight. The histogram of these uplift CPs is shown in Figure 5. Three uplift concentration zones are marked by dash-line ellipse in Figure 4. The causes for ground uplift is not clear. A possible reason for inland uplift is the rise of groundwater level, such as the ellipse region in Huai’an prefecture. For uplift over the other two ellipse regions along the coast of Yancheng prefecture, possible causes include tide fluctuation and estimate errors induced by atmospheric artifacts. A field campaign was conducted between April and May of 2019 to collect on-site information of ground subsidence at the five subsiding zones.
Besides the MSV mosaic covering the full province, the subsidence time series of every CP is also generated. These two kinds of product (MSV and subsidence time series) complement each other. The MSV mosaic shows the spatial pattern of ground subsidence over the full province, while the subsidence time series describes the temporal evolution of ground subsidence at an individual CP.

3.2. Accuracy Evaluation

In this research, leveling measurements are the reference data for accuracy evaluation. In Jiangsu province, the majority of leveling campaigns are sponsored by prefecture-level governments, and not every prefecture has conducted leveling surveys. So, the point density, frequency and starting-ending date of conducted leveling campaigns vary by prefecture. We have collected 688 leveling measurements coming from four campaigns conducted in three prefectures: Changzhou, Nantong and Huai’an, to evaluate InSAR-derived MSV. Of the 688 leveling measurements, 527 are used for accuracy evaluation. The remainder are discarded because there were no CPs in the vicinity of the leveling points, that is, an 80m-radius circular neighborhood centered at the leveling point. For every used leveling point, a CP closest to the leveling point is located and its subsidence velocity is extracted from the subsidence time series according to the starting and ending dates of the leveling surveying. The statistics of the difference between leveling and InSAR subsidence velocity are listed in Table 2, which suggests a standard deviation of 3.9 mm/year over the 527 points.

4. Discussion

In this section, detailed analyses of the spatio-temporal features and causes of the five subsiding zones marked in Figure 4 are presented. The analyses are based on CP’s subsidence time series derived from the time series S-1 data, some historic optical images and the information collected during the field campaign. Understanding the factors driving the major subsiding processes is of great significance to guide the government’s response to fight against ground subsidence.

4.1. Subsidence Zone A

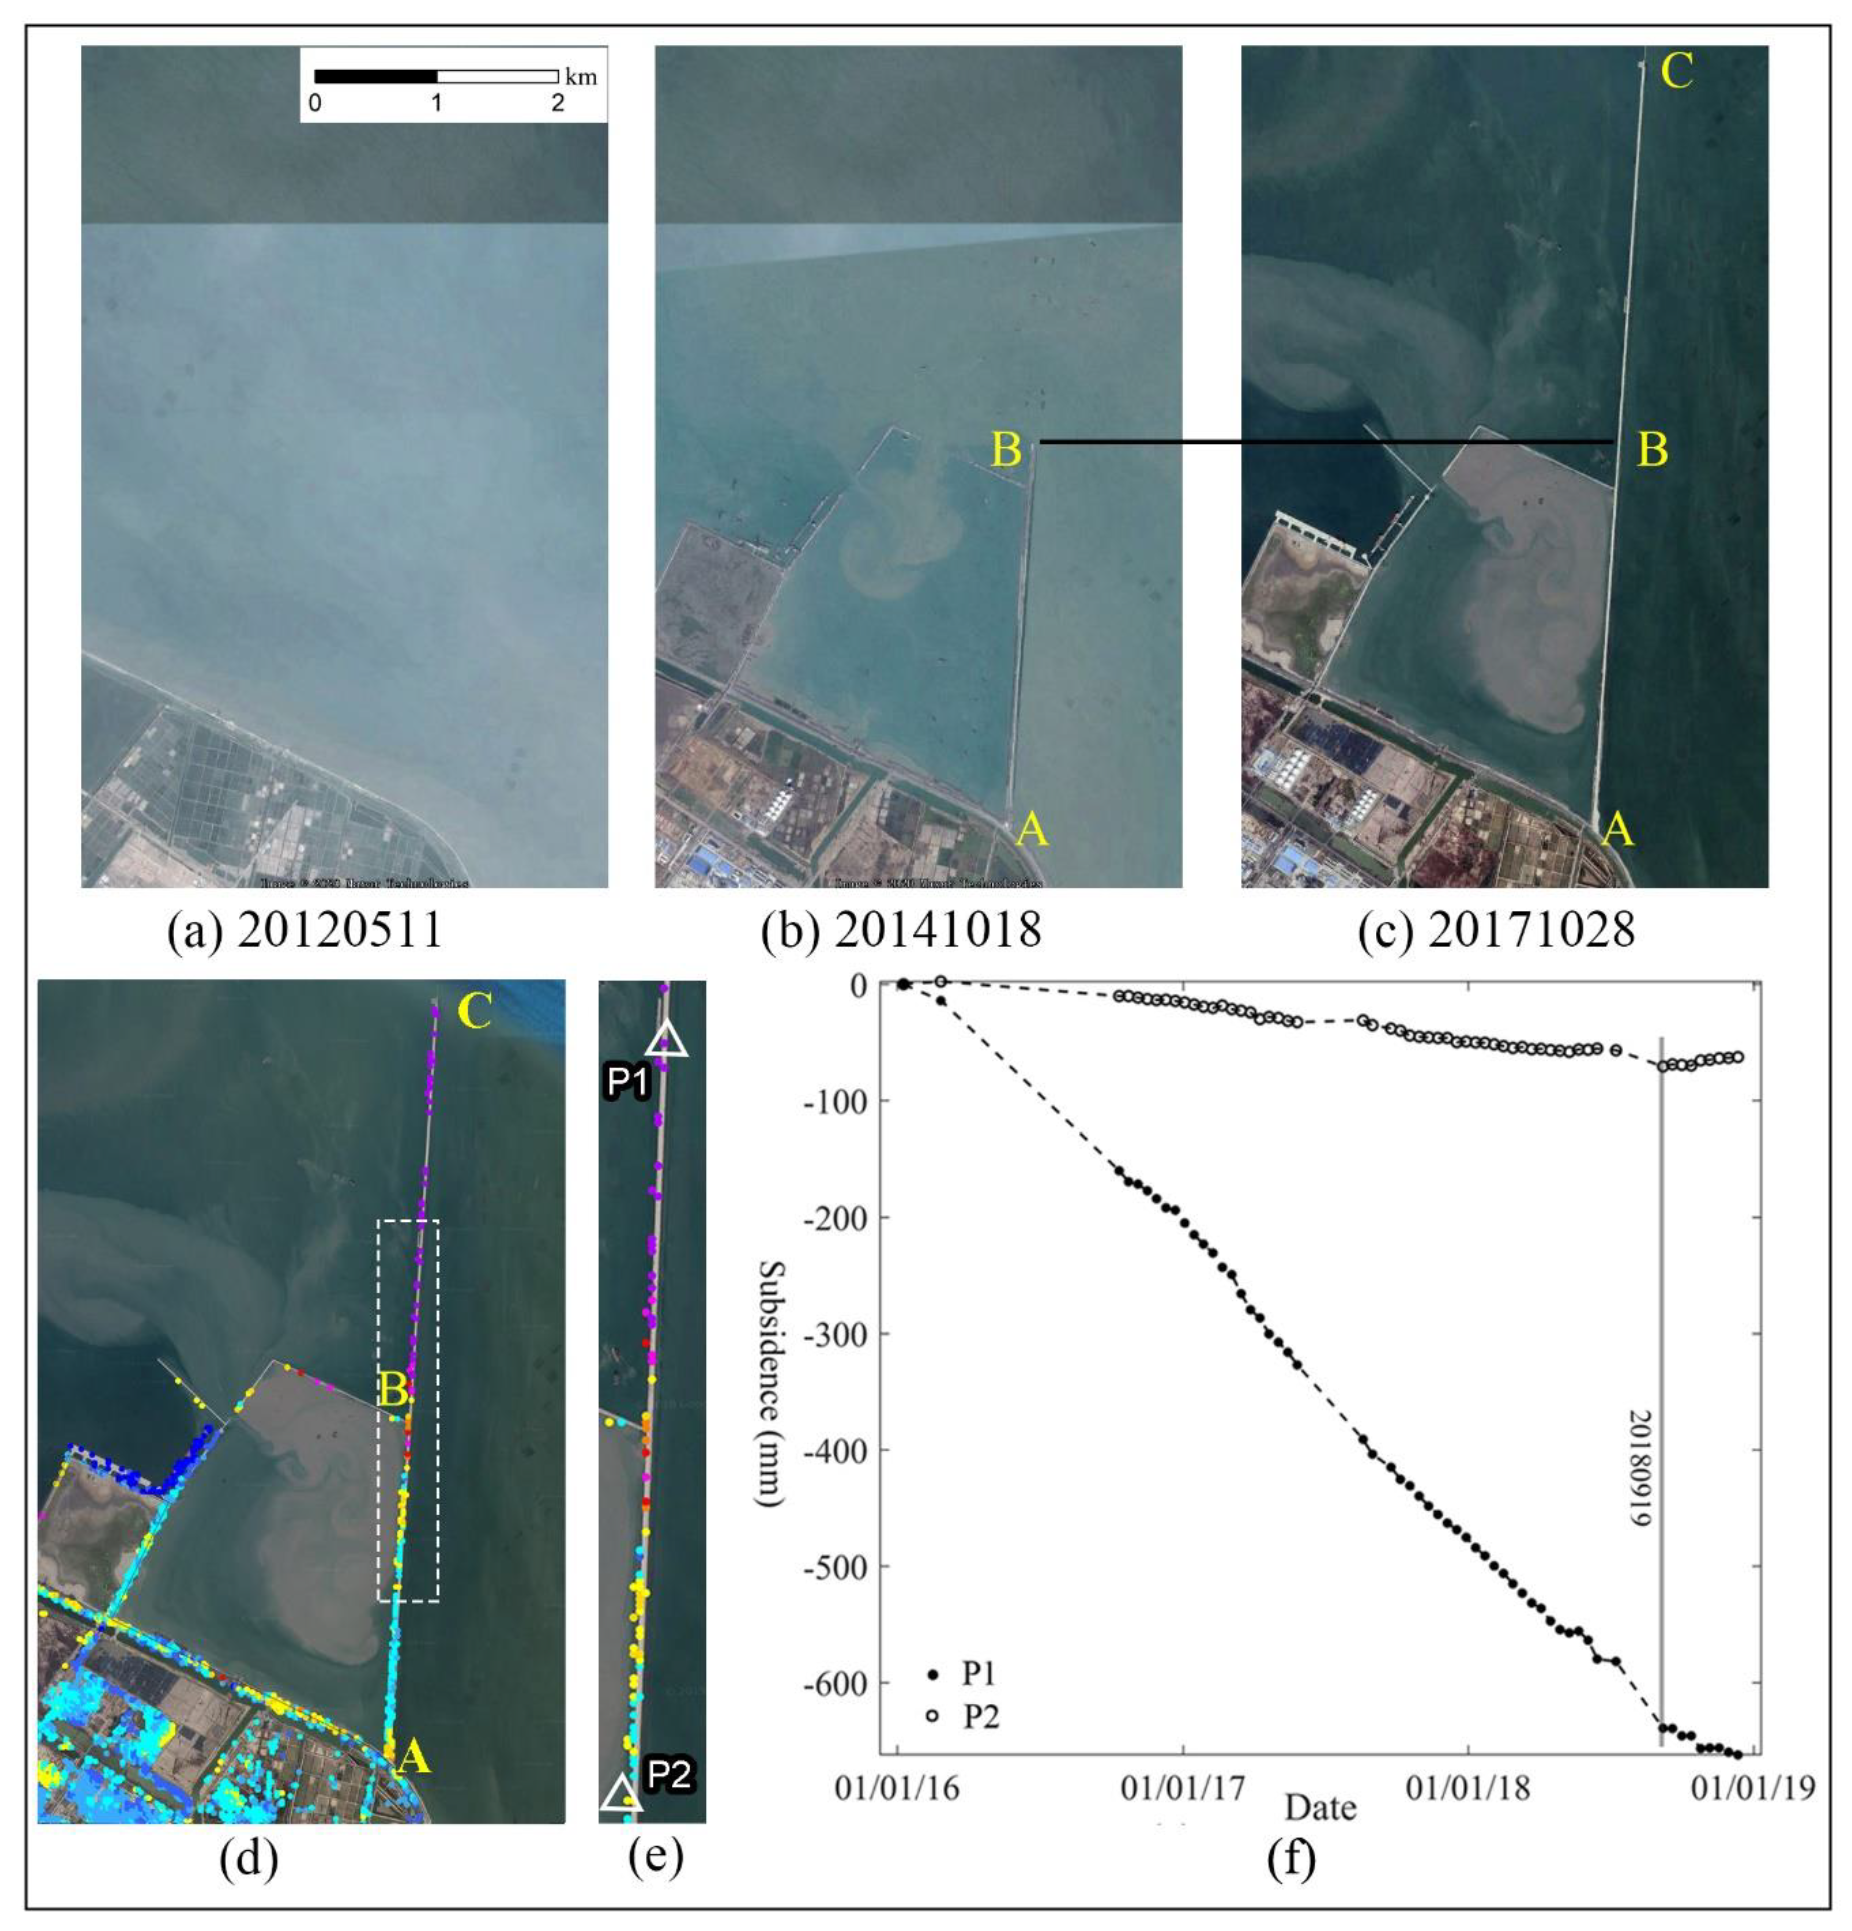
The largest MSV of the whole province took place along a dock road within zone A, which is a part of the expansion project of the Lianyungang port. From the historic optical images shown in Figure 6a–c, the harbor dock construction did not start until 11 May 2012. The AB section of the dock road was completed through marine reclamation before October 2014, and the BC section was reclaimed more recently, that is, between October 2014 and January 2016 when the first S-1 image in the stack was acquired. Therefore, the BC section has very large MSV, that is, in the range of [ 215 , 100 ] mm/year, while the AB section has a smaller MSV varying in the range of [ 80 , 8 ] mm/year. The subsidence time series of two CPs over the span of 9 January 2016 to 12 December 2018 are presented in Figure 6f. Please note, the date format used in the X-axis of subsidence curve plot is “dd/mm/yy”, and the date format in the images is “yyyymmdd,” where d, m and y stand for day, month and year respectively. P1 in section BC is the CP having the largest subsidence velocity in the MSV mosaic. Therefore, the subsidence curve of P1 in the period from January 2016 to September 2018 shows a very steep gradient. The curve of P2 in section AB also shows a steady subsidence tendency but with a much smaller slope. Moreover, we can observe an obvious subsidence slow-down for point P1 and small-scale uplift for point P2 after 18 September 2018. The temporal characteristics of subsidence along the dock road is similar with the deformation detected over reclaimed land at Xiamen New Airport [20] and at the Lingang New City area of Shanghai [27]. According to Jiang and Lin [28], ground deformation associated with land reclamation can be well explained by the Terzaghi theory of consolidation [29], and typically will undergo two stages: a primary consolidation stage characterized by rapid ground subsidence with subsidence rate decreasing with the passage of time, and a second long-term compression stage with much slower subsidence rate. Therefore, it can be inferred that subsidence along the dock road in Zone A is induced by reclamation consolidation, and very likely the BC section is in late part of the primary consolidation stage, while the AB section is in the second compression stage.

4.2. Subsidence Zone B

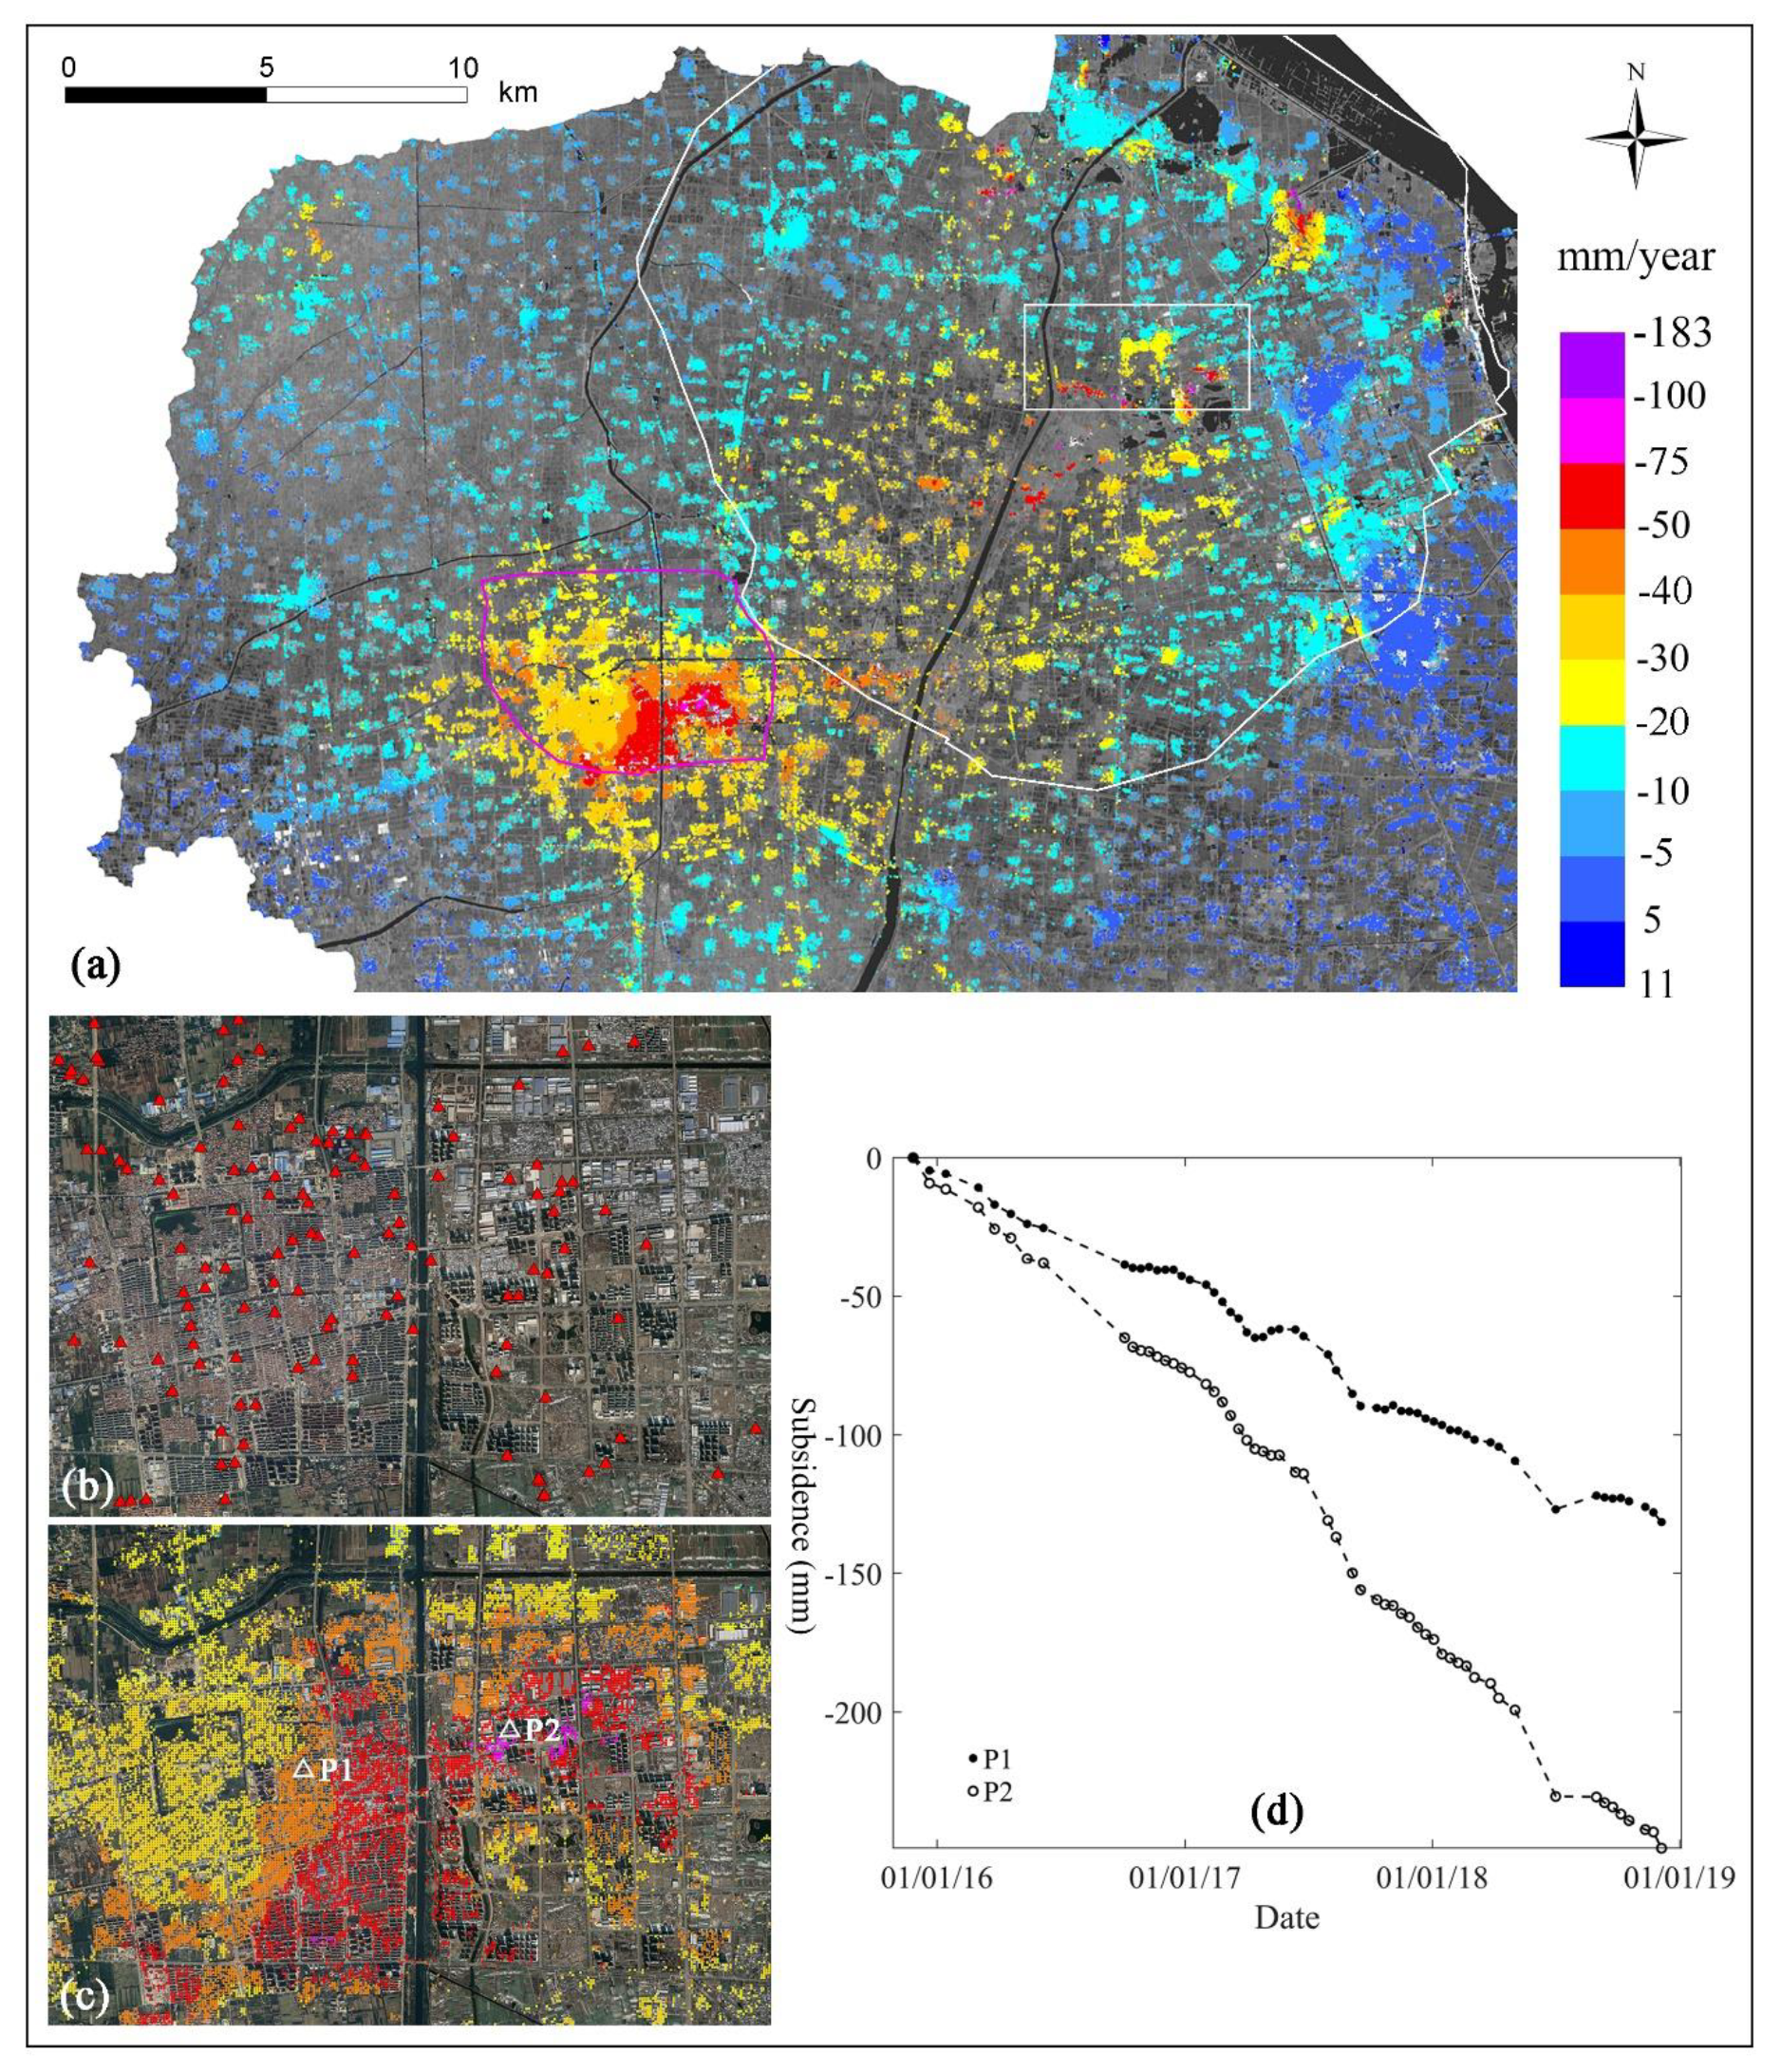
Zone B is located in the northwest area of the Xuzhou prefecture. The enlarged MSV of zone B is shown in Figure 7a. Severe subsidence took place in two distinct areas, which are outlined by a purple-line polygon and a white-line polygon in Figure 7a, respectively. The purple-line polygon corresponds to the urban area of Feng county, which is the only urban region within Zone B. The Xuzhou prefecture is one of China’s coal production centers, and the majority of active underground coal-mining fields are within the white-line polygon region. The northern part of Xuzhou prefecture has suffered freshwater shortage since the 1980s. As a result, the urban area of Feng county has many wells, as shown in Figure 7b, to support the daily water consumption of the inhabitants. The corresponding MSV is shown in Figure 7c and is in the range of [ 89 , 20 ] mm/year. We can observe a distinct spatial correlation between well distributions and ground subsidence occurrences. Moreover, the subsidence time series of two CPs: P1 and P2 marked by triangles in Figure 7c is shown in Figure 7d. Generally, the subsidence curves show steady tendency of ground subsidence, which can be explained by the steady groundwater consumption of daily life. Some small-scale oscillations are observed in both of the subsidence curves, which are very likely linked with variations of rainfall. As a summary, it can be inferred that groundwater withdrawal is the main factor accounting for the subsidence over the Feng county urban area.
The underground coal mining region marked in Figure 7a is a rural landscape featured by farmlands and sparsely distributed villages. In order to avoid damages to village buildings, the working panels (WPs) of underground mining are restricted beneath farmland patches. There are four coal mining WPs within this AOI with the parameters listed in Table 3. In this region, winter wheat is usually sowed before the end of October and reaped around the next June, then corn or rice is planted during the summer season from June to early October. An enlarged MSV image over the rectangle AOI marked in Figure 7a is shown in Figure 8a with an optical image as background. An on-site photo taken on 8 May 2019 (Figure 8b) shows the growing winter wheat on the ground above WP 74,101.
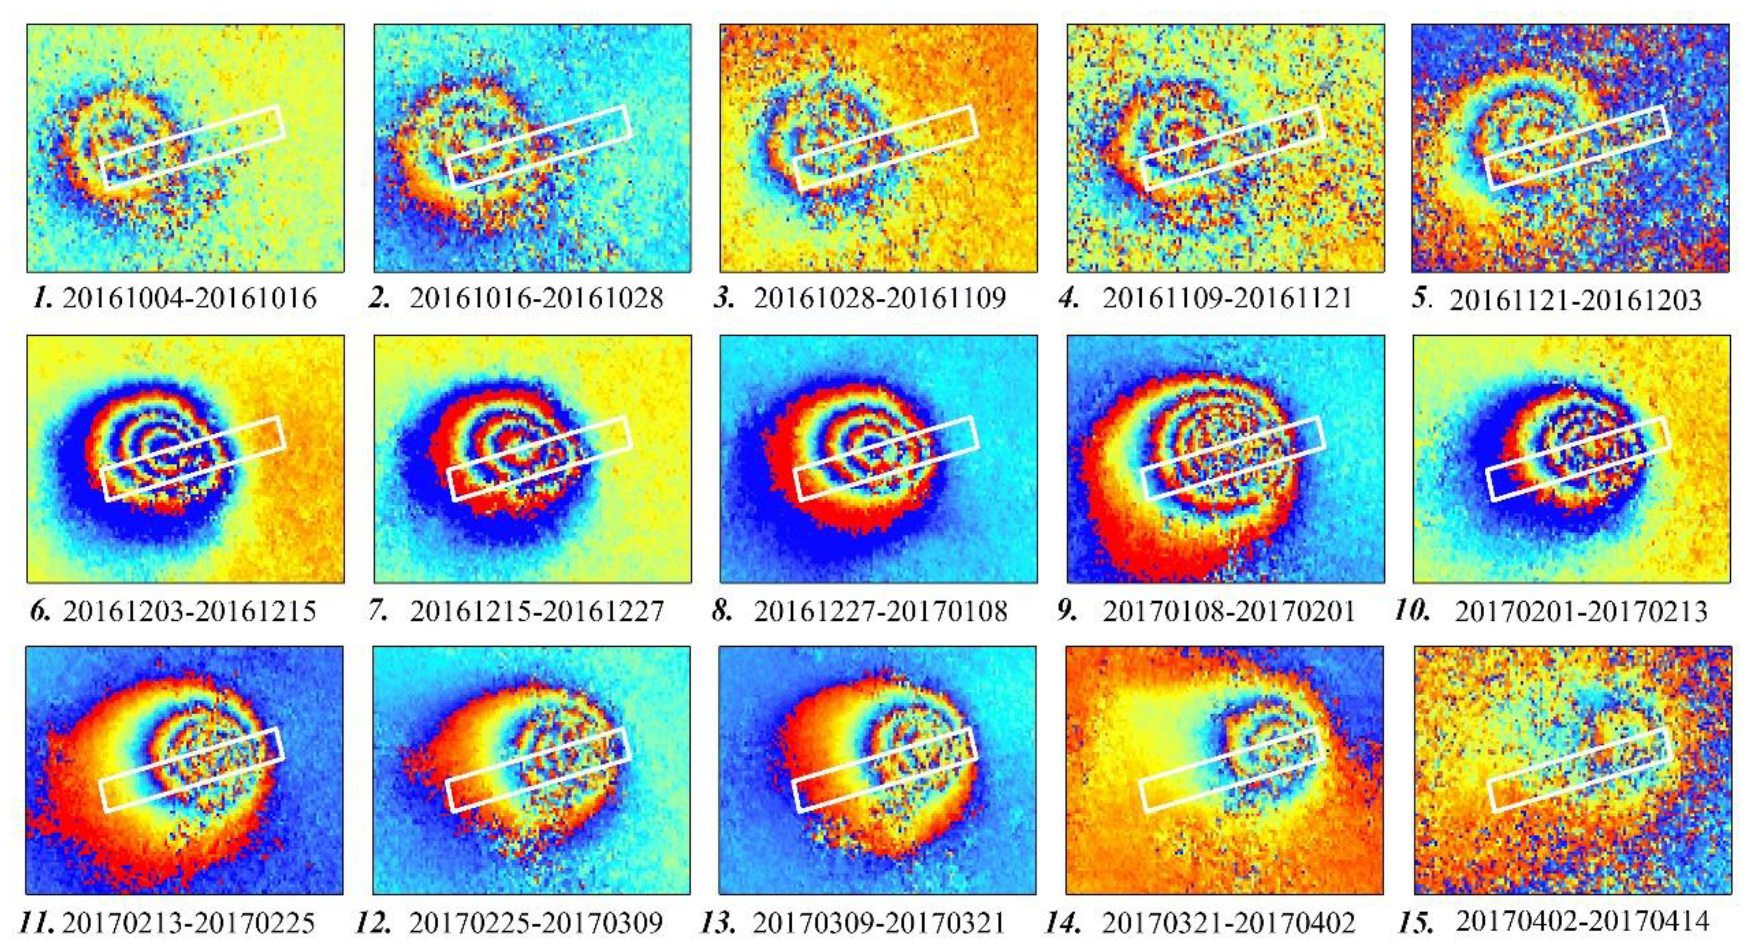
The frequent land-cover changes on farmland patches makes it nearly impossible to extract CPs there, and CPs only exist on some man-made targets, like power poles and buildings. Therefore, subsidence information is missed over a large part of ground above WPs in the MSV map as illustrated in Figure 8a. Fortunately, we found that S-1 interferograms with 12-day and/or 24-day separation can keep good coherence when both images are acquired in the period between October and the next March when the ground is bare or the sowed wheat is in its early growing stage. 15 consecutive 12-day interferograms over the region of WP 92,606 in the period of 4 October 2016 to 14 April 2017 are shown in Figure 9. It can be observed from the moving deformation fringes that the underground tunneling had advanced from west to east along the strike direction of the coal seam. These 12-day and 24-day interferograms with good coherence can be reliably phase-unwrapped. Then the LOS deformation related to individual SAR acquisition can be calculated under the least squares principle by linking all of the unwrapped phases. Using this method, the accumulative deformations of the four WPs in the two coherent periods: from 16 October 2016 to 21 March 2017 and from 23 October 2017 to 4 March 2018, are calculated and shown in Figure 8c,d respectively. From Figure 8c, the largest accumulative deformation of WP 92,606 within the first coherent period (from 16 October 2016 to 21 March 2017) reaches 670 mm with underground extraction in progress. At the same time, there is no deformation over the areas of WP 74,102 and 93,604 because the coal extraction had not yet started during the first coherent period. It can be inferred that the ground deformation highly coincide temporally with mining operations, and can reach hundreds to thousands of millimeters in several months. Ground deformation could be observed even after mining activities end, as suggested by a small-scale deformation field appeared on the upper-left side of WP 74,101 in Figure 8d. Therefore, ground deformations associated with underground mining are strongly nonlinear during the whole study period of January 2016 to December 2018, and may not be correctly retrieved by the linear phase model. As a further illustration, deformation time series of 6 points (P1, P1*, P2, P3, P4, P5) are given in Figure 10, whose locations are marked by triangles in Figure 8a,c,d respectively. From Figure 10a, although P1 and P1* refer to the same location, the deformation calculated with the least square method over the first coherent period (P1* curve) is obviously larger than that from time series processing (P1 curve). This confirms that deformation caused by underground mining could be underestimated by time series InSAR analysis for the whole study period. On the other side, the curves at P2, P3, P4 and P5 in Figure 10b demonstrate that the magnitude of deformation triggered by active underground mining is usually very large. In summary, the deformation information in this underground mining region is missed spatially due to the lack of CPs, and underestimated in magnitude due to the temporal uneven of mining operations.

4.3. Subsidence Zone C

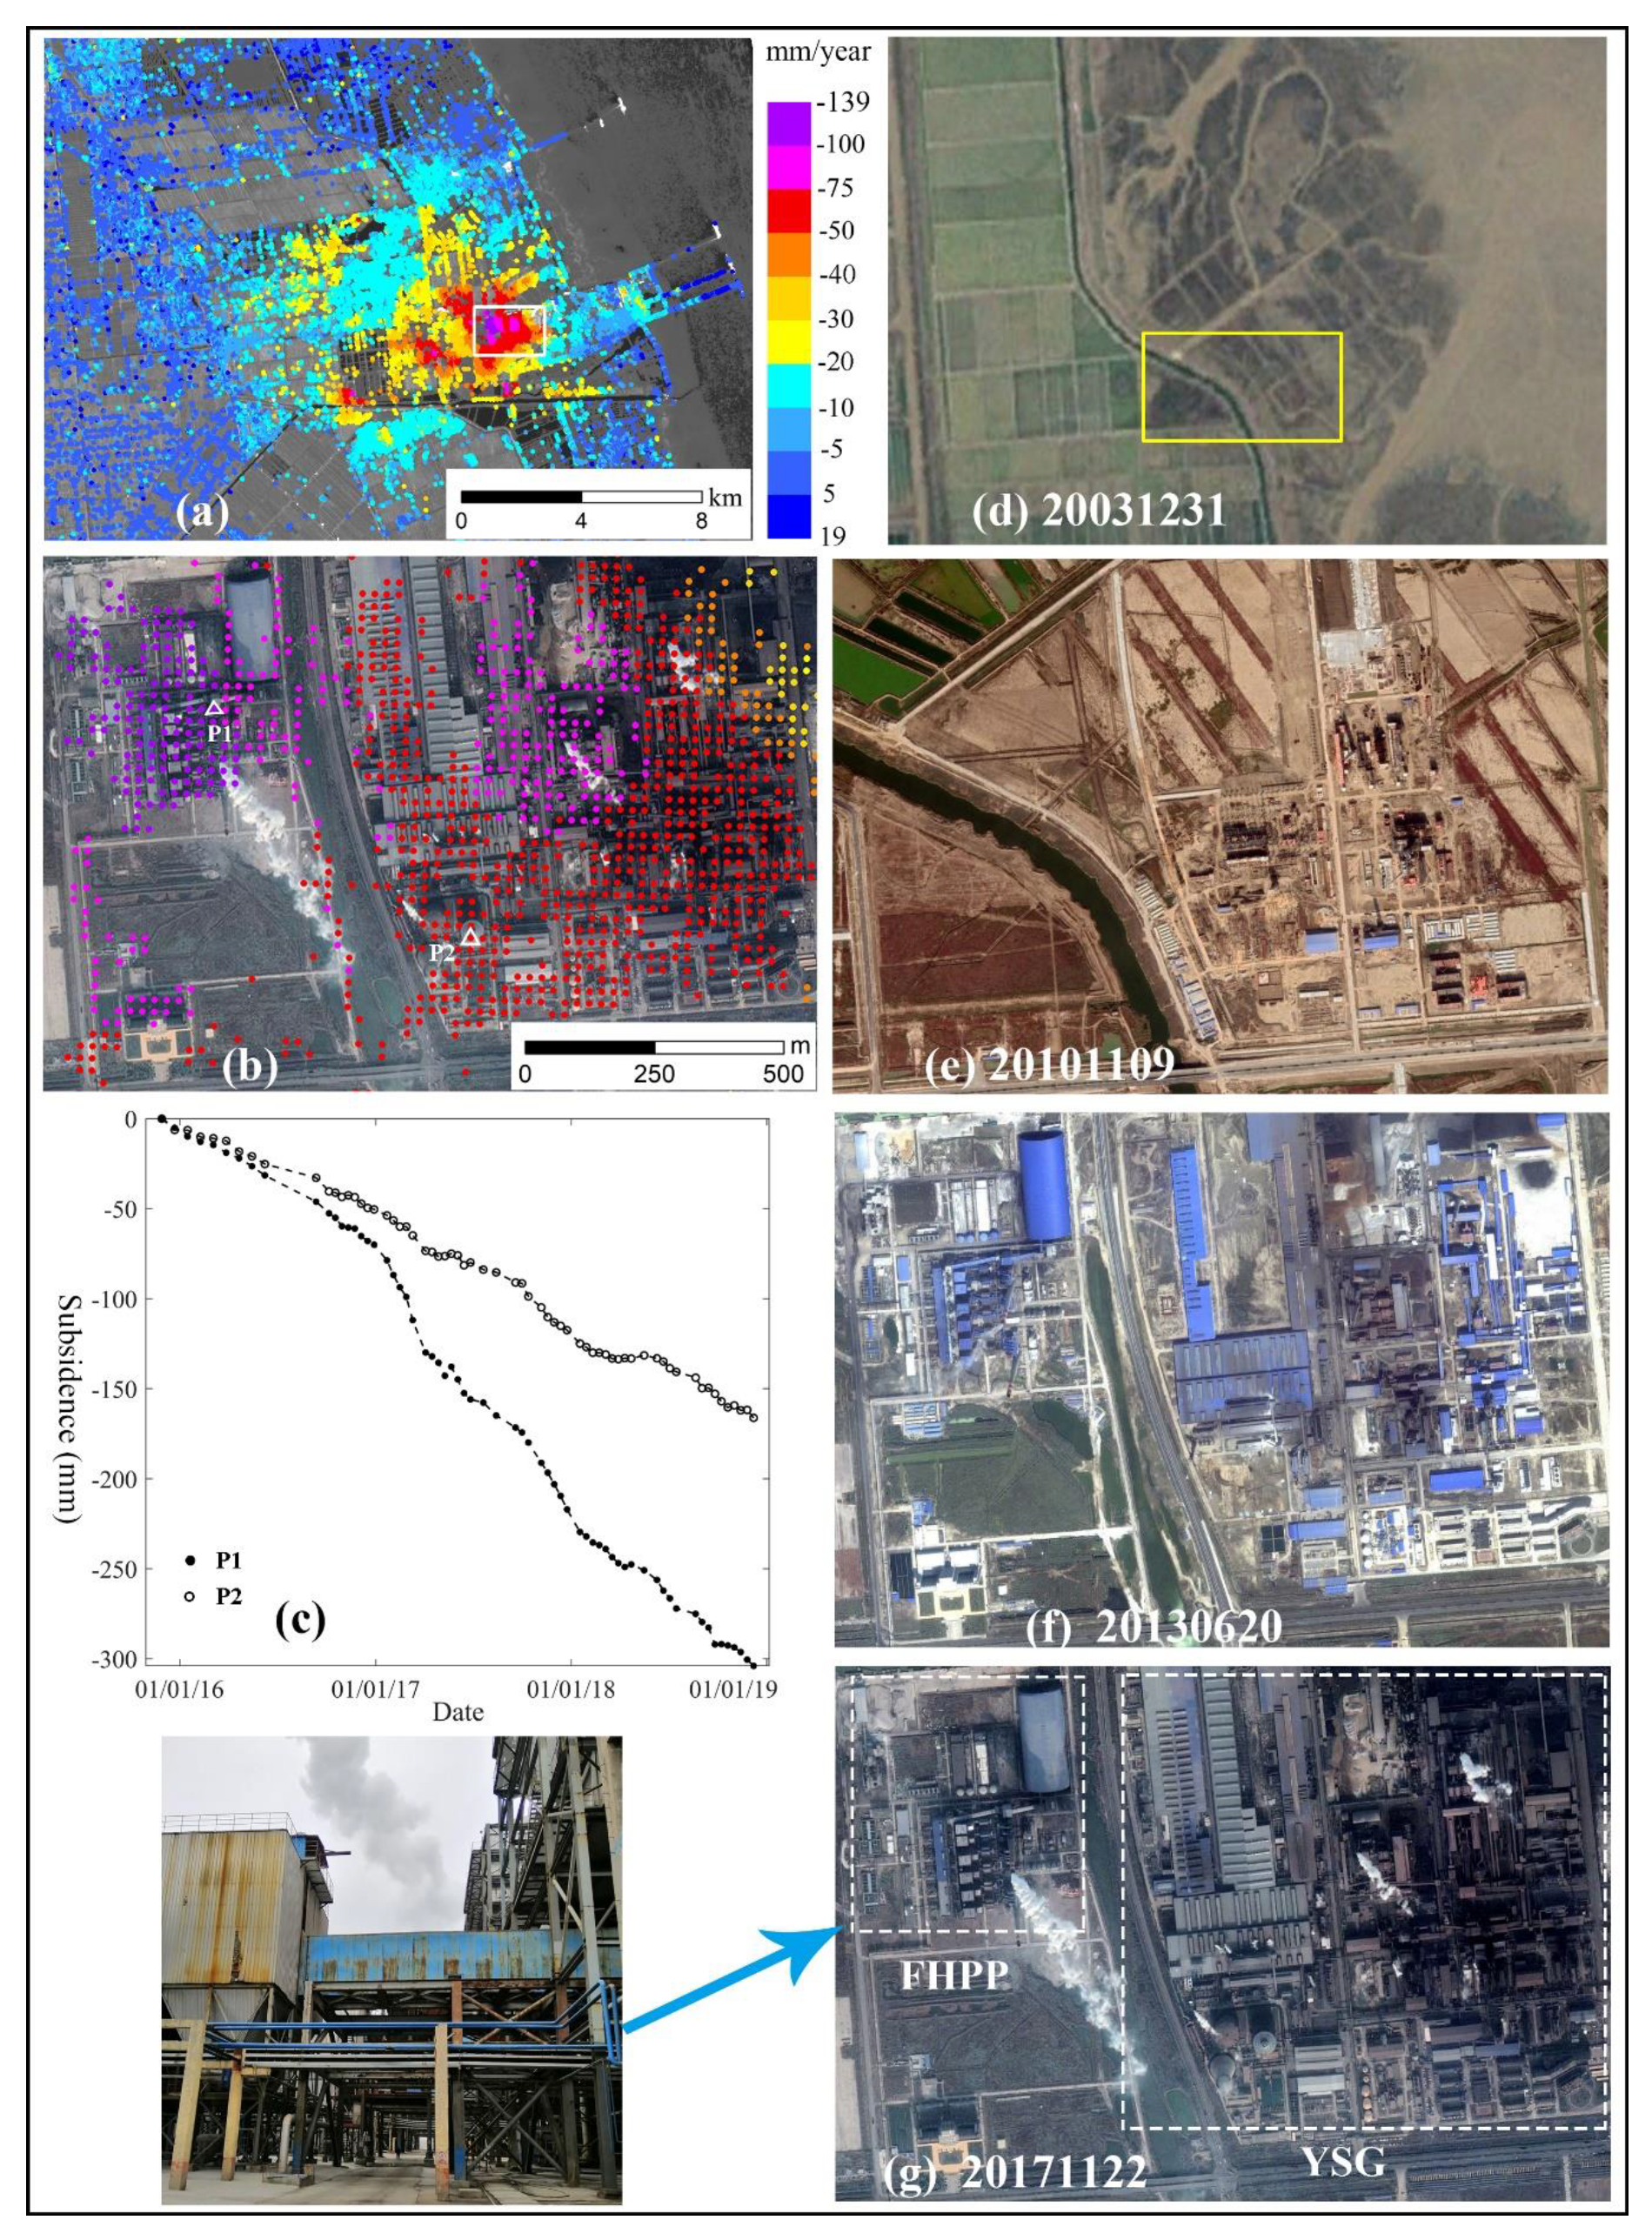
Zone C is located in middle-south coast area of the Yancheng prefecture. The enlarged view of MSV is shown in Figure 11a. The MSV map within the white-rectangle AOI is furthered enlarged and shown in 11b with a high-resolution optical image as the background. The MSV value of Figure 11b is in the range of [−139, −21] mm/year. Four historical optical images corresponding to the AOI are given in Figure 11d–g. Dramatic land use changes have taken place. Paddy land and muddy beach areas in 2003, as shown in Figure 11d, had been transformed by 2017 into the industrial districts of the Fengyuan heating and power plant (FHPP) and the Yancheng steel group (YSG) respectively, as shown in Figure 11g. The subsidence time series of two CPs, one located in FHPP and another in YSG, are presented in Figure 11c. In the lower-left corner, an on-site photo taken on 21 May 2019 shows some large steel structures within FHPP. From historical images, it is certain that the heavy load of industrial equipment and buildings loaded on soft soil layers has contributed to the large-magnitude ground subsidence. However, there is no clear signal of subsidence rate slowing down with the passage of time in the subsidence evolution curves shown in Figure 11c, which is a key feature for ground subsidence merely driven by soil consolidation. Moreover, YSG and FHPP both should have great demand for freshwater supply, although we did not find any evidence of pumping out groundwater in this district during the field investigation. Therefore, it can be concluded that consolidation of underlying soft layer is certainly a cause for ground subsidence in zone C, and possibly groundwater withdrawal is another contributor.

4.4. Subsidence Zone D

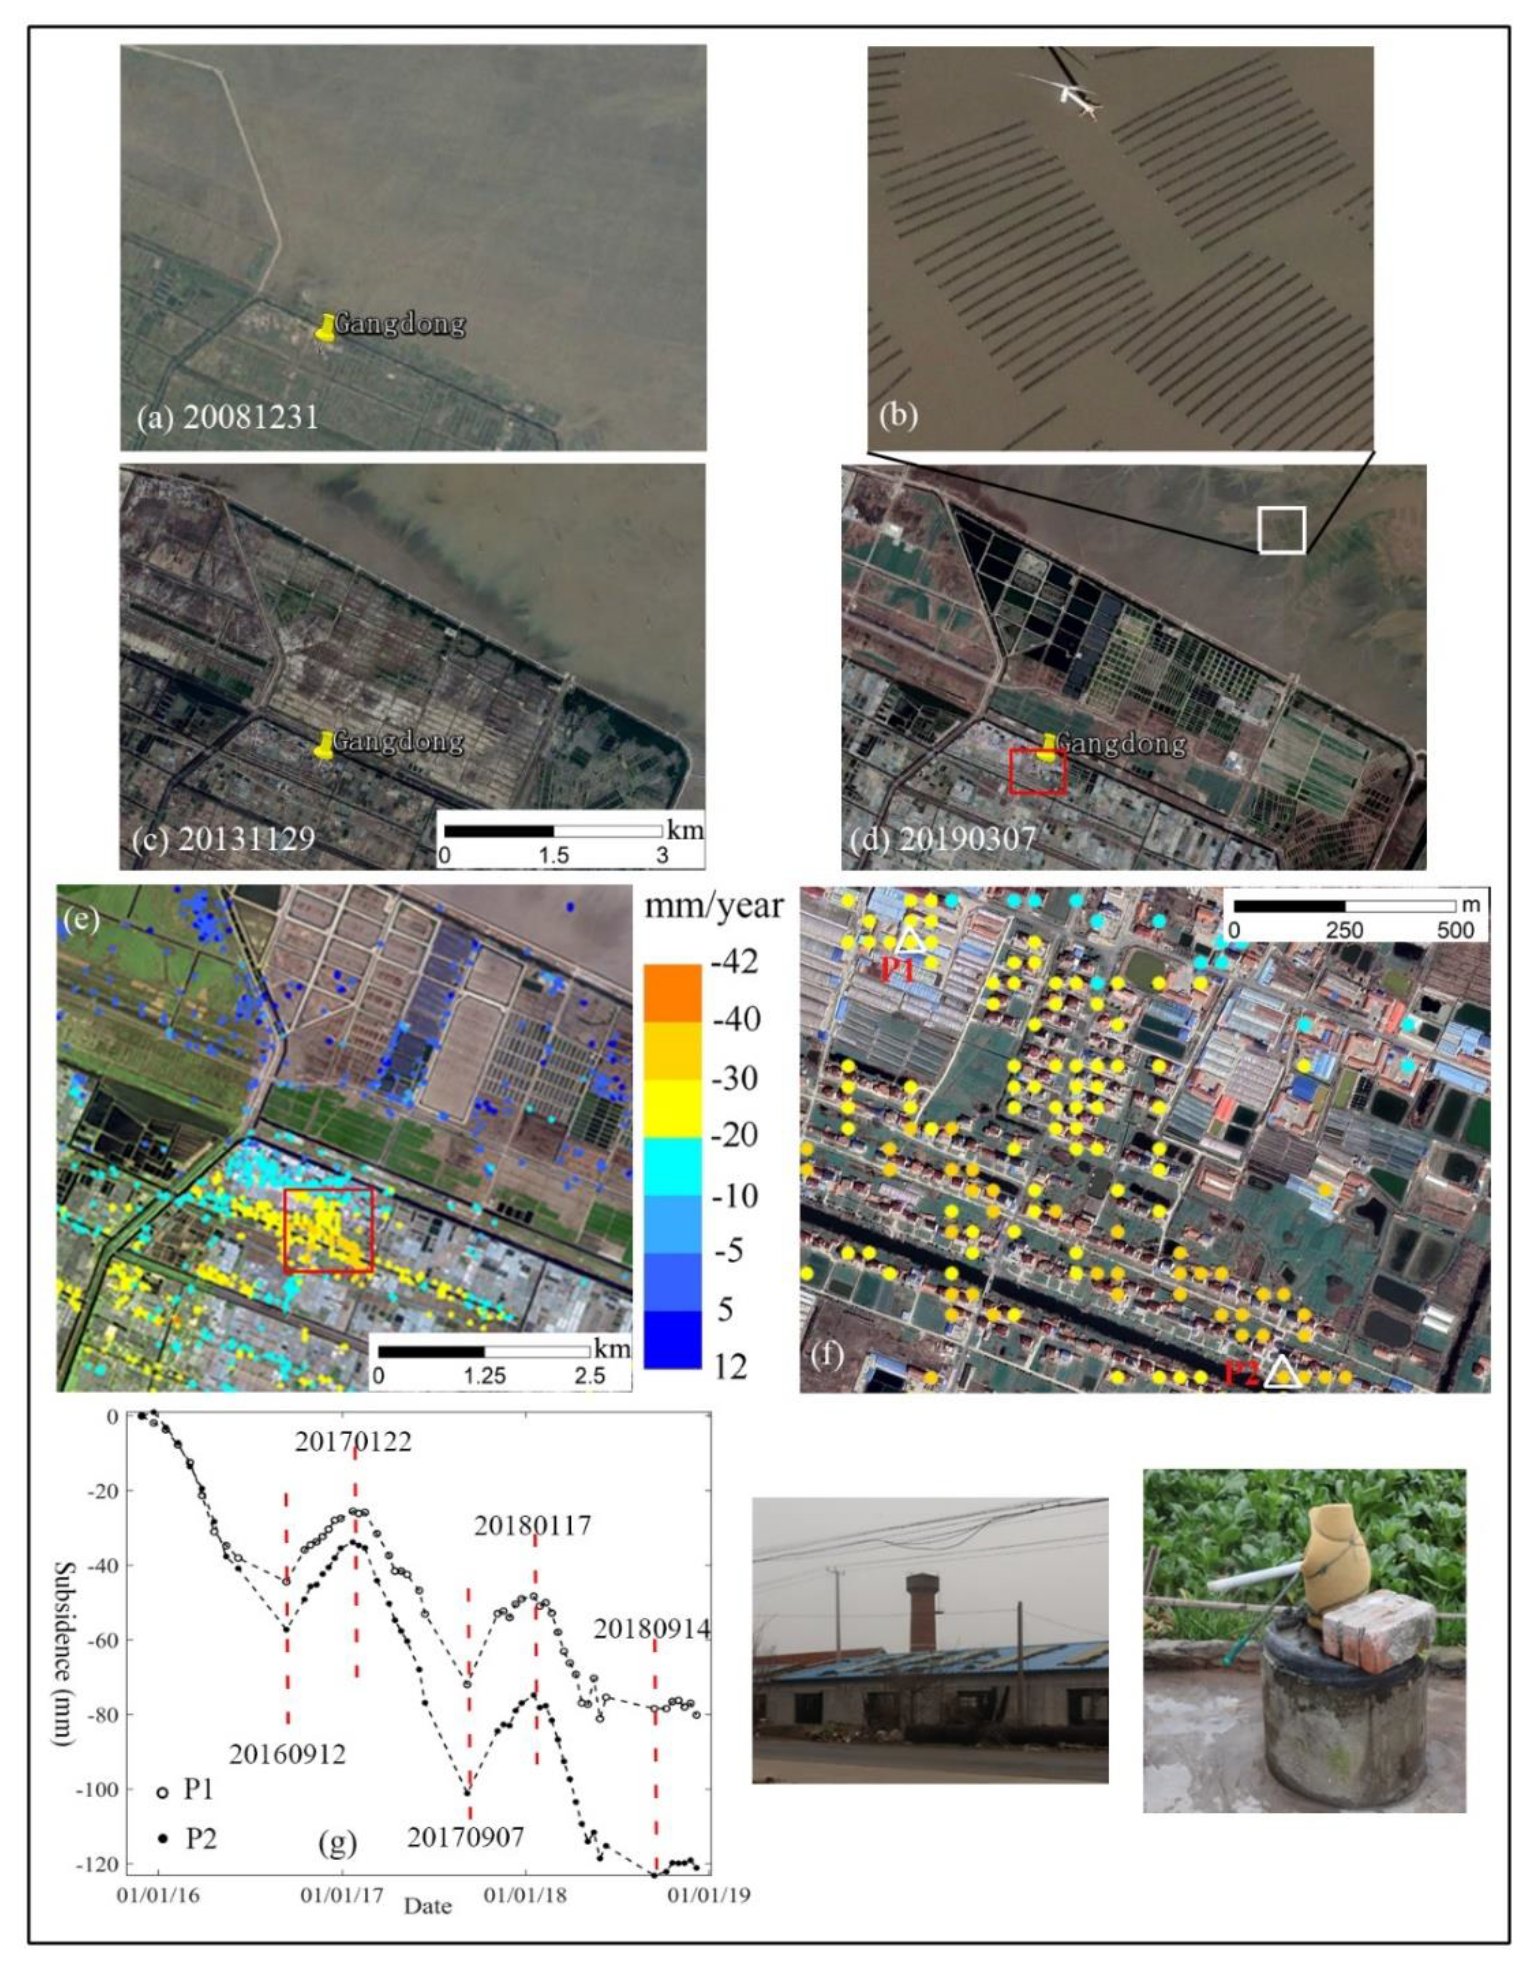
Subsidence zone D is located in the coast region of Rudong county, Nantong prefecture. Three historical optical images acquired on 31 December 2008, 28 November 2013 and 7 March 2019 over a portion of zone D are shown in Figure 12a,c,d respectively. The enlarged view of the white-line AOI in (d) is shown in (b), where numerous rafts used for cultivating laver in sea water are visible. The off-shore region of Rudong county is the largest laver production base in China, accounting for 40% of the nation’s annual laver yield [30]. Usually the harvest period of laver is from December to the next May. From Figure 4, we can observe a clear subsiding belt along the coast region, where the MSV value are in the range of [−31, −20] mm/year. A zoom-in view of the MSV over the red-line AOI in Figure 12d is shown in Figure 12e. To the right side of Figure 12e, two on-site photos taken within the AOI during the field campaign show a water tower and a family-use well respectively. Under a water tower there is usually a motor-pumped well which extracts much larger amounts of groundwater than a family-use well. There are many water towers and wells distributed in this region. We interviewed several local inhabitants during the field campaign, and were told that the water towers were mainly used to pump out groundwater for cleaning the laver during the harvest season and the family-use wells were used to provide fresh water for daily life of the inhabitants at all time of a year. In order to investigate the linkage between laver culture and ground subsidence, the subsidence time series of two CPs marked in Figure 12e having a MSV of −30 mm/year and −20 mm/year respectively are shown in Figure 12f. The curve of both CPs can be divided as a subsidence stage from January to September followed by an uplift stage from September to the next January during each year. This annually repeated temporal pattern can be well explained by the laver cultivation stages. The laver harvest season started in December, so large amount of groundwater was pumped out for cleaning laver starting from December and this process lasted until the next June to July, one or two months after the harvest ended in May. Therefore, we observe a subsiding period of January to early September assuming an approximate one-month time lag between groundwater withdrawal and ground subsidence [31]. Furthermore, July and August are the months usually having the largest volume of rainfall in Jiangsu province. At the same time, there is no need to pump groundwater for cleaning laver, because the harvest season already ended in May. As a consequence, the groundwater level would rebound then due to the double effect of rainfall increase and groundwater consumption decrease. Therefore, ground uplift is observed in the period of September to the next January. From the evolution curve of ground subsidence, it can also be inferred that the intensity of groundwater extraction (volume of groundwater extracted within a period) for laver cleaning is much larger than that for daily life. Moreover, there is a reduction of the rebound at the end of the monitored period in the curve of both CPs in Figure 12f. A possible explanation is that groundwater withdrawal associated with laver production was controlled in 2018. This has also been confirmed by local inhabitants during the field investigation. We were told that the scale of laver production decreased in 2018 than in 2017 because the local government noticed the damages to buildings caused by large ground subsidence and decided to shut down some laver production sites in 2018 in order to reduce groundwater extraction. In summary, ground subsidence along the coast region of Rudong county is caused by groundwater withdrawal and dominated by groundwater consumption associated with laver production.

4.5. Subsidence Zone E

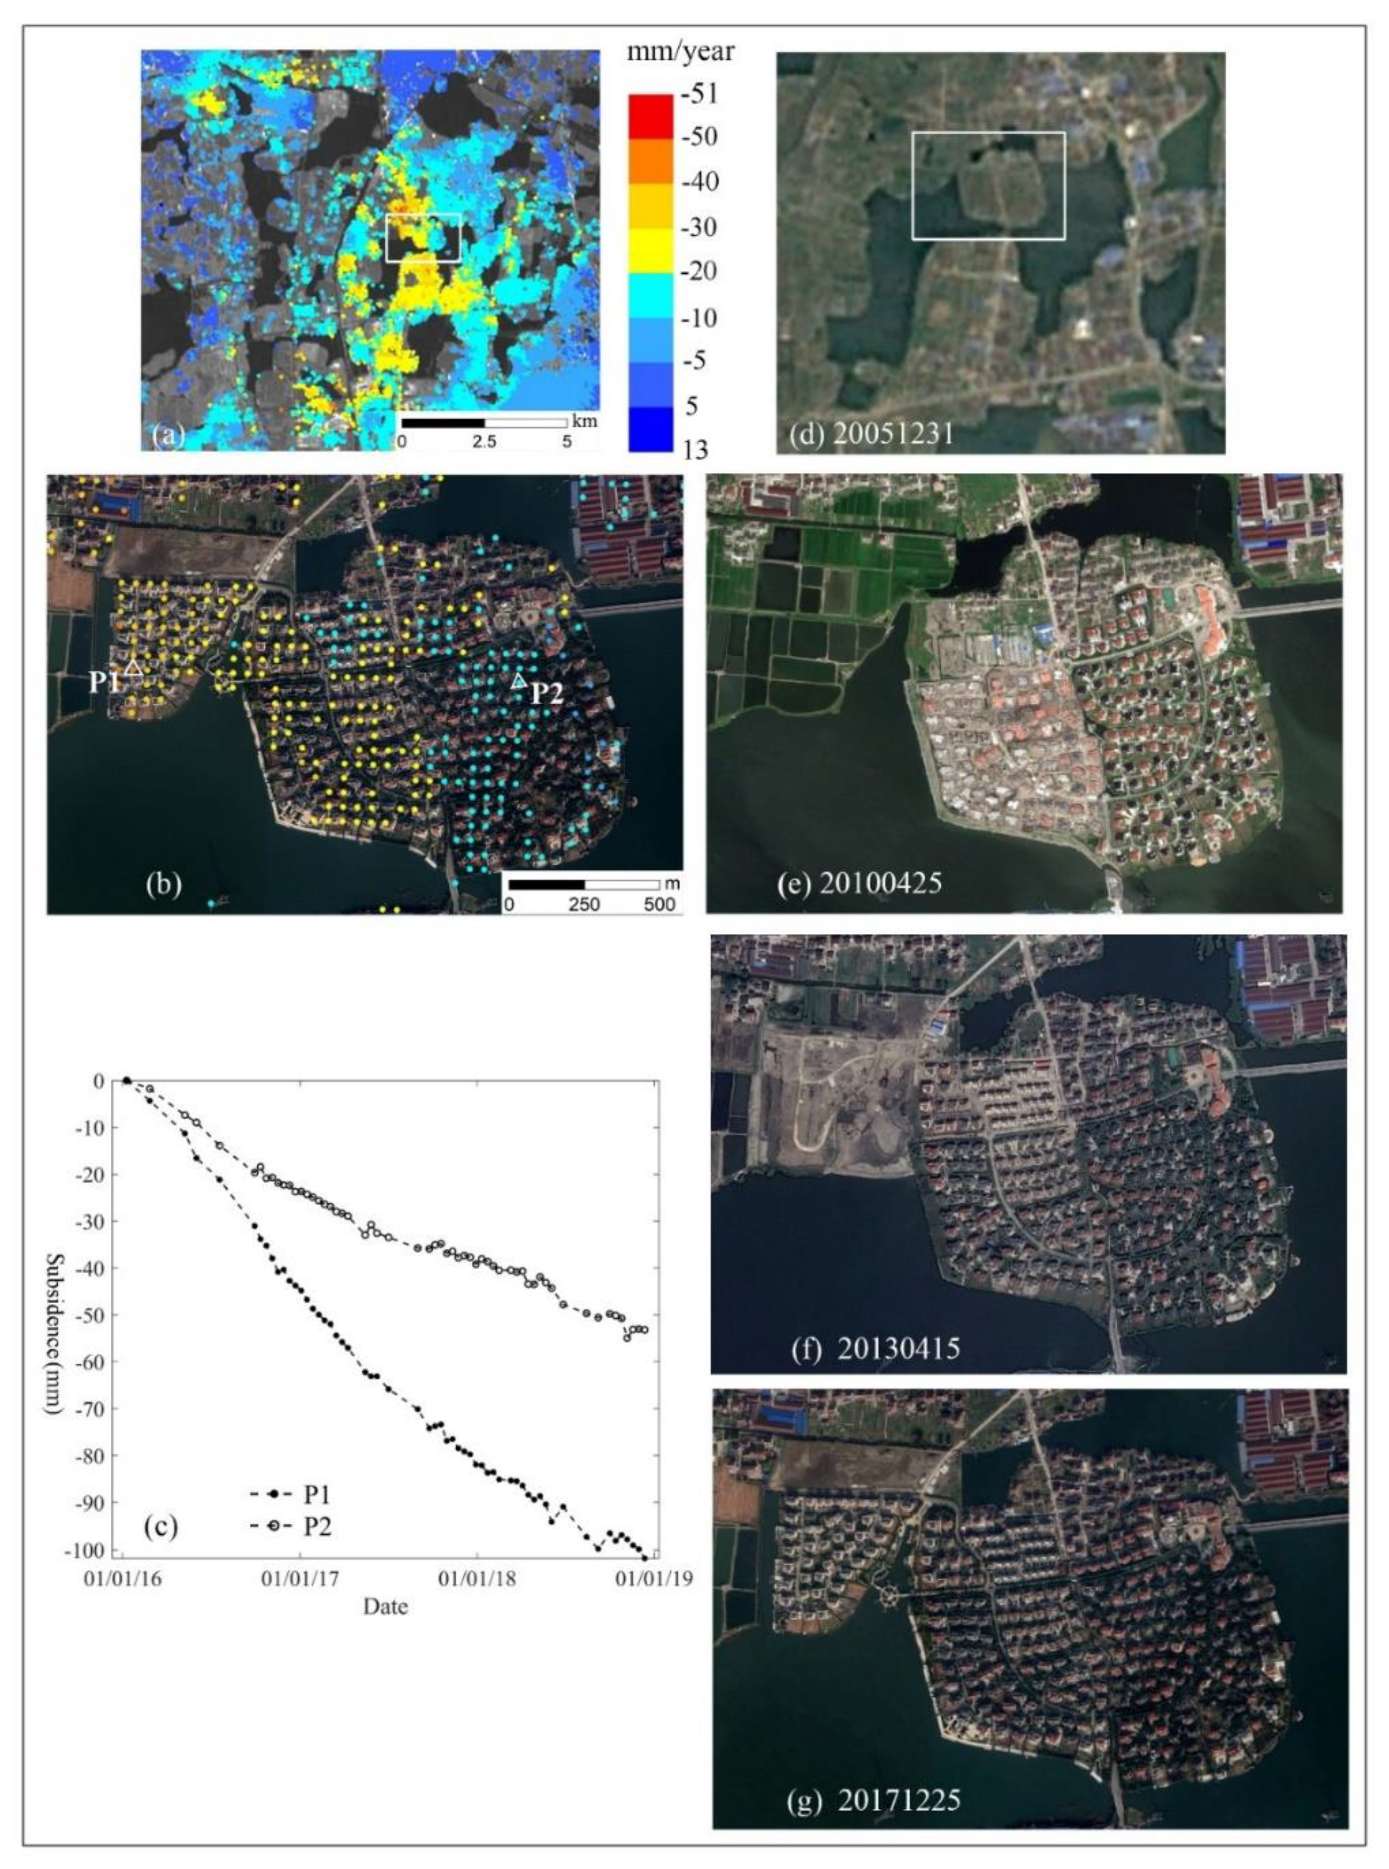
Subsidence zone E is located in Wujiang county within the Suzhou prefecture and close to the south bank of Taihu Lake, where canals, lakes and ponds were densely distributed, and historically known as “a land of fish and rice.” The enlarged view of MSV is shown in Figure 13a. The MSV within the white-rectangle AOI is furthered enlarged and shown in Figure 13b with a high-resolution optical image as the background. Four historical optical images corresponding to the AOI are given in Figure 13d–g. It can be seen that previous farmland, paddy and ponds as shown in Figure 13d,e were transformed to residential building region in 2017 as shown in Figure 13g. The subsidence time series of two CPs are given in Figure 13c, both of which present steady subsiding tendency with rate slightly slowing down as time passes. At the same time, the time of land use transition happed at P2 (from farmland to building) is at least 3 years earlier than that at P1(from pond to building), that is, consolidation of underlying soft soil layer at P2 started at least 3 years earlier than that at P1. Therefore, the MSV at P1 (−41 mm/year) is much larger than that at P2 (−15 mm/year). This temporal feature of the subsidence is similar with that in zone A, and also matches the Terzaghi theory of consolidation [29]. Furthermore, there is no excessive groundwater withdrawal or any other activities which may result in ground subsidence in this region. So, we can infer that ground subsidence in zone E is caused by the consolidation of underlying soft soil layers.

4.6. Comparative Analysis of Three Subsidence Scenarios

From the analyses on the five subsiding zones, there are three scenarios of ground subsidence in Jiangsu province in the monitoring period: subsidence linked with consolidation of underlying soft layer, groundwater withdrawal and underground mining.
Ground subsidence linked with underground mining is very characteristic of large deformation velocity. The evolution of subsidence highly coincides with mining progress. Especially, ground subsidence usually occurs immediately after underground extraction starts, and may reach a very large magnitude (usually hundreds to thousands millimeters) in months. Also, ground subsidence may still happen after mine extraction has stopped. Ground subsidence linked with soil consolidation can be well explained by the Terzaghi theory [29]. The subsidence curve of the primary consolidation stage is very distinctive, which is usually characterized by rapid ground subsidence with the rate slowing down with the passage of time. The time needed to complete the primary consolidation process varies from several years to several decades depending on the geological feature of the underlying stratum [28]. Zone A and E are typical occasions of this subsidence scenario. Ground subsidence linked with groundwater withdrawal is controlled by the intensity and period of groundwater extraction, and affected by rainfall. For example, there are two types of groundwater extraction in zone D: one for daily life of the inhabitants, the other for cleaning laver. Groundwater withdrawal for cleaning laver is more intensive than that for daily life, and presents strong periodic feature. Therefore, subsidence evolution curves in zone D show clear periodic pattern. As a contrast, groundwater withdrawal in Feng county of zone B is merely for daily life. Since freshwater demand for daily life usually keeps nearly invariant, the subsidence time series in Figure 7d presents a steady tendency, and the small-scale oscillations in the curve are very likely due to rainfall variations.

5. Conclusions

In this research, we report the methodology and results of monitoring ground subsidence over the whole Jiangsu province, China using S-1 IW data acquired between January 2016 and December 2018. This research is the first of its kind applications on wide-area deformation mapping with S-1 data in China.
Using time series S-1 images of 6 frames, the subsidence information for the whole Jiangsu province is retrieved. The derived MSV map has an accuracy of 3.9 mm/year based on leveling measurements. Around 82% of the territory is stable. Large subsidence mainly occurs in the north (Xuzhou prefecture), the south (Wujiang county of Suzhou prefecture) and along the coastal region of the province. Over the underground mining region of Xuzhou prefecture, ground subsidence data are largely missed due to unavailability of CPs on farmland, and InSAR-derived MSV may be underestimated.
More importantly, based on InSAR-derived subsidence time series, the causes of ground subsidence over major subsiding zones of Jiangsu province have been dig out, which include underground mining, groundwater withdrawal and consolidations of underlying soft layer associated with marine reclamation, lake/pond reclamation and land-use transition. Disclosure of the driving factors of ground subsidence has very valuable implications for the government to take proper actions. For example, it could be suggested that the efforts of mitigating ground subsidence should be focused on the management of underground coal mining and groundwater withdrawal, especially the groundwater withdrawal associated with industrial purpose, rather than daily life. It could be expected the ground subsidence related to soil consolidation would slow down and finally stabilize in some time. From this point-of-view, this research represents a significant demonstration on how the InSAR-derived deformation could be utilized for information inference and decision-making support.

Author Contributions

Conceptualization, Y.Z.; methodology, Y.Z. and H.W.; software, Y.K.; validation, M.L.; formal analysis, Y.Z.; investigation, Y.Z. and H.W.; resources, Y.Z. and M.L.; data curation, H.W. and Y.K.; writing—original draft preparation, Y.Z.; writing—review and editing, Z.L.; visualization, H.W. and Y.K.; supervision, Y.Z.; project administration, Y.Z.; funding acquisition, Y.Z. and M.L. All authors have read and agreed to the published version of the manuscript.

Funding

This research was funded by the National Key R&D Program of China, grant number 2017YFE0107100, the National Natural Science Foundation of China, grant number 41874014 and the Ministry of Natural Resources of China, grant number A2018.

Institutional Review Board Statement

Not applicable.

Informed Consent Statement

Not applicable.

Data Availability Statement

The data that support the findings of this study are available from the corresponding author upon reasonable request.

Acknowledgments

S-1 images are copyrighted by European Space Agency. SRTM DEM is copyrighted by NASA. The optical remote sensing images presented Figure 5, Figure 6, Figure 7, Figure 9, Figure 10 and Figure 11 are copyrighted by Google Earth.

Conflicts of Interest

The authors declare no conflict of interest.

References

  1. Jiang, H. Problems and discussions in the study of land subsidence in the Suzhou-Wuxi-Changzhou area. Quat. Sci. 2005, 25, 29–33. [Google Scholar]
  2. Ferretti, A.; Prati, C.; Rocca, F. Nonlinear subsidence rate estimation using permanent scatterers in differential SAR interferometry. IEEE Trans. Geosci. Remote Sens. 2000, 38, 2202–2212. [Google Scholar] [CrossRef] [Green Version]
  3. Ferretti, A.; Prati, C.; Rocca, F. Permanent scatterers in SAR interferometry. IEEE Trans. Geosci. Remote Sens. 2001, 39, 8–20. [Google Scholar] [CrossRef]
  4. Berardino, P.; Fornaro, G.; Lanari, R.; Sansosti, E. A new algorithm for surface deformation monitoring based on small baseline differential interferograms. IEEE Trans. Geosci. Remote Sens. 2002, 40, 2375–2383. [Google Scholar] [CrossRef] [Green Version]
  5. Adam, N.; Parizzi, A.; Eineder, M.; Crosetto, M. Practical persistent scatterer processing validation in the course of the Terrafirma project. J. Appl. Geophys. 2009, 69, 59–65. [Google Scholar] [CrossRef] [Green Version]
  6. Zhang, L.; Lu, Z.; Ding, X.; Jung, H.; Feng, G.; Lee, C.W. Mapping ground surface deformation using temporarily coherent point SAR interferometry: Application to Los Angeles Basin. Remote Sens. Environ. 2012, 117, 429–439. [Google Scholar] [CrossRef]
  7. Qu, F.; Lu, Z.; Zhang, Q.; Bawden, G.W.; Kim, J.W.; Zhao, C.; Qu, W. Mapping ground deformation over Houston-Galveston, Texas using multi-temporal InSAR. Remote Sens. Environ. 2015, 169, 290–306. [Google Scholar] [CrossRef]
  8. Chen, M.; Tomás, R.; Li, Z.; Motagh, M.; Li, T.; Hu, L.; Gong, H.; Li, X.; Yu, J.; Gong, X. Imaging land subsidence induced by groundwater extraction in Beijing (China) using satellite radar interferometry. Remote Sens. 2016, 8, 468. [Google Scholar] [CrossRef] [Green Version]
  9. Zhou, C.; Gong, H.; Zhang, Y.; Warner, T.A.; Wang, C. Spatiotemporal evolution of land subsidence in the Beijing Plain 2003–2015 using Persistent Scatterer Interferometry (PSI) with multi-source SAR data. Remote Sens. 2018, 10, 552. [Google Scholar] [CrossRef] [Green Version]
  10. Luo, Q.; Perissin, D.; Lin, H.; Zhang, Y.; Wang, W. Subsidence monitoring of Tianjin suburbs by TerraSAR-X persistent scatterers interferometry. IEEE J. Sel. Top. Appl. Earth Observ. Remote Sens. 2014, 7, 1642–1650. [Google Scholar]
  11. Liu, G.; Luo, X.; Chen, Q.; Huang, D.; Ding, X. Detecting Land Subsidence in Shanghai by PS-Networking SAR Interferometry. Sensors 2008, 8, 4725–4741. [Google Scholar] [CrossRef] [PubMed] [Green Version]
  12. Zhang, Y.; Zhang, J.; Wu, H.; Lu, Z.; Sun, G. Monitoring of urban subsidence with SAR interferometric point target analysis: A case study in Suzhou, China. Int. J. Appl. Earth Observ. Geoinform. 2011, 13, 812–818. [Google Scholar] [CrossRef]
  13. Costantini, M.; Ferretti, A.; Minati, F.; Falco, S.; Trillo, F.; Colombo, D.; Novali, F.; Malvarosa, F.; Mammone, C.; Vecchioli, F.; et al. Analysis of surface deformations over the whole Italian territory by interferometric processing of ERS, Envisat and COSMO-SkyMed radar data. Remote Sens. Environ. 2017, 202, 250–275. [Google Scholar] [CrossRef]
  14. Zhang, Y.; Wu, H.; Kang, Y.; Zhu, C. Ground Subsidence in the Beijing-Tianjin-Hebei Region from 1992 to 2014 Revealed by Multiple SAR Stacks. Remote Sens. 2016, 8, 675. [Google Scholar] [CrossRef] [Green Version]
  15. Salvi, S.; Stramondo, S.; Funning, G.J.; Ferretti, A.; Sarti, F.; Mouratidis, A. The Sentinel-1 mission for the improvement of the scientific understanding and the operational monitoring of the seismic cycle. Remote Sens. Environ. 2012, 120, 164–174. [Google Scholar] [CrossRef]
  16. Yagüe-Martínez, N.; Prats-Iraola, P.; Gonzalez, F.R.; Brcic, R.; Shau, R.; Geudtner, D.; Eineder, M.; Bamler, R. Interferometric processing of Sentinel-1 TOPS data. IEEE Trans. Geosci. Remote Sens. 2016, 54, 2220–2234. [Google Scholar] [CrossRef] [Green Version]
  17. De Zan, F.; Guarnieri, A.M. TOPSAR: Terrain observation by progressive scans. IEEE Trans. Geosci. Remote Sens. 2006, 44, 2352–2360. [Google Scholar] [CrossRef]
  18. Haghighi, M.H.; Motagh, M. Sentinel-1 InSAR over Germany: Large-scale interferometry, atmospheric effects, and ground deformation mapping. ZFV-Zeitschrift Geodasie Geoinf. Landmanagement 2017, 142, 245–256. [Google Scholar]
  19. Manunta, M.; De Luca, C.; Zinno, I.; Casu, F.; Manzo, M.; Bonano, M.; Fusco, A.; Pepe, A.; Onorato, G.; Berardino, P. The parallel SBAS approach for Sentinel-1 interferometric wide swath deformation Time-Series generation: Algorithm description and products quality assessment. IEEE Trans. Geosci. Remote Sens. 2019, 57, 6259–6281. [Google Scholar] [CrossRef]
  20. Liu, X.; Zhao, C.; Zhang, Q.; Yang, C.; Zhang, J. Characterizing and monitoring ground settlement of marine reclamation land of Xiamen new airport, China with Sentinel-1 SAR datasets. Remote Sens. 2019, 11, 585. [Google Scholar] [CrossRef] [Green Version]
  21. Zhang, T.; Shen, W.; Wu, W.; Zhang, B.; Pan, Y. Recent surface deformation in the Tianjin area revealed by Sentinel-1A data. Remote Sens. 2019, 11, 130. [Google Scholar] [CrossRef] [Green Version]
  22. De Zan, F.; Prats-Iraola, P.; Scheiber, R.; Rucci, A. Interferometry with TOPS: Coregistration and Azimuth Shifts; EUSAR: Berlin, Germany, 2014; pp. 1–4. [Google Scholar]
  23. Sentinels POD Team. Sentinels POD service file format specifications. Eur. Space Agency Paris France Tech. Rep. 2011. GMES-GSEG-EOPGFS-10-0075. [Google Scholar]
  24. Prats-Iraola, P.; Scheiber, R.; Marotti, L.; Wollstadt, S.; Reigber, A. TOPS interferometry with TerraSAR-X. IEEE Trans. Geosci. Remote Sens. 2012, 50, 3179–3188. [Google Scholar] [CrossRef] [Green Version]
  25. Yague-Martinez, N.; De Zan, F.; Prats-Iraola, P. Coregistration of interferometric stacks of Sentinel-1 TOPS data. IEEE Geosci. Remote Sens. Lett. 2017, 14, 1002–1006. [Google Scholar] [CrossRef] [Green Version]
  26. Xie, X. On properties and causes of geological disasters and their prevention proposals in Jiangsu. J. Geology. 2009, 33, 154–159. [Google Scholar]
  27. Yang, M.; Yang, T.; Zhang, L.; Lin, J.; Qin, X.; Liao, M. Spatio-Temporal characterization of a reclamation settlement in the Shanghai coastal area with time series analyses of X-, C-, and L-Band SAR datasets. Remote Sens. 2018, 10, 329. [Google Scholar] [CrossRef] [Green Version]
  28. Jiang, L.; Lin, H. Integrated analysis of SAR interferometric and geological data for investigating long-term reclamation settlement of Chek lap KoK Airport, Hong Kong. Eng. Geol. 2010, 110, 77–92. [Google Scholar] [CrossRef]
  29. Terzaghi, K.; Peck, R.B.; Mesri, G. Soil Mechanics in Engineering Practice; John Wiley and Sons: Hoboken, NJ, USA, 1996; pp. 1–592. [Google Scholar]
  30. He, H.C.; Shi, Y.; Yin, Y.; Liu, X.Y.; Li, H.Q. Impact of porphyra cultivation on sedimentary and morphological evolution of tidal flat in Rudong, Jiangsu province. Quat. Sci. 2012, 32, 1161–1172. [Google Scholar]
  31. Chen, B.; Gong, H.; Lei, K.; Li, J.; Zhou, C.; Gao, M.; Guan, H.; Lv, W. Land subsidence lagging quantification in the main exploration aquifer layers in Beijing plain, China. Int. J. Appl. Earth Observ. Geoinform. 2019, 75, 54–67. [Google Scholar] [CrossRef]
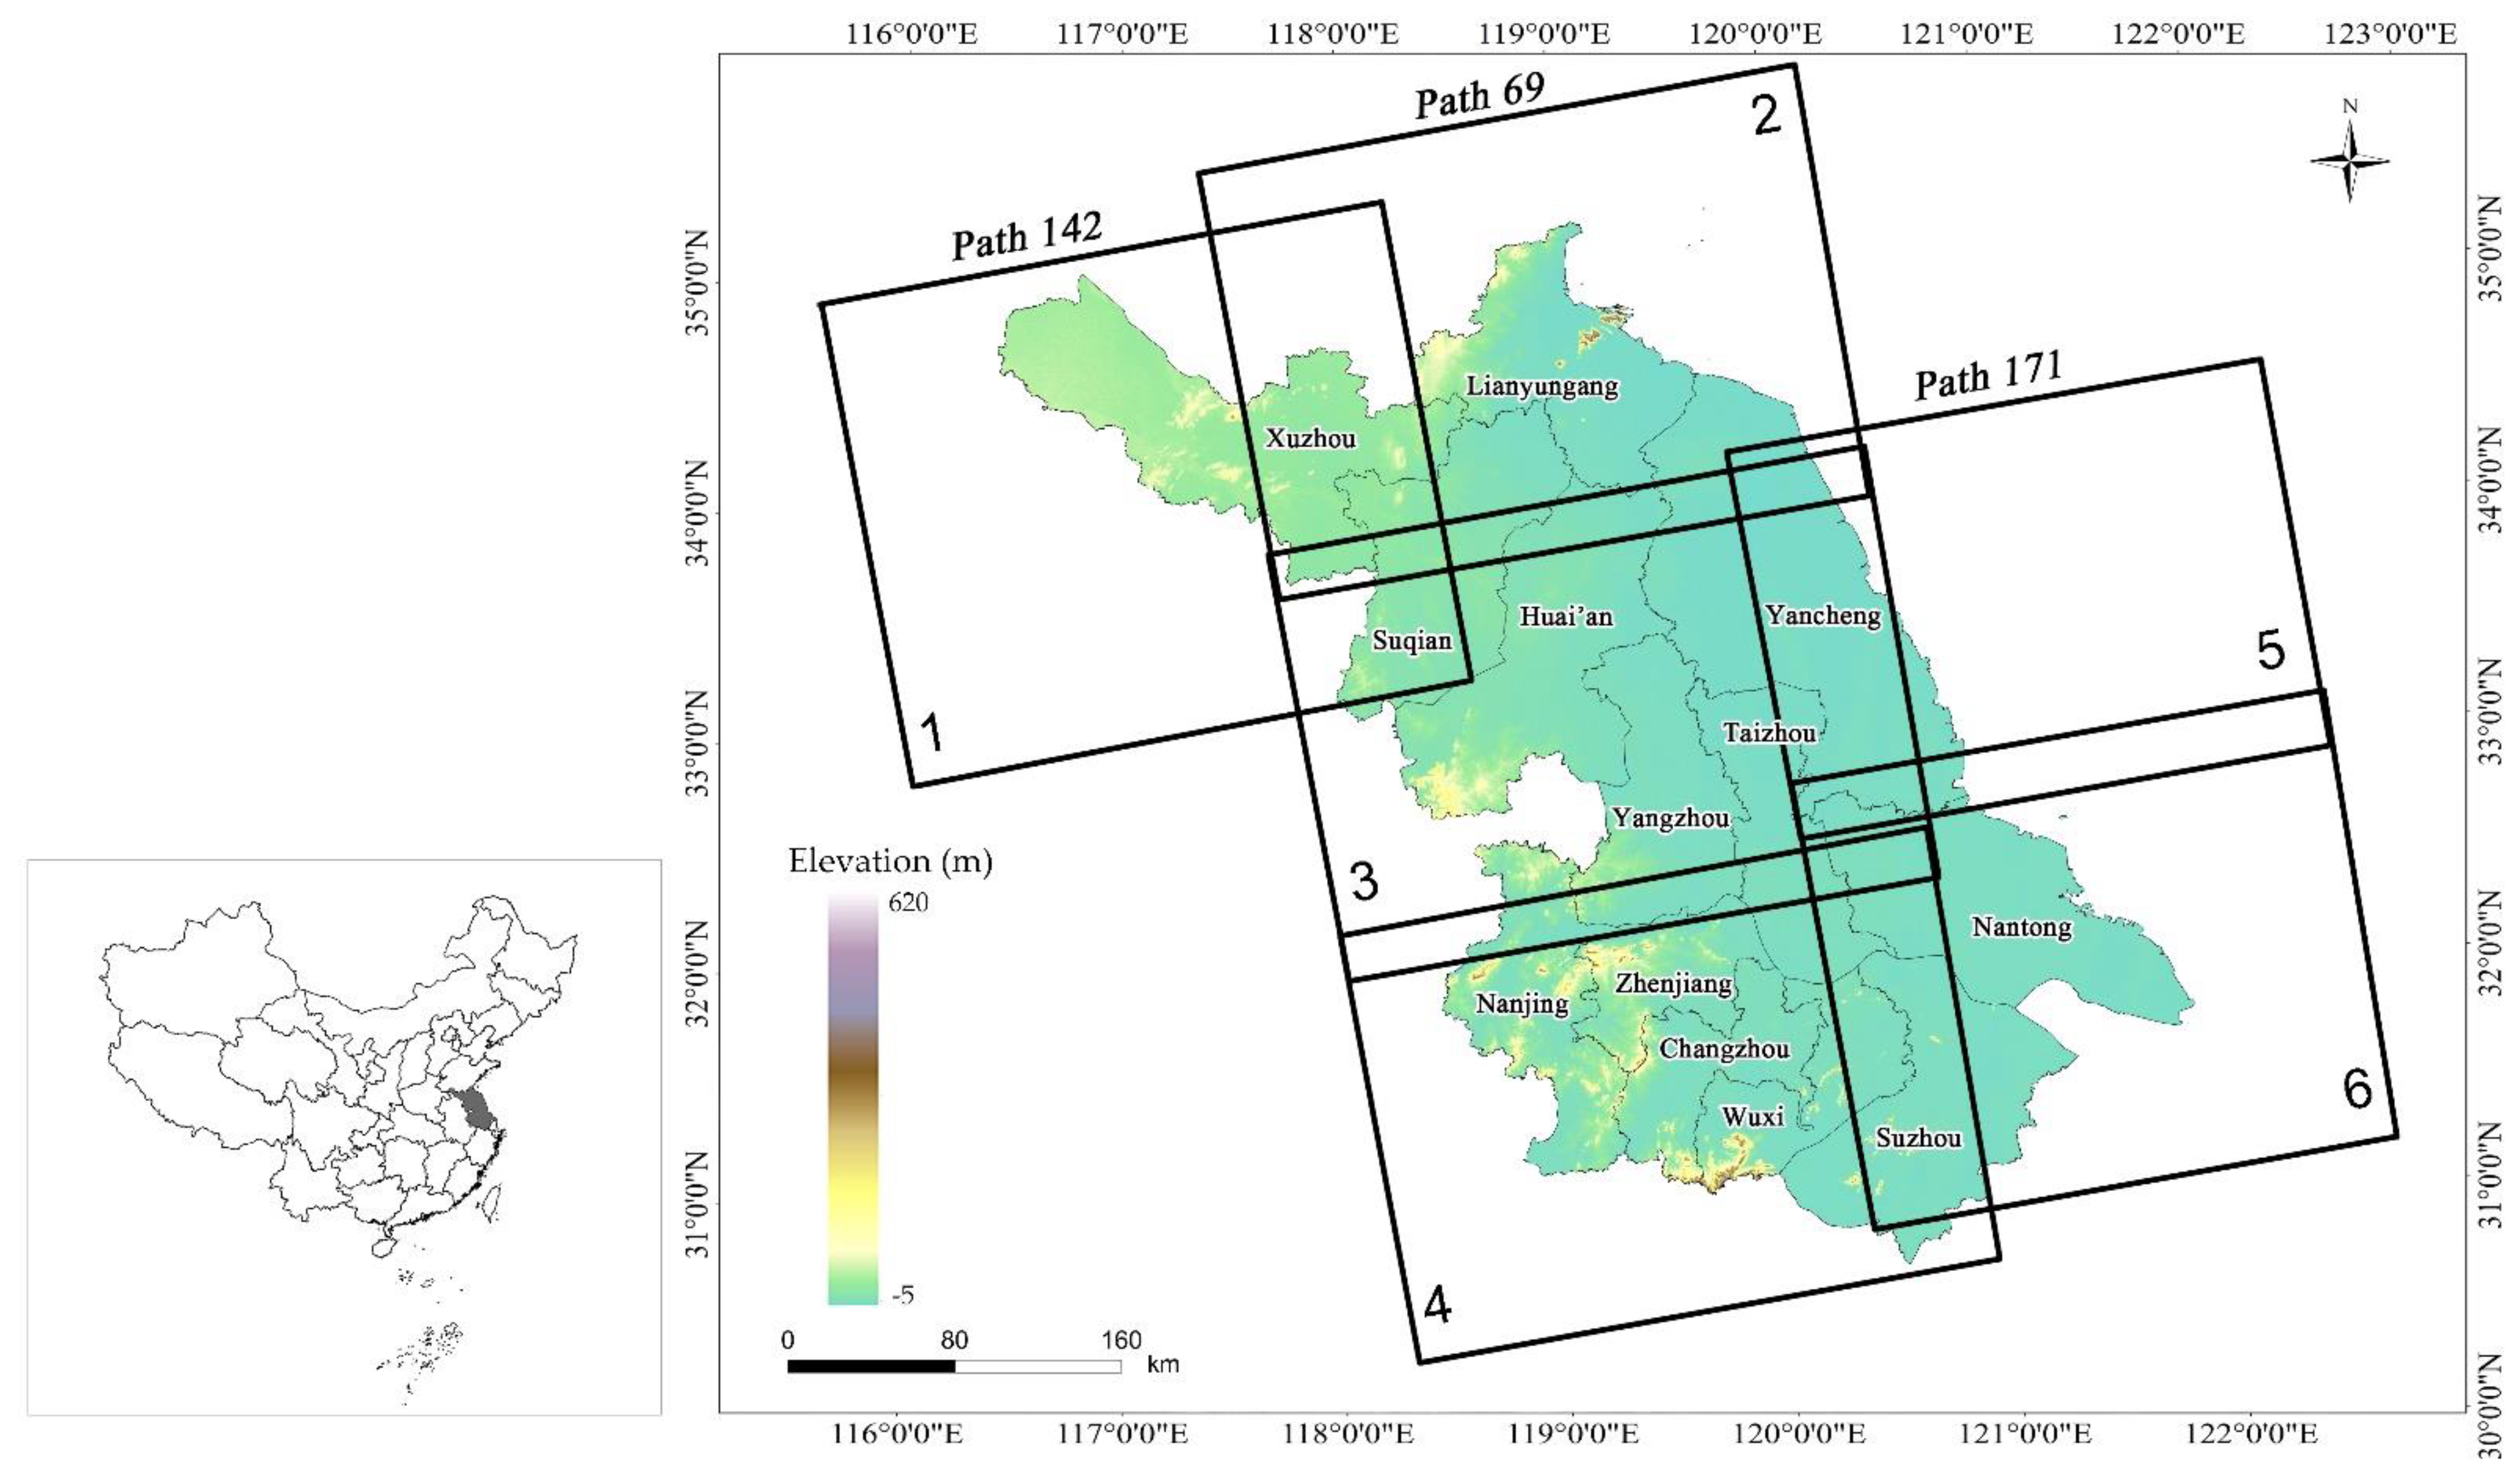
Figure 1. S-1 frame coverage over the whole Jiangsu province. The background is the Shuttle Radar Topography Mission (SRTM) digital elevation model (DEM) with elevation tuned by color. The location of Jiangsu province in China is shown in grey in the thumbnail image in the left.
Remotesensing 13 00179 g001
Figure 2. The flow chart of time series analysis of the S-1 stack.
Remotesensing 13 00179 g002
Figure 3. Interferograms formed by summer season images are strongly affected by atmospheric artifacts as shown in (ac). In contrast, a good quality interferogram formed by two winter images is shown in (d).
Remotesensing 13 00179 g003
Figure 4. Geocoded mean subsidence velocity (MSV) mosaic of Jiangsu province calculated from S-1 images acquired between January 2016 and December 2018, where negative and positive velocities refer to ground subsidence and uplift respectively. The background is the averaged S-1 amplitude. White solid lines stand for the prefecture-level administrative boundaries. Five subsidence zones (AE) with large subsidence velocity are marked out with dash-line rectangle and discussed in detail in Section 5. Three zones with ground uplift are marked out with dash-line ellipse.
Remotesensing 13 00179 g004
Figure 5. Histogram of coherent pixels (CPs) showing ground uplift with MSV in the range of [5, 32] mm/year.
Remotesensing 13 00179 g005
Figure 6. Subsidence in zone A of Figure 4. Optical images in May 2012, October 2014 and October 2017 are shown in (a), (b,c) respectively. Mean subsidence velocity of coherent pixels (CPs) are overlaid on the latest optical image in (d). The enlarged view of the dash-line rectangle area in (d) is shown in (e). The subsidence time series of two selected CPs: P1 and P2 in (e) are presented in (f).
Remotesensing 13 00179 g006
Figure 7. The enlarged view of MSV in Zone B of Figure 4 is shown in (a). The underground coal mining region is marked by the white-line polygon, and the urban area of Feng county is delineated by the purple-line polygon. Well locations within the Feng county are denoted by red-solid triangles overlaid on an optical image in (b), while MSV of CPs are overlaid in (c). The subsidence time series of two CPs denoted by white triangles in (c) is shown in (d). The area of interest (AOI) marked by the while-line rectangle in (a) is enlarged in Figure 8a.
Remotesensing 13 00179 g007
Figure 8. Enlargement of MSV over the rectangle AOI in Figure 7a is shown in (a) overlaid on an optical image. The extraction boundary of 4 WPs are also overlaid as white rectangles and polygons in (a). The location of a CP (P1) is delineated by the dash-line rectangle in (a) with the enlarged view inset. An on-site photo is presented in (b) showing winter wheat on the ground above WP 74,101. The accumulative deformation maps for periods of 16 October 2016 to 21 March 2017 and 23 October 2017 to 4 March 2018 are given in (c,d) respectively.
Remotesensing 13 00179 g008
Figure 9. Fifteen consecutive 12-day interferograms over the ground above WP 92,606.
Remotesensing 13 00179 g009
Figure 10. Deformation time series of six points whose locations are marked as triangles in Figure 8a,c,d: (a) point P1 and P1*; (b) point P2, P3, P4 and P5. Please note, P1 and P1* refer to the same location.
Remotesensing 13 00179 g010
Figure 11. The enlarged view of Zone C in Figure 4 is shown in (a). The MSV within the white-line AOI in (a) is shown in (b). (dg) are 4 historic images of the AOI which shows the land-use transition from farmland and muddy beach in 2003 to industrial districts in 2017. The yellow-rectangle region in (d) corresponds to the image area of (eg). The subsidence time series of two CPs marked by white-triangles in (b) is shown in (c). An on-site photo of FHPP is shown to the left of (g).
Remotesensing 13 00179 g011
Figure 12. Three historical optical images of subsidence zone D are shown in (a,c,d). An enlarged view of the white-line AOI in (d) showing laver culture rafts in the sea is given in (b). An enlarged view of the red-line AOI in (d) with CPs’ MSV overlaid is given in (e) and a further enlarged view shown in (f). The subsidence time series of two CPs marked by white-line triangle in (f) is shown in (g). In the right of (g), two on-site photos taken during the field campaign are shown, which highlight a water tower and a family-use well respectively.
Remotesensing 13 00179 g012
Figure 13. The enlarged view of zone E in Figure 4 is shown in (a). The MSV within the white-line AOI in (a) is shown in (b). (dg) are 4 historic images of the AOI. The subsidence time series of two CPs marked by white-triangles in (b) is shown in (c).
Remotesensing 13 00179 g013
Table 1. Composition of S-1 image stacks.
Frame No.Path No.Number of Acquisitions UsedAcquisition Date Span
11425827 November 2015–5 December 2018
269579 January 2016–12 December 2018
369549 January 2016–12 December 2018
469479 January 2016–12 December 2018
51716529 November 2015–7 December 2018
61715229 November 2015–7 December 2018
Table 2. Information on leveling points and accuracy.
PrefectureStarting-Ending Date of
Leveling Campaign
Number of Available Leveling PointsNumber of Used Leveling PointsStandard Deviation (mm/year)
ChangzhouSeptember 2016–August 20182982374.0
NantongJuly 2016–September 20182772234.0
Huai’anJanuary 2016–January 201835223.4
Huai’anJanuary 2018–December 201878453.3
In total6885273.9
Table 3. Mining parameters of the four working panels (WPs) shown in Figure 8a.
WP IDMining Start Date Mining End DateDip Angle of WP (Degree)Average Thickness of WP (m)Depth of Extracted
Seam (m)
Width of
Extracted Seam (m)
74,10128 August 201610 September 2017233.421077180
74,1022 September 201714 December 2018202.571078180
92,6063 June 20166 April 2017142.65727160
93,6041 April 20175 July 2018243.5954160
Publisher’s Note: MDPI stays neutral with regard to jurisdictional claims in published maps and institutional affiliations.