Article

A Remote Sensing-Based Assessment of Water Resources in the Arabian Peninsula

1
National Center of Meteorology (NCM), Abu Dhabi P.O. Box 4815, UAE
2
Department of Civil, Environmental, and Ocean Engineering (CEOE), Stevens Institute of Technology, Hoboken, NJ 07030, USA
*
Author to whom correspondence should be addressed.
Remote Sens. 2021, 13(2), 247; https://doi.org/10.3390/rs13020247
Submission received: 6 December 2020 / Revised: 6 January 2021 / Accepted: 11 January 2021 / Published: 13 January 2021

Abstract

:
A better understanding of the spatiotemporal distribution of water resources is crucial for the sustainable development of hyper-arid regions. Here, we focus on the Arabian Peninsula (AP) and use remotely sensed data to (i) analyze the local climatology of total water storage (TWS), precipitation, and soil moisture; (ii) characterize their temporal variability and spatial distribution; and (iii) infer recent trends and change points within their time series. Remote sensing data for TWS, precipitation, and soil moisture are obtained from the Gravity Recovery and Climate Experiment (GRACE), the Tropical Rainfall Measuring Mission (TRMM), and the Advanced Microwave Scanning Radiometer for Earth Observing System (AMSR-E), respectively. The study relies on trend analysis, the modified Mann–Kendall test, and change point detection statistics. We first derive 10-year (2002–2011) seasonal averages from each of the datasets and intercompare their spatial organization. In the absence of large-scale in situ data, we then compare trends from GRACE TWS retrievals to in situ groundwater observations locally over the subdomain of the United Arab Emirates (UAE). TWS anomalies vary between −6.2 to 3.2 cm/month and −6.8 to −0.3 cm/month during the winter and summer periods, respectively. Trend analysis shows decreasing precipitation trends (−2.3 × 10⁻⁴ mm/day) spatially aligned with decreasing soil moisture trends (−1.5 × 10⁻⁴ g/cm3/month) over the southern part of the AP, whereas the highest decreasing TWS trends (−8.6 × 10⁻² cm/month) are recorded over areas of excessive groundwater extraction in the northern AP. Interestingly, change point detection reveals increasing precipitation trends pre- and post-change point breaks over the entire AP region. Significant spatial dependencies are observed between TRMM and GRACE change points, particularly over Yemen during 2010, revealing the dominant impact of climatic changes on TWS depletion.

Graphical Abstract

1. Introduction

The Arabian Peninsula (AP) has been experiencing a significant increase in water demand as a result of population growth, urbanization, and an overall increase in living standards. The stress on the region’s already scarce water resources is further exacerbated by the increasing reliance on groundwater, especially in deep inland locations where water supply from seawater desalination is not economically feasible. Even in coastal areas, the frequent deterioration of seawater quality due to harmful algal blooms or oil spills [1,2] hinders the operation of desalinations plants. In such context, the monitoring of renewable water resources is essential, yet also challenging, due to the sporadic nature of rainfall events that are extremely unevenly distributed spatially and temporally over the AP [3,4,5,6,7]. Studying small watersheds within the AP cannot reflect the macroscale processes and capture the flow of the dominant groundwater component, which is important in arid regions given the absence of sustained surface water flow [8]. In turn, examining the variability over a regional scale is essential to understand the interaction between key hydrological variables and their dynamics in the region.
An effective monitoring of hydrological processes and their dynamics at a regional scale should include a close examination of three main variables, namely, total water storage (TWS), precipitation, and soil moisture. Inferring information on these key hydrological variables is particularly challenging in remote and arid regions, including the AP [9,10,11,12]. Direct measurements of such key variable are invaluable to understand the local and regional hydrological processes. However, in regions like the AP in situ observations are extremely scarce. Consequently, the use of remote sensing is considered an attractive alternative to compensate for the aforementioned limitations.
Several studies have relied on remote sensing products to perform large-scale monitoring over the Middle East and North Africa region and neighboring countries. Ahmed, et al. [13] showed that the observed temporal mass variations in the Gravity Recovery and Climate Experiment (GRACE) data over North and Central Africa are largely controlled by elements of the hydrologic cycle, namely, runoff, infiltration, and groundwater flow and have not been obscured by noise, as previously proposed. Joodaki, et al. [14] and Voss, et al. [15] analyzed time series of GRACE data and recorded large negative trends in groundwater storage across the Middle East, particularly over western Iran and eastern Iraq. Moreover, Yan, et al. [16] applied an integrated, remote sensing-based approach to improve estimation of renewable water resources in the arid to semi-arid areas of the Sinai Peninsula and the Eastern Desert of Egypt. Event-based analyses were carried out using multiple remote sensing products including the Tropical Rainfall Measuring Mission (TRMM) and the Advanced Microwave Scanning Radiometer-Earth Observing System (AMSR-E) to determine precipitation, soil moisture, reservoir volumes, and flows in large river channels with the application of a hydrologic model. For the same study region consisting of the Sinai Peninsula and the Eastern Desert of Egypt, Milewski, et al. [17] developed an interactive remote sensing data extraction model (RESDEM) for integrated processing and analysis of a suite of remote sensing data sets. They demonstrated its ability to perform regional scale computations of long-term rainfall-runoff and groundwater recharge.
The large-scale study of water resources over the AP should provide an understanding of their spatiotemporal variation, dependencies and control factors. Sultan, et al. [18] intercompared trends from GRACE, TRMM, and the merged soil moisture product from the European Space Agency–Essential Climate Variable (ESA-ECV), which includes AMSR-E among other active and passive products, to investigate the cause of declining TWS in large aquifer systems across the Middle East. They attributed the observed TWS decline in the northern AP Aquifer System (APAS) to (i) the increased number of irrigation wells tapping the Saq aquifer (northern Saudi Arabia) to supply the expanding agricultural activity in the surrounding areas [19], and (ii) the limited compensation from rainfall infiltration and recharge. However, trends were analyzed at the monthly scale without reporting their statistical significance and the link between the long-term variability of rainfall regimes and TWS levels was not investigated. More importantly, change point detection in the time series of the analyzed products was not carried out. Trend statistical significance and change point detection may cause pitfalls when not applied in climatological time series analyses [20]. This is particularly important for the AP, where previous work on study areas within its boundaries have reported climatological change points in temperature [21,22], precipitation [23], and cloud cover [24].
The present study relies on a 10-year record of remote sensing data applied on the regional scale of the AP, rather than on selected watersheds, to study the climatology and macro processes of TWS, precipitation, and soil moisture determined by observations from GRACE, TRMM, and AMSR-E, respectively. The intercomparison between datasets from different sensors and the analysis of their consistency is beyond the scope of this study. The intercomparison of global precipitation products over the AP was carried out by the authors in previous work [3], where TRMM showed the highest consistency with other hydrological variables—corroborating its use in the current analysis. The focus is placed on the examination of trend statistical significance and detectable change points. The spatial distribution of the selected key hydrological variables is also investigated and the temporal consistency of the detected changes in their variability is analyzed. In the absence of large-scale and dense observation networks over the entire study area, the trend of GRACE estimates is verified locally using observations from wells in the United Arab Emirates (UAE). The inferred agreement between GRACE and local well observations in the UAE is assumed to be reflective of the performance of the retrieval of TWS anomalies over the entire study area. Moreover, here, we test the feasibility of inferring relationships between key hydrological variables and macroscale processes by exclusively using remote sensing data. This makes the proposed analysis expandable to other ungauged watersheds where in situ observations are scarce or not available.

2. Study Area

Figure 1a shows the topography of the AP varying from the lowest points along the coast of the Arabian Gulf to over 3500 m at the highest southern peaks in Yemen. The Hajar Mountain range on the border between Oman and the UAE is also depicted with peaks reaching 3000 m. Recharge mechanisms are highly dependent on both the existing topography and soil textures. Figure 1b shows widespread shallow and poorly developed soils, enriched with lime, gypsum, or salts, which are strongly coupled to the arid desert climate. Sand dunes and sheets of transported materials cover the majority of the region. Alternatively, shallow and stony soils cover the southern highlands in Yemen and the Hajar Mountain range, which may favor lateral flow rather than recharge of the deep aquifer. Ephemeral rivers (wadis) are fed by runoff from these highlands, which frequently trigger flashfloods downstream [25,26,27]. The absence of a dense network of gauged streams hinders the verification of hydrological processes, which makes the reliance on remotely sensed products an attractive alternative for regional studies over the AP.
The dry (June, July, August, and September—JJAS) and wet (December, January, February, and March—DJFM) seasons for much of the AP are consistent with the region and typical hydrological regimes. However, accurate details on the seasonal rainfall distribution for the AP using long-term observations are generally not available in the literature [5]. Large rainfall amounts are observed over the northern AP during the wet season associated with pressure troughs from the eastern Mediterranean, while the southern portion records peak rainfall amounts during the dry season with the advancement of moist air masses from the Indian Monsoon Trough [30,31,32]. Consequently, two transitional periods (April–May and October–November) separate these dry and wet regimes, which dictate the region’s climatology.

3. Data and Methods

3.1. Remote Sensing Products

The TRMM 3B42 Research Derived Daily Product is used for precipitation data over the time period extending from January 1999 to July 2015 [33]. The algorithm applied for this product is the Version 7 TRMM Multi-Satellite Precipitation Analysis (TMPA), which is a major improvement over the previous version 6, especially in terms of daily resolution [34]. This product has been shown to capture light rain events and outperform other global precipitation products when intercompared over the AP and surrounding areas [3,9,11]. For soil moisture, level 3 daily AMSR-E estimates are obtained over the period of June 2002 to September 2011 [35,36]. AMSR-E estimates of soil moisture have been found to perform well over desert environments in the absence of vegetation [37,38] and were applied in conjunction with the TRMM product for flood monitoring over Saudi Arabia [39]. Both TRMM and AMSR-E products have a high spatial resolution of 0.25° × 0.25° (latitude × longitude) at the daily scale. Three GRACE solutions using the standard spherical harmonic approach (SSH) [40] are released from different processing centers, namely, GeoForschungsZentrum Potsdam (GFZ), Center for Space Research at University of Austin Texas (CSR), and Jet Propulsion Laboratory (JPL). While slight differences have been reported between the three products, their trends remain consistent [41]. Here, we use the JPL GRACE product with scaling coefficients obtained from the National Center for Atmospheric Research’s numerical land-hydrology community model (NCAR CLM4). The GRACE data time period extends from April 2002 to October 2017, with a resolution of 1° × 1° at the monthly scale [40,42]. For the sake of the intercomparison, the products are analyzed for the overlapping period of June 2002 to September 2011. Table 1 includes a summary of the used datasets.

3.2. In-Situ Well Observations

In situ well observations collected by the UAE Ministry of Climate Change and Environment (MoCCAE), formerly known as the Ministry of Environment and Water (MOEW), are used to locally test the inferred trends from GRACE. Given the lack of such observations across the entire AP, an agreement between well observations and GRACE anomalies over the test site in the UAE should indicate the validity of expanding the GRACE-based analysis to the rest of the study area. The records include monthly water table depths of 39 wells logged from January 1989 to September 2014. Wells in the UAE are located around a network of small dams and flood wave breakers built on major wadis to maximize groundwater recharge. The elevation of each well, with respect to sea level, is also recorded. After subtracting the well elevations, monthly water table elevations for each well are determined, starting from April 2002 to match the GRACE temporal coverage. Next, a monthly spatial average of the water table variations across the wells is computed, from which average water storage anomalies are derived using the same storage reference period as GRACE, namely, January 2004 to December 2009.

3.3. Data Processing

A land mask of the AP is applied to the processed datasets. A spatial analysis of the derived climatology from the GRACE, TRMM, and ASMR-E products from 2002 to 2011 for winter (DJFM) and summer (JJAS) is first carried out by examining maps of their spatial patterns to detect possible similarities. Then, the TRMM and AMSR-E products are aggregated to match the temporal resolution of the GRACE data resolution by calculating the cumulative monthly sum on a pixel-per-pixel basis. Trend analysis is carried out using the native spatial and temporal resolutions with the exception of the AMSR-E product, for which the aggregated monthly dataset is used to avoid potential errors associated with orbital gap filling. The final trend coefficients are mapped after interpolation by kriging to express the spatial variation in terms of the variogram and minimize prediction errors [43].

3.4. Trend Analysis

The time series of the three datasets are used to fit long-term linear trends to the evolution of water storage, precipitation and soil moisture over the AP. The derived trends represent the overall 10-year variation through both the magnitude and the sign of the resulting trend coefficients (slopes) at each pixel across the study domain. Next, the modified Mann–Kendall [44] test is carried out on a pixel-per-pixel basis for the three datasets to test for their trend significance (5% significance level) throughout the study period. This test accounts for autocorrelations present in the data by modifying the variance of the non-parametric Mann Kendall Test [45,46]. For a given sample x1, x2, …, xn, of size n, the standardized test statistic Zs is obtained as:
Z s = { S 1 σ s           i f   S > 0 0                   i f   S = 0 S + 1 σ s           i f   S < 0
where
S = i = 1 n 1 j = i + 1 n s i g n ( x j x i )
and
σ s = n ( n 1 ) ( 2 n + 5 )   i = 1 m t i ( i ) ( i 1 ) ( 2 i + 5 ) 18
with m being the number of tied values in ti.
The null hypothesis of trend absence is rejected at a significance level α (5% used here) if the p-value is less than α.

3.5. Change Point Analysis

The cumulative sum (CUSUM) method is a simple nonparametric statistical technique that can be used for detecting abrupt change points in time series [47]. This method has been shown to be computationally inexpensive while remaining statistically optimal [48]. For a given time series, x1, x2, …, xn, the cumulative sum of deviations at any time k is given by:
C k = i = 1 k ( x i x ¯ )
Change point detection using the CUSUM method is carried out on a pixel-per-pixel basis across the study domain by accumulating the deviations from the mean and recording the absolute maxima and minima. This method is generally classified as a visual technique where changes in the slope of the linear trend are attributed to changes in mean values of the time series. Following the approach of Yousef, et al. [24], we rely on the peaks and troughs of the CUSUM plot, rather than slope changes, to indicate years where the most abrupt deviation from the of mean occurs. Then, the spatial distributions of the obtained change points (years) are mapped and examined.

4. Results

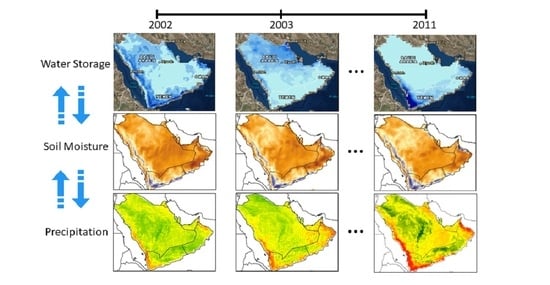
4.1. Spatial Analysis

First, we focus on the comparison of the spatial organization of the three datasets plotted at their native resolutions. The time-averaged spatial distribution of TWS, precipitation, and soil moisture are obtained for winter (DJFM) and summer (JJAS) months during their common coverage period from 2002 to 2011. Figure 2 shows the winter and summer spatial distribution of TWS (a,b), precipitation (c,d), and soil moisture (e,f) derived over the 10-year study period.
Subplots 1a and 1b show the TWS anomalies varying in the range of −6.2 to 3.2 cm/month and −6.8 to −0.3 cm/month for the winter and summer periods, respectively. For the winter period, the largest decreasing anomalies (−5 to −6.2 cm/month) are recorded in north-western Saudi Arabia and the Empty Quarter (Rub’ al Khali) region, whereas the largest increasing anomalies (2.5 to 3.2 cm/month) are recorded along the western coast, particularly around Jeddah, and the southern coasts of Oman and Yemen. For the summer period, decreasing anomalies are recorded over the entire AP, with the largest declines in the northern quadrant near Riyadh (−5 to −6.8 cm/month), and the least declines near Oman (−1 to 0 cm/month).
During the winter period, subplot 1c shows the TRMM precipitation retrievals reaching over 100 mm in the northern parts of Saudi Arabia, while negligible amounts are observed over the southern parts of the AP. Conversely, for the summer period, subplot 1d indicates negligible precipitation over the central and northern parts of the AP, while localized and intense events recorded up to 117 mm/month over the Yemen coastal highlands, as well as light rainfall (20 to 40 mm/month) over inland Yemen and the eastern coast of Oman.
For both winter and summer periods, subplots 1e and 1f show the highest readings of soil moisture values ranging from 0.3 to 0.45 g/cm3/month along the western coast, southern coast of Yemen, and its highlands, as well as the eastern coast of Oman and the Hajar Mountains on the border with the UAE. However, larger areal extents of soil wetness (0.2 to 0.3 g/cm3/month) are observed for the winter period over the northern AP and areas between Saudi Arabia, Oman and UAE.
The examined datasets show reasonable similarity in the spatial distribution of water storage on one hand and rainfall, and soil moisture on the other. Areas where soil moisture and precipitation values are the highest, in terms of both magnitude and extent, correspond to the significant positive TWS anomalies. The direct dependence of soil moisture on precipitation is less evident, especially over the northern part of the AP during summer, where the sustained soil wetness is observed in the AMSR-E product despite the absence of rainfall retrievals from TRMM.

4.2. GRACE Trends over the UAE and Comparisons to Well Data

Historically, the northern part of the UAE is known to be highly susceptible to the majority of rainfall events across the country. It is also considered to be a significant recharge area due to the coupled effect of minimal urbanization and highly permeable soils. Hence, any variation in rainfall is expected to directly reflect on TWS fluctuations. The decreasing trend of well-derived anomalies shows seasonal and intra-annual agreement with the GRACE trend over the UAE (see Figure 3). The sharp decrease in the GRACE anomalies to −5.1 cm/month in July 2002 GRACE is attributed to tapering artefacts during the initial 6-month calibration and validation period (April–September, 2002) which is excluded from the following analyses [49,50].
The time series agree in terms of annual peaks and their consistent occurrence in winter time, namely, December and January. However, a slight shift is observed between the two time series with the GRACE anomalies consistently peaking approximately 2 to 4 months before the well-derived anomalies. This is primarily explained by the difference in scale between the GRACE grid size (~110 km × 110 km = 12,000 km2) and the sub-scale area covered by the UAE well network (~1000 km2) depicted in Figure 1c. The point-based well observations are sensitive to localized rainfall events over the network area, whereas GRACE detects total water column variations over its 12-fold larger grid area subject to larger scale rainfall systems.
Since GRACE detects changes in the total water column, i.e., subsurface storage + soil moisture + snow + canopy + river storage, the well-derived anomalies must be exclusively compared to the subsurface component. However, the snow, canopy and river storage components are not relevant to the study area. Moreover, the high operational frequency of ASMR-E (10.7 to 36.5 GHz) soil moisture acquisitions limits their penetration depth to the top skin layer of the soil which is subject to record-high evaporation rates [35]. Additionally, the high soil porosity in the region implies that the surface moisture either rapidly evaporates or infiltrates to deeper soil layers, which AMSR-E frequencies are not sensitive to [3]. This is evident in Figure 2 where the AMSR-E soil moisture distribution is largely similar between the wet and dry seasons. The magnitude of the peaks has been varying throughout the years. After 2010, both time series show a consistent decrease with low seasonal variability, failing to recover to positive anomaly magnitudes. Both time series resulted in significant negative trend coefficients at the 5% significance level. Based on the established agreement, GRACE anomalies are used to conduct the study over the regional scale of the AP.

4.3. Modified Mann–Kendall Test and Spatial Linear Trends

The linear trend coefficients are calculated for each dataset during the overlapping coverage (2002–2011) and mapped in Figure 4 for (a) GRACE, (b) TRMM, and (c) AMSRE. The Modified Mann–Kendall Test was applied to the derived linear trends to assess their significance at a 5% significance level. The TRMM daily rainfall trends were found insignificant at the 5% significance level, but held significant at the 10% level. GRACE monthly water storage anomaly trends were found significant across the entire AP. Increasing AMSR-E monthly soil moisture trends in the northern regions were significant, while the decreasing trends in the southern regions were insignificant at the 5%, but tested significant at the 10% level.
Overall negative trend coefficients ranging from −8.6 × 10⁻² to −0.5 × 10⁻² cm/month are obtained across the entire study domain for GRACE, while both positive and negative trend coefficients ranging from −2.3 × 10⁻⁴ to 3.2 × 10⁻⁴ mm/day and, −1.5 × 10⁻⁴ to 2.7 × 10⁻⁴ g/cm3/month are determined for TRMM and AMSR-E, respectively.
The largest negative trend coefficients for GRACE (−8.6 × 10⁻² cm/month) are located in the northern part of the AP. Figure 4b,c show decreasing trends for TRMM and ASMR-E in the southern part of the AP and increasing trends in the northern part. There is a noticeable agreement between TRMM rainfall and AMSR-E soil moisture trends and their spatial distribution, which is not captured in the analysis of Figure 2. Although GRACE data show a negative trend across the entire study domain, the most significant decline is recorded in the northern regions, where, conversely, rainfall and soil moisture experience increasing trends.

4.4. Change Point Monitoring

Figure 5 depicts a map of change point timings (years) detected by the CUSUM method for both (a) GRACE and (b) TRMM. The complete coverage period is used for each product. TRMM change points range from 2003 to 2010 since only inner-quartile years of the time series (1999–2015) can be reliably inspected for potential change points. Change points during 2003–2006 are recorded in Oman, UAE, northern Saudi Arabia, and Yemen, with the exception of an area around central Yemen extending to the Oman border recording a change around 2010. Moreover, the more recent change points from 2006 to 2010 are observed in Kuwait and central Saudi Arabia. GRACE change points range from 2008 to 2010 and show the same inconsistency over the aforementioned central Yemen area with a change point around 2010. The application of the CUSUM method to the ASMR-E product returned inconclusive results and no change points were detected. This is attributed to the lower variability of moisture values across the region. In addition, the inevitable orbital gaps in the AMSR-E images introduce data gaps in the time series which undermine the application of the CUSUM method.
Further analysis involved dividing the time series to pre- and post-change point years, and assessing whether the slope directions showed different results than those obtained from the entire coverage period. This analysis was carried out for TRMM alone since GRACE had an insufficient temporal coverage for time series division. A sample size larger than 199 entries is recommended for the application of the CUSUM method [51,52]. A major change in precipitation variability in the region was marked by the occurrence of change points. Increasing trends are obtained for both the pre- and post-change point time series across the entire study domain. Recall that this finding is not consistent with the outcome of the analysis for the entire time series with decreasing trends over most of the southern part of the AP. This indicates that the change in the time series around the detected break point is significant and is associated with a change in the overall precipitation regime in the region which is discussed below.

5. Discussion

5.1. Spatial Analysis

The western coast of the AP and northern parts of Saudi Arabia record the highest values of the three key variables, particularly for the winter season, while higher values of TWS and precipitation are observed in the southern mountainous regions during the summer period. These results are related to the drastically different synoptic dynamics characterizing the northern and southern part of the AP. In fact, the northern and central regions of the AP receive the majority of precipitation during the winter season, in connection with the intrusion of extra-tropical cyclones from the Mediterranean, while the southern regime is mostly regulated by the summer tropical storm activity of the Arabian Sea and orographic processes [5,24,53].
Soil moisture monitoring is a challenging task, particularly in arid and hyper-arid environments. The persistently high soil moisture retrievals along the coastal areas are attributed the mixed sea-land pixels, while the higher soil moisture values in the north are attributed to the irrigation of agricultural establishments along with winter precipitation. Moreover, the high summer soil moisture values over the Hajar Mountains along the UAE border are the result of isolated orographic rainfall events of limited geographic extent triggered by local microscale weather processes [54]. Such local and short-lived rainfall events, although noticeable in the AMSR-E soil moisture product, are not captured by the TRMM product due to its coarse spatiotemporal resolution (the 0.25° daily product was used here), which does not necessarily coincide with their occurrence. It is also worth noting that the retrieval of soil moisture using passive microwave observation is less reliable over mountains and complex terrain [35]. This can undermine the quality of the product over the highlands in the southwestern region. Another source of uncertainty in the soil moisture retrieval in the region is attributed to the discrepancy between the passive microwave signal in terms of brightness temperature and the thermal temperature required for the retrieval. Both temperatures have different penetration depths in desert land cover. The thermal temperature is sensitive to the top few millimeters of soil whereas the microwave brightness temperature penetrates deeper in the soil layer depending on the soil texture [55,56]. The lack of in situ soil moisture observations and the challenges in carrying out such observations in the region hamper the verification and the enhancement of the local retrievals [12,57,58].
Despite negligible summer precipitation over the northern AP, the soil wetness is sustained, which is explained by the increasing agricultural activity in those areas [19]. More importantly, these areas correspond to the largest TWS depletion anomalies, which indicates the excessive reliance on groundwater extraction for irrigation. Infiltration of the northern winter precipitation marginally compensates for the groundwater extraction, as suggested by the stable anomalies (close to null). At this stage of the analysis, the results corroborate findings from previous studies regarding the control of anthropogenic factors, namely groundwater extraction, on water storage depletion over the northern AP [18]. However, the impact of climatic changes, particularly precipitation, on TWS variations across the domain remains less evident and is the subject of the following sections.

5.2. Linear Trend Analysis

The GRACE TWS depletion rates are found to be the highest (−6.9 × 10⁻² to −8.6 × 10⁻² cm/month) over northern Saudi Arabia and Kuwait, including, as expected, the aforementioned agricultural demand, which relies on excessive groundwater extraction. These depletion rates override the increasing trends of rainfall and soil moisture in that region in line with the findings of Sultan, et al. [18]. In fact, large areas of desert lands around central Saudi Arabia have been developed into highly productive farms with an actual agricultural water demand of 29.82 billion m3 or 94% of the total water consumption in 1994 [59].
The decrease of TWS anomalies in the southern part—reaching −2 × 10⁻² to −0.5 × 10⁻² cm/month over Yemen and Oman—was not as significant as in the case of the northern part of the AP, despite the southern decreasing trends of rainfall and soil moisture. The milder climatology and lower evapotranspiration rates over this region permit more recharge and, consequently, less groundwater depletion rates. Additionally, groundwater migration paths over the AP were studied by Alsharhan, et al. [60] who reported macro-flows from the northeast of Saudi Arabia towards the southeast. This may favor a time-lagged positive feedback between the increasing northern trends of rainfall (and soil moisture) and the southern TWS variability [3].
Oil production in the area, which requires pumping considerable volumes from underground reservoirs, may also be reflected in the storage variability. However, this storage loss is not considered in this work as most oil production activities are carried out in offshore locations. Furthermore, the seasonality of TWS variability as indicated by GRACE values (Figure 3) suggests that oil production does not dominate storage variability.

5.3. Change Point Monitoring

Considering the entire time series for assessing the trend direction and magnitude may be erroneous, particularly in the presence of change points in the time series marking a significant change in trend. Recall that it was noticed, in the case of TRMM data, which post- and pre-change point trends were increasing, while the overall time series showed a decreasing trend. Based on the comparison of the spatial distribution of change points between TRMM and GRACE, it is evident that there is a consistent pattern over central Saudi Arabia and Yemen. This implies that TWS variability at the macroscale is highly susceptible to changes in precipitation, and not solely controlled by anthropogenic extraction. Increasing trends of rainfall (pre- and post-2005 time series) were obtained over the southern part of the AP as opposed to the decreasing trends of the undivided time series. The increasing rainfall trend changes over the UAE agree with the increasing trends reported by Ouarda et al. [23] from their analysis based exclusively on rain gauge observations. They linked changes in the UAE rainfall regime to the variability in the equatorial Pacific sea surface temperatures—a teleconnection triggered by shifts of the upper level stream towards the Equator during the positive El Niño phase [61], ultimately impacting moisture in the region [62].
The difference in overpass time with AMSR-E is augmented by the high potential evapotranspiration in the region, which causes most of the rain to evaporate from the skin soil layer following a rain event. Additionally, ASMR-E uses high frequency, not L-band, which dictates low penetration depth and more sensitivity to the skin soil layer subject to the high evaporation. Nevertheless, soil moisture is an instantaneous short lasting response because of rapid drainage and evaporation. El-Nesr, et al. [63] explored changes in the reference evapotranspiration using weather station data across the AP from 1980 to 2008 to identify trend directions as an indicator to climate variability in the region. The annual daily evapotranspiration average was shown to increase from about 9.6 mm day−1 in 1980 to 10.5 mm day−1 in 2008. The increasing evapotranspiration trends explains the inconclusive change point statistics of the AMSR-E product, as most of the rainfall is being recaptured by the atmosphere rather than retained as soil moisture and partitioned to the subsurface.
Future work will involve using multi-satellite observations to generate longer time series for a more reliable analysis of the trends. Water storage variability could be extended through the use of surface and groundwater models as water storage observation are not available earlier. This is particularly challenging in the absence of reliable and comprehensive geological surveys in the region which makes the use of remote sensing as proposed in this study an attractive alternative.

6. Conclusions

The AP is known to be under severe water stress with only 200 m3/cp/year of renewable water which is alarmingly below the conventional water stress threshold of 500 m3/cp/year [64]. Hence, understanding the macro processes by large-scale monitoring of key hydrological variables, namely, rainfall, water storage, and soil moisture is essential. The time series of these parameters are obtained from remotely sensed datasets, namely, TRMM, GRACE, and AMSR-E. Trend analysis reveals an overall depletion of TWS over the entire AP, especially, the northern part while rainfall and soil moisture trends were decreasing over the southern part. Alternatively, an overall increasing rainfall trend was observed after change point division of the TRMM time series. Change point detection revealed significant spatial dependencies between the TRMM and GRACE products, especially around Yemen during 2010, indicating hotspots of climate change impacts on TWS variations that should be accounted for alongside anthropogenic factors.

Author Contributions

Conceptualization, M.T. and Y.W.; methodology, Y.W. and M.T.; data curation, Y.W.; software, Y.W.; visualization, Y.W.; writing—original draft preparation, Y.W.; writing—review and editing, M.T. All authors have read and agreed to the published version of the manuscript.

Funding

This study was conducted within the framework of a project funded by Masdar Institute of Science and Technology, entitled, “Hydrological Modeling and Remote Sensing for Flood Risk Assessment in the UAE” under grant number SSG2015-000060.

Data Availability Statement

The data presented in this study are available on request from the corresponding author.

Acknowledgments

The authors thank the UAE Ministry of Climate Change and Environment (MoCCAE) and the providers of TRMM, GRACE, and AMSR-E datasets. The TRMM V7 product is provided by the NASA Goddard Space Flight Centre and archived at https://disc.gsfc.nasa.gov/. AMSR-E data are produced by Remote Sensing Systems and sponsored by the NASA AMSR-E Science Team and the NASA Earth Science MEaSUREs Program. The GRACE product is also provided by the NASA MEaSUREs Program. Both datasets are available at https://earthdata.nasa.gov/.

Conflicts of Interest

The authors declare no conflict of interest.

References

  1. Zhao, J.; Temimi, M.; Ghedira, H. Characterization of harmful algal blooms (HABs) in the Arabian Gulf and the Sea of Oman using MERIS fluorescence data. ISPRS J. Photogramm. Remote Sens. 2015, 101, 125–136. [Google Scholar] [CrossRef]
  2. Zhao, J.; Temimi, M.; Ghedira, H.; Hu, C. Exploring the potential of optical remote sensing for oil spill detection in shallow coastal waters-a case study in the Arabian Gulf. Opt. Express 2014, 22, 13755–13772. [Google Scholar] [CrossRef]
  3. Wehbe, Y.; Temimi, M.; Ghebreyesus, D.T.; Milewski, A.; Norouzi, H.; Ibrahim, E. Consistency of precipitation products over the Arabian Peninsula and interactions with soil moisture and water storage. Hydrol. Sci. J. 2018, 63, 408–425. [Google Scholar] [CrossRef]
  4. El Kenawy, A.M.; McCabe, M.F. A multi-decadal assessment of the performance of gauge-and model-based rainfall products over Saudi Arabia: Climatology, anomalies and trends. Int. J. Climatol. 2016, 36, 656–674. [Google Scholar] [CrossRef] [Green Version]
  5. Almazroui, M.; Islam, M.N.; Jones, P.; Athar, H.; Rahman, M.A. Recent climate change in the Arabian Peninsula: Seasonal rainfall and temperature climatology of Saudi Arabia for 1979–2009. Atmos. Res. 2012, 111, 29–45. [Google Scholar] [CrossRef]
  6. Fekete, B.M.; Vörösmarty, C.J.; Roads, J.O.; Willmott, C.J. Uncertainties in precipitation and their impacts on runoff estimates. J. Clim. 2004, 17, 294–304. [Google Scholar] [CrossRef]
  7. Wehbe, Y.; Temimi, M.; Adler, R.F. Enhancing precipitation estimates through the fusion of weather radar, satellite retrievals, and surface parameters. Remote Sens. 2020, 12, 1342. [Google Scholar] [CrossRef] [Green Version]
  8. Wehbe, Y.; Temimi, M.; Weston, M.; Chaouch, N.; Branch, O.; Schwitalla, T.; Wulfmeyer, V.; Zhan, X.; Liu, J.; Al Mandous, A. Analysis of an extreme weather event in a hyper-arid region using WRF-Hydro coupling, station, and satellite data. Nat. Hazards Earth Syst. Sci. 2019, 19. [Google Scholar] [CrossRef] [Green Version]
  9. Wehbe, Y.; Ghebreyesus, D.; Temimi, M.; Milewski, A.; Al Mandous, A. Assessment of the consistency among global precipitation products over the United Arab Emirates. J. Hydrol. Reg. Stud. 2017, 12, 122–135. [Google Scholar] [CrossRef]
  10. Ghebreyesus, D.T.; Temimi, M.; Fares, A.; Bayabil, H.K. A multi-satellite approach for water storage monitoring in an arid watershed. Geosciences 2016, 6, 33. [Google Scholar] [CrossRef] [Green Version]
  11. Milewski, A.; Elkadiri, R.; Durham, M. Assessment and comparison of tmpa satellite precipitation products in varying climatic and topographic regimes in Morocco. Remote Sens. 2015, 7, 5697–5717. [Google Scholar] [CrossRef] [Green Version]
  12. AlJassar, H.K.; Temimi, M.; Entekhabi, D.; Petrov, P.; AlSarraf, H.; Kokkalis, P.; Roshni, N. Forward simulation of multi-frequency microwave brightness temperature over desert soils in Kuwait and comparison with satellite observations. Remote Sens. 2019, 11, 1647. [Google Scholar] [CrossRef] [Green Version]
  13. Ahmed, M.; Sultan, M.; Wahr, J.; Yan, E.; Milewski, A.; Sauck, W.; Becker, R.; Welton, B. Integration of GRACE (Gravity Recovery and Climate Experiment) data with traditional data sets for a better understanding of the time-dependent water partitioning in African watersheds. Geology 2011, 39, 479–482. [Google Scholar] [CrossRef] [Green Version]
  14. Joodaki, G.; Wahr, J.; Swenson, S. Estimating the human contribution to groundwater depletion in the Middle East, from GRACE data, land surface models, and well observations. Water Resour. Res. 2014, 50, 2679–2692. [Google Scholar] [CrossRef]
  15. Voss, K.A.; Famiglietti, J.S.; Lo, M.; Linage, C.; Rodell, M.; Swenson, S.C. Groundwater depletion in the Middle East from GRACE with implications for transboundary water management in the Tigris-Euphrates-Western Iran region. Water Resour. Res. 2013, 49, 904–914. [Google Scholar] [CrossRef] [Green Version]
  16. Yan, E.; Milewski, A.; Sultan, M.; Abdeldayem, A.; Soliman, F.; Abdel Gelil, K. Remote sensing based approach to improve regional estimation of renewable water resources for sustainable development. In Proceedings of the US-Egypt Workshop on Space Technology and Geo-Information for Sustainable Development, Cairo, Egypt, 14–17 June 2010; pp. 14–17. [Google Scholar]
  17. Milewski, A.; Sultan, M.; Jayaprakash, S.M.; Balekai, R.; Becker, R. RESDEM, a tool for integrating temporal remote sensing data for use in hydrogeologic investigations. Comput. Geosci. 2009, 35, 2001–2010. [Google Scholar] [CrossRef]
  18. Sultan, M.; Ahmed, M.; Wahr, J.; Yan, E.; Emil, M.K. Monitoring aquifer depletion from space: Case studies from the saharan and Arabian aquifers. Remote Sens. Terr. Water Cycle 2014, 206, 349. [Google Scholar]
  19. Abunayyan, B. Investigations for Updating the Groundwater Mathematical Model(s) of the Saq Overlying Aquifers; Ministry of Water and Electricity: Riyadh, Saudi Arabia, 2008.
  20. Rahmstorf, S.; Foster, G.; Cahill, N. Global temperature evolution: Recent trends and some pitfalls. Environ. Res. Lett. 2017, 12, 054001. [Google Scholar] [CrossRef]
  21. AlSarmi, S.H.; Washington, R. Changes in climate extremes in the Arabian Peninsula: Analysis of daily data. Int. J. Climatol. 2014, 34, 1329–1345. [Google Scholar] [CrossRef]
  22. Athar, H. Trends in observed extreme climate indices in Saudi Arabia during 1979–2008. Int. J. Climatol. 2014, 34, 1561–1574. [Google Scholar] [CrossRef]
  23. Ouarda, T.; Charron, C.; Kumar, K.N.; Marpu, P.; Ghedira, H.; Molini, A.; Khayal, I. Evolution of the rainfall regime in the United Arab Emirates. J. Hydrol. 2014, 514, 258–270. [Google Scholar] [CrossRef] [Green Version]
  24. Yousef, L.A.; Temimi, M.; Wehbe, Y.; Al Mandous, A. Total cloud cover climatology over the United Arab Emirates. Atmos. Sci. Lett. 2019, 20, e883. [Google Scholar] [CrossRef]
  25. Abdouli, K.A.; Hussein, K.; Ghebreyesus, D.; Sharif, H.O. Coastal runoff in the United Arab Emirates—The hazard and opportunity. Sustainability 2019, 11, 5406. [Google Scholar] [CrossRef] [Green Version]
  26. Alsumaiti, T.S.; Hussein, K.; Ghebreyesus, D.T.; Sharif, H.O. Performance of the CMORPH and GPM IMERG Products over the United Arab Emirates. Remote Sens. 2020, 12, 1426. [Google Scholar] [CrossRef]
  27. Harrower, M.J. Geographic information systems (GIS) hydrological modeling in archaeology: An example from the origins of irrigation in Southwest Arabia (Yemen). J. Archaeol. Sci. 2010, 37, 1447–1452. [Google Scholar] [CrossRef]
  28. Land Process Distributed Active Archive Center. Global 30 Arc-Second Elevation Data Set GTOPO30; Land Process Distributed Active Archive Center: Sioux Falls, SD, USA, 2004.
  29. De Pauw, E. An Agroecological Exploration of the Arabian Peninsula; Icarda: Bekaa Valley, Lebanon, 2002. [Google Scholar]
  30. Yousef, L.A.; Temimi, M.; Molini, A.; Weston, M.; Wehbe, Y.; Al Mandous, A. Cloud cover over the Arabian peninsula from global remote sensing and reanalysis products. Atmos. Res. 2020, 238, 104866. [Google Scholar] [CrossRef]
  31. Breed, D.; Jensen, T.; Bruintjes, R.; Piketh, S.; Al Mangoosh, A.; Al Mandoos, A. Precipitation development in convective clouds over the eastern Arabian Peninsula. In Proceedings of the 16th Conference on Planned and Inadvertent Weather Modification (85th AMS Annual), San Diego, CA, USA, 11 January 2005; pp. 9–13. [Google Scholar]
  32. Sherif, M.; Almulla, M.; Shetty, A.; Chowdhury, R.K. Analysis of rainfall, PMP and drought in the United Arab Emirates. Int. J. Climatol. 2014, 34, 1318–1328. [Google Scholar] [CrossRef]
  33. Huffman, G.J.; Bolvin, D.T. TRMM and Other Data Precipitation Data Set Documentation; NASA: Greenbelt, MD, USA, 2013; pp. 1–40.
  34. Chen, S.; Hong, Y.; Cao, Q.; Gourley, J.J.; Kirstetter, P.E.; Yong, B.; Tian, Y.; Zhang, Z.; Shen, Y.; Hu, J. Similarity and difference of the two successive V6 and V7 TRMM multisatellite precipitation analysis performance over China. J. Geophys. Res. Atmos. 2013, 118, 13060–13074. [Google Scholar] [CrossRef]
  35. Njoku, E.G. AMSR Land Surface Parameters, Algorithm Theoretical Basis Document, Version 3.0; NASA Jet Propulsion Laboratory: Pasadena, CA, USA, 1999.
  36. Njoku, E.G.; Jackson, T.J.; Lakshmi, V.; Chan, T.K.; Nghiem, S.V. Soil moisture retrieval from AMSR-E. IEEE Trans. Geosci. Remote Sens. 2003, 41, 215–229. [Google Scholar] [CrossRef]
  37. Al-Yaari, A.; Wigneron, J.-P.; Ducharne, A.; Kerr, Y.; de Rosnay, P.; de Jeu, R.; Govind, A.; Al Bitar, A.; Albergel, C.; Munoz-Sabater, J. Global-scale evaluation of two satellite-based passive microwave soil moisture datasets (SMOS and AMSR-E) with respect to Land Data Assimilation System estimates. Remote Sens. Environ. 2014, 149, 181–195. [Google Scholar] [CrossRef] [Green Version]
  38. Al-Jassar, H.K.; Rao, K.S. Monitoring of soil moisture over the Kuwait desert using remote sensing techniques. Int. J. Remote Sens. 2010, 31, 4373–4385. [Google Scholar] [CrossRef]
  39. Tekeli, A.E.; Fouli, H. Reducing false flood warnings of TRMM rain rates thresholds over Riyadh City, Saudi Arabia by utilizing AMSR-E soil moisture information. Water Resour. Manag. 2017, 31, 1243–1256. [Google Scholar] [CrossRef]
  40. Landerer, F.W.; Swenson, S. Accuracy of scaled GRACE terrestrial water storage estimates. Water Resour. Res. 2012, 48. [Google Scholar] [CrossRef]
  41. Jing, W.; Zhang, P.; Zhao, X. A comparison of different GRACE solutions in terrestrial water storage trend estimation over Tibetan Plateau. Sci. Rep. 2019, 9, 1–10. [Google Scholar] [CrossRef] [PubMed] [Green Version]
  42. Swenson, S.; Wahr, J. Post-processing removal of correlated errors in GRACE data. Geophys. Res. Lett. 2006, 33. [Google Scholar] [CrossRef]
  43. Oliver, M.A.; Webster, R. Kriging: A method of interpolation for geographical information systems. Int. J. Geogr. Inf. Syst. 1990, 4, 313–332. [Google Scholar] [CrossRef]
  44. Hamed, K.H.; Rao, A.R. A modified Mann-Kendall trend test for autocorrelated data. J. Hydrol. 1998, 204, 182–196. [Google Scholar] [CrossRef]
  45. Mann, H.B. Nonparametric tests against trend. Econ. J. Econ. Soc. 1945, 13, 245–259. [Google Scholar] [CrossRef]
  46. Kendall, M. Multivariate Analysis; Charles Griffin: Glasgow, Scotland, 1975. [Google Scholar]
  47. Page, E. Continuous inspection schemes. Biometrika 1954, 41, 100–115. [Google Scholar] [CrossRef]
  48. Cao, J.; Chen, A.; Bu, T.; Buvaneswari, A. Monitoring time-varying network streams using state-space models. In Proceedings of the INFOCOM 2009, Rio de Janeiro, Brazil, 19–25 April 2009; pp. 2721–2725. [Google Scholar]
  49. Bettadpur, S. Product Specification Document Center for Space Research; The University of Texas at Austin: Austin, TX, USA, 2007. [Google Scholar]
  50. García-García, D.; Ummenhofer, C.C.; Zlotnicki, V. Australian water mass variations from GRACE data linked to Indo-Pacific climate variability. Remote Sens. Environ. 2011, 115, 2175–2183. [Google Scholar] [CrossRef] [Green Version]
  51. Kundzewicz, Z.W.; Robson, A.J. Change detection in hydrological records—A review of the methodology/revue méthodologique de la détection de changements dans les chroniques hydrologiques. Hydrol. Sci. J. 2004, 49, 7–19. [Google Scholar] [CrossRef]
  52. Faulkner, D.; Jones, D. The FORGEX method of rainfall growth estimation III: Examples and confidence intervals. Hydrol. Earth Syst. Sci. 1999, 3, 205–212. [Google Scholar] [CrossRef] [Green Version]
  53. Beaumont, P.; Blake, G.H.; Wagstaff, J.M. The Middle East: A Geographical Study; David Fulton Publishers: London, UK, 1988. [Google Scholar]
  54. Branch, O.; Behrendt, A.; Gong, Z.; Schwitalla, T.; Wulfmeyer, V. Convection Initiation over the Eastern Arabian Peninsula. Meteorol. Z. 2020, 67–77. [Google Scholar] [CrossRef]
  55. Norouzi, H.; Temimi, M.; AghaKouchak, A.; Azarderakhsh, M.; Khanbilvardi, R.; Shields, G.; Tesfagiorgis, K. Inferring land surface parameters from the diurnal variability of microwave and infrared temperatures. Phys. Chem. Earth Parts A/B/C 2015, 83, 28–35. [Google Scholar] [CrossRef]
  56. Norouzi, H.; Temimi, M.; Prigent, C.; Turk, J.; Khanbilvardi, R.; Tian, Y.; Furuzawa, F.; Masunaga, H. Assessment of the consistency among global microwave land surface emissivity products. Atmos. Meas. Technol. 2015, 8, 1197–1205. [Google Scholar] [CrossRef] [Green Version]
  57. Fares, A.; Temimi, M.; Morgan, K.; Kelleners, T.J. In-situ and remote soil moisture sensing technologies for vadose zone hydrology. Vadose Zone J. 2013, 12. [Google Scholar] [CrossRef] [Green Version]
  58. AlJassar, H.; Petrov, P.; Entekhabi, D.; Temimi, M.; Kodiyan, N.; Ansari, M. Preliminary field results of soil moisture from Kuwait desert as a core validation site of SMAP satellite. In Proceedings of the Geoscience and Remote Sensing Symposium (IGARSS), 2015 IEEE International, Milan, Italy, 26–31 July 2015; pp. 972–975. [Google Scholar]
  59. Dabbagh, A.E.; Abderrahman, W.A. Management of groundwater resources under various irrigation water use scenarios in Saudi Arabia. Arab. J. Sci. Eng. 1997, 22, 47–64. [Google Scholar]
  60. Alsharhan, A.S.; Rizk, Z.; Nairn, A.E.M.; Bakhit, D.; Alhajari, S. Hydrogeology of an Arid Region: The Arabian Gulf and Adjoining Areas; Elsevier: Amsterdam, The Netherlands, 2001. [Google Scholar]
  61. Athar, H. Teleconnections and variability in observed rainfall over Saudi Arabia during 1978–2010. Atmos. Sci. Lett. 2015, 16, 373–379. [Google Scholar] [CrossRef]
  62. Niranjan Kumar, K.; Ouarda, T. Precipitation variability over UAE and global SST teleconnections. J. Geophys. Res. Atmos. 2014, 119, 10313–10322. [Google Scholar] [CrossRef]
  63. El-Nesr, M.; Alazba, A.; Abu-Zreig, M. Analysis of evapotranspiration variability and trends in the Arabian Peninsula. Am. J. Environ. Sci. 2010, 6, 535–547. [Google Scholar] [CrossRef] [Green Version]
  64. Alkolibi, F.M. Possible effects of global warming on agriculture and water resources in Saudi Arabia: Impacts and responses. Clim. Chang. 2002, 54, 225–245. [Google Scholar] [CrossRef]
Figure 1. Terrain elevations (a) and soil types (b) from the GTOPO30 Digital Elevation Model [28] and De Pauw [29], respectively. The spatial distribution of the observational well network in the United Arab Emirates (UAE) is shown in subplot (c).
Remotesensing 13 00247 g001
Figure 2. Spatial distribution of Gravity Recovery and Climate Experiment Total Water Storage (GRACE TWS) anomalies (a,b), Tropical Rainfall Measuring Mission (TRMM) precipitation (c,d), and Advanced Microwave Scanning Radiometer for Earth Observing System (AMSR-E) soil moisture (e,f) averaged from 2002 to 2011 for winter (December, January, February, and March—DJFM) and summer (June, July, August, and September—JJAS) periods.
Remotesensing 13 00247 g002
Figure 3. Time series of GRACE TWS and mean well observation anomalies over the UAE test site.
Remotesensing 13 00247 g003
Figure 4. Spatially distributed slopes of linear trends from GRACE (a), TRMM (b), and AMSR-E (c) datasets.
Remotesensing 13 00247 g004
Figure 5. Spatial distribution of detectable change points within the GRACE (a) and TRMM (b) time series.
Remotesensing 13 00247 g005
Table 1. Temporal coverages and resolutions of the Gravity Recovery and Climate Experiment (GRACE), Tropical Rainfall Measuring Mission (TRMM), and Advanced Microwave Scanning Radiometer for Earth Observing System (AMSR-E) datasets.
VariableProductTemporal CoverageSpatiotemporal Resolution
Water storageGRACEApril 2002–October 20171°; Monthly
PrecipitationTRMMJanuary 1999–July 20150.25°; Daily
Soil moistureAMSR-EJune 2002–September 20110.25°; Daily
Publisher’s Note: MDPI stays neutral with regard to jurisdictional claims in published maps and institutional affiliations.

