Abstract
The Climate Hazards Group InfraRed Precipitation with Station data (CHIRPS), which incorporates satellite imagery and in situ station information, is a new high-resolution long-term precipitation dataset available since 1981. This study aims to understand the performance of the latest version of CHIRPS in depicting the multiple timescale precipitation variation over Taiwan. The analysis is focused on examining whether CHIRPS is better than another satellite precipitation product—the Integrated Multi-satellitE Retrievals for Global Precipitation Mission (GPM) final run (hereafter IMERG)—which is known to effectively capture the precipitation variation over Taiwan. We carried out the evaluations made for annual cycle, seasonal cycle, interannual variation, and daily variation during 2001–2019. Our results show that IMERG is slightly better than CHIRPS considering most of the features examined; however, CHIRPS performs better than that of IMERG in representing the (1) magnitude of the annual cycle of monthly precipitation climatology, (2) spatial distribution of the seasonal mean precipitation for all four seasons, (3) quantitative precipitation estimation of the interannual variation of area-averaged winter precipitation in Taiwan, and (4) occurrence frequency of the non-rainy grids in winter. Notably, despite the fact that CHIRPS is not better than IMERG for many examined features, CHIRPS can depict the temporal variation in precipitation over Taiwan on annual, seasonal, and interannual timescales with 95% significance. This highlights the potential use of CHIRPS in studying the multiple timescale variation in precipitation over Taiwan during the years 1981–2000, for which there are no data available in the IMERG database.
1. Introduction
As an important component in hydrological cycles, precipitation has a large impact on agriculture, economy, and environment. In traditional methods, rain gauges are the main source of direct precipitation data [1]. However, the use of rain gauges is often limited by complex terrain and they are ineffective in high-altitude areas. Radar is another method to obtain precipitation measurement and has a better spatial coverage than rain gauges, but this method is limited by terrain and distance. Satellite precipitation products (SPPs) provide a better spatial coverage of precipitation measurements than rain gauges and radar. Therefore, it has been widely used in various research studies [2,3,4,5,6,7,8,9,10,11,12,13].
Currently, there are many SPPs available for research use, including Climate Hazards Group InfraRed Precipitation with Station data (CHIRPS) [14], Climate Prediction Center (CPC) MORPHing technique (CMORPH) [15], Global Satellite Mapping of Precipitation (GSMaP) [16], Integrated Multi-satellitE Retrievals for Global Precipitation Measurement (IMERG) [17], Precipitation Estimation from Remotely Sensed Information using Artificial Neural Networks (PERSIANN) [18], and Tropical Rainfall Measurement Mission (TRMM) Multi-satellite Precipitation Analysis (TMPA) [19]. Many studies have demonstrated that the performance of the above-mentioned SPPs depends on the region [20] and altitude [21]. Therefore, it is important to evaluate the performance of precipitation over complex terrain [9,11,22].
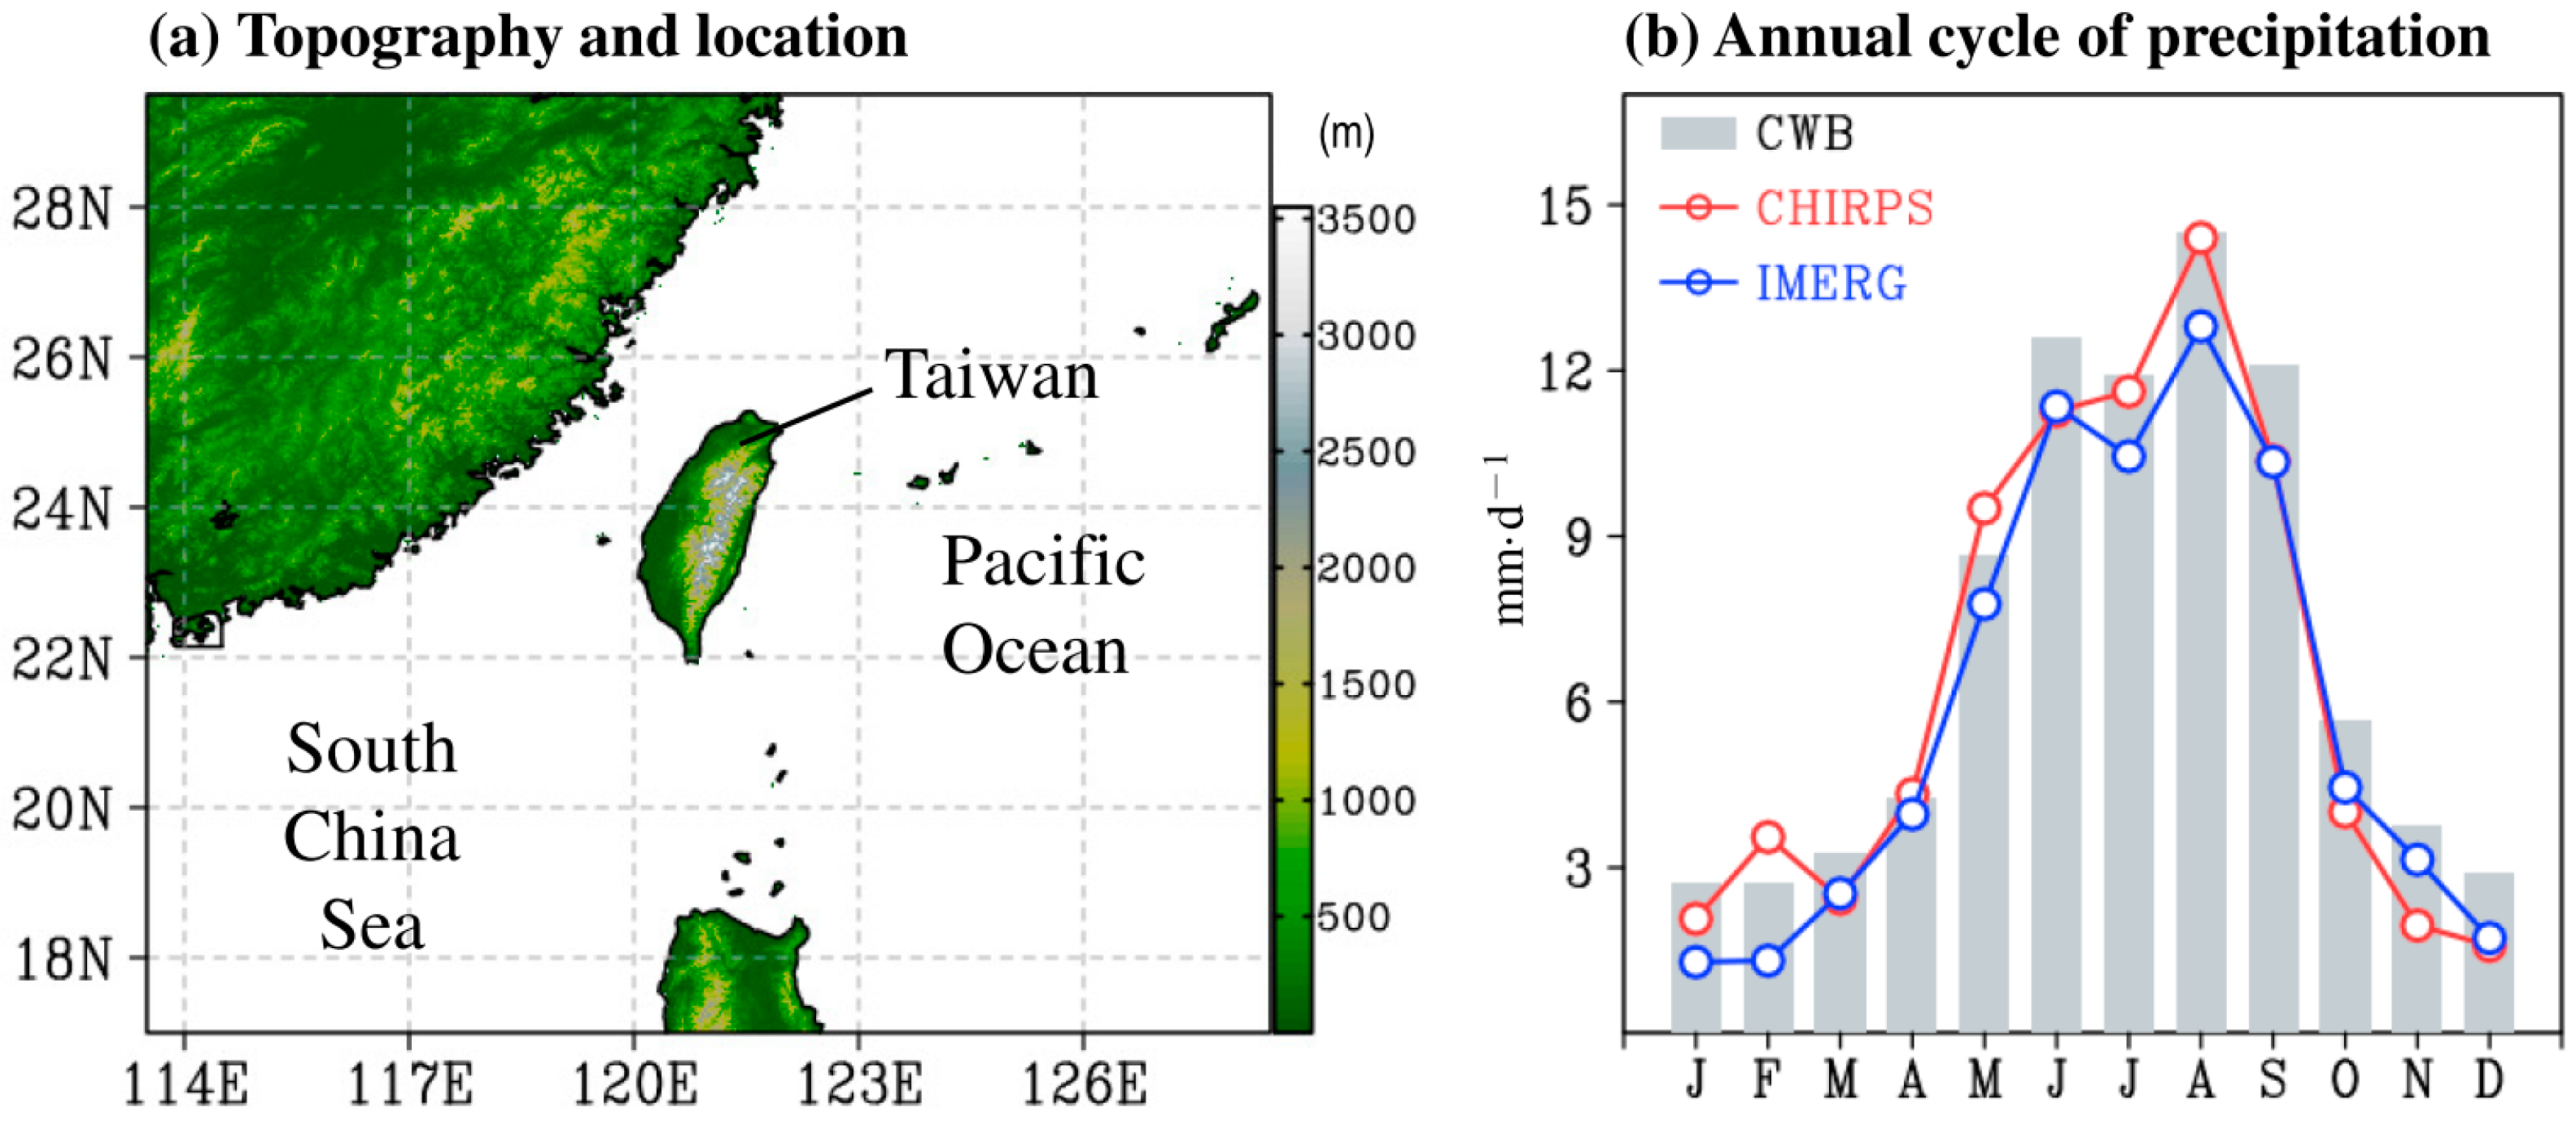
Located over the East Asia-western North Pacific region, Taiwan (119.9°E–122.1°E, 21.8°N–25.5°N) is an island with complex orographic features (Figure 1a), making it an ideal location for evaluating the performance of SPPs. Earlier studies have indicated that the precipitation characteristics of Taiwan are mainly modulated by two monsoon components (winter and summer), and, thus, clear seasonal variations exist [1,23,24,25]. Many studies have examined the performance of SPPs over Taiwan [9,11,21,26,27,28]. Huang and Wang [27] noted that TMPA 3B42 is suitable for analyzing the late-spring and pre-summer season of precipitation in Taiwan. Chen and Huang [28] compared the performance of TMPA 3B42, PERSIANN, and CMORPH in illustrating the seasonal variation of precipitation over Taiwan. They indicated that TMPA 3B42 had the best performance among the examined SPPs. Huang et al. [9] analyzed IMERG-Final v5 and indicated that it can qualitatively depict the seasonal variations in precipitation over Taiwan. Huang et al. [11] further compared the performance of the latest IMERG-Final v6 with other SPPs (including TMPA 3B42 and GSMaP-Gauge). They reported that IMERG-Final v6 was the most effective in capturing the interannual variation of summer precipitation over Taiwan. However, the performance of CHIRPS in depicting the seasonal variations of precipitation over Taiwan has not yet been examined in detail.
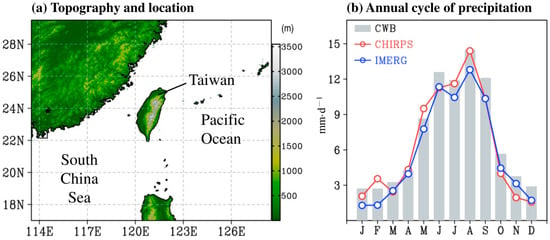
Figure 1.
(a) Location and topography of Taiwan, (b) annual cycle of 19-year mean (2001–2019) of monthly precipitation (area-averaged) over Taiwan. In (b), the gray bar, red line, and blue line represent the estimation of precipitation from CWB, CHIRPS, and IMERG, respectively. Hereafter and in this figure, alphabets J to D (left to right on the x-axis) represent the months from January to December.
The CHIRPS database, which was developed by the scientists from the United States Geological Survey (USGS) and the University of California, Santa Barbara (UCSB), was designed to support agriculture and drought monitoring where rain gauges were of little use [14]. The dataset of CHIRPS has daily data available since 1981 to present, which is longer than that offered by other SPPs, allowing researchers to investigate long-term changes of precipitation [29,30,31]. Earlier studies have indicated that CHIRPS agreed with the observational precipitation characteristics over various regions, including Brazil [32], Nigeria [33], Ghana [34], and Yemen [35]. In contrast, other studies have indicated that CHIRPS does not perform well over river basins in northwestern and northern China [36], including the Yellow River Basin [37]. Therefore, it is questionable whether the latest version (i.e., v2) of CHIRPS is capable of depicting the daily and monthly precipitation characteristics over Taiwan; the main objective of this study is to examine this issue.
Considering that Huang et al. [11] indicated that IMERG-Final v6 performed well in depicting the summer precipitation variation, we also compared the performance of CHIRPS v2 with that of IMERG-Final v6 to clarify which dataset is more suitable for studying precipitation variations over Taiwan. Our analysis focuses on the overlapping time periods of CHIRPS v2 and IMERG-Final v6 (2001–2019). The data and methodology applied to the evaluation are introduced in Section 2. Section 3 demonstrates our results for the evaluation of precipitation variations at multiple timescales (including annual, seasonal, interannual, and daily), and the conclusions are presented in Section 4.
2. Data and Methods
2.1. Data
To evaluate the performance of SPPs, we used the daily observation data from 436 rain gauges during the years 2001–2019 provided by the Central Weather Bureau in Taiwan as the reference base. Similar to Huang et al. [11], the gridded rain gauge data (called CWB hereinafter) were generated using the Cressman scheme [38], with a spatial-temporal resolution of 0.1° × 0.1° per day. For the SPPs, we obtained CHIRPS v2 from https://www.chc.ucsb.edu/data/chirps and IMERG-Final v6 from https://pmm.nasa.gov/data-access/downloads/gpm. The information of these two datasets is briefly summarized below.
The data from CHIRPS v2 have a spatial resolution of 0.05° × 0.05° and temporal resolution of daily, 5-day, 10-day, and monthly available since 1981. To compare with CWB, CHIRPS v2′s spatial resolution was integrated (i.e., averaged or binned) from 0.05° × 0.05° to 0.1° × 0.1°. According to Funk et al. [14], CHIRPS v2 was generated from a combination of several data sources, including the (1) Climate Hazards Precipitation Climatology (CHPclim) [39], (2) quasi-global geostationary infrared (IR) satellite observations, (3) TMPA 3B42 product [19], (4) atmospheric model precipitation fields from the National Oceanic and Atmospheric Administration (NOAA) Climate Forecast System (CFS) v2 [40], and (5) precipitation observations from more than 12,000 stations worldwide.
The data from IMERG-Final v6 have a spatial resolution of 0.1° × 0.1° and a half-hour temporal resolution. According to Huffman et al. [17], the IMERG-Final v6 takes advantage of three multi-satellite algorithms i.e., it uses a morphing technique from CMORPH [15]; the gridded estimate is supplemented via the Kalman filter followed by the use of the PERSIANN algorithm [41], and it is calibrated by the Global Precipitation Climatology Centre (GPCC) monthly gauge analyses that follow the TMPA method [19]. Hereafter, to make the discussion more concise, CHIRPS v2 and IMERG-Final v6 are simply called CHIRPS and IMERG, respectively.
2.2. Methods
In this study, the correlation coefficient (CC) and root mean square error (RMSE) were calculated based on Equations (1) and (2), respectively:
where N is the sample size, is the mean of the SPP data averaged over all sample sizes, and is the mean of the CWB data averaged over all sample sizes. Using Equation (1), the temporal correlation (Tcorr) and the spatial correlation (Scorr) were calculated to help validate the performance of the SPPs in capturing the temporal and spatial precipitation distribution. Using Equation (2), the RMSE was calculated to quantify the error between CWB and SPPs. The perfect value for Tcorr and Scorr is 1, whereas that for RMSE is 0 [42].
Additionally, three frequently used skill scores, including the threat score (TS), probability of detection (POD), and false alarm ratio (FAR), were calculated to validate the estimated precipitation. Following Ebert [43], these scores were calculated based on Equations (3)–(5), respectively:
where H, F, and M represent hits, false alarms, and misses, respectively. As shown in the 2 × 2 contingency table (Table 1), hits indicate that the rainy events presented in CWB are also presented in the SPP. Misses indicate that the rainy events presented in CWB are absented in the SPP. False alarms indicate that the rainy events presented in the SPP are absented in CWB. Correct rejections represent that the rainy events absented in both CWB and the SPP. The perfect value for TS and POD is 1 and for FAR is 0 [43].

Table 1.
Contingency table for calculated skill scores of threat score (TS), probability of detection (POD), and false alarm rate (FAR) between CWB and two SPPs.
3. Results
3.1. Temporal Variations of Monthly and Seasonal Precipitation
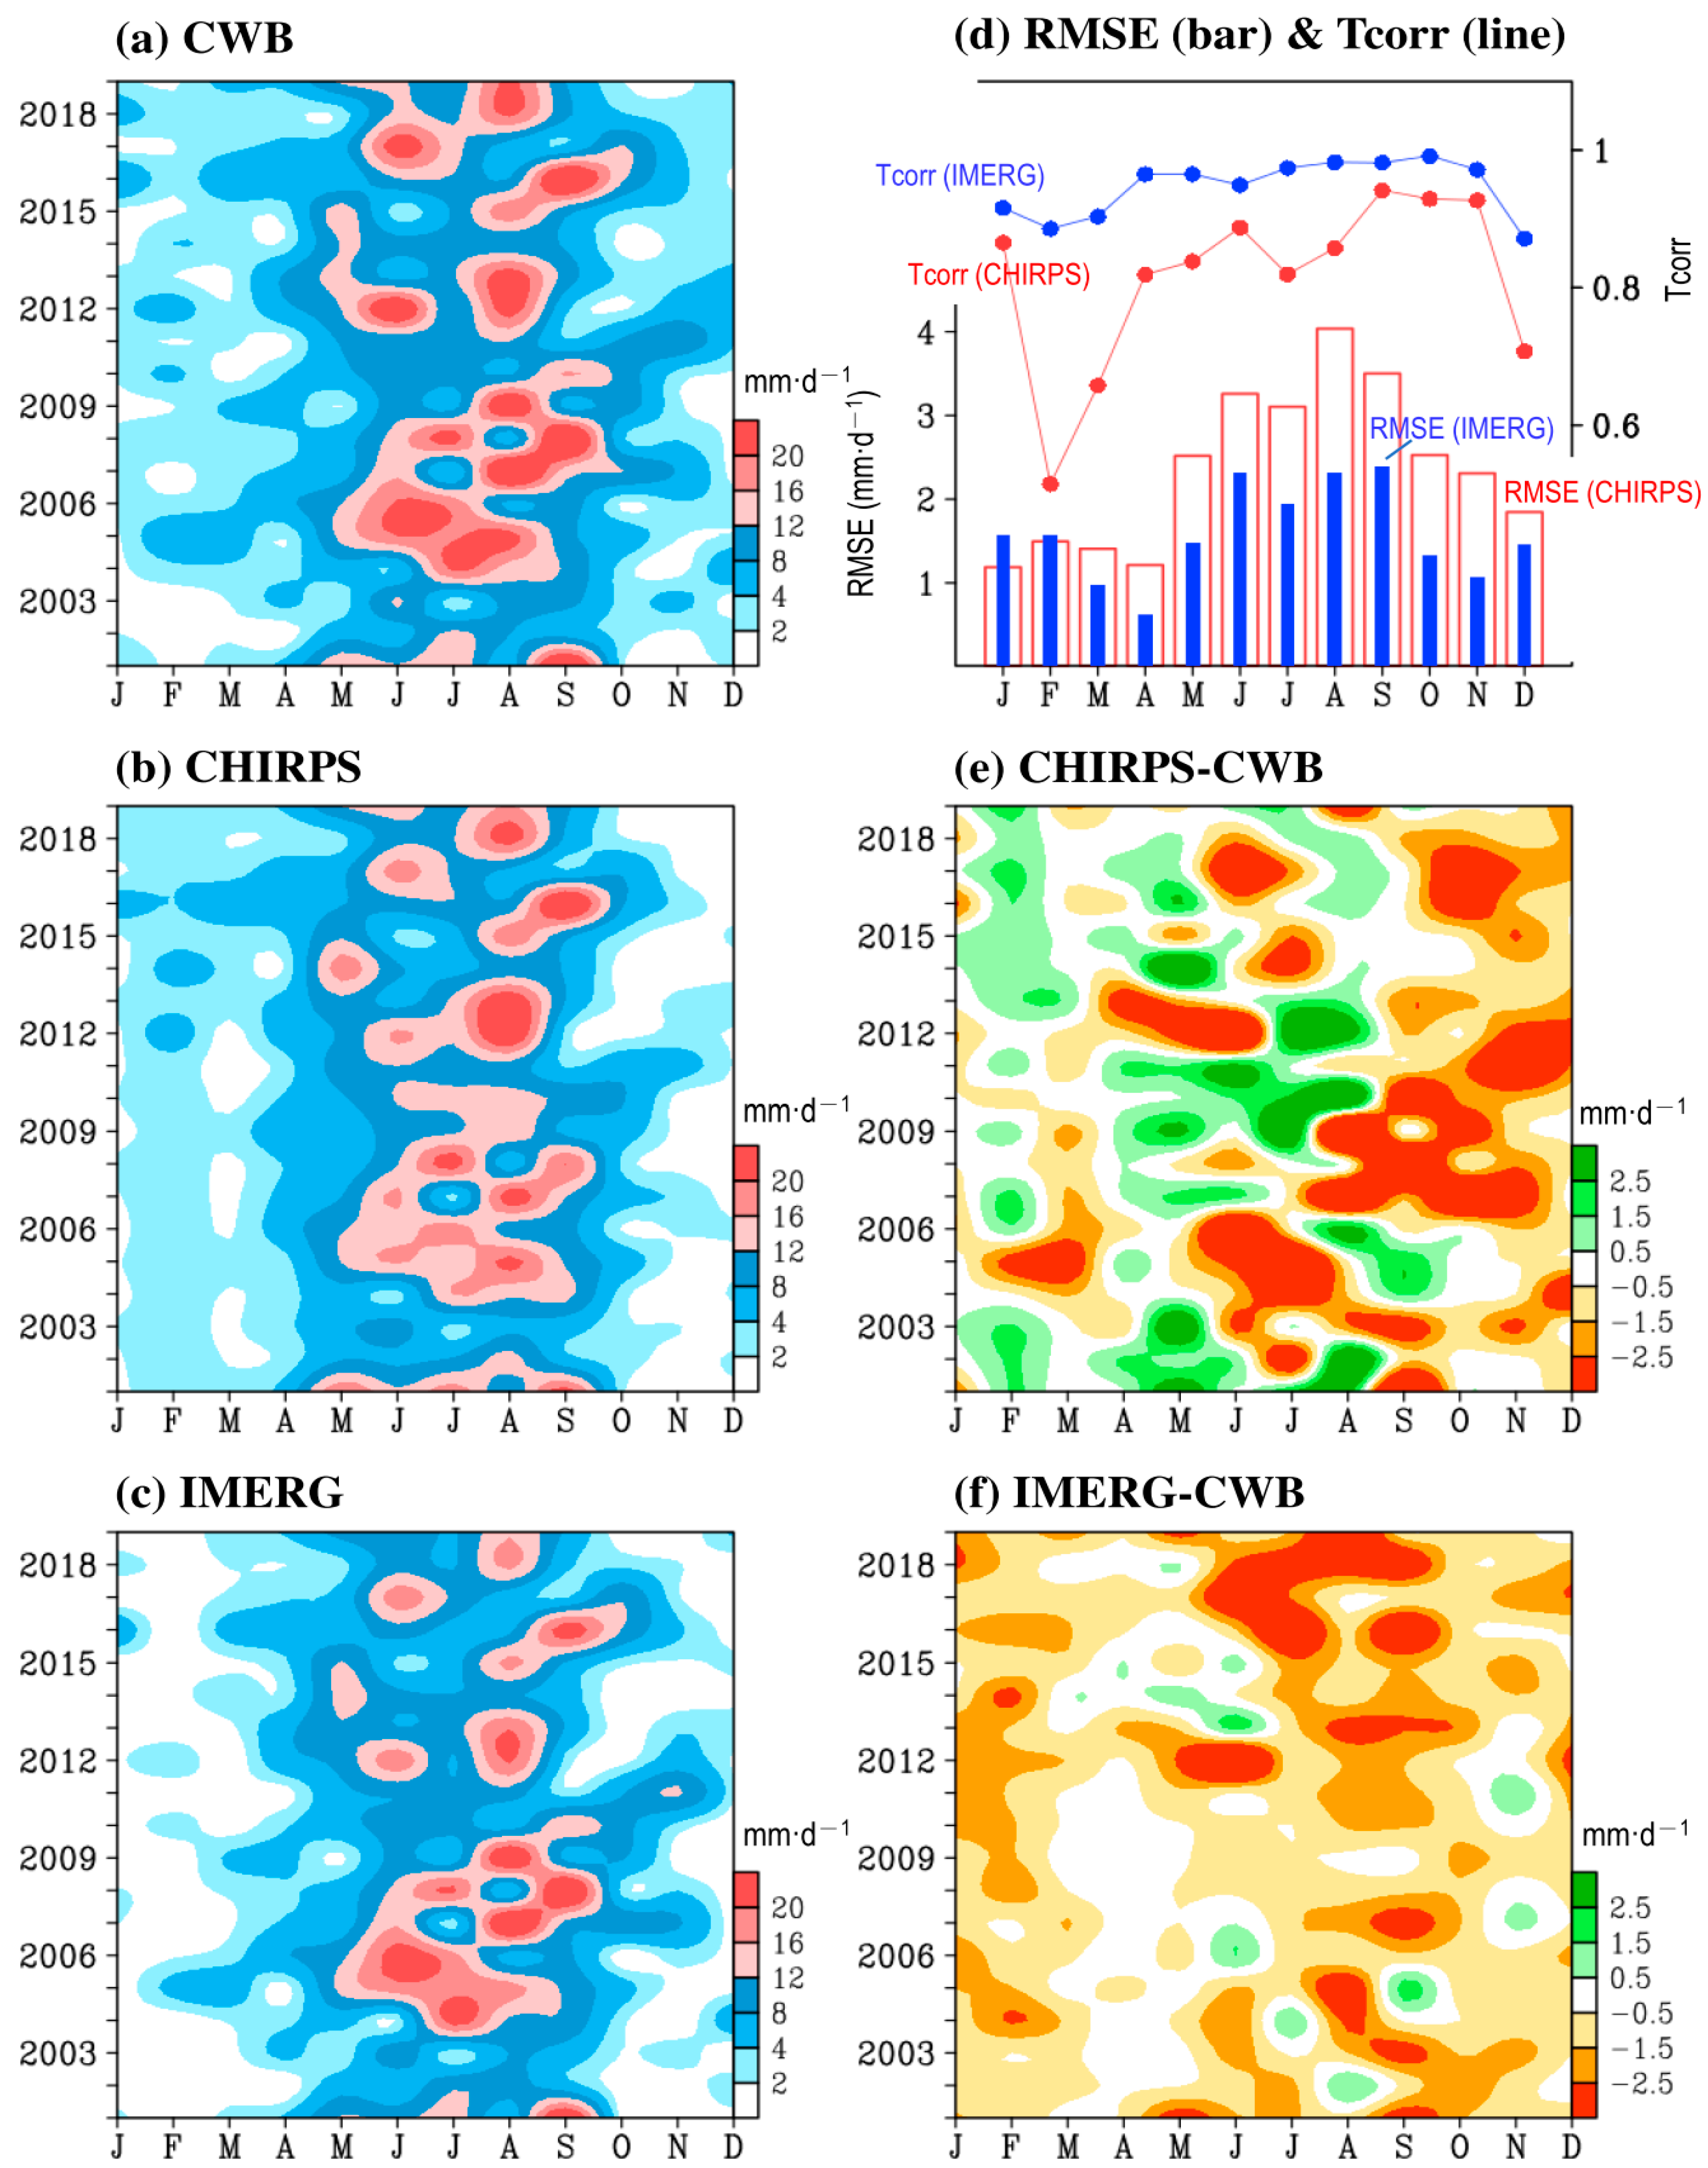
Figure 1b shows the climatological mean (averaged during 2001–2019) annual cycle of monthly precipitation over Taiwan (area-averaged) obtained from CWB and two SPPs. It is found that both CHIRPS (red line) and IMERG (blue line) can successfully capture the rainy season (May to September). Compared to CWB, IMERG tends to underestimate the monthly precipitation in all months, while CHIRPS has a better precipitation estimation than that of IMERG for the rainy season, especially in July and August. By calculating the Tcorr and RMSE between CWB and SPPs in Figure 1b (Table 2), we found that IMERG (that has a higher Tcorr) is slightly better than CHIRPS in illustrating the phase evolution of the annual cycle of precipitation, while CHIRPS (with a smaller RMSE) is slightly better than IMERG in the quantitative precipitation estimation of monthly precipitation. These mentioned features are further demonstrated in a long-term mean status (i.e., a climatological feature). To further clarify the performance of IMERG and CHIRPS on a monthly basis for each year from 2001–2019, the related year (y-axis) vs. month (x-axis) plot is illustrated in Figure 2a–c for CWB, CHIRPS, and IMERG, respectively.

Table 2.
Temporal correlation coefficient (Tcorr) and root mean square error (RMSE; unit: mm·d−1) for comparison between time series of CWB and two SPPs given in Figure 1b.
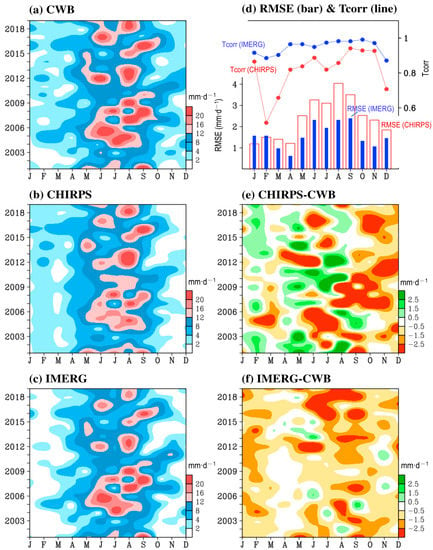
Figure 2.
Year (y-axis) versus month (x-axis) of area-averaged monthly precipitation over Taiwan for the time period 2001–2019, estimated from (a) CWB, (b) CHIRPS, and (c) IMERG. (d) is based on (a–c) for temporal correlation (Tcorr, line) and root mean square error (RMSE, bar) between CWB and selected SPPs [CHIRPS (red) or IMERG (blue)] calculated using time series of precipitation from January to December during 2001–2019. (e) is the difference between (b,a). (f) is t+he difference between (c,a).
Visually, compared to CHIRPS (Figure 2b), IMERG (Figure 2c) is closer to CWB (Figure 2a) in most years, especially from May to September. Statistically, a comparison between CWB and two SPPs shows that IMERG has a better performance (i.e., larger Tcorr and smaller RMSE) than CHIRPS in depicting the interannual variation of precipitation for most months, except January for which the RMSE in IMERG was found to be larger than that in CHIRPS (Figure 2d). In other words, even though IMERG frequently underestimated the monthly precipitation in Taiwan (Figure 2f), it still had a better estimation of interannual precipitation variation than CHIRPS for most months. As for CHIRPS, we found that (as shown in Figure 2e), it had performed unstably (sometimes overestimated and sometimes underestimated) when carrying out precipitation estimation with respect to the interannual variation in the monthly precipitation.
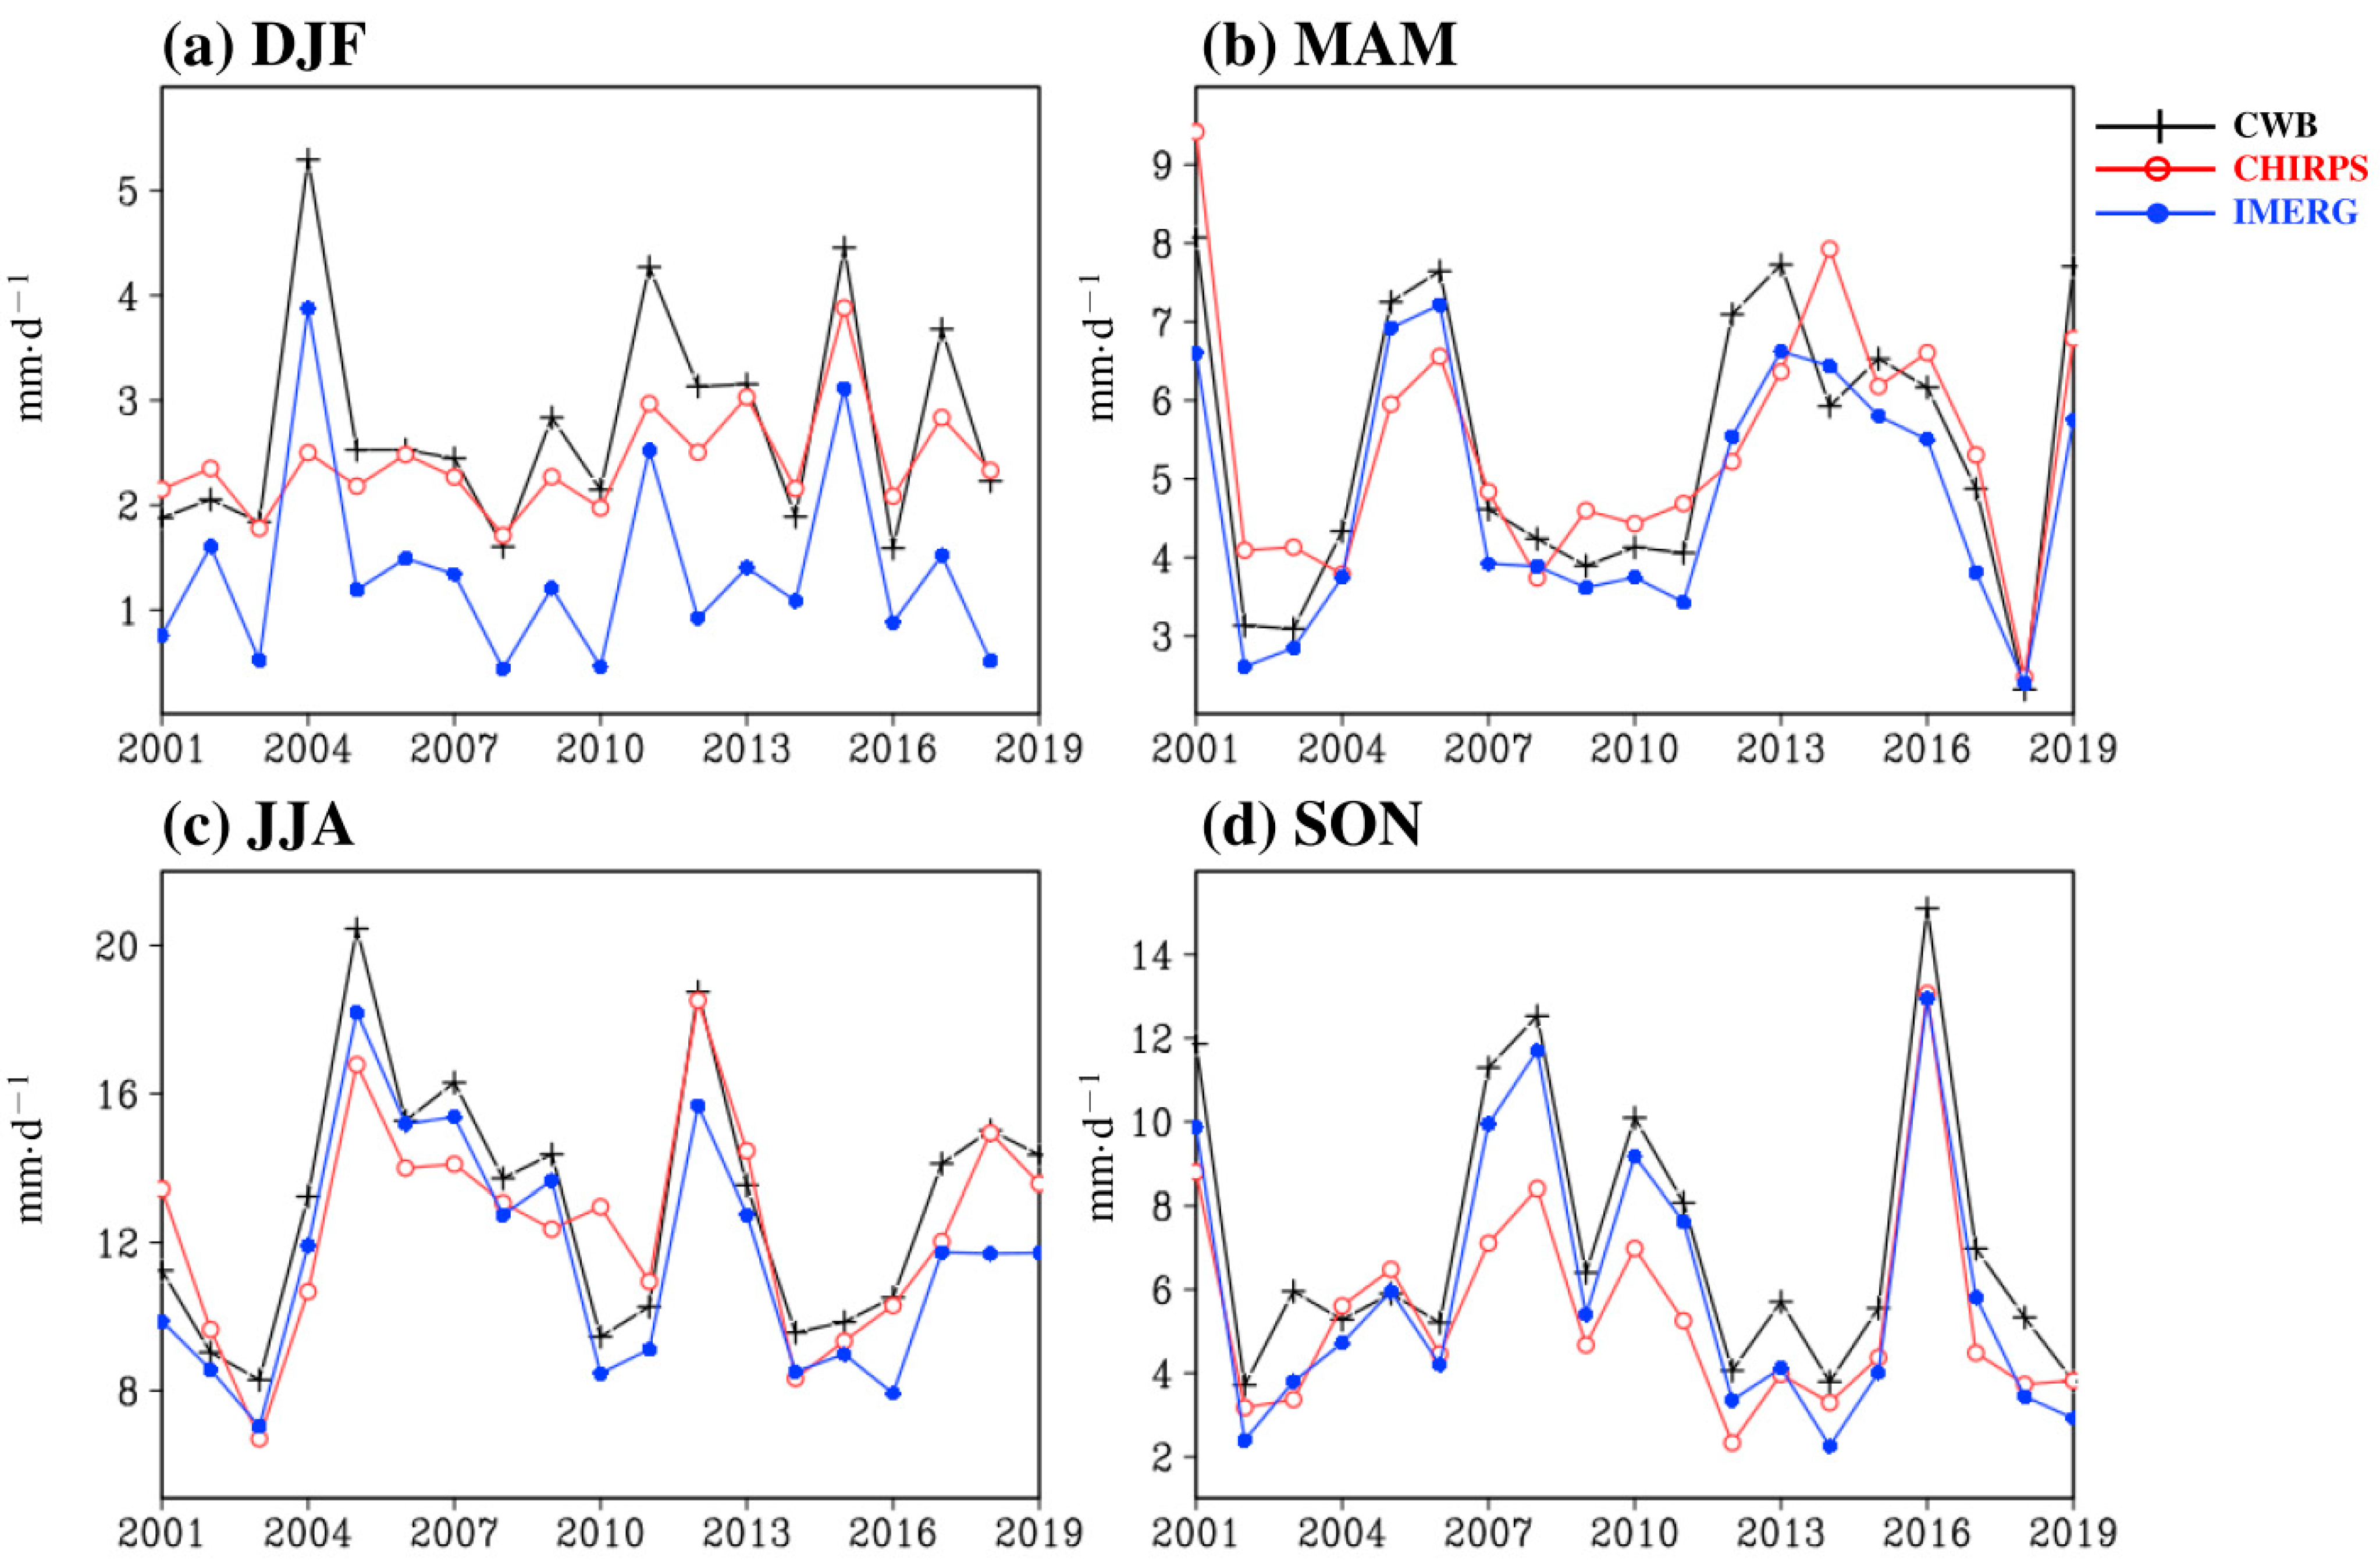
Earlier studies have indicated that the seasonal precipitation characteristics change significantly over Taiwan [23]. Therefore, we further examined the ability of the SPPs to show the interannual variation of precipitation during four different seasons: winter (December to February, DJF), spring (March to May, MAM), summer (June to August, JJA), and autumn (September to November, SON). Figure 3 shows the area-averaged interannual variation of seasonal precipitation over Taiwan from 2001–2019, extracted from CWB, CHIRPS, and IMERG. Visually, we observed that the differences between the performances of CHIRPS and IMERG were larger in winter than in other seasons. To quantitatively evaluate the accuracy of CHIRPS and IMERG, we calculated the Tcorr and RMSE between CWB and selected SPPs using the time series shown in Figure 3; these results are given in Table 3. It was observed from Table 3 that CHIRPS effectively captured the phase evolution of the interannual variation of precipitation for all the seasons; in all cases, we found that Tcorr > 0.74 (passing the 95% significance test). However, its performance in Tcorr was not as good as IMERG’s performance in Tcorr. Additionally, except for winter, IMERG had an RMSE value smaller than that of CHIRPS, suggesting that its quantitative precipitation estimation of spring, summer, and autumn seasons is closer to CWB.
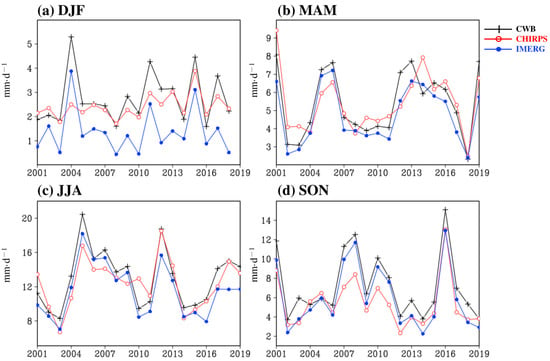
Figure 3.
Time series of area-averaged seasonal mean precipitation over Taiwan during 2001–2019, estimated from CWB (black line), CHIRPS (red line), and IMERG (blue line) for four different seasons: (a) winter (December to February, DJF), (b) spring (March to May, MAM), (c) summer (June to August, JJA), and (d) autumn (September to November, SON).

Table 3.
Temporal correlation coefficient (Tcorr) and root mean square error (RMSE; unit: mm·d−1) for comparison between time series of CWB and two SPPs shown in Figure 3. The one (CHIRPS or IMERG) with higher value of Tcorr or lower value of RMSE are marked by * for individual season.
Overall, Figure 1, Figure 2 and Figure 3 show that IMERG is better than CHIRPS to qualitatively depict the phase evolution of annual and interannual variations in seasonal precipitation. However, for quantitative precipitation estimation, CHIRPS is better than IMERG in the winter season, while IMERG is better than CHIRPS for other seasons. The differences between the performances of Tcorr and RMSE for CHIRPS and IMERG (Table 3) for warm seasons (spring and summer) is smaller than that for cold seasons (winter and autumn).
3.2. Sptatial Distribution of Seasonal Mean Precipitation
Notably, when examining the long-term mean (2001–2019 averaged) seasonal precipitation over Taiwan (area-averaged), we noted from Table 4 that, relative to IMERG, CHIRPS is closer to CWB in winter, spring, and summer. This leads to the question: “Is CHIRPS superior to IMERG in illustrating the long-term mean seasonal feature?”

Table 4.
Seasonal mean precipitation (unit: mm·d−1) averaged during 2001–2019, and area-averaged over Taiwan, for individual season.
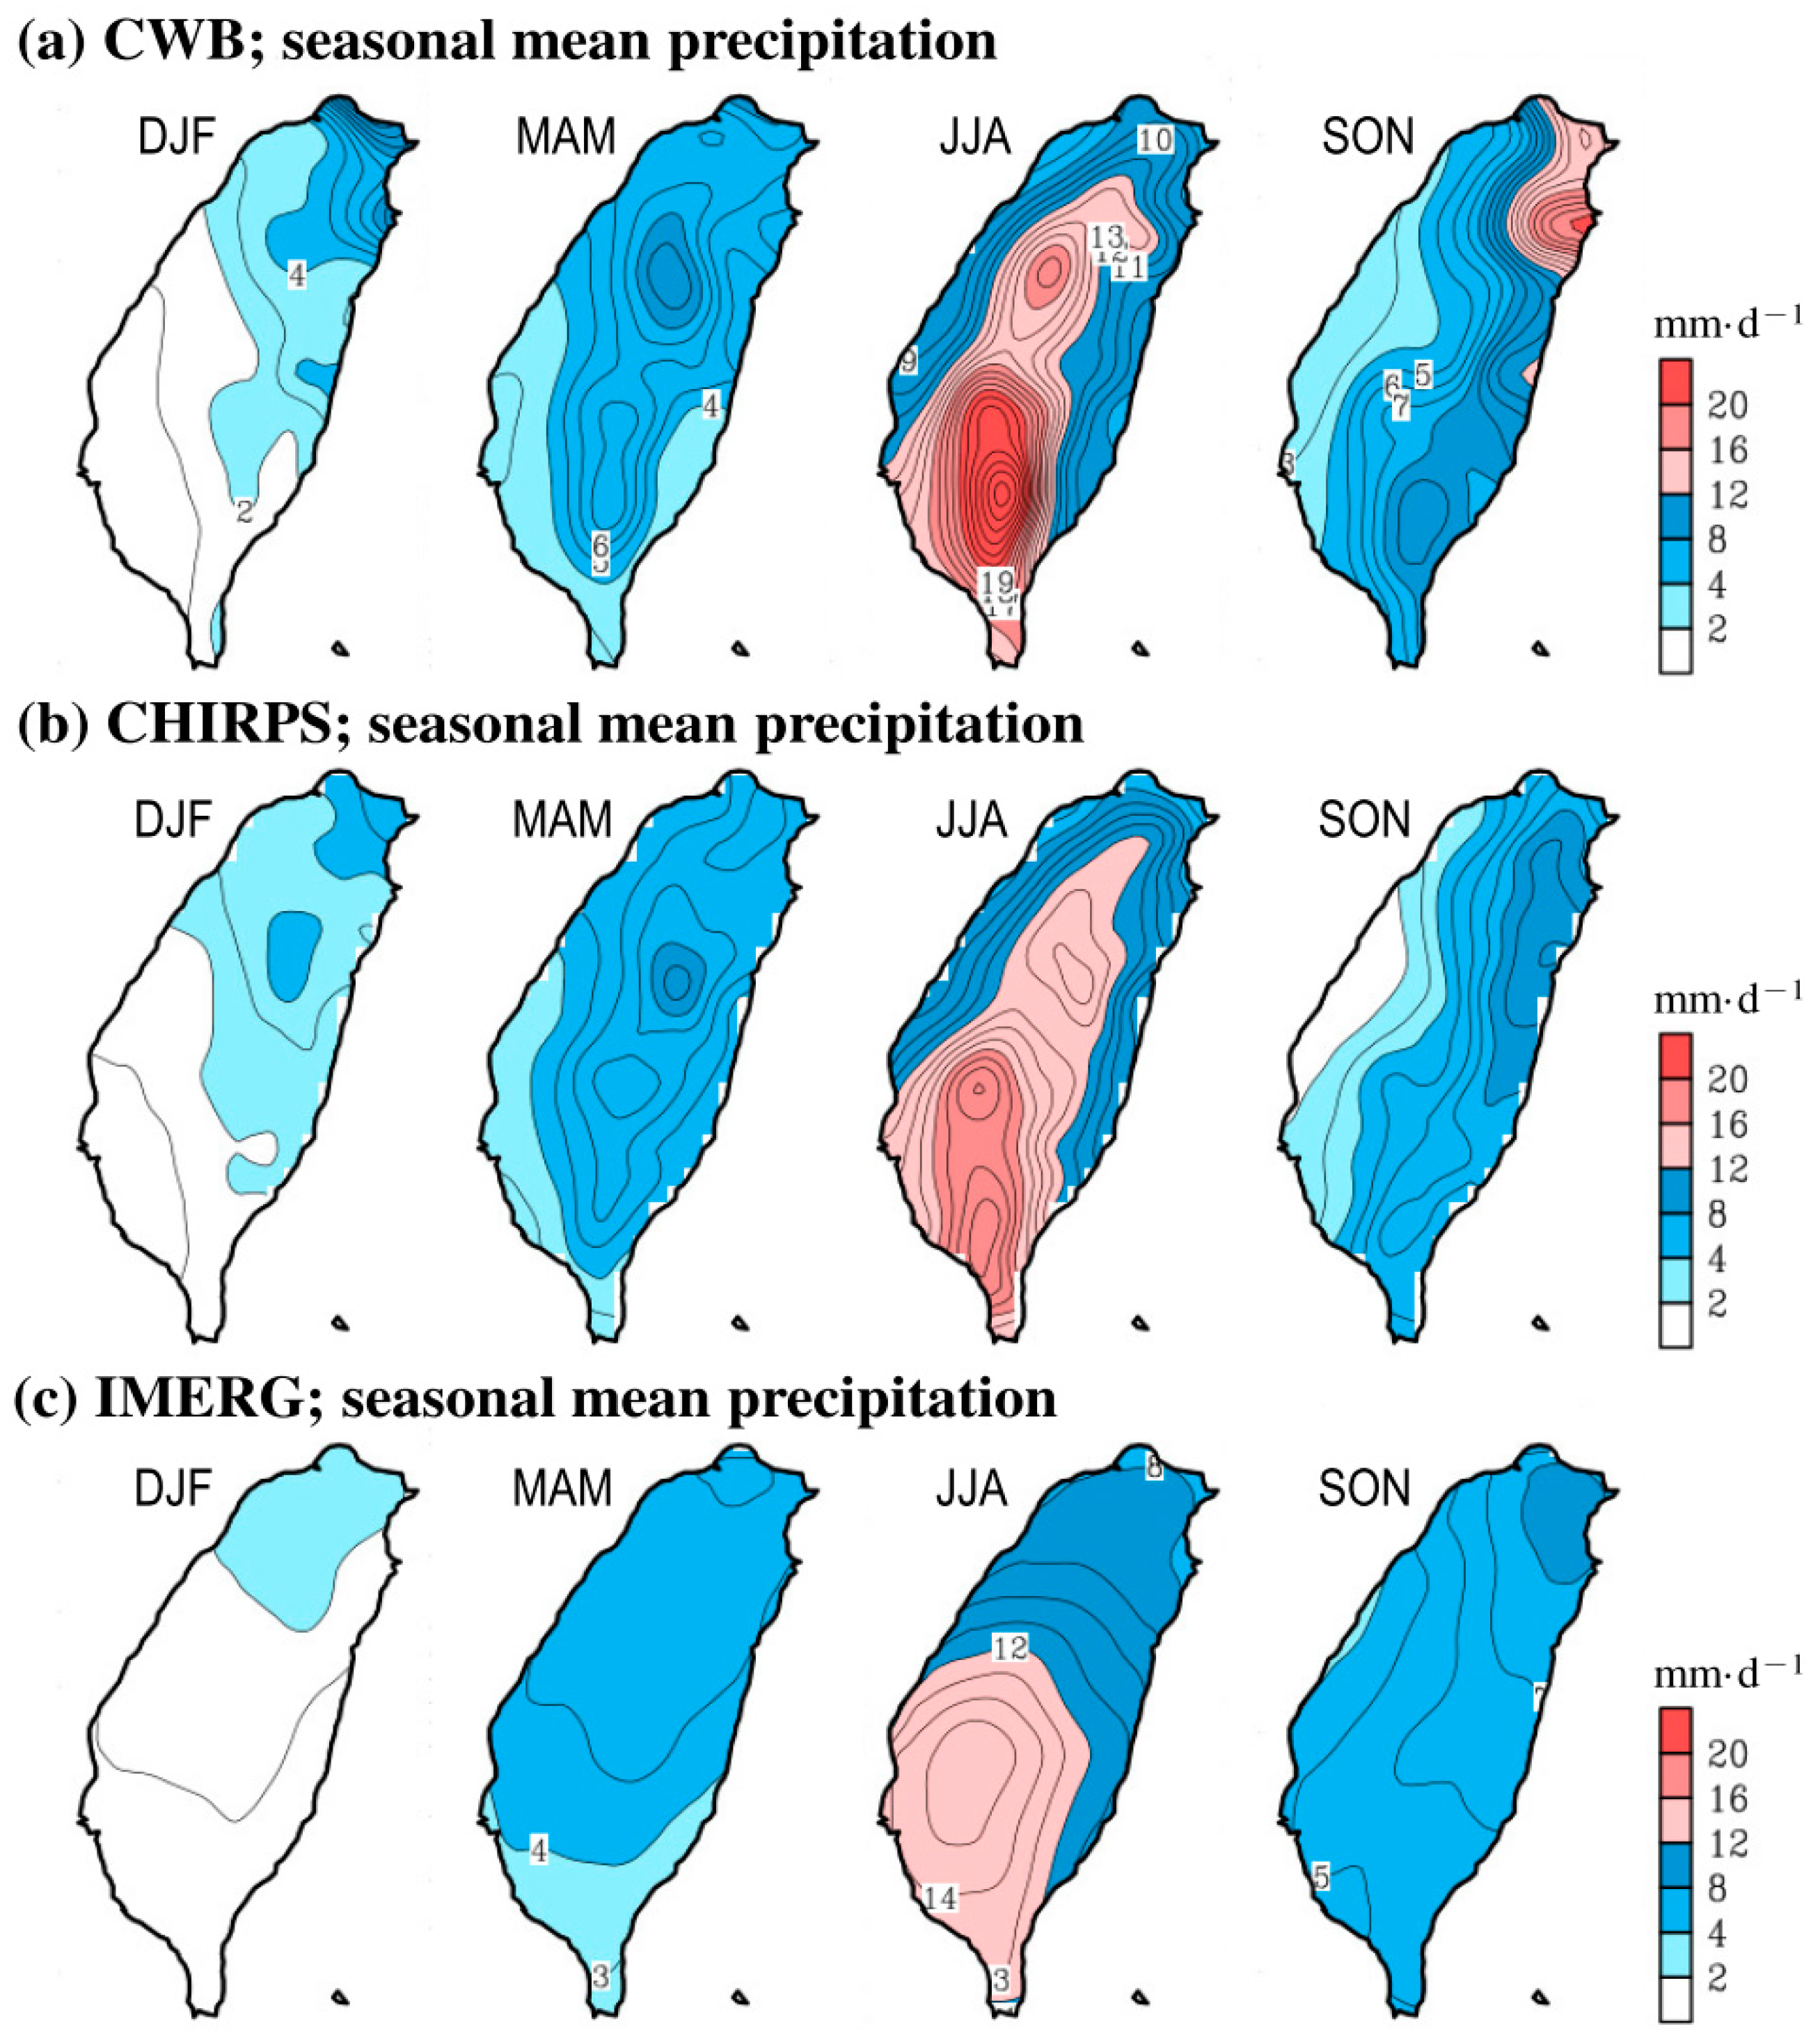
To address above question, we examined the spatial distribution of the averaged seasonal mean precipitation for the four seasons during 2001–2019 (Figure 4). As shown in Figure 4a, the location of the maximum precipitation observed by CWB shows regional differences during the four seasons, with the maximum precipitation in winter seen in northeastern Taiwan, maximum precipitation in spring seen in northwestern Taiwan, maximum precipitation in summer seen in southwestern Taiwan, and maximum precipitation in autumn seen in eastern Taiwan. This indicates that the observational precipitation has a seasonal counterclockwise rotation feature over a year cycle [1,24]. It was noted that CHIRPS (Figure 4b) and IMERG (Figure 4c) can also capture the seasonal counterclockwise rotation feature in a similar manner to CWB (Figure 4a), but CHIRPS performed better than IMERG in depicting the orographic distribution of precipitation over Taiwan. By calculating the Scorr and RMSE values using the information shown in Figure 4, we noted (from Table 5) that CHIRPS shows a better absolute performance (i.e., higher Scorr and smaller RMSE) than IMERG in illustrating the seasonal mean spatial distribution for all the four seasons.
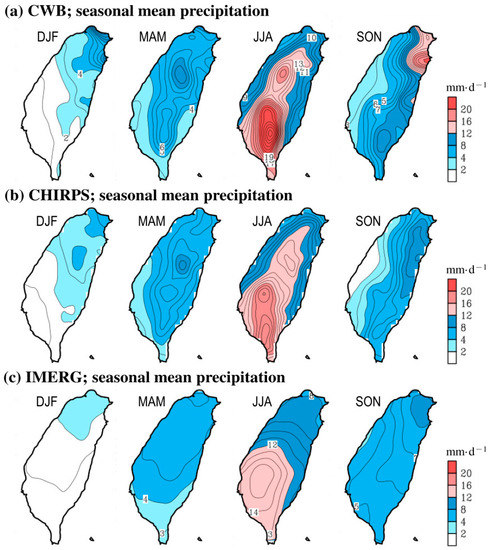
Figure 4.
Spatial distribution of seasonal mean precipitation over Taiwan averaged during 2001–2019 for the winter (DJF), spring (MAM), summer (JJA) and autumn (SON) extracted from (a) CWB, (b) CHIRPS, and (c) IMERG.

Table 5.
Spatial correlation coefficient (Scorr) and root mean square error (RMSE; unit: mm·d−1) for comparison between CWB and two SPPs in Figure 4. CHIRPS/IMERG with higher value of Tcorr or lower value of RMSE are marked by * for individual season.
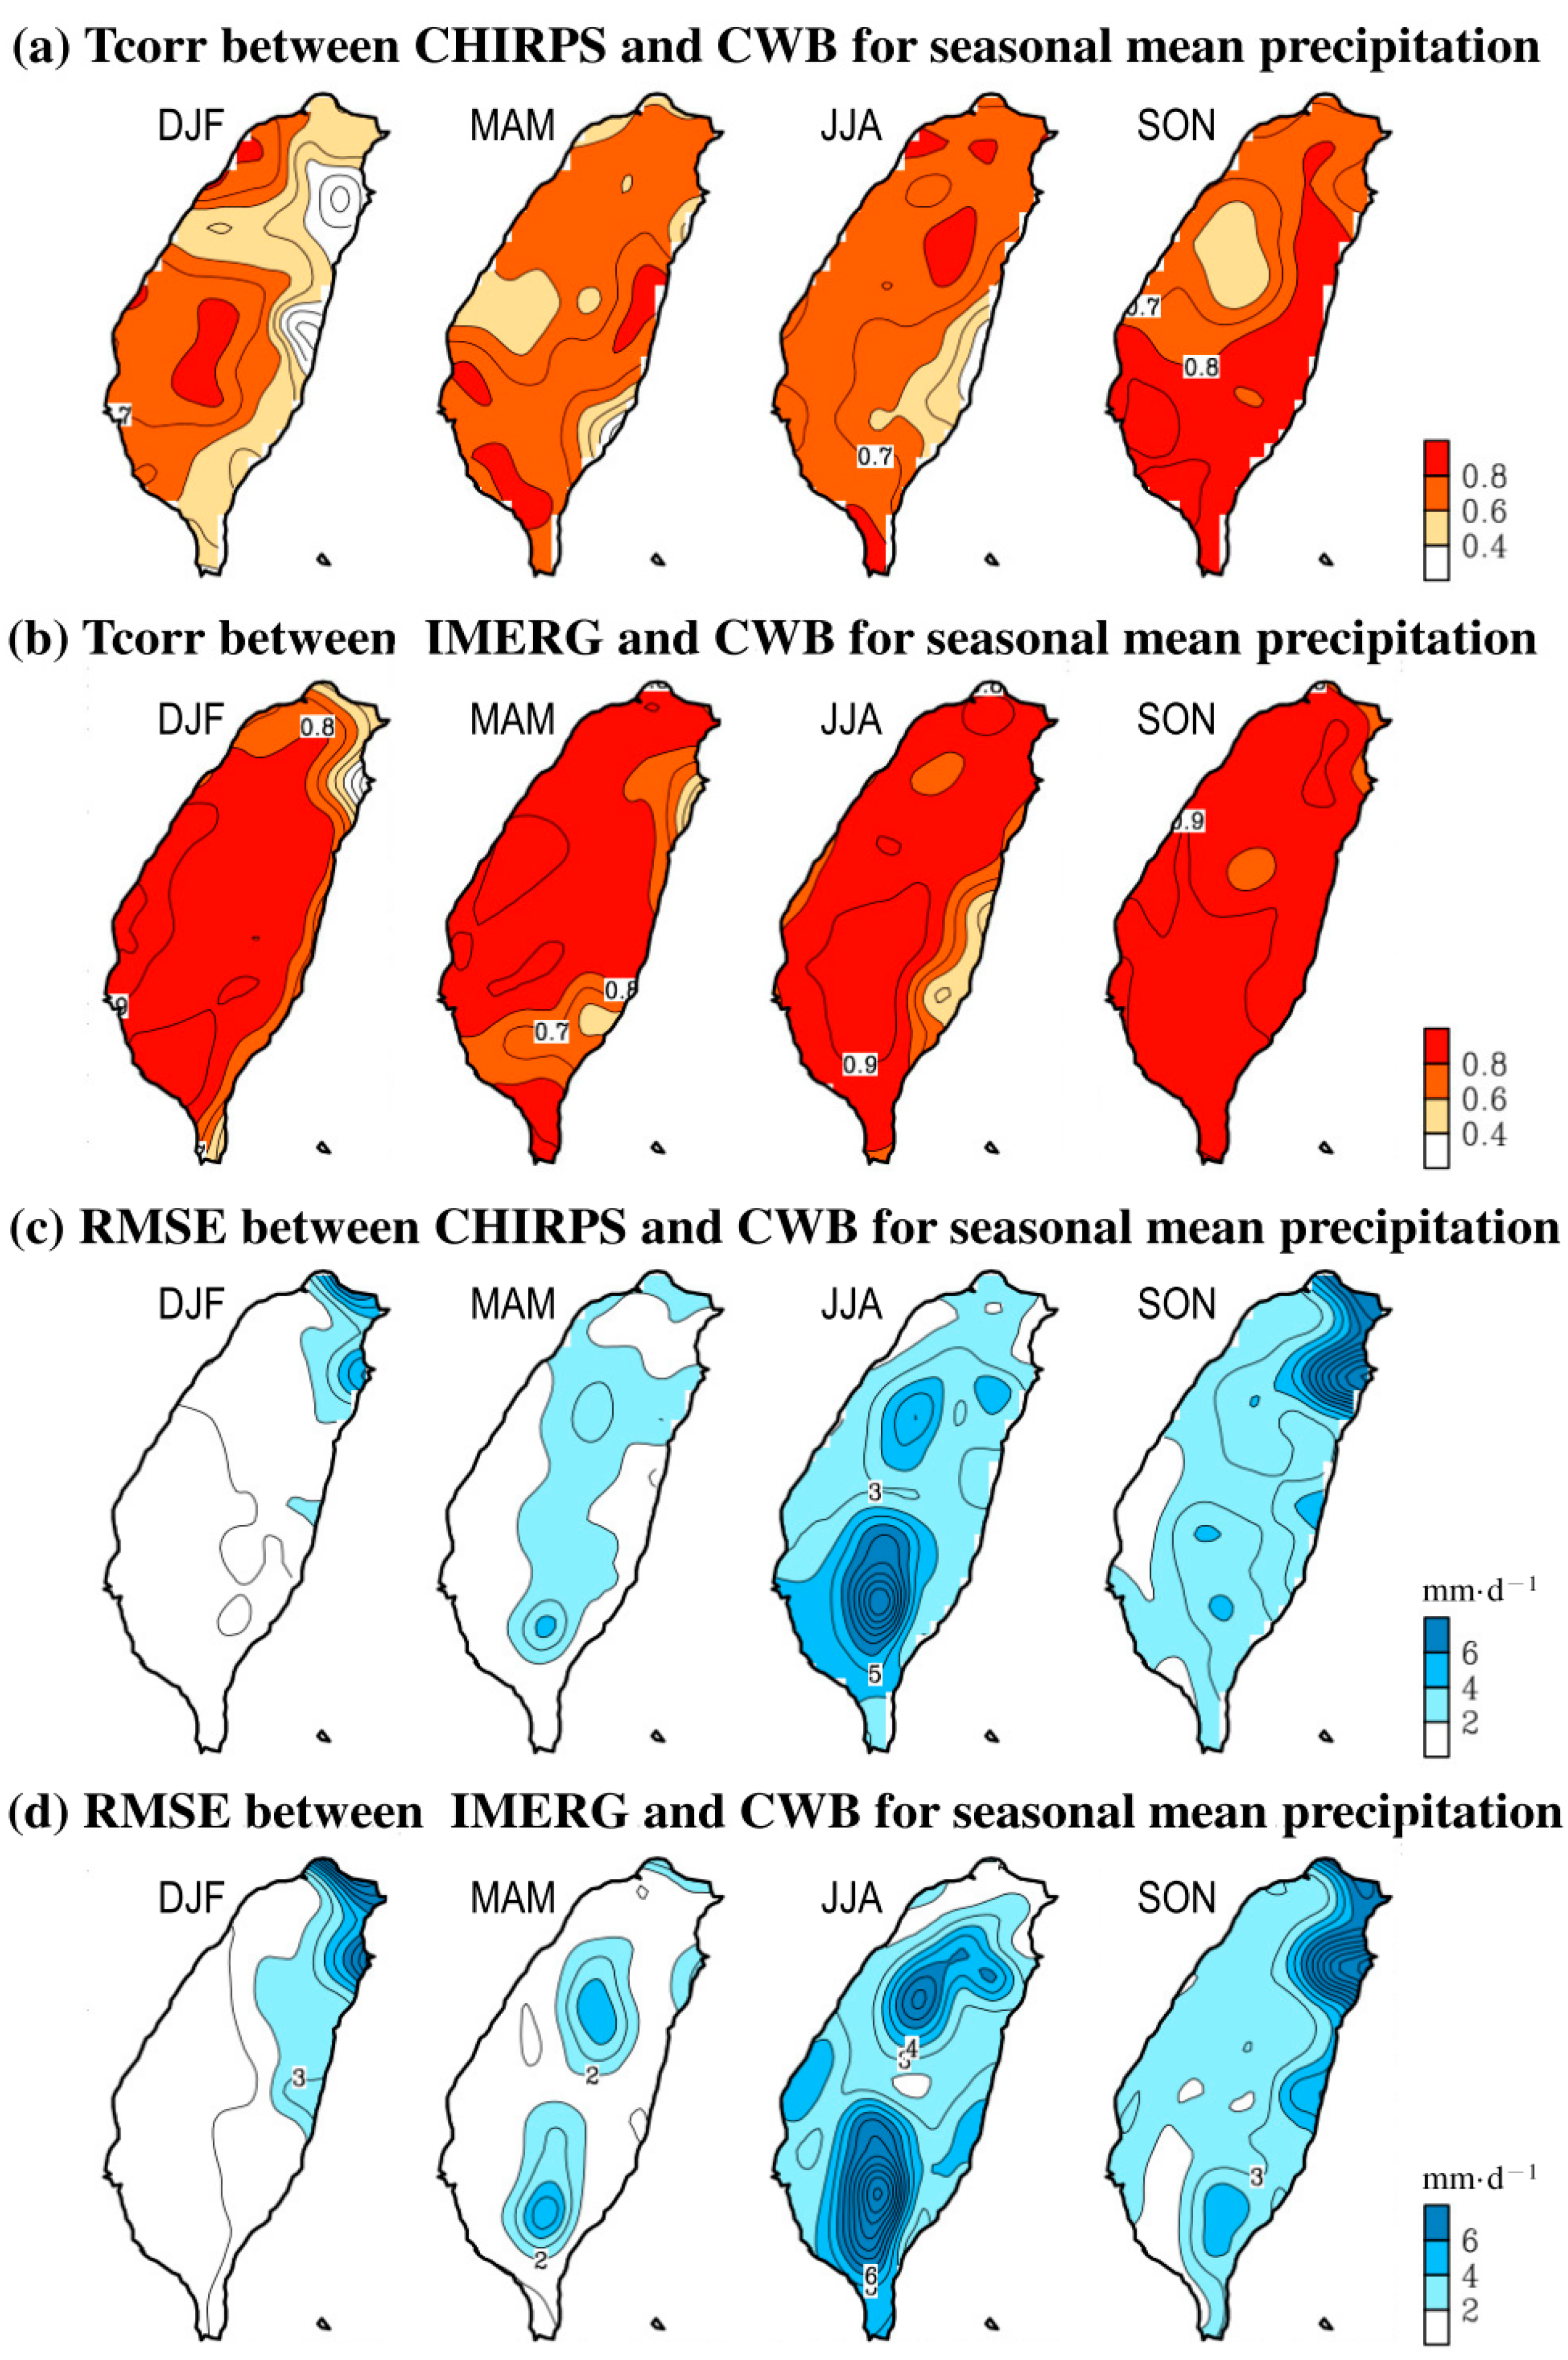
Additionally, by analyzing the related grid-to-grid Tcorr (Figure 5a,b) and RMSE (Figure 5c,d), the spatial characteristics were further examined for determining the ability of the SPPs to depict the interannual variation of seasonal precipitation during 2001–2019. From Figure 5a,b, we found that the Tcorr of IMERG is larger than that of CHIRPS in most regions; the difference is smaller for autumn than for other seasons. In contrast, from Figure 5c,d, we found that CHIRPS tends to have a smaller RMSE than IMERG, especially over areas with larger seasonal precipitation during the cold seasons (winter and autumn) and over the mountainous areas during the warm seasons (spring and summer). In a short summary, Figure 4 and Figure 5 (together) suggest that IMERG is better than CHIRPS in illustrating the phase evolution of “interannual variation” of seasonal precipitation in most sub-regions, while CHIRPS is better than IMERG in the quantitative estimation of “long-term mean” seasonal precipitation distribution.
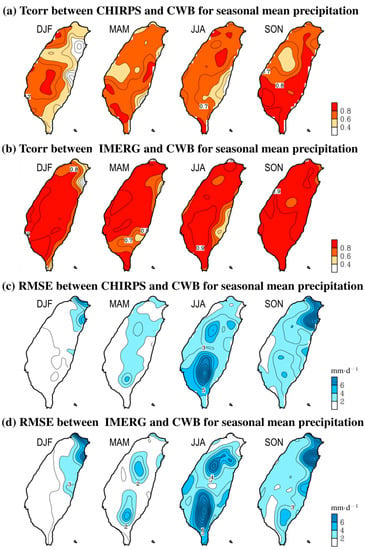
Figure 5.
Grid-to-grid temporal correlation (Tcorr) between seasonal mean precipitation during 2001–2019 for winter (DJF), spring (MAM), summer (JJA), and autumn (SON) estimated by CWB and two SPPs: (a) CHIRPS and (b) IMERG. (c,d) are determined using the same time series as that used for (a,b), respectively, but calculated for RMSE between CWB and two SPPs for the four seasons.
3.3. Daily Variation
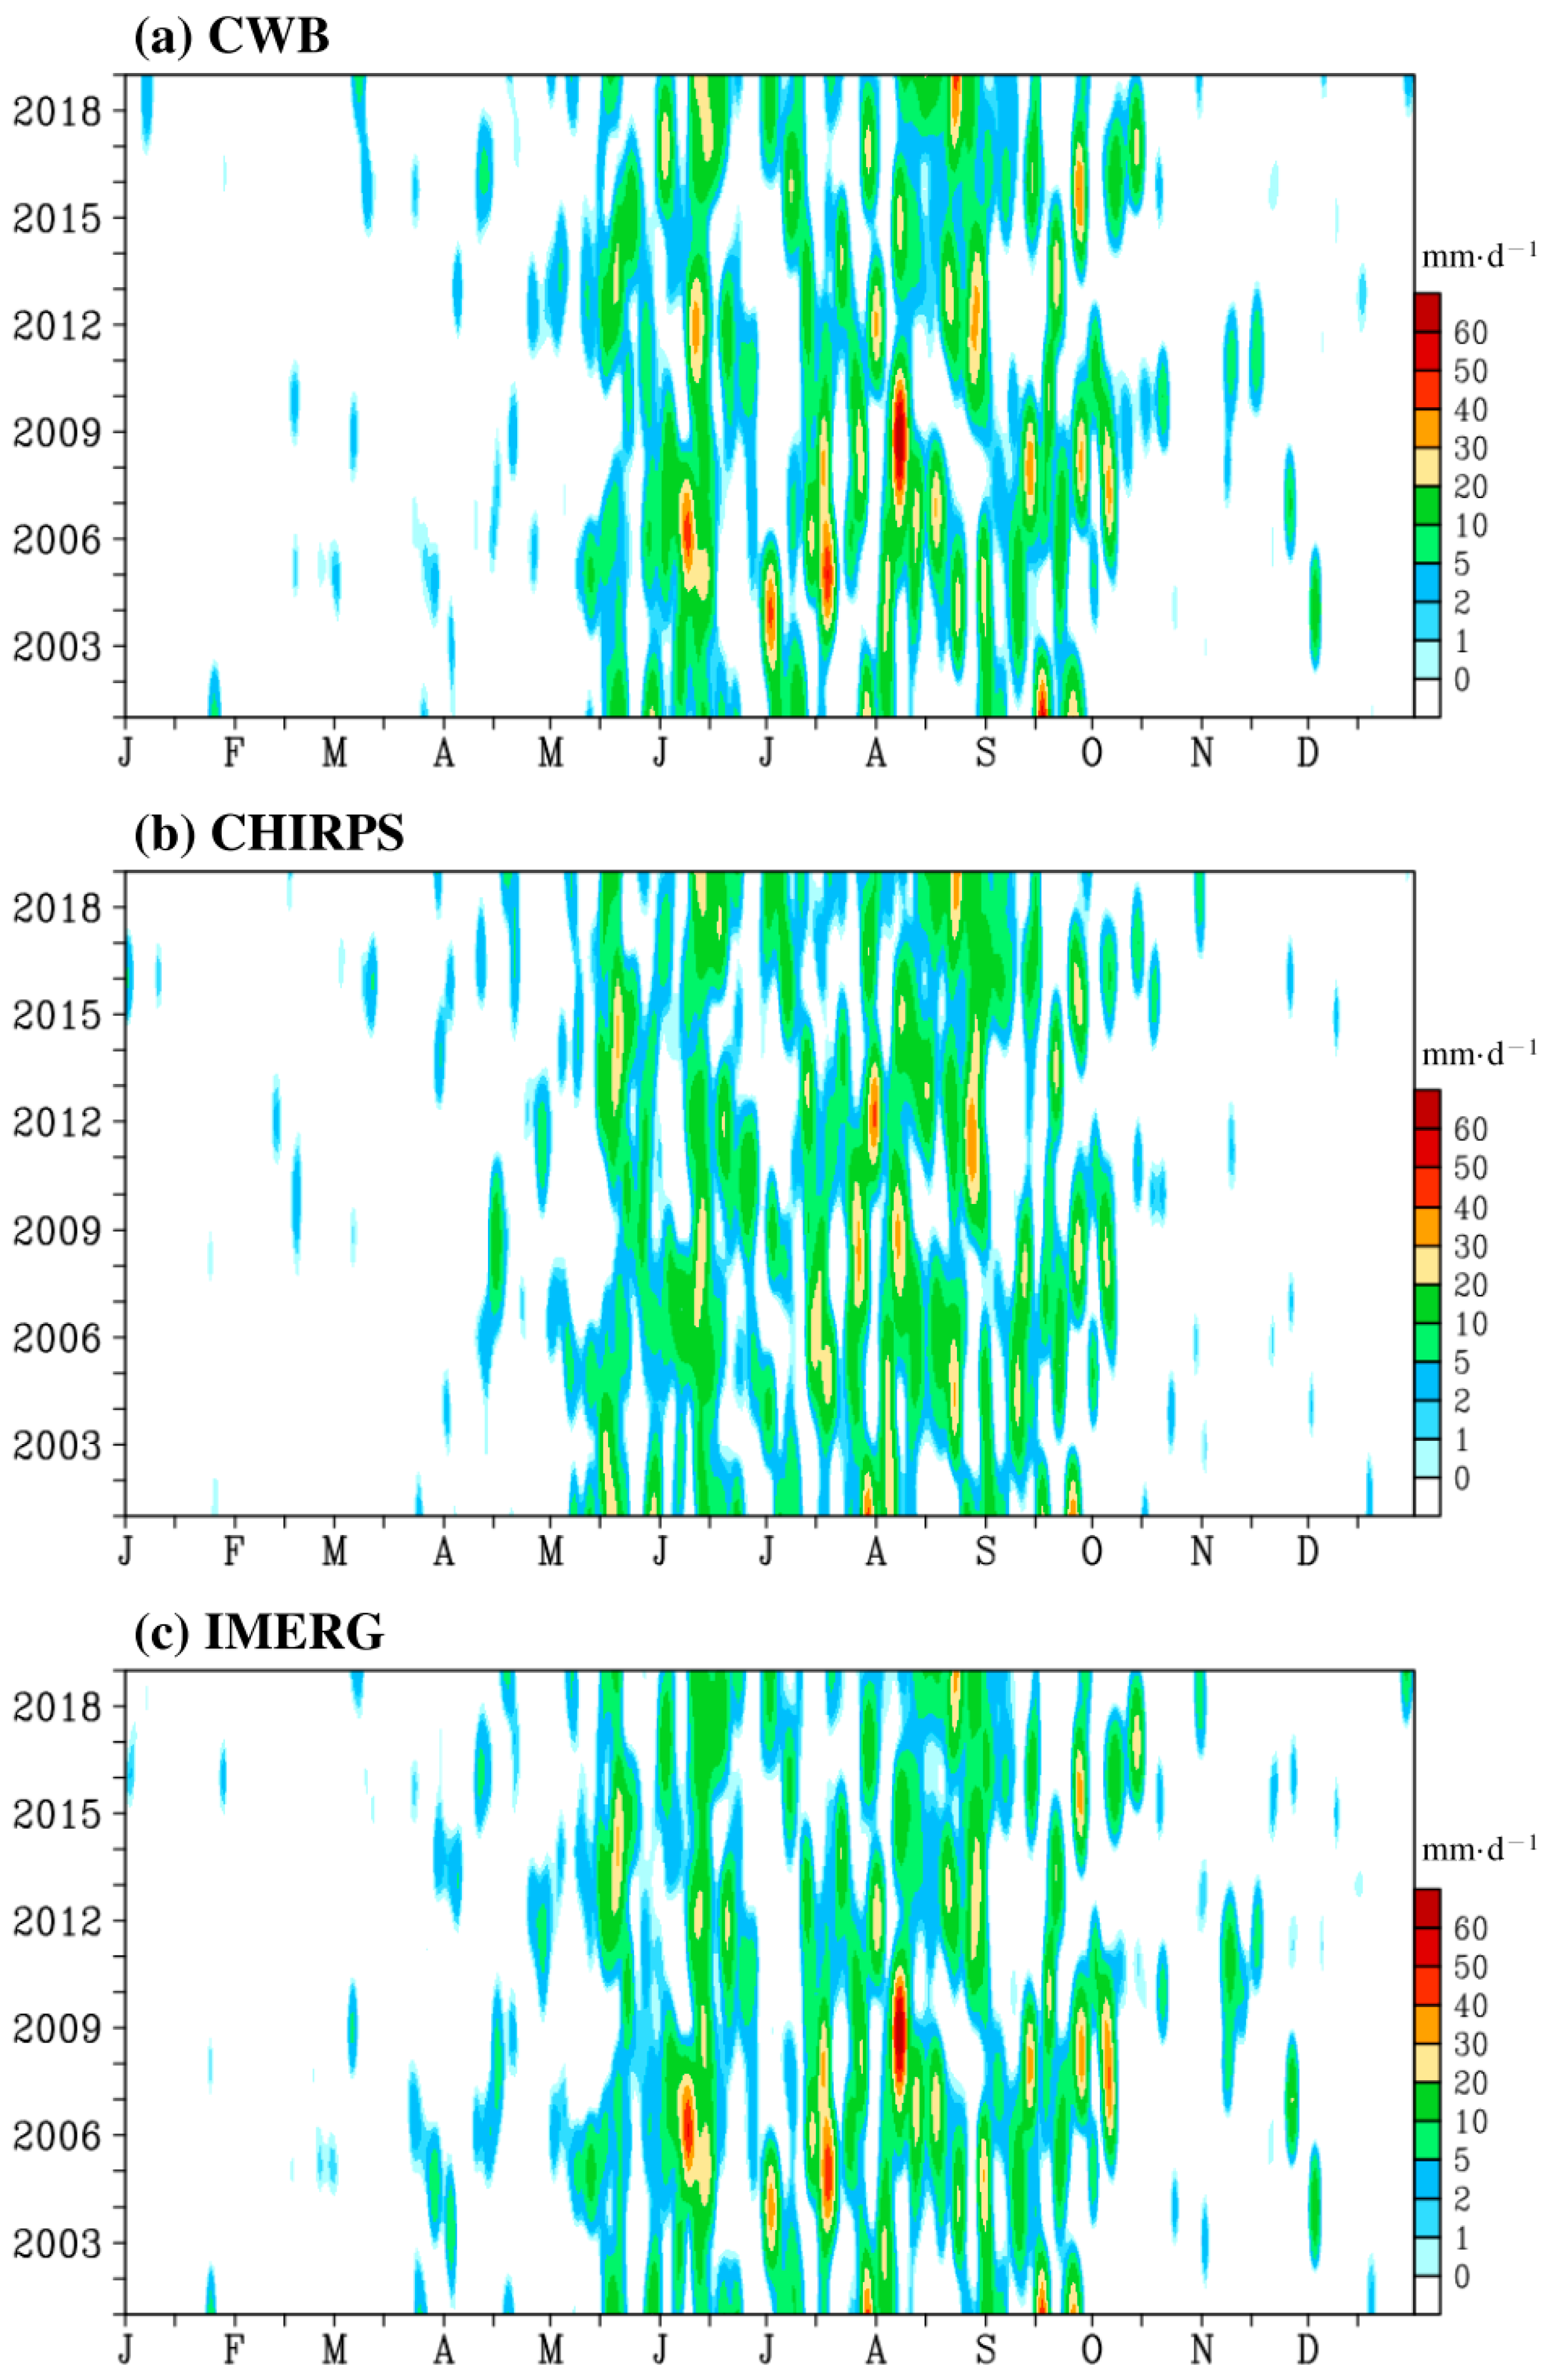
Next, we examined the capability of SPPs to depict the daily variations over Taiwan. From Figure 6, which shows the year (y-axis) vs. the date (x-axis) graph of the daily precipitation over Taiwan (area-averaged) from 2001–2019, we noted that the temporal distribution of daily precipitation of IMERG (CHIRPS) is more (less) similar to CWB. For example, many of the extreme precipitation events captured by CWB between May and September (Figure 6a) are not captured by CHIRPS (Figure 6b) but are captured by IMERG (Figure 6c). Recall that, as compared to IMERG, CHIRPS estimates the seasonal mean precipitation closer to the estimation obtained from CWB (Table 4). Therefore, it can be inferred that CHIRPS might overestimate the weaker daily precipitation events, which can cancel out its errors in underestimating the larger daily precipitation events and in turn lead to its seasonal mean value (averaged from all rainy events) being closer to that obtained from CWB.
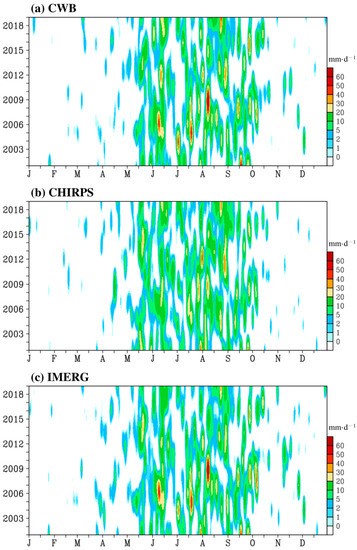
Figure 6.
Year (y-axis) versus date (x-axis) of area-averaged daily precipitation over Taiwan during 2001–2019 estimated from (a) CWB, (b) CHIRPS, and (c) IMERG.
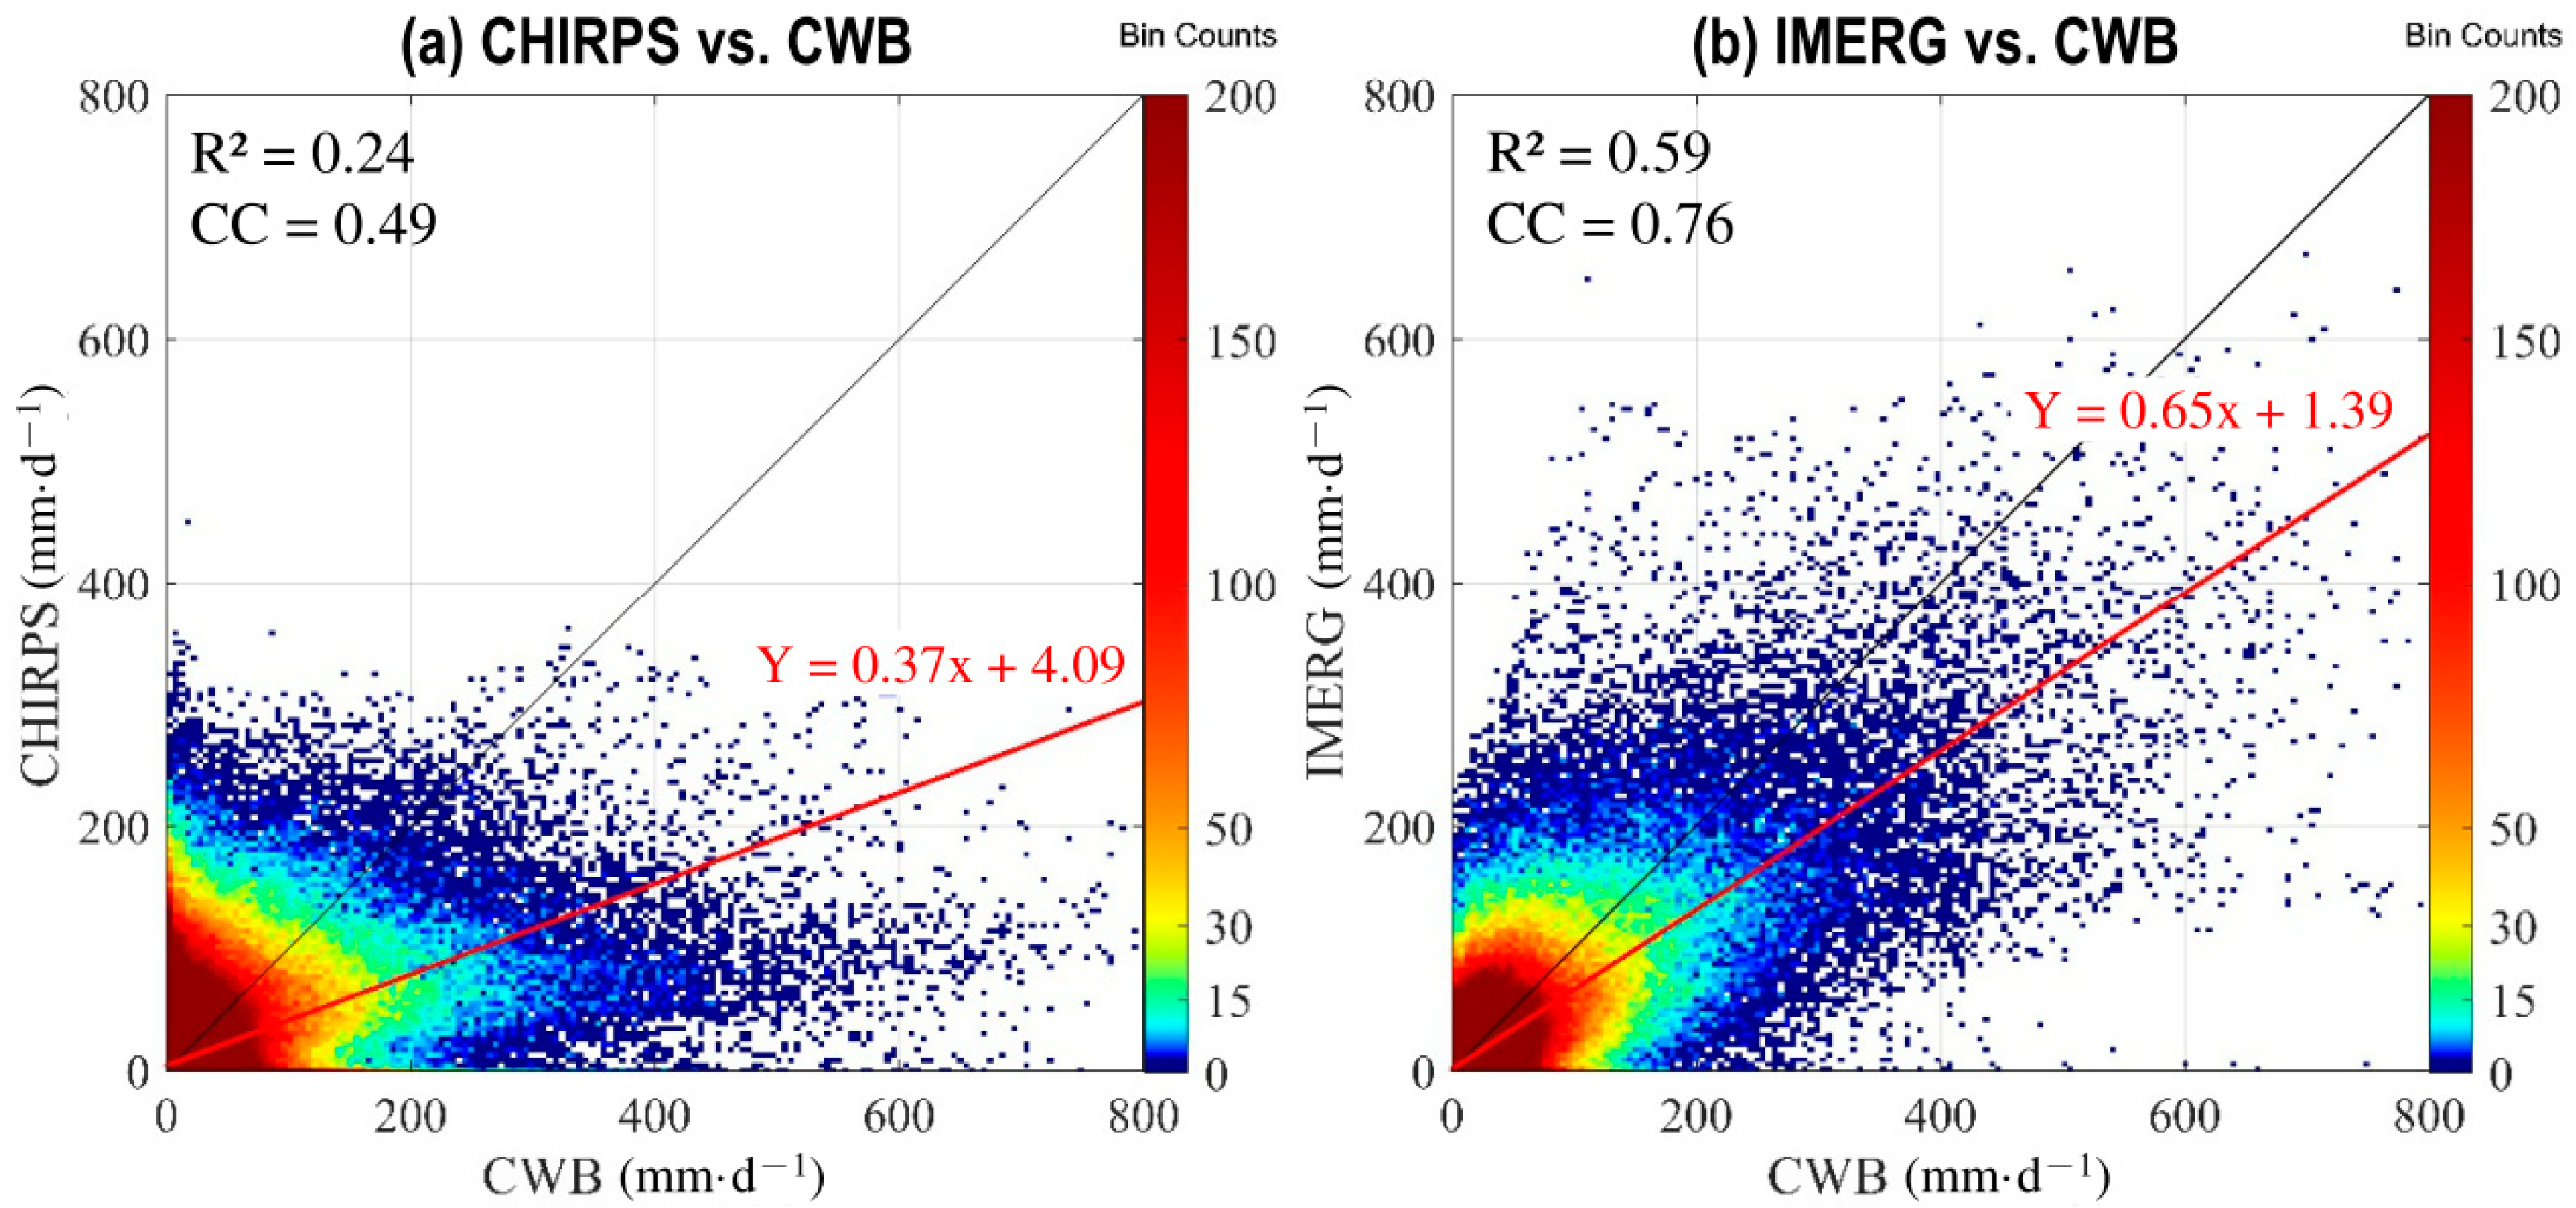
To clarify the above inference, we constructed a scatter diagram to illustrate the grid-to-grid comparison of the daily precipitation estimation of CHIRPS and CWB from 2001–2019 (Figure 7). As demonstrated in Figure 7a, CHIRPS underestimates the larger daily precipitation events (see the distribution of the blue dots) but overestimates the weaker daily precipitation events (see the distribution of the red dots). In contrast, the scatter diagram illustrating the comparison between IMERG and CWB (Figure 7b) shows that the distribution of daily precipitation is closer to the 1:1 fit line (black solid line), implying that the errors seen in IMERG are smaller than those seen in CHIRPS. Additionally, the coefficient of determination (R2) shows that the linear regression of IMERG (R2 = 0.59) has a better fit than CHIRPS (R2 = 0.24). These findings are different from those seen in Figure 4, suggesting that although CHIRPS is better than IMERG in quantitatively estimating the “long-term mean” seasonal precipitation (Figure 4), it underperforms in terms of quantitatively depicting the daily precipitation variation (Figure 7).
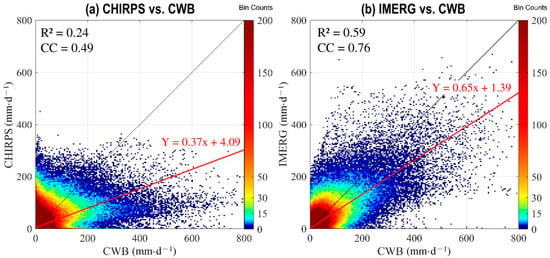
Figure 7.
(a) Scatter plot between CWB (x-axis) and CHIRPS (y-axis) for all grids of daily precipitation during 2001–2019. (b) is similar to (a), but for the comparison between CWB (x-axis) and IMERG (y-axis). The black line represents 1:1 fit line, and the red line represents the linear regression using the equation listed. The value of coefficient of determination (R2) is provided in the top left corner.
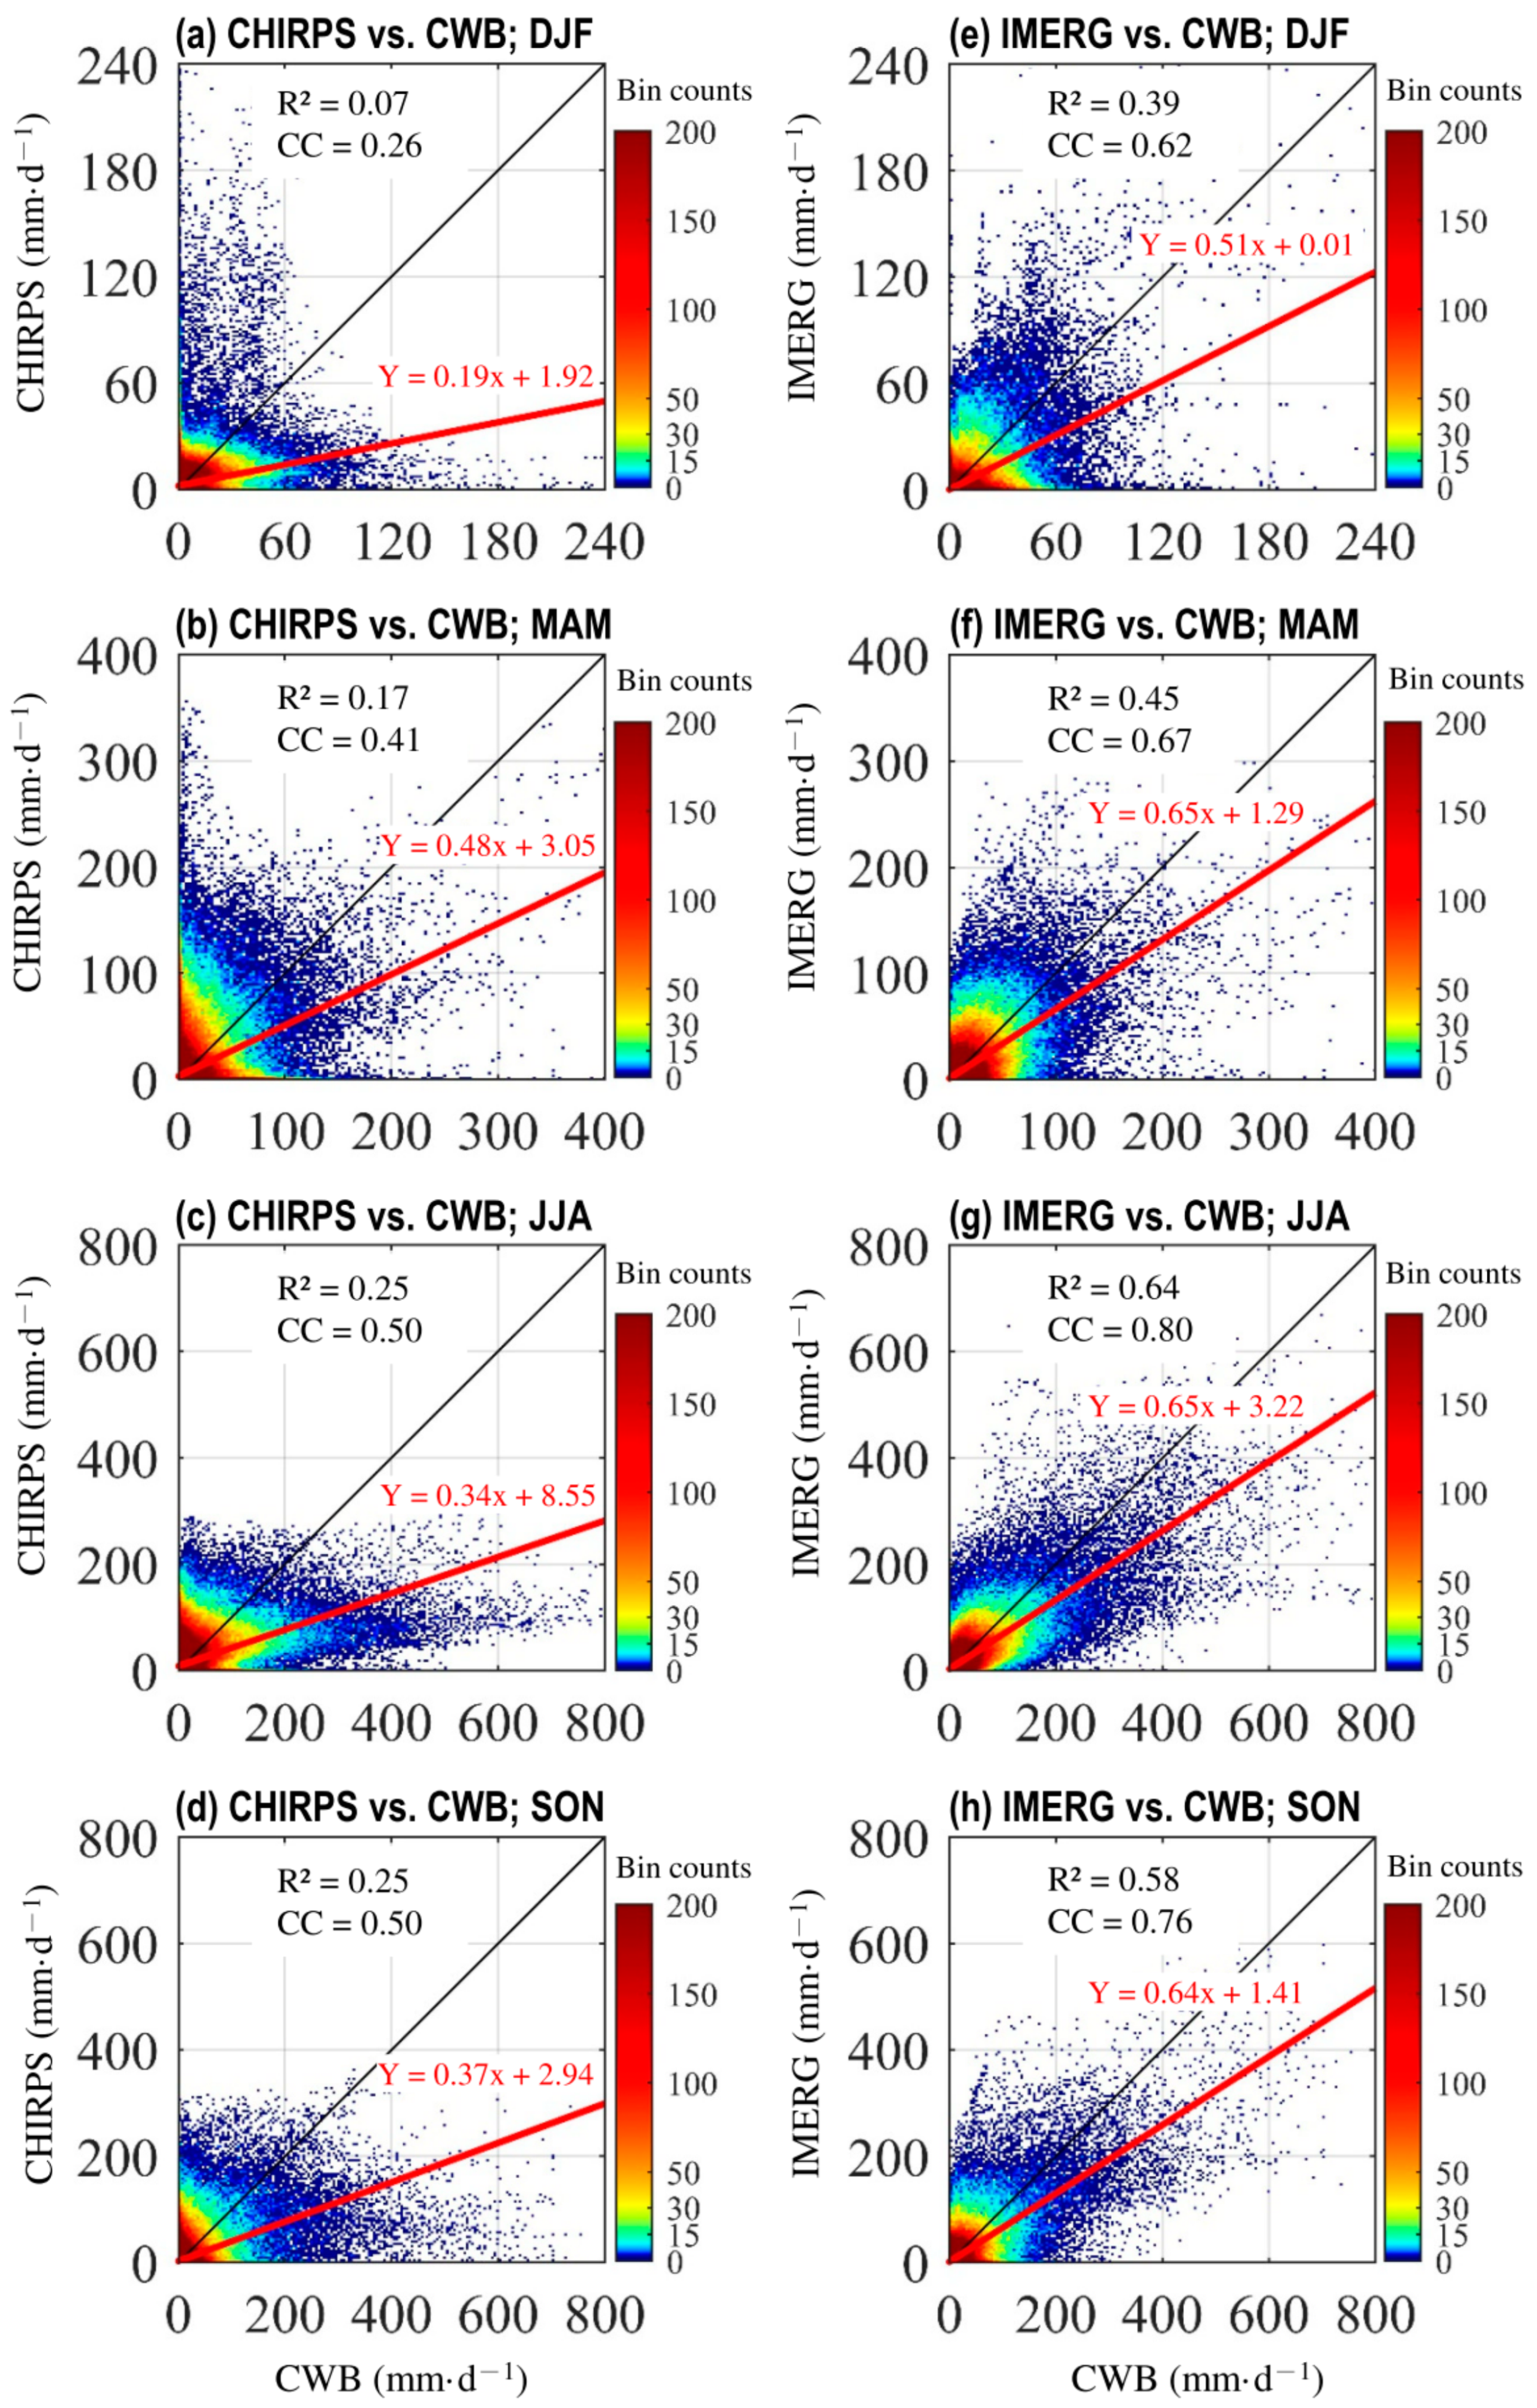
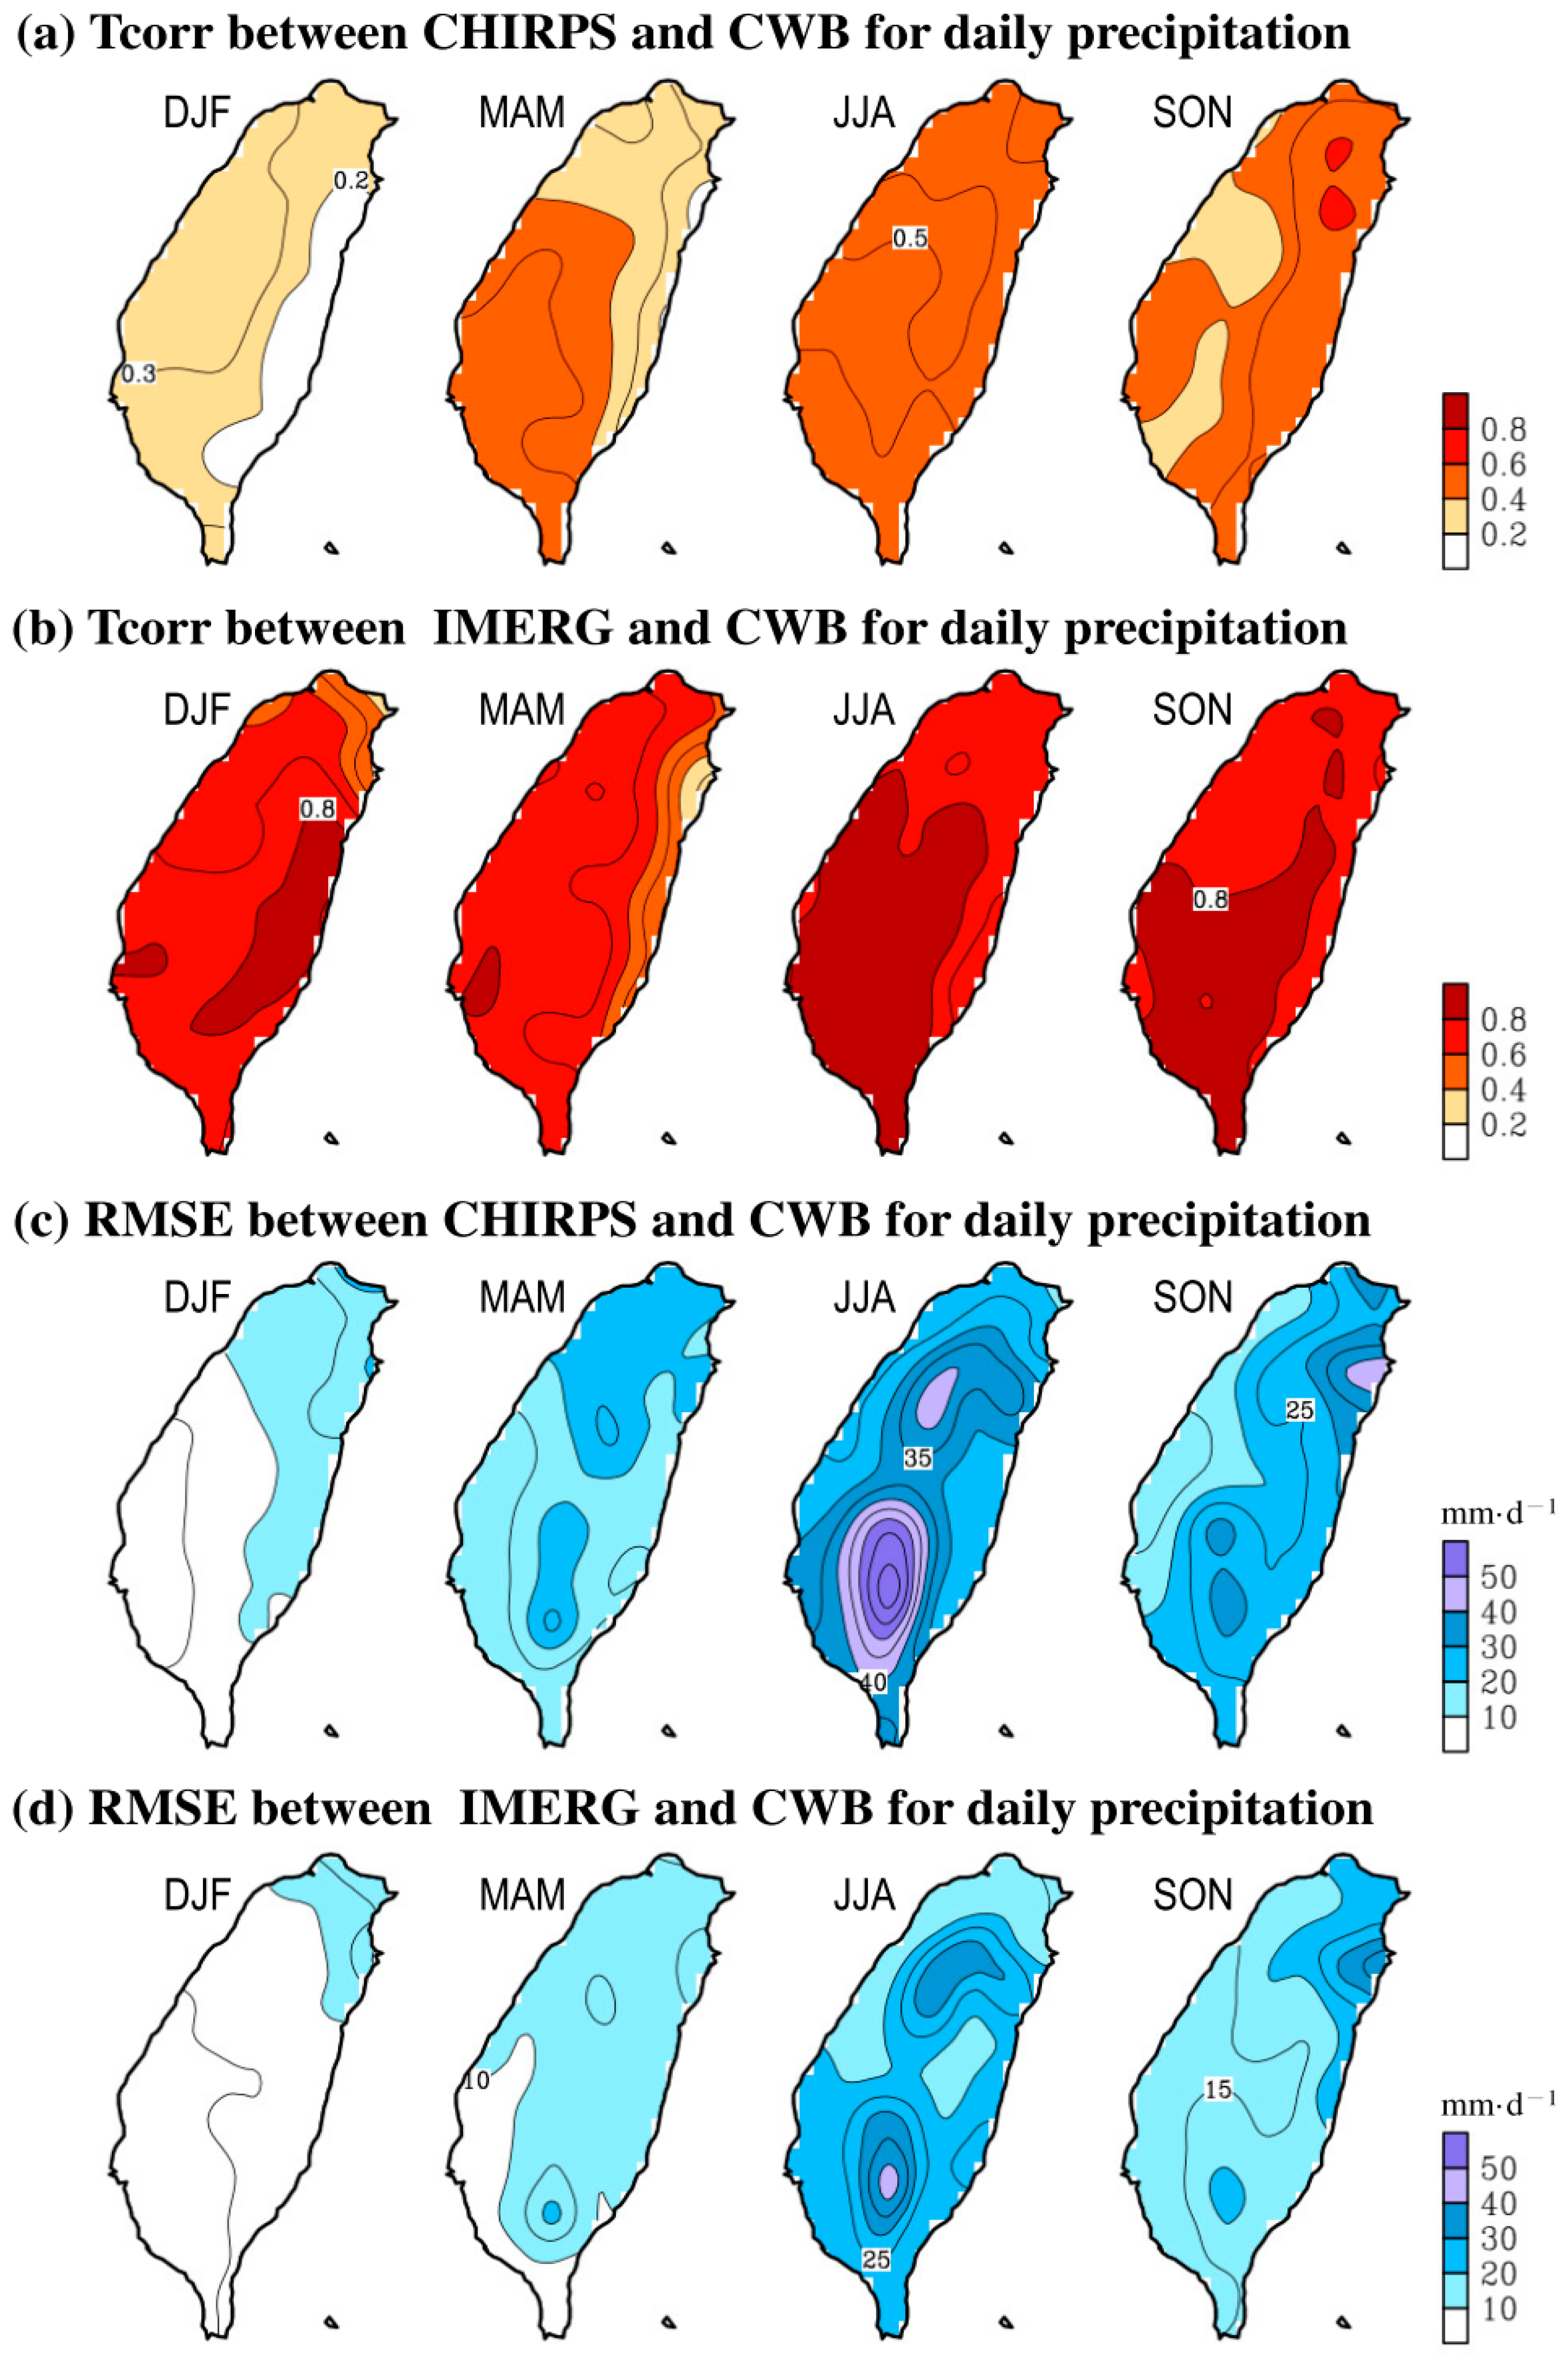
Next, we examined whether the performances of CHIRPS and IMERG in depicting daily precipitation were seasonally dependent. Following Figure 7, we constructed a scatter diagram for drawing a comparison between CHIRPS and CWB (Figure 8a,d) and between IMERG and CWB (Figure 8e–h) for the four different seasons. As revealed in Figure 8a–d, CHIRPS has systematic errors in underestimating stronger precipitation events but overestimates weaker precipitation events for all the four seasons. The above-mentioned overestimation problem is more obvious in the cold seasons (winter and spring) than the warm seasons (summer and autumn). Overall, by comparing Figure 8a–d and e–h, we found that, relative to CHIRPS (with the CC values being 0.26 in winter, 0.41 in spring, 0.50 in summer, and 0.50 in autumn), IMERG (with the CC values being 0.62 in winter, 0.67 in spring, 0.80 in summer, and 0.76 in autumn) had larger values of CC in all four seasons. This implies that IMERG has better performance than CHIRPS in depicting the variation of daily precipitation for all four seasons. The above findings are further clarified by the horizontal distribution of the grid-to-grid Tcorr (Figure 9a,b) and RMSE (Figure 9c,d) for the comparison between the daily variations observed by the SPPs and CWB. We found that the Tcorr of IMERG (Figure 9b) was larger than that of CHIRPS (Figure 9a) in most regions for all the four seasons. Despite this difference, both IMERG and CHIRPS have a higher Tcorr in summer than in other seasons. On the other hand, we found that the RMSE of CHIRPS (Figure 9c) has spatial distribution similar to the RMSE of IMERG (Figure 9d). In particular, both IMERG and CHIRPS show that the RMSE is larger over the mountainous areas during summer. Despite this spatial similarity, CHIRPS tends to have larger RMSE values than IMERG; this is true for all four seasons. In a short summary, as IMERG has a relatively higher Tcorr and lower RMSE (Figure 9), we therefore confirmed that IMERG outperformed CHIRPS in estimating the spatial-temporal variation in the daily precipitation for all the four seasons.
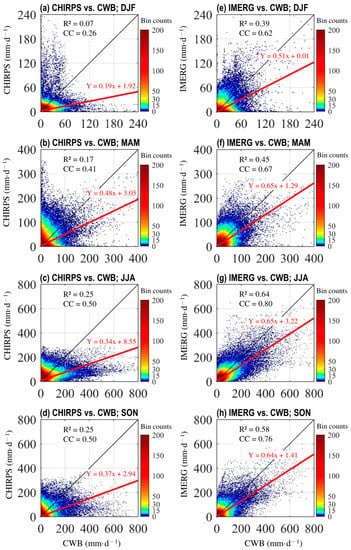
Figure 8.
Scatter plot between CWB (x-axis) and CHIRPS (y-axis) for all grids of daily precipitation for (a) winter, (b) spring, (c) summer, and (d) autumn during 2001–2019. (e–h) is similar to (a–d), respectively, but shows the comparison between CWB (x-axis) and IMERG (y-axis).
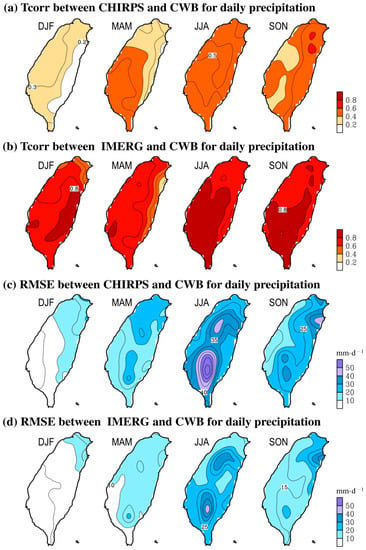
Figure 9.
Similar to Figure 5, but for grid-to-grid comparison of daily precipitation between CWB and selected SPPs estimated for winter (DJF), spring (MAM), summer (JJA), and autumn (SON) seasons of 2001–2019: (a) Tcorr between CWB and CHIRPS, (b) Tcorr between CWB and IMERG, (c) RMSE between CWB and CHIRPS, and (d) RMSE between CWB and IMERG.
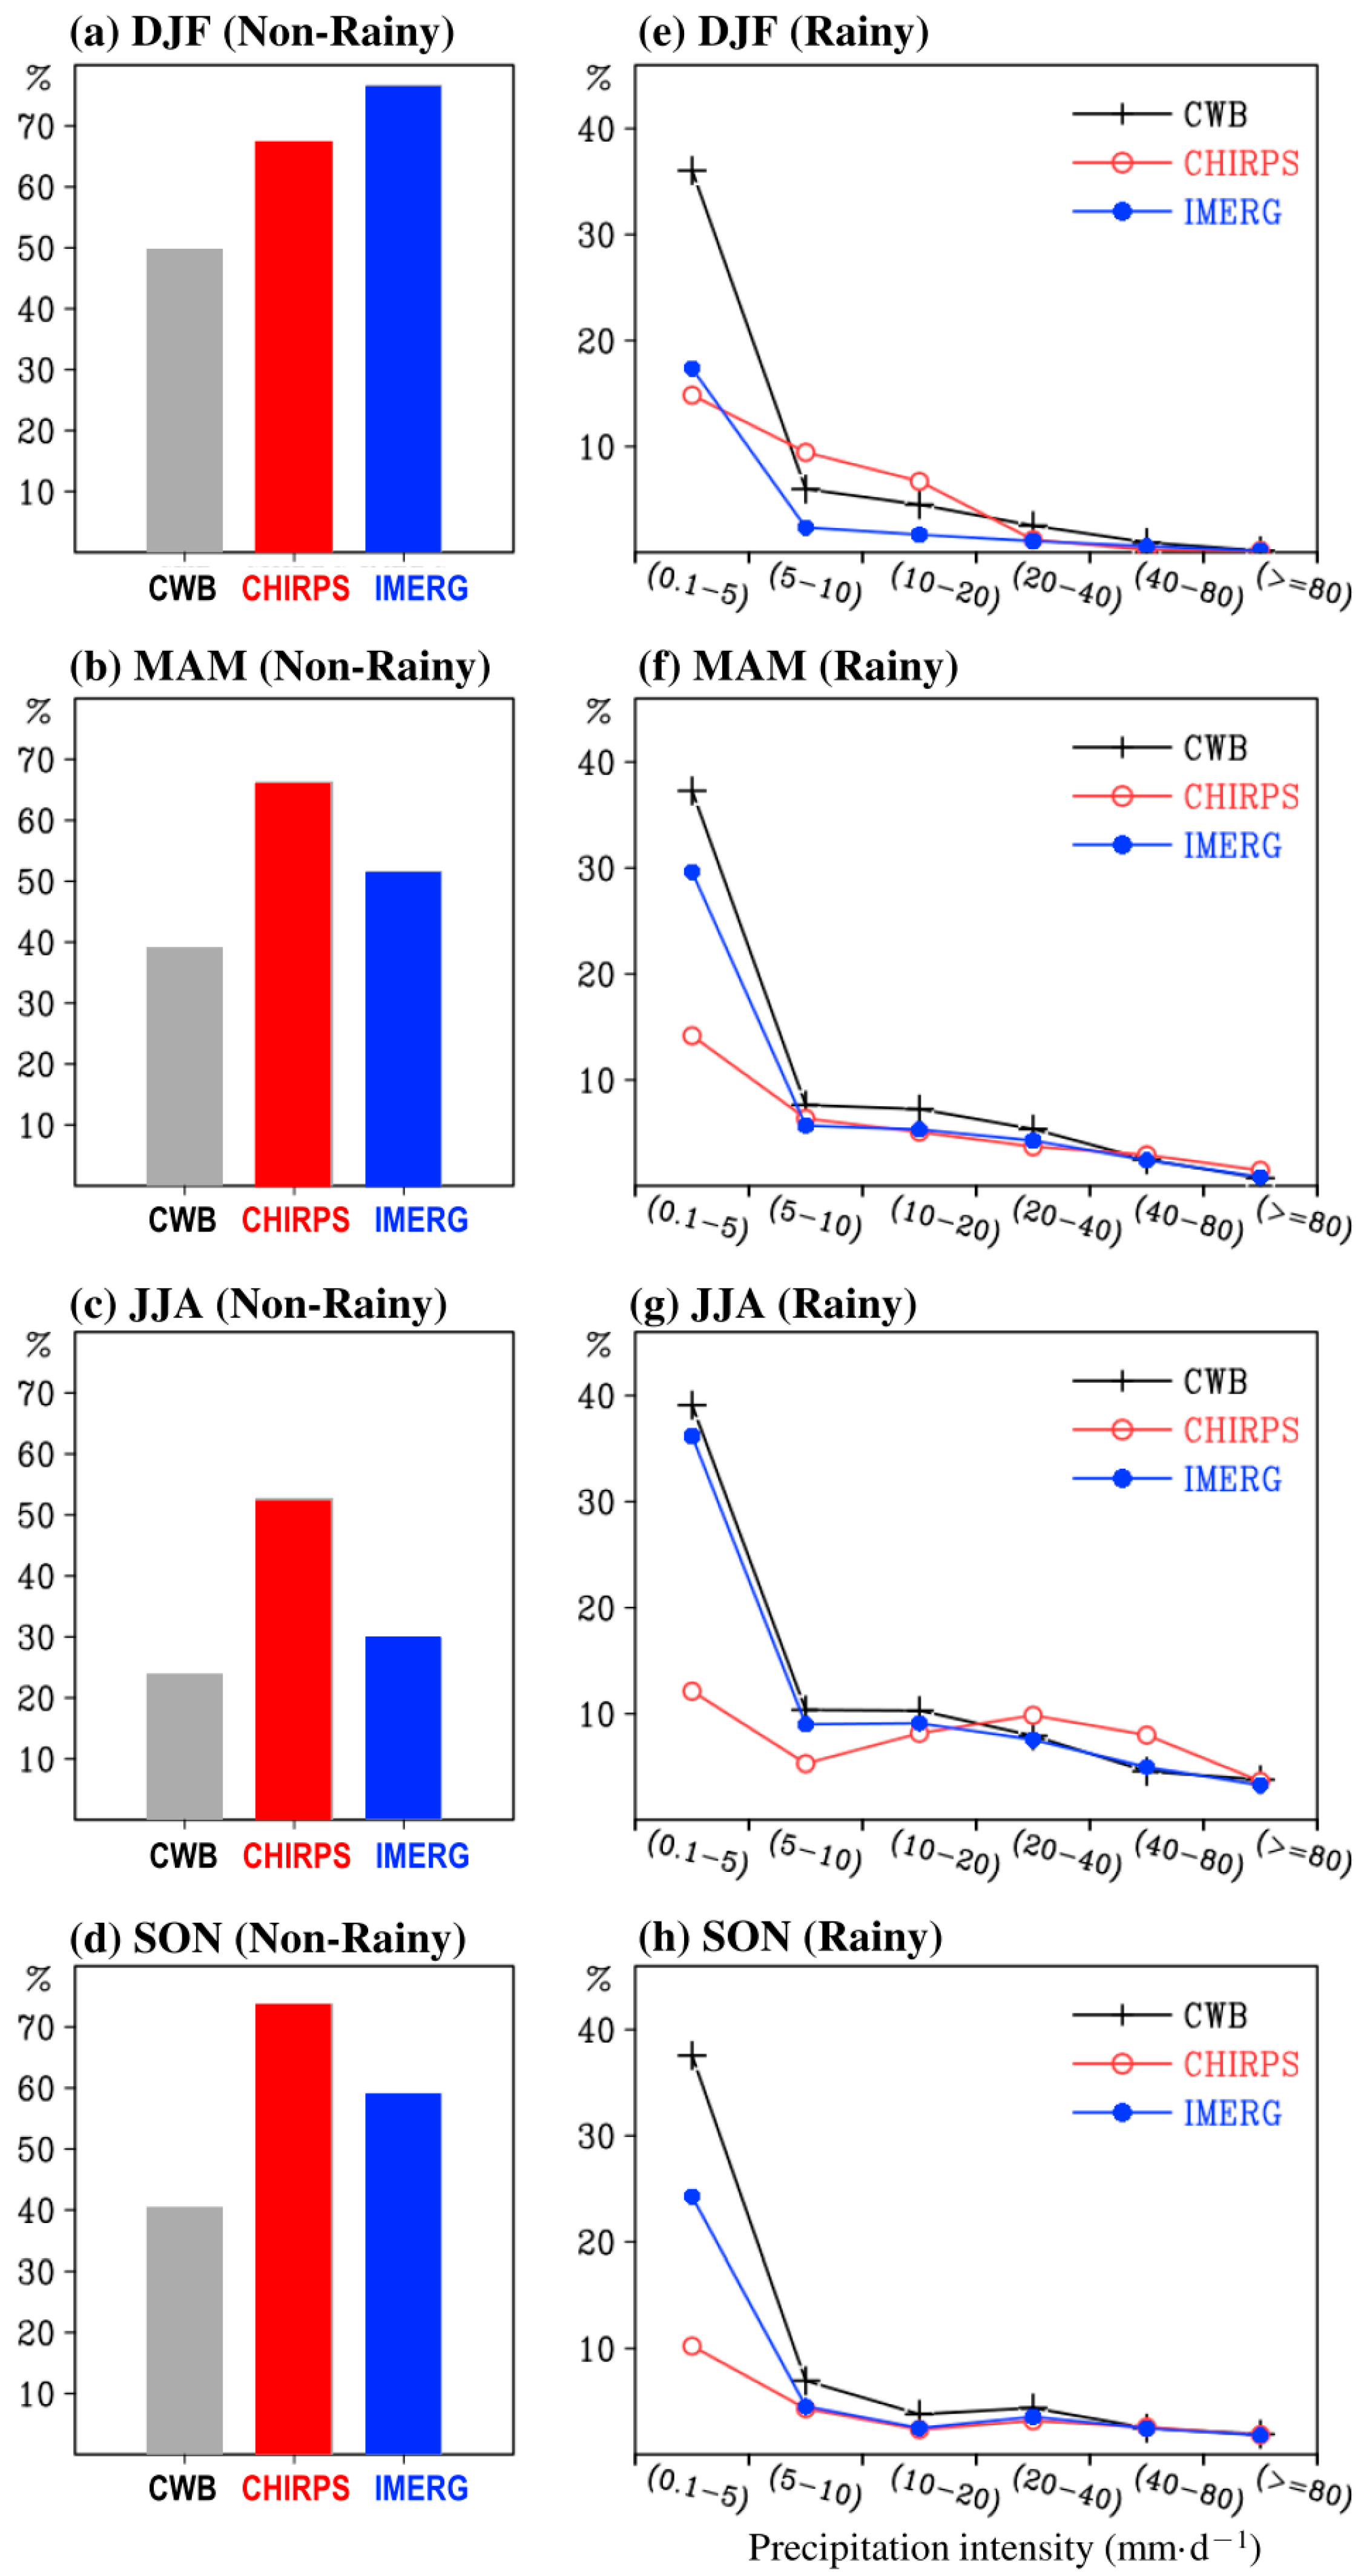
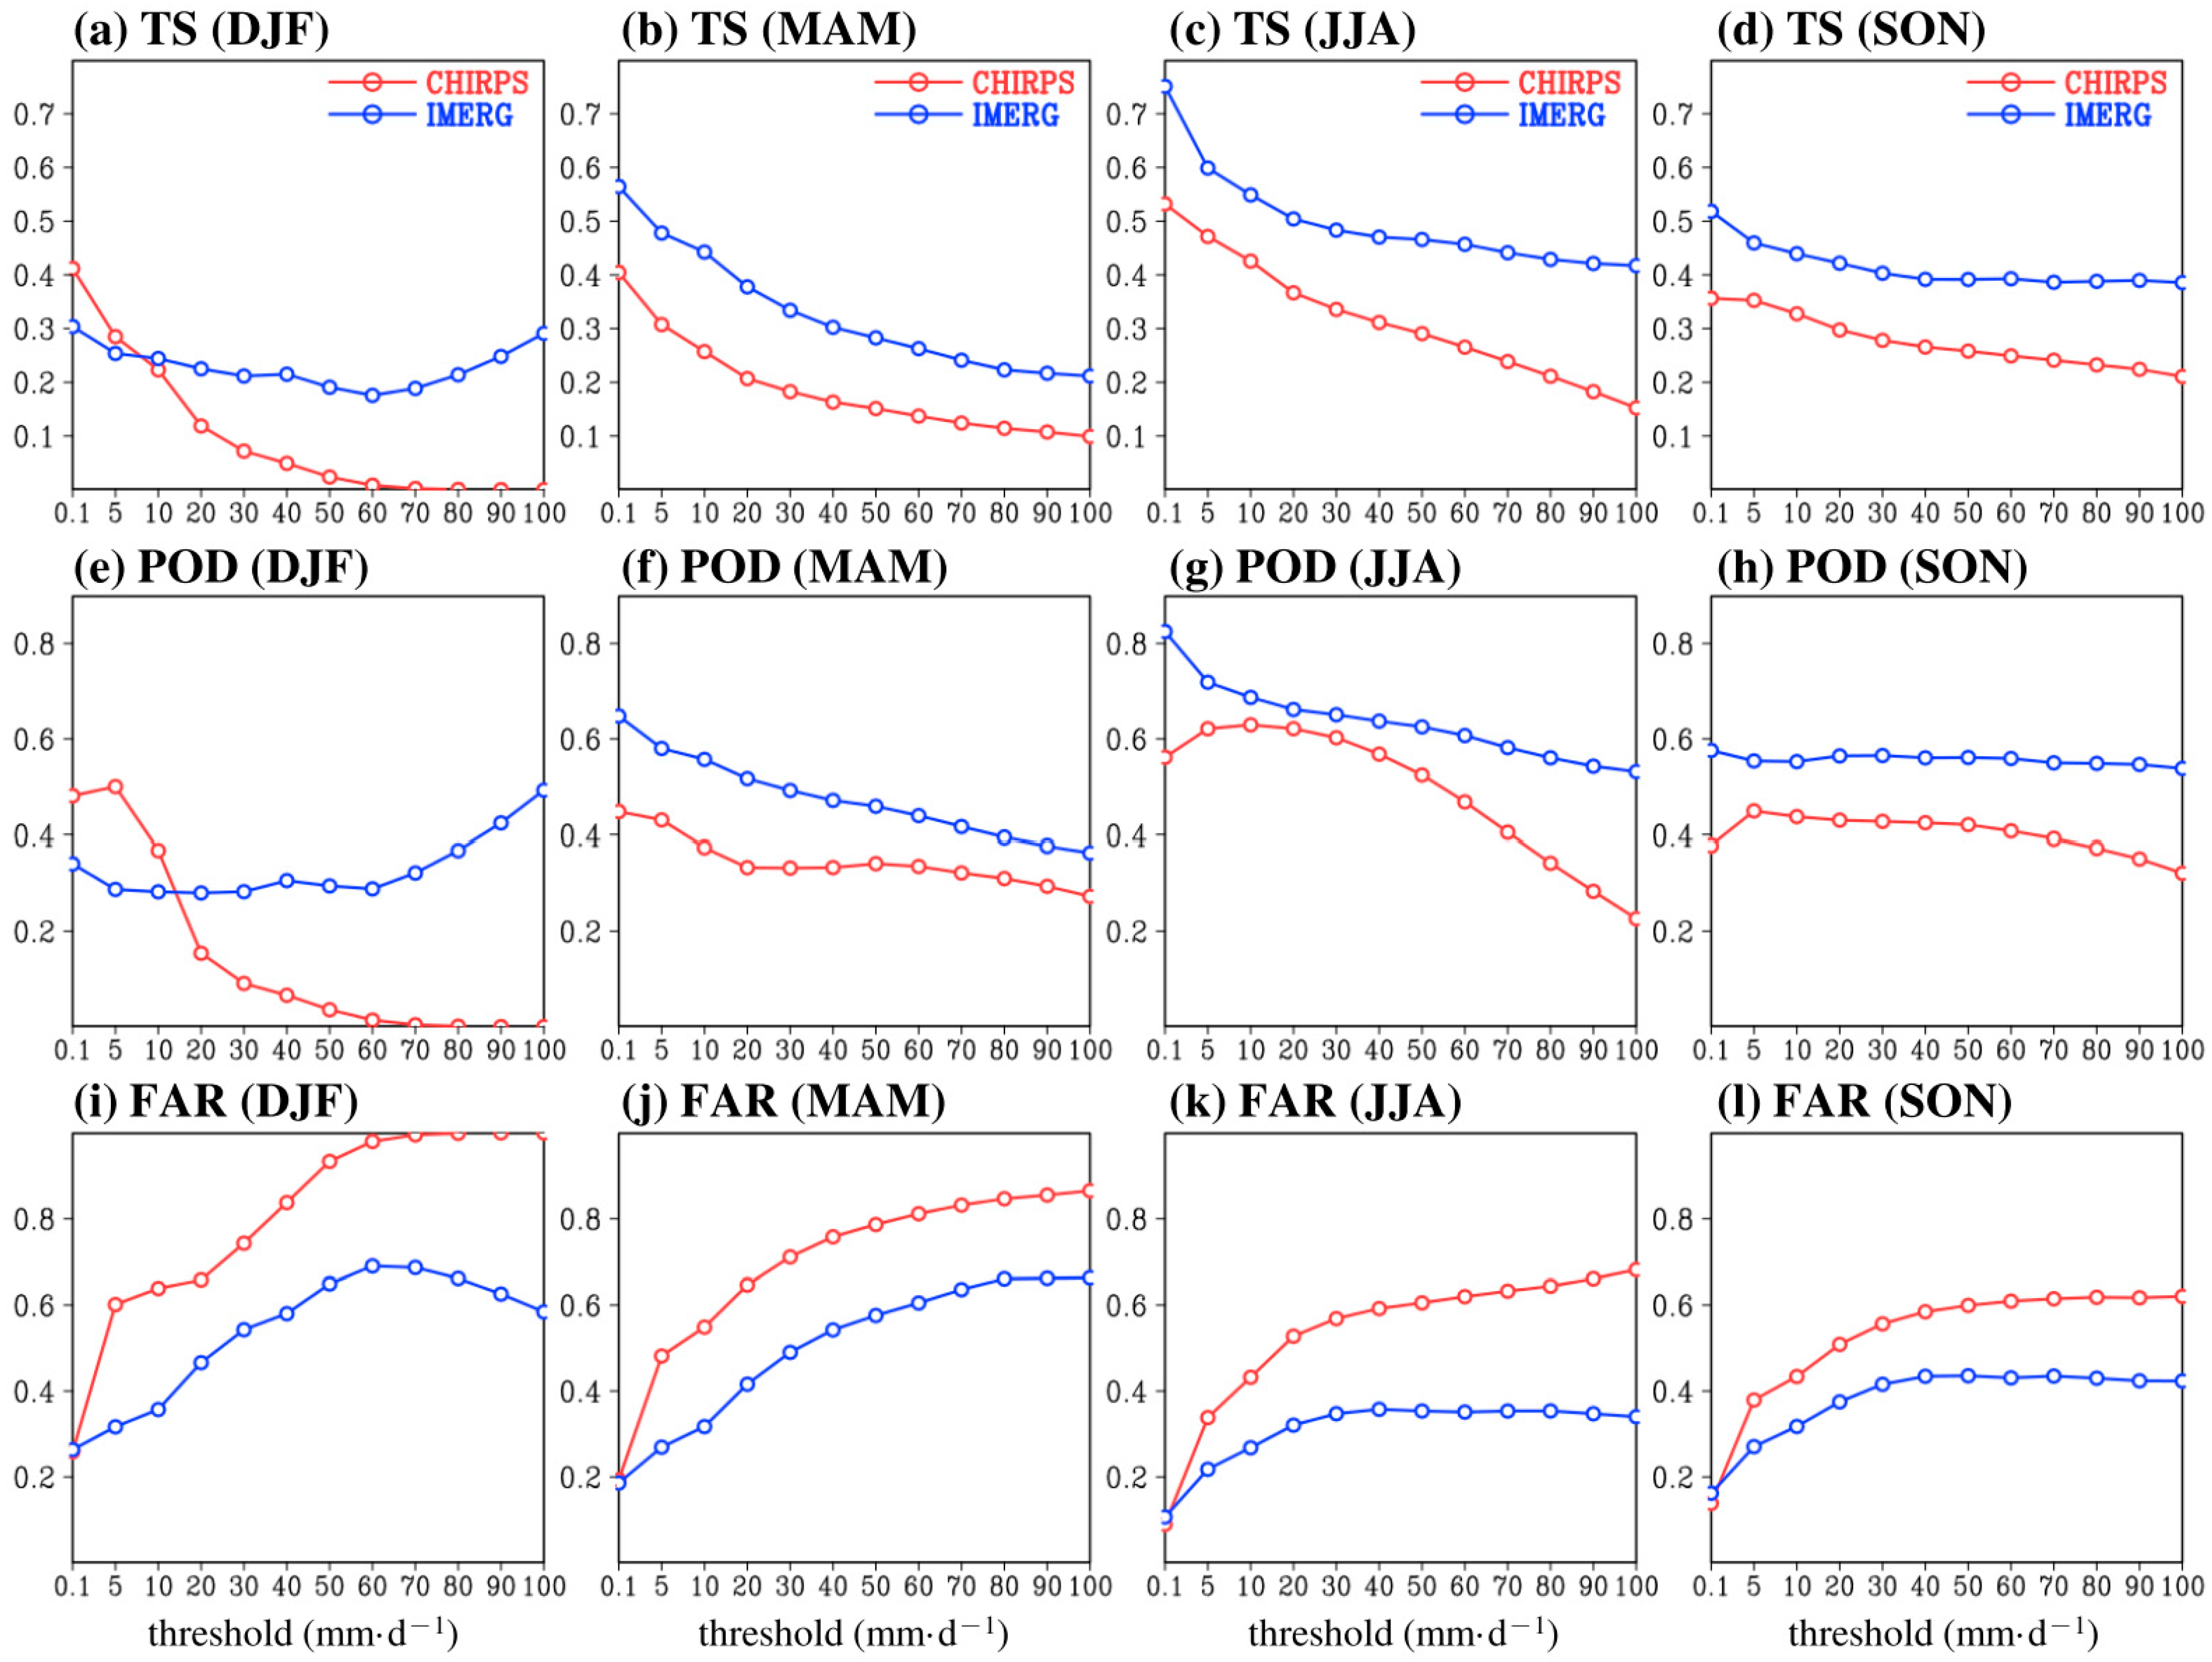
To further clarify whether the performance of SPPs is dependent on the threshold of the precipitation intensity, we examined the probability density frequency (PDF) for the occurrence of non-rainy (Figure 10a–d) and rainy grids (Figure 10e,f) for all four seasons. As seen in Figure 10a–d, both CHIRPS and IMERG overestimated the percentage of non-rainy grids for all four seasons. Among the two SPPs, IMERG has the percentage of non-rainy grids closer to CWB for spring, summer, and autumn. In contrast, CHIRPS has the percentage of non-rainy grids closer to CWB in winter. As for the percentage of rainy grids, one can note from Figure 10e–h that IMERG overall provides a PDF more similar to CWB, especially for the summer. In contrast, CHIRPS has obvious errors in depicting the percentage of weaker precipitation (0.1–5 mm/day). Overall, Figure 10 also suggests that IMERG is superior to CHIRPS for most seasons, expect winter. Notably, as shown in Figure 10g, CHIRPS tends to overestimate grids showing the higher precipitation (>20 mm/day) in summer. This finding seems to contradict the data noted in Figure 6; this is because we did not consider the related location of the CWB and the two SPPs in Figure 10g. To overcome this weakness, we further constructed the skill scores of the TS, POD, and FAR to help judge the ability of the SPPs to quantitative estimate the precipitation at different thresholds: 0.1, 5, 10, 20, 30, 40, 50, 60, 70, 80, 90, and 100 mm/day (Figure 11).
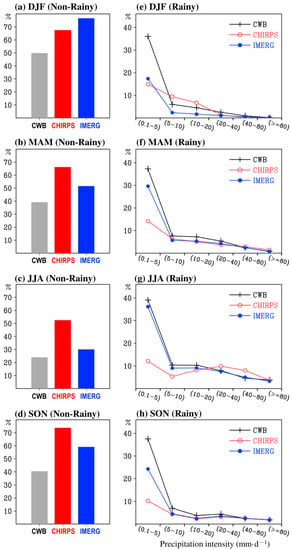
Figure 10.
(a–d) show percentages of non-rainy grids (defined as daily precipitation ≤0.1 mm/day) in all grids of CWB, CHIRPS, and IMERG for winter (DJF), spring (MAM), summer (JJA), and autumn (SON). (e–h) show the percentages of different criteria of rainy grids (defined as daily precipitation >0.1 mm/day) in all grids of CWB (black line), CHIRPS (red line), and IMERG (blue line) for the four seasons.
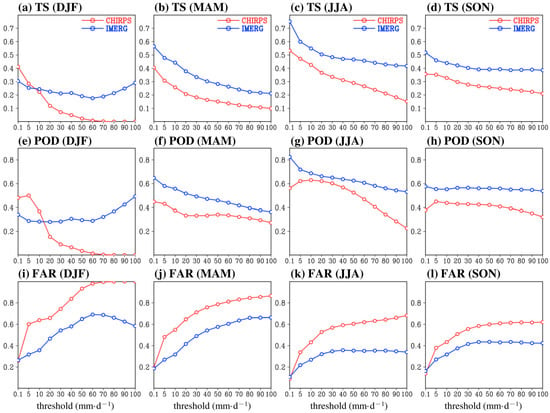
Figure 11.
Statistical scores calculated for comparison between CWB and two SPPs (CHIRPS and IMERG) during four seasons of 2001–2019 at different precipitation thresholds. (a–d) show values of threat score (TS), (e–h) show values of probability of detection (POD), (i–l) are the values of false alarm rate (FAR).
It can be noted from Figure 11b–d that the value of TS and POD in spring, summer, and autumn are higher in IMERG than in CHIRPS for all the precipitation thresholds examined. As higher values of TS and POD or lower values for FAR indicate that SPPs are better at quantitatively depicting the precipitation intensity [43], one can infer that IMERG is better than CHIRPS in capturing the daily precipitation during spring, summer, and autumn. This is consistent with the results shown in Figure 8, Figure 9 and Figure 10. As for winter, we noted that the TS (Figure 11a) and POD (Figure 11e) were larger for CHIRPS than for IMERG in the cases of a few precipitation thresholds (>0.1 mm/day and >5 mm/day), but a reverse situation was observed for most of the precipitation thresholds that were above 20 mm/day. Additionally, one can note from the FAR (Figure 11i–l) that IMERG outperforms CHIRPS for all the examined precipitation thresholds for all four seasons. These features again support the concept that CHIRPS was not better than IMERG for depicting the daily precipitation events at most precipitation thresholds, for the four seasons.
3.4. More Discussions
It should be mentioned that, although CHIRPS is not better than IMERG in depicting most of the examined features presented in Section 3.1, Section 3.2 and Section 3.3, this does not mean that CHIRPS cannot be applied in research. Instead, it can be seen from Figure 3 and Table 3 that CHIRPS can be applied to study the phase evolution of interannual precipitation variation for all four seasons (with Tcorr passing the criteria of 95% significance test). A similar suggestion is also revealed by Figure 5a, which shows that, over most of Taiwan, Tcorr is greater than 0.43 (thus satisfying the criteria of the 95% significance test), especially for spring, summer, and autumn. This information is important for researchers interested in examining the long-term changes in the precipitation over Taiwan because CHIRPS provides data from 1981 (about 40 years), while IMERG only has data available since 2001 (about 20 years). To further support this suggestion, we calculated the Tcorr between CWB and CHIRPS for the seasonal precipitation variation during the period of 1981–2019; the results are given in Table 6. It was found that all the values of Tcorr in Table 6 meet the 95% significance criterion, suggesting that CHIRPS has the ability to depict the evolution in the interannual variation of seasonal precipitation over Taiwan over long periods. This highlights the potential use of CHIRPS in studying the long-term variation in precipitation over Taiwan during 1981–2019, for which only limited data are available in the IMERG database.

Table 6.
Temporal correlation coefficient (Tcorr) for comparison between time series of CWB and CHIRPS in each individual season during 1981–2019.
Finally, it should be mentioned that, because the gridded CWB was generated using the Cressman scheme, which is a simple interpolation method based on inverse distance weighting of observations. This implies that, when different weighting for interpolation was used in Cressman scheme, the gridded CWB may have few changes in precipitation values; this changes may affect some statistical values presented in this study for the comparison between CWB and the two SPPs.
4. Conclusions
In this study, we examined the ability of CHIRPS and IMERG to depict the precipitation over Taiwan for several timescales, including annual, seasonal, interannual, and daily timescales. It can be summarized that IMERG is better than CHIRPS in terms of most of the features examined, including (1) the temporal phase evolution of precipitation on the annual, seasonal, interannual, and daily timescales (Figure 2, Figure 3, Figure 5 and Figure 9), (2) the quantitative estimation of daily precipitation variations for all four seasons (Figure 6, Figure 7, Figure 8 and Figure 9); (3) the probability density frequency of precipitation during most seasons, except winter (Figure 10), and (4) the skill scores of TS, POD, and FAR for most of the examined precipitation thresholds (Figure 11). In contrast, CHIRPS performed better than IMERG in terms of (1) the magnitude of the annual cycle of monthly precipitation climatology (Figure 1), (2) the spatial distribution of the seasonal mean precipitation for all the four seasons (Figure 4), (3) the quantitative precipitation estimation of the interannual variation of winter precipitation (area-averaged) in Taiwan (Figure 3), and (4) the occurrence frequency of non-rainy grids in winter (Figure 10). Possible causes for why IMERG is superior to CHIRPS for most examined features might be attributed to the fact that IMERG uses a combination of algorithms from all available satellite sensors (including TMPA and GPM) [44], while fewer sensors are used in CHIRPS [45].
Among the above-mentioned findings, it is most interesting to find that CHIRPS exhibits a very good ability to represent the seasonal variation of spatial distribution in climatological (long-term) mean precipitation (Figure 4). Earlier studies [46,47] suggested that the performance of CHIRPS in the spatial distribution of precipitation might be attributed to its high spatial resolution. However, upon examining the ability of CHIRPS to depict daily precipitation, we noted that CHIRPS overestimated the weaker daily-precipitation estimations and underestimated the higher daily precipitation (Figure 8). As inferred from the features revealed in Figure 8, we suggest that, in CHIRPS, the overestimation of the weaker daily precipitation might cancel out the underestimation of higher daily precipitation, which can lead to smaller errors (than in IMERG) in depicting the “long-term” seasonal mean of area-averaged precipitation (Table 2). The above features, which are observed in all four seasons, explain why CHIRPS has a better ability than IMERG to represent the “long-term” seasonal mean precipitation (but not the daily precipitation). These findings highlight the advantages and disadvantages of using CHIRPS and IMERG for studying the precipitation characteristics over Taiwan for multiple timescales.
Author Contributions
Conceptualization: W.-R.H.; Data curation: J.H. and P.-Y.L.; Investigation: W.-R.H. and J.H.; Software: J.H. and P.-Y.L.; Writing (original draft): J.H. and W.-R.H.; Writing (review and editing): J.H., W.-R.H., P.-Y.L., and X.L. All authors have read and agreed to the published version of the manuscript.
Funding
This research was funded by the Ministry of Science and Technology of Taiwan under MOST 106–2628-M-003–001-MY4 and MOST 109–2625-M-003–004. X. Li was supported by the National Natural Science Foundation of China (Project No. 41775043 and 42088101), and Guangdong Province Key Laboratory for Climate Change and Natural Disaster Studies (Grant 2020B1212060025).
Acknowledgments
We thank the providers of CHIRPS, IMERG, and CWB data.
Conflicts of Interest
The authors declare no conflict of interest.
References
- Chen, T.C.; Yen, M.C.; Hsieh, J.C.; Arritt, R.W. Diurnal and seasonal variations of the rainfall measured by the automatic rainfall and meteorological telemetry system in Taiwan. Bull. Am. Meteor. Soc. 1999, 80, 2299–2312. [Google Scholar] [CrossRef]
- Dinku, T.; Ceccato, P.; Grover-Kopec, E.; Lemma, M.; Connor, S.J.; Ropelewski, C.F. Validation of satellite rainfall products over East Africa’s complex topography. Int. J. Remote Sens. 2007, 28, 1503–1526. [Google Scholar] [CrossRef]
- Dinku, T.; Chidzambwa, S.; Ceccato, P.; Connor, S.J.; Ropelewski, C.F. Validation of high-resolution satellite rainfall products over complex terrain in Africa. Int. J. Remote Sens. 2008, 29, 4097–4110. [Google Scholar] [CrossRef]
- Dinku, T.; Ruiz, F.; Connor, S.; Ceccato, P. Validation and intercomparison of satellite rainfall estimates over Colombia. J. Appl. Meteor. Climatol. 2009, 49, 1004–1014. [Google Scholar] [CrossRef]
- Tian, Y.; Peters-Lidard, C.D.; Adler, R.F.; Kubota, T.; Ushio, T. Evaluation of GSMaP Precipitation Estimates over the Contiguous United States. J. Hydrometeorol. 2010, 11, 566–574. [Google Scholar] [CrossRef]
- Stampoulis, D.; Anagnostou, E.N. Evaluation of Global Satellite Rainfall Products over Continental Europe. J. Hydrometeorol. 2012, 13, 588–603. [Google Scholar] [CrossRef]
- Derin, Y.; Yilmaz, K.K. Evaluation of multiple satellite-based precipitation products over complex topography. J. Hydrometeorol. 2014, 15, 1498–1516. [Google Scholar] [CrossRef]
- Prakash, S.; Mitra, A.K.; Rajagopal, E.N.; Pai, D.S. Assessment of TRMM-based TMPA-3B42 and GSMaP precipitation products over India for the peak southwest monsoon season. Int. J. Climatol. 2015, 36, 1614–1631. [Google Scholar] [CrossRef]
- Huang, W.R.; Chang, Y.H.; Liu, P.Y. Assessment of IMERG precipitation over Taiwan at multiple timescales. Atmos. Res. 2018, 214, 239–249. [Google Scholar] [CrossRef]
- Derin, Y.; Anagnostou, E.; Berne, A.; Borga, M.; Boudevillain, B.; Buytaert, W.; Chang, C.; Delrieu, G.; Hong, Y.; Hsu, Y.C.; et al. Multiregional Satellite Precipitation Products Evaluation over Complex Terrain. J. Hydrometeorol. 2016, 17, 1817–1836. [Google Scholar] [CrossRef]
- Huang, W.R.; Liu, P.Y.; Chang, Y.H.; Liu, C.Y. Evaluation and Application of Satellite Precipitation Products in Studying the Summer Precipitation Variations over Taiwan. Remote Sens. 2020, 12, 347. [Google Scholar] [CrossRef]
- Liu, C.Y.; Aryastana, P.; Liu, G.R.; Huang, W.R. Assessment of satellite precipitation product estimates over Bali Island. Atmos. Res. 2020, 244, 105032. [Google Scholar] [CrossRef]
- Zhao, C.; Ren, L.; Yuan, F.; Zhang, L.; Jiang, S.; Shi, J.; Chen, T.; Liu, S.; Yang, X.; Liu, Y.; et al. Statistical and Hydrological Evaluations of Multiple Satellite Precipitation Products in the Yellow River Source Region of China. Water 2020, 12, 3082. [Google Scholar] [CrossRef]
- Funk, C.; Peterson, P.; Landsfeld, M.; Pedreros, D.; Verdin, J.; Shukla, S.; Husak, G.; Rowland, J.; Harrison, L.; Hoell, A.; et al. The climate hazards infrared precipitation with stations—A new environmental record for monitoring extremes. Sci. Data 2015, 2, 150066. [Google Scholar] [CrossRef] [PubMed]
- Joyce, R.J.; Janowiak, J.E.; Arkin, P.A.; Xie, P. CMORPH: A method that produces global precipitation estimates from passive microwave and infrared data at high spatial and temporal resolution. J. Hydrometeorol. 2004, 5, 487–503. [Google Scholar] [CrossRef]
- Kubota, T.; Shige, S.; Hashizume, H.; Ushio, T.; Aonashi, K.; Kachi, M.; Okamoto, K. Global Precipitation Map Using Satellite-Borne Microwave Radiometers by the GSMaP Project: Production and Validation. IEEE Trans. Geosci. Remote Sens. 2007, 45, 2259–2275. [Google Scholar] [CrossRef]
- Huffman, G.J.; Bolvin, D.T.; Braithwaite, D.; Hsu, K.; Joyce, R.; Kidd, C.; Nelkin, E.J.; Sorooshian, S.; Tan, J.; Xie, P. Algorithm Theoretical Basis Document (ATBD) Version 06: NASA Global Precipitation Measurement (GPM) Integrated Multi-Satellite Retrievals for GPM (IMERG); NASA/GSFC: Greenbelt, MD, USA, 2019.
- Ashouri, H.; Hsu, K.; Sorooshian, S.; Braithwaite, D.K.; Knapp, K.R.; Cecil, L.D.; Nelson, B.R.; Prat, O.P. PERSIANN-CDR: Daily Precipitation Climate Data Record from Multisatellite Observations for Hydrological and Climate Studies. Bull. Am. Meteorol. Soc. 2015, 96, 69–83. [Google Scholar] [CrossRef]
- Huffman, G.J.; Bolvin, D.T.; Neklin, E.J.; Wolff, D.B.; Adler, R.F.; Gu, G.J.; Hong, Y.; Bowman, K.P.; Stocker, E.F. The TRMM Multisatellite Precipitation Analysis (TMPA): Quasi-global, multiyear, combined-sensor precipitation estimates at fine scales. J. Hydrometeorol. 2007, 8, 38–55. [Google Scholar] [CrossRef]
- Maggioni, V.; Meyers, P.C.; Robinson, M.D. A review of merged high-resolution satellite precipitation product accuracy during the Tropical Rainfall Measuring Mission (TRMM) era. J. Hydrometeorol. 2016, 17, 1101–1117. [Google Scholar] [CrossRef]
- Derin, Y.; Anagnostou, E.; Berne, A.; Borga, M.; Boudevillain, B.; Buytaert, W.; Chang, C.-H.; Chen, H.; Delrieu, G.; Hsu, Y.C.; et al. Evaluation of GPM-era Global Satellite Precipitation Products over Multiple Complex Terrain Regions. Remote Sens. 2019, 11, 2936. [Google Scholar] [CrossRef]
- Zhang, Y.; Hanati, G.; Danierhan, S.; Liu, Q.; Xu, Z. Evaluation and comparison of daily GPM/TRMM precipitation products over the Tianshan Mountains in China. Water 2020, 12, 3088. [Google Scholar] [CrossRef]
- Chen, C.S.; Chen, Y.L. The rainfall characteristics of Taiwan. Mon. Weather Rev. 2003, 131, 1323–1341. [Google Scholar] [CrossRef]
- Yen, M.C.; Chen, T.C. Seasonal variation of the rainfall over Taiwan. Int. J. Climatol. 2000, 20, 803–809. [Google Scholar] [CrossRef]
- Kerns, B.W.J.; Chen, Y.L.; Chang, M.Y. The diurnal cycle of winds, rain, and clouds over Taiwan during the mei-yu, summer, and autumn rainfall regimes. Mon. Weather Rev. 2010, 138, 497–516. [Google Scholar] [CrossRef]
- Kishtawal, C.M.; Krishnamurti, T.N. Diurnal variation of summer rainfall over Taiwan and its detection using TRMM observations. J. Appl. Meteorol. 2001, 40, 331–344. [Google Scholar] [CrossRef]
- Huang, W.R.; Wang, S.Y. Impact of Land-Sea breezes at different scales on the diurnal rainfall in Taiwan. Clim. Dyn. 2014, 43, 1951–1963. [Google Scholar] [CrossRef]
- Chen, S.Y.; Huang, W.R. Evaluation on the performance of TRMM, CMORPH, and PERSIANN in depicting the diurnal precipitation variation in Taiwan. Atmos. Sci. 2017, 45, 167–191, (In Chinese with an English Abstract). [Google Scholar]
- Bichet, A.; Diedhiou, A. West African Sahel has become wetter during the last 30 years, but dry spells are shorter and more frequent. Clim. Res. 2018, 75, 155–162. [Google Scholar] [CrossRef]
- Bichet, A.; Diedhiou, A. Less frequent and more intense rainfall along the coast of the Gulf of Guinea in West and Central Africa (1981–2014). Clim. Res. 2018, 76, 191–201. [Google Scholar] [CrossRef]
- Sacré Regis, M.D.; Mouhamed, L.; Kouakou, K.; Adeline, B.; Arona, D.; Houebagnon Saint, J.C.; Koffi Claude, A.K.; Talnan Jean, H.C.; Salomon, O.; Issiaka, S. Using the CHIRPS dataset to investigate historical changes in precipitation extremes in West Africa. Climate 2020, 8, 84. [Google Scholar] [CrossRef]
- Paredes, F.; Barbosa, H.A.; Lakshmi-Kumar, T. Validating CHIRPS-based satellite precipitation estimates in Northeast Brazil. J. Arid Environ. 2016, 139, 26–40. [Google Scholar] [CrossRef]
- Ogbu, K.N.; Hounguè, N.R.; Gbode, I.E.; Tischbein, B. Performance evaluation of satellite-based rainfall products over Nigeria. Climate 2020, 8, 103. [Google Scholar] [CrossRef]
- Atiah, W.A.; Amekudzi, L.K.; Aryee, J.N.A.; Preko, K.; Danuor, S.K. Validation of satellite and merged rainfall data over Ghana, West Africa. Atmosphere 2020, 11, 859. [Google Scholar] [CrossRef]
- AL-Falahi, A.H.; Saddique, N.; Spank, U.; Gebrechorkos, S.H.; Bernhofer, C. Evaluation the performance of several gridded precipitation products over the highland region of yemen for water resources management. Remote Sens. 2020, 12, 2984. [Google Scholar] [CrossRef]
- Bai, L.; Shi, C.; Li, L.; Yang, Y.; Wu, J. Accuracy of CHIRPS satellite-rainfall products over Mainland China. Remote Sens. 2018, 10, 362. [Google Scholar] [CrossRef]
- An, Y.; Zhao, W.; Li, C.; Liu, Y. Evaluation of six satellite and reanalysis precipitation products using gauge observations over the Yellow River Basin, China. Atmosphere 2020, 11, 1223. [Google Scholar] [CrossRef]
- Cressman, G.P. An operational objective analysis system. Mon. Weather Rev. 1959, 87, 367–374. [Google Scholar] [CrossRef]
- Funk, C.; Michaelsen, J.; Marshall, M. Mapping recent decadal climate variations in Eastern Africa and the Sahel. In Remote Sensing of Drought: Innovative Monitoring Approaches; Wardlow, B., Anderson, M., Verdin, J., Eds.; CRC Press: Lincoln, NE, USA, 2012. [Google Scholar]
- Saha, S.; Moorthi, S.; Pan, H.L.; Wu, X.; Wang, J.; Nadiga, S.; Reynolds, R.W. The NCEP climate forecast system reanalysis. Bull. Am. Meteorol. Soc. 2010, 91, 1015–1057. [Google Scholar] [CrossRef]
- Hong, Y.; Hsu, K.L.; Sorooshian, S.; Gao, X. Precipitation estimation from remotely sensed imagery using an artificial neural network cloud classification system. J. Appl. Meteorol. 2004, 43, 1834–1852. [Google Scholar] [CrossRef]
- Wilks, D.S. Statistical Methods in the Atmospheric Sciences, 1st ed.; Academic Press: Cambridge, MA, USA, 1995; p. 467. [Google Scholar]
- Ebert, E. Methods for verifying satellite precipitation estimates. In Measuring Precipitation from Space; Levizzani, V., Bauer, P., Turk, F.J., Eds.; Springer: Dordrecht, The Netherlands, 2007; Volume 28, pp. 345–356. [Google Scholar]
- Hou, A.; Kakar, R.; Neeck, S.; Azarbarzin, A.; Kummerow, C.; Kojima, M.; Oki, R.; Nakamura, K.; Iguchi, T. The global precipitation measurement mission. Bull. Am. Meteorol. Soc. 2014, 95, 701–722. [Google Scholar] [CrossRef]
- Kolluru, V.; Kolluru, S.; Wagle, N.; Acharya, T.D. Secondary precipitation estimate merging using machine learning: Development and evaluation over Krishna River Basin, India. Remote Sens. 2020, 12, 3013. [Google Scholar] [CrossRef]
- Gao, F.; Zhang, Y.; Ren, X.; Yao, Y.; Hao, Z.; Cai, W. Evaluation of CHIRPS and its application for drought monitoring over the Haihe River Basin, China. Nat. Hazards 2018, 92, 155–172. [Google Scholar] [CrossRef]
- Abebe, S.A.; Qin, T.; Yan, D.; Gelaw, E.B.; Workneh, H.T.; Kun, W.; Liu, S.; Dong, B. Spatial and Temporal Evaluation of the latest high-resolution precipitation products over the Upper Blue Nile River Basin, Ethiopia. Water 2020, 12, 3072. [Google Scholar] [CrossRef]
Publisher’s Note: MDPI stays neutral with regard to jurisdictional claims in published maps and institutional affiliations. |
© 2021 by the authors. Licensee MDPI, Basel, Switzerland. This article is an open access article distributed under the terms and conditions of the Creative Commons Attribution (CC BY) license (http://creativecommons.org/licenses/by/4.0/).

