1. Introduction
Urban-rural migration is a major issue affecting the sustainable development of society, while the spatial distribution of population is a core focus of research in population geography [
1]. Driven by economic globalization, developing countries occupy an increasing share of the world economy and the world’s economic center continues to move to Asia [
2,
3,
4]. As the largest developing country, China has experienced an unprecedented growth rate over the past 30 years. The urbanization rate has increased from 26% to 58% and the growth rate is about 2.7 times the world average (World Bank). China’s rapidly developing social economy and ongoing urbanization has resulted in the relocation and reorganization of urban and rural populations [
5,
6,
7,
8] as reflected in the continuous growth of the former and substantial reductions in the latter’s labor force. According to the National Bureau of Statistics of China (NBSC), the country’s urban population has increased by an average of 21 million per year since 2000. In contrast, the agricultural labor force has decreased by 11 million per year [
9] and the rural population has decreased by ~30.2%, from 808 million in 2000 to 564 million in 2018 (NBSC). It is worth noting that population migration from mountainous areas has been particularly significant [
9]. The process of urban-rural migration results in the redistribution of production factors such as capital, which will impact on the ecosystem and social economy, with contradiction between resources, the environment and population changing accordingly [
10,
11,
12]. The rural population structure has also changed (including age, gender and number), which has changed the land use pattern and human activities radius, thereby affecting the construction and restoration of rural ecological civilization [
6,
13,
14,
15]. Therefore, mapping and estimating the spatial distribution of populations can provide scientific support for developing regionally sustainable development strategies and spatial land-use planning [
16,
17].
Traditional demographic statistics and analysis mainly rely on population surveys, including censuses and sampling studies. Until now, China has carried out six censuses. Although population surveys are scientific and authoritative [
10,
18], their data acquisition cycle is long and townships are the smallest survey unit, such that the spatial resolution of the data is insufficient [
19]. Therefore most studies do not use the administrative unit as the research object [
13,
20,
21]. With the rapid development of geographic information system and remote sensing technology, multi-source remote sensing data have been widely applied in spatial population research, especially land-use and night-time light (NTL) data [
19,
22,
23,
24,
25,
26,
27,
28,
29]. For example, Yang et al. [
24] combined Defense Meteorological Satellite Program’s Operational Linescan System (DMSP-OLS) NTL data, enhanced vegetation index data and digital elevation model (DEM) data to simulate the population density of Zhejiang. Hu et al. [
25] determined the spatial distribution of population in Sichuan and Chongqing based on NTL data and land-use data. Other studies have shown that the spatial distribution of regional populations can be well-described by data processing, multi-source data fusion and model improvement [
24,
30]. Most research has remained focused on the spatial modeling of population at a single point in time [
19,
23,
29,
31,
32], however few studies adopt multivariate data to model the population spatial distribution in a long time series.
Although the DMSP-OLS dataset provides continuous NTL data from 1992 to 2013 [
33], its imagery contains problems due to OLS limitations such as discontinuity and oversaturation by bright lights [
34,
35] These data were replaced by Suomi National Polar-orbiting Partnership Visible Infrared Imaging Radiometer Suite (NPP-VIIRS) NTL data after 2013, bringing clear upgrades such as improved spatial resolution and reduced saturation [
33] as well as on-board calibration [
36]. Although these are clear upgrades, they also present challenges to obtaining consistent long-term NTL data [
35,
37,
38], such that proper integration of the two datasets must be accomplished before the construction of a long-term population spatial distribution dataset and there have been several attempts to integrate DMSP and VIIRS NTL data [
37,
38,
39,
40,
41]. Zhu et al. [
39] established the relationship between the two at the provincial level and used it to model China’s Gross Domestic Product. Zhao et al. [
37] achieved this at the pixel level and established a long-term NTL dataset in Southeast Asia. Previous studies have contributed to enhancing the consistency of NTL between DMSP and VIIRS data, however there are limitations regarding a widespread application of current methods, such as the models proposed has regional limitations and may not be suitable for other regions [
37,
41]; the datasets used are not accessible to general public [
40,
41]; and the time series of data generated only has consistent NTL indices at the administrative level and is still limited at the pixel level [
39].
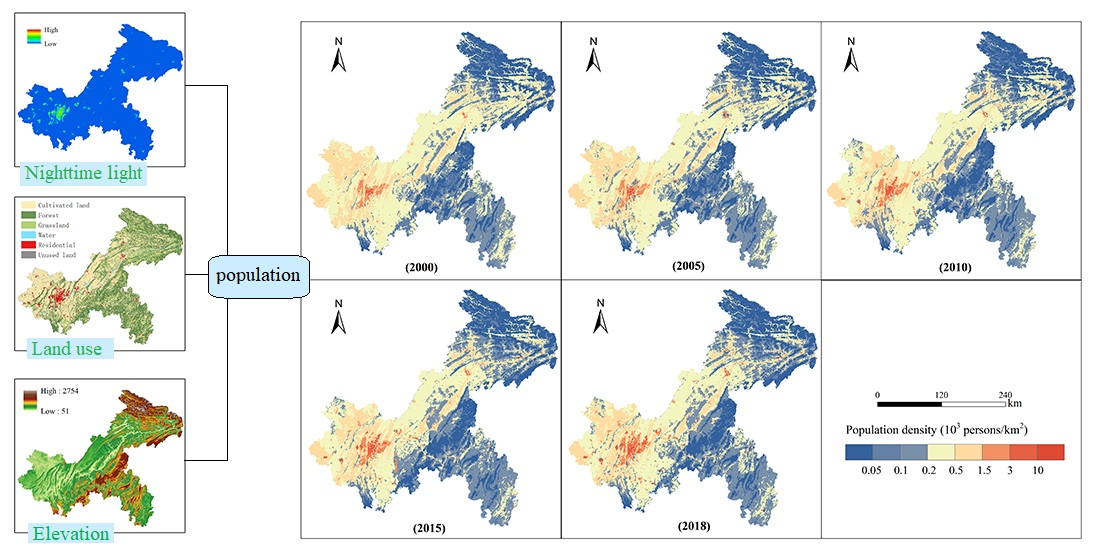
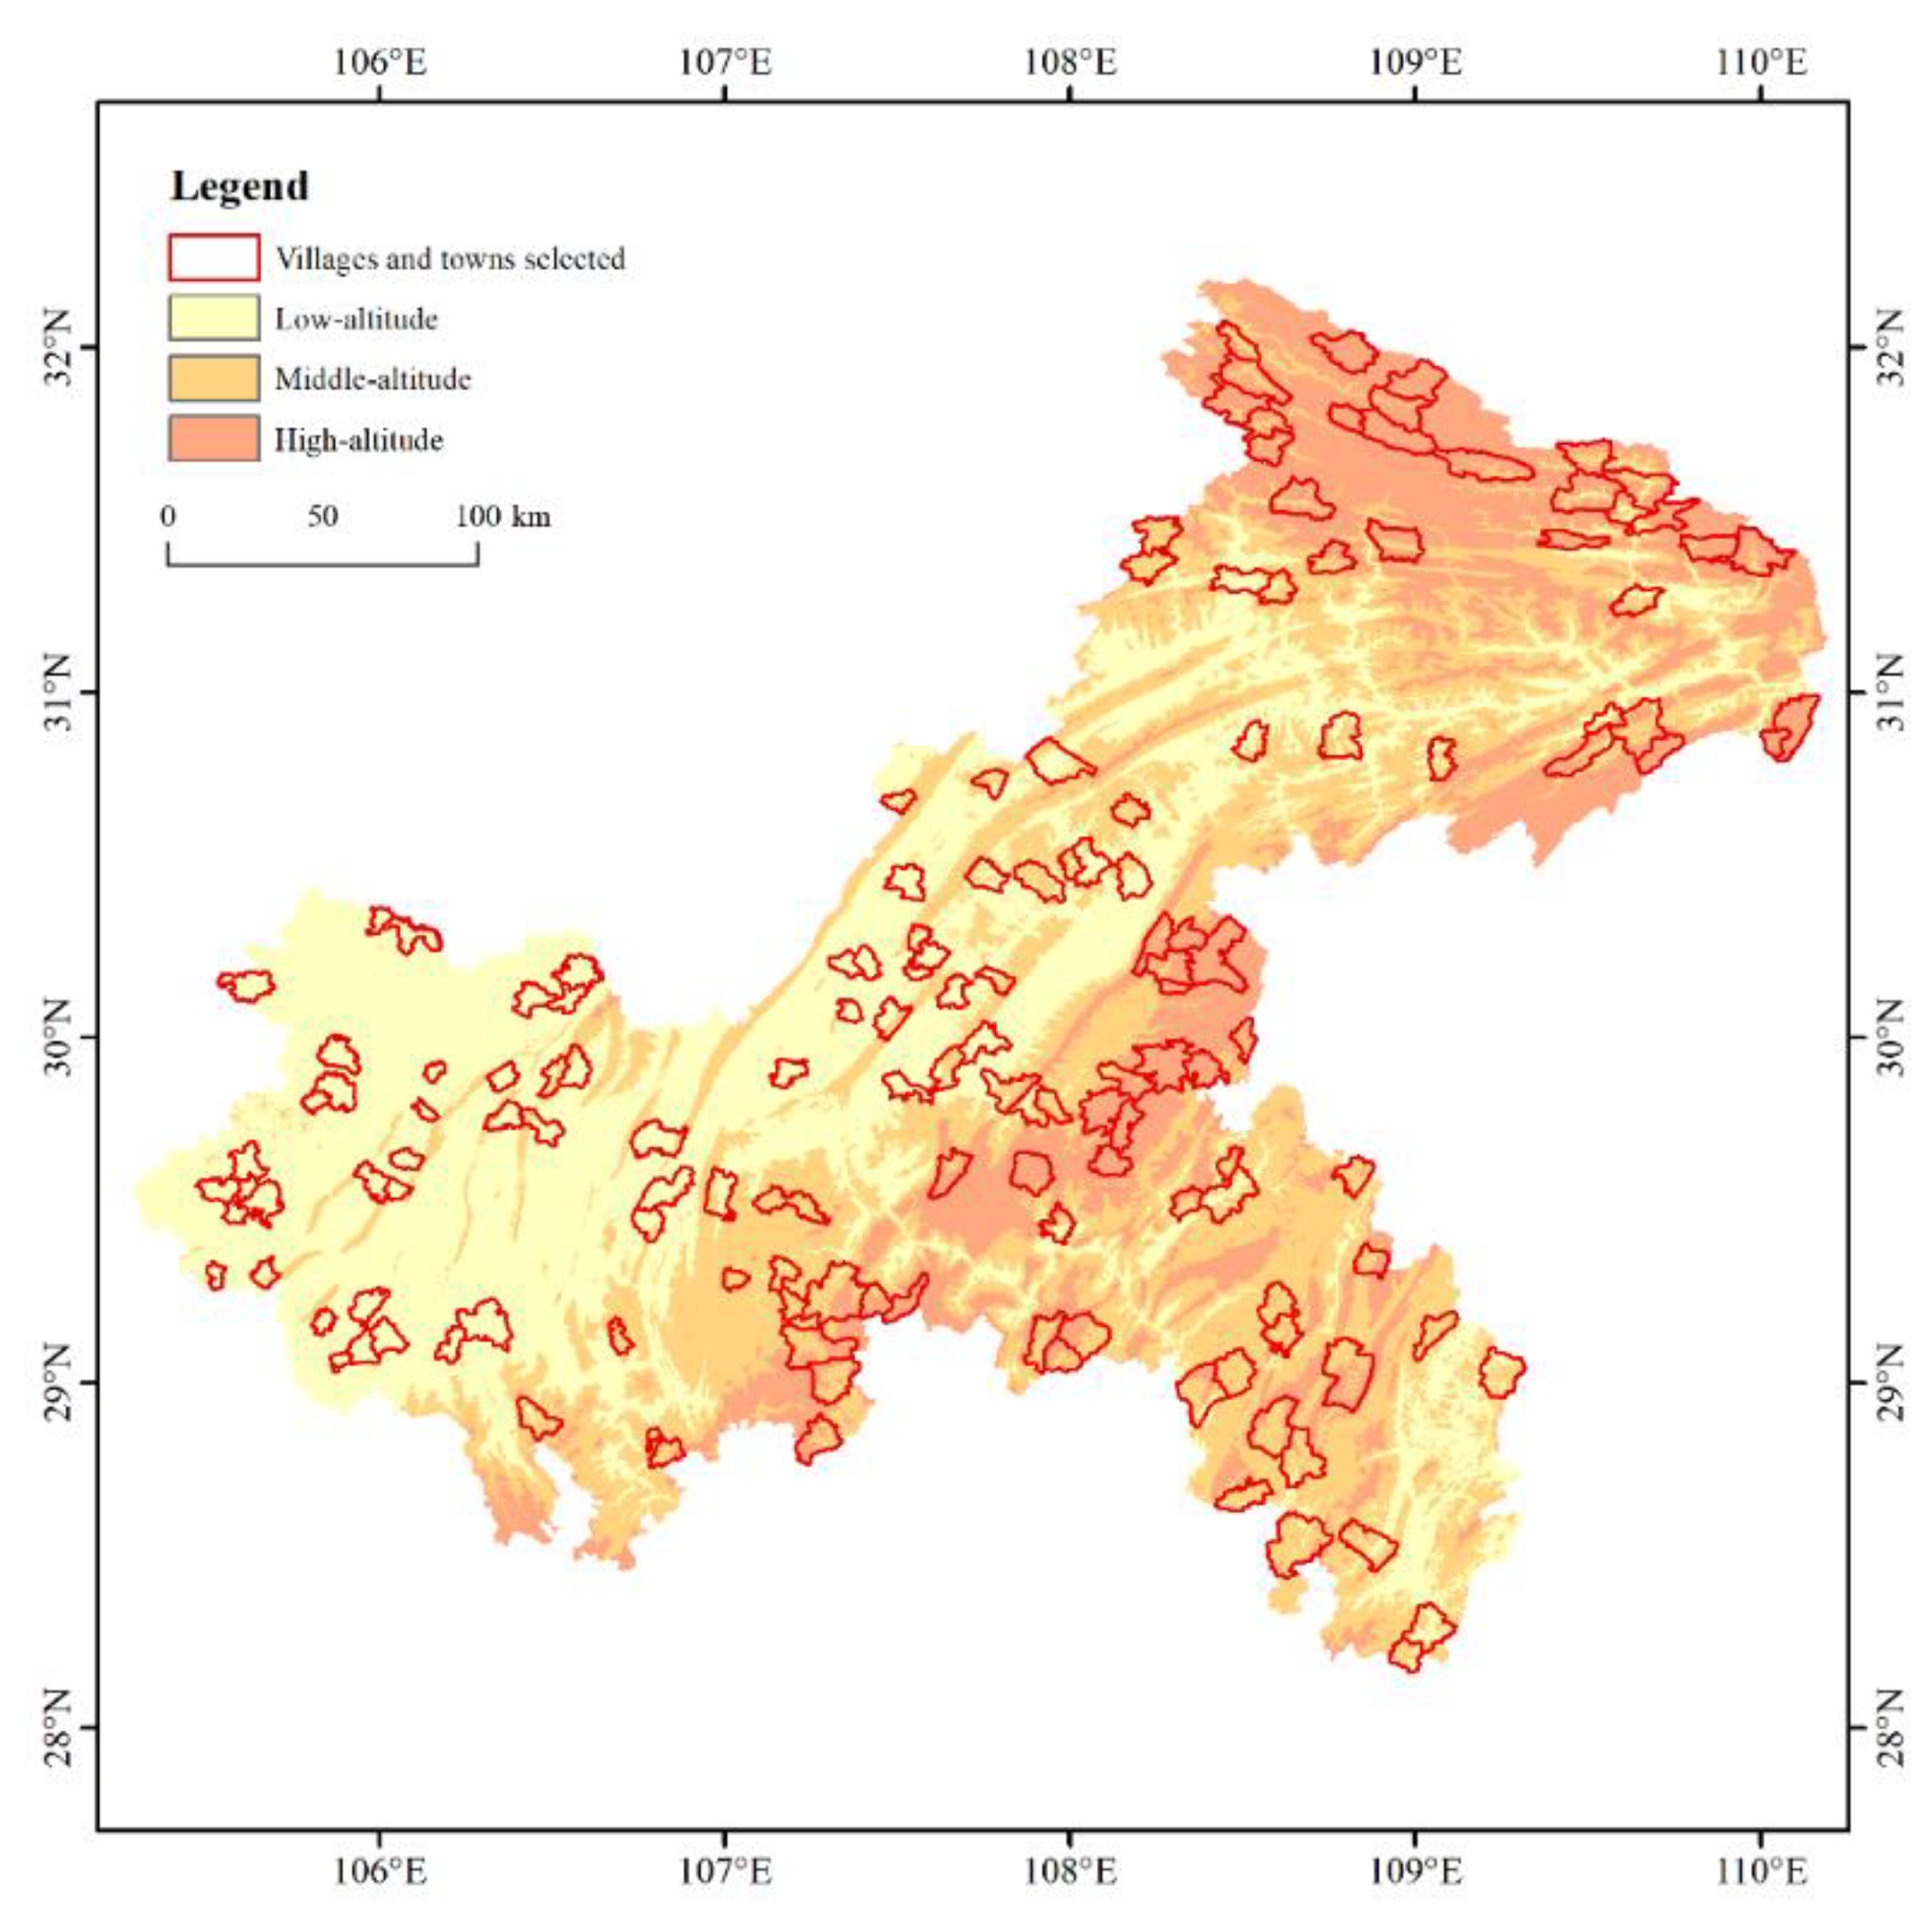
The municipality of Chongqing integrates a metropolis and a large rural area that is mostly mountainous area, which is characterized by intense human activities and a fragile ecological environment. According to the NBSC, ongoing urbanization in Chongqing resulted in the rural population declining from 15.33 million to 10.7 million from 2005 to 2018 (a decrease of 30.2%), exceeding the national average of 24.34%. Meanwhile, Chinese policies targeting poverty alleviation and rural revitalization have benefitted most residents in poor mountainous areas through relocation, resulting in major changes in population distribution. Therefore, exploring the spatiotemporal changes in Chongqing’s population via a timely understanding of population distribution data can help guide population migration from mountainous areas, promote the sustainable development of the regional economy and inform ecological restoration in mountainous areas.
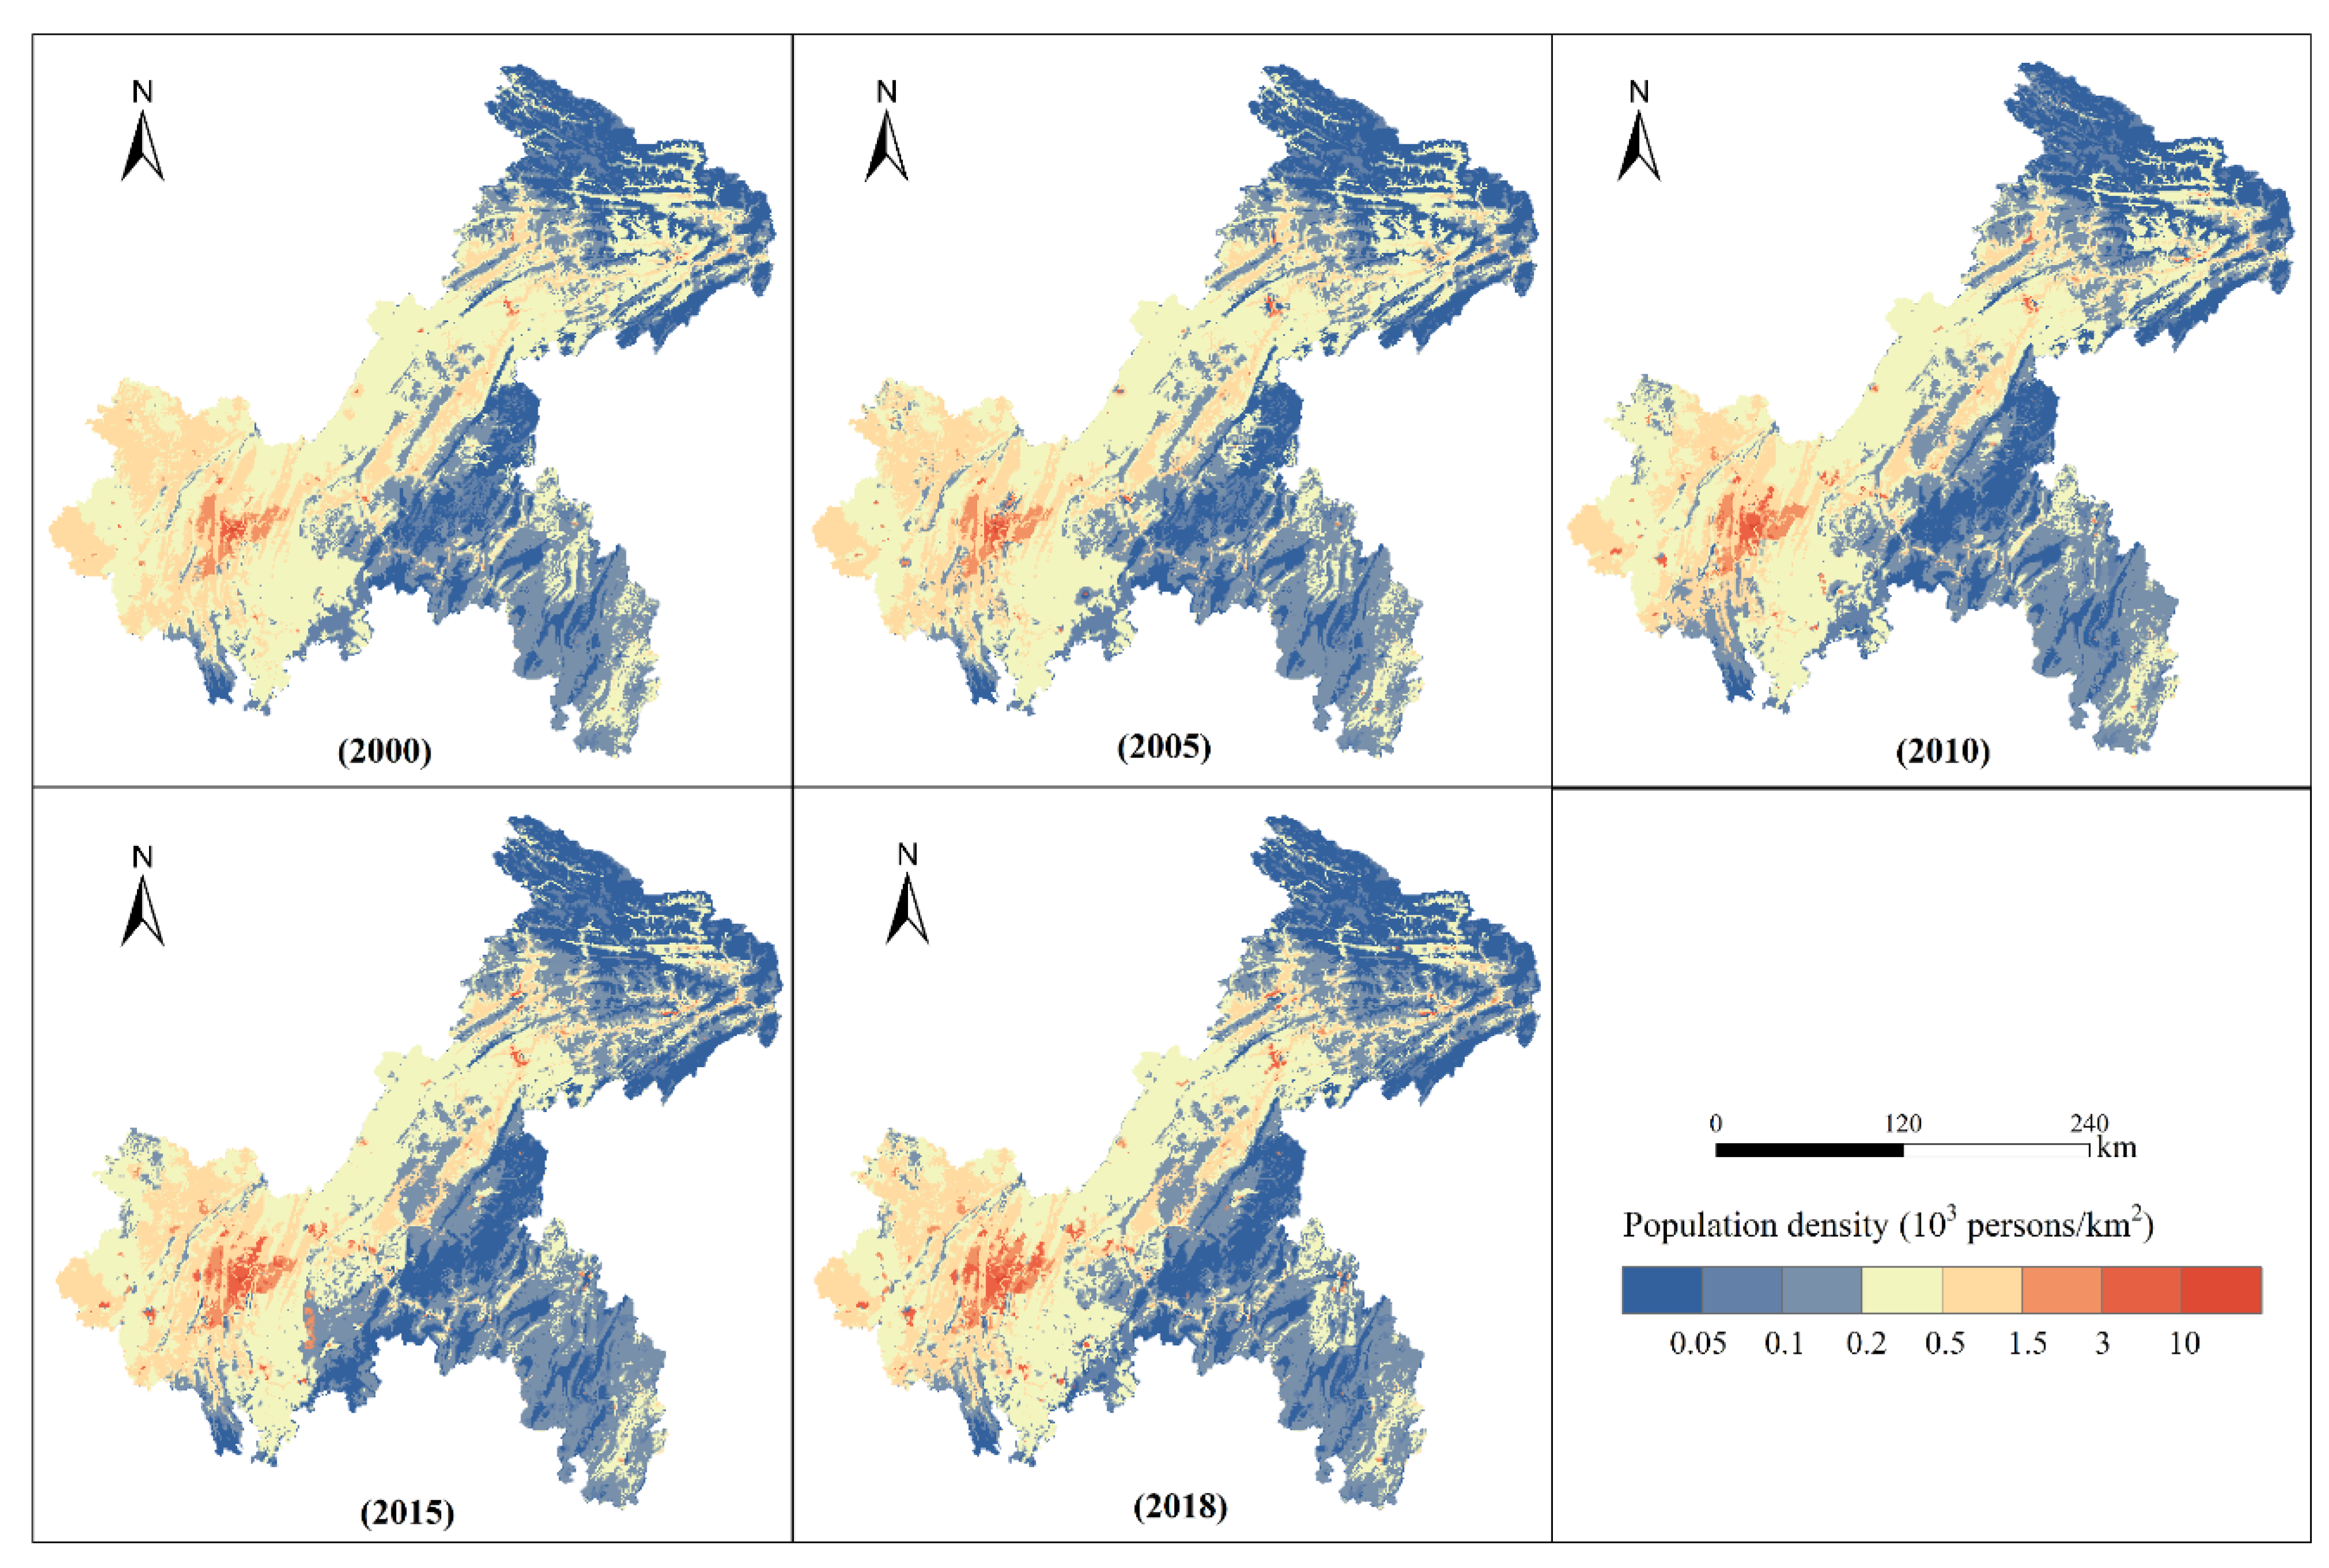
This study explored integration methods for the two NTL datasets that are suitable for the study area at the pixel level and constructed a long-term NTL dataset that provides a basis for modeling long-term population spatial distribution data. Then it simulated the spatial distribution of Chongqing’s population in 2000, 2005, 2010, 2015 and 2018 by integrating the two NTL datasets and analyzing spatiotemporal changes. Our results can serve as a scientific reference for rationally allocating urban and rural resources, optimizing urban and rural spatial patterns and promoting the high-quality development of the regional economy.
5. Discussion
The DMSP-OLS dataset represents the most widely used NTL data over the previous two decades, while the new NPP-VIIRS NTL data have been available since 2012. Despite the great significance of studying long-term population evolution in the context of urban-rural migrations, few studies have integrated the two datasets to simulate and monitor population spatial changes over the full time period. In this study, we proposed a method for integrating the DMSP-OLS and NPP-VIIRS data at the pixel scale in order to extend the temporal coverage of NTL data. Meanwhile, we have evaluated the accuracy of the integrated NTL data and the MRE was 8.19%. Our integration accuracy was improved by 4.78% compared with the long-time-series NTL dataset established at the provincial level [
39], which indicated that our method for NTL integration was feasible and the resulting data had good quality and generally reliable temporal consistency.
Previous studies have simulated population spatial distribution in different regions using NTL and land-use data. Hu et al. [
25] did this for Sichuan and Chongqing in 2014, with MREs for population data based on DMSP-OLS and NPP-VIIRS NTL data of 46.3% and 44.62%, respectively. Chowdhury et al. [
23] developed a model for estimating the population in the Indian portion of the Indo-Gangetic Plains at both city and state levels by employing OLS NTL data. The model was validated for the population of year 1995, with an MRE of 9.4%. Liu et al. [
26] simulated the spatial pattern of urban and rural residents in the Huang-Huai-Hai area with an MRE of 15.6%. Tan et al. [
19] simulated the population density of China in 2000, achieving a correlation coefficient between the statistical and simulated values of 0.95. The accuracy of population simulations in mountainous areas such as Chongqing and Sichuan is lower than in plains areas such as Huang-Huai-Hai, demonstrating that population simulation in mountainous areas is more challenging and uncertain. As we were limited by the difficulty of obtaining accurate population data in towns and villages, we only tested the accuracy of population simulation in 2015; the R value (0.85) and MRE (26.98%) confirmed that the adjusted VIIRS data were capable of effectively simulating spatial population patterns. We optimized the simulation method for mountainous areas based on previous research [
25], increasing the results’ accuracy by nearly 20%. We also introduced a feasible method for constructing long-term population spatial data, which is helpful for scientifically monitoring spatiotemporal trends in mountainous populations. In addition, the U.S. Department of Defense has developed the Landscan database using an innovative approach with Geographic Information Systems and Remote Sensing, which is the finest resolution global population distribution data available [
49]. In order to further verify our results, we also evaluated Landscan data using 2015 census data for 150 randomly selected villages and towns and the results showed that the R value and MRE were 0.78 and 35.7% respectively, which also proved the feasibility of our method.
It is worth mentioning that there are still some limitations in this study. First, although we were able to improve the accuracy of mountainous population spatial simulation through data processing, this method was unable to completely eliminate inherent defects in the DMSP-OLS data, such as light saturation in urban centers with high light intensity [
50] and insufficient detection capabilities in low-radiation areas such as rural areas [
33]. These flaws reduce the accuracy of population simulation to a certain extent. Second, the change of lighting technology (from sodium vapor to light-emitting diode) reduced NTL values in the city center [
51], which may have led to an underestimation of population simulation results. Third, the study was difficult to obtain the annual population distribution data and we only simulated the population distribution in the five periods of 2000, 2005, 2015 and 2018 due to limitation of data collection. Fourth, compared with DMSP-OLS data, NPP-VIIRS data have a higher spatiotemporal resolution. The advantages of the latter were not fully integrated into the long-term NTL dataset and further research is needed to improve the spatial resolution of NTL integration.
6. Conclusions
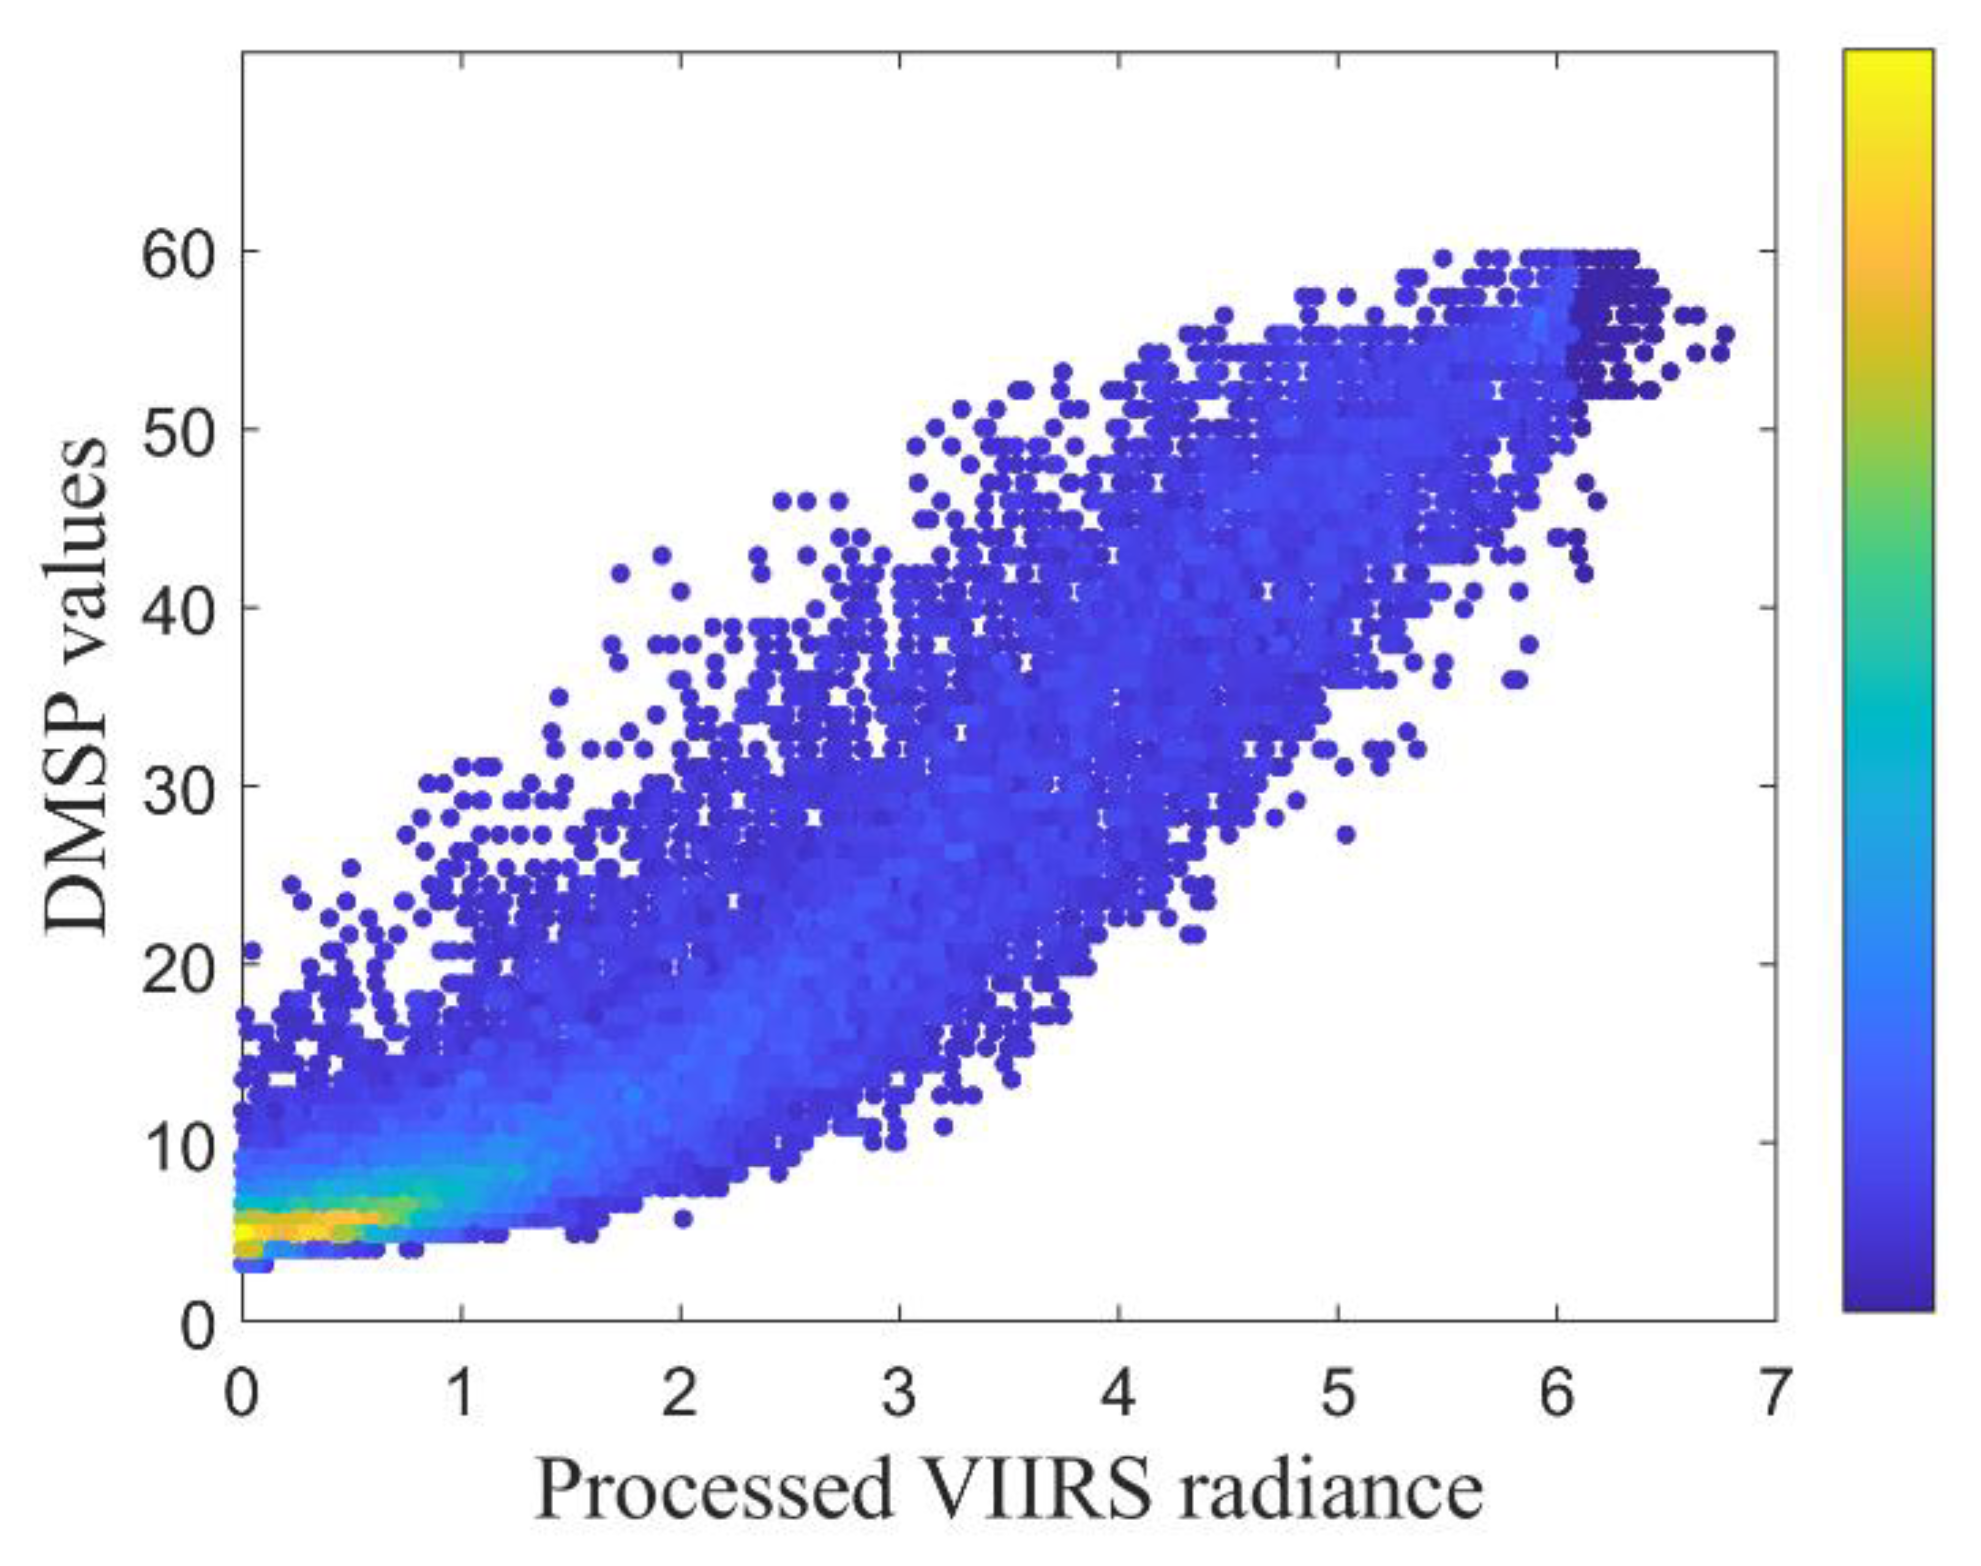
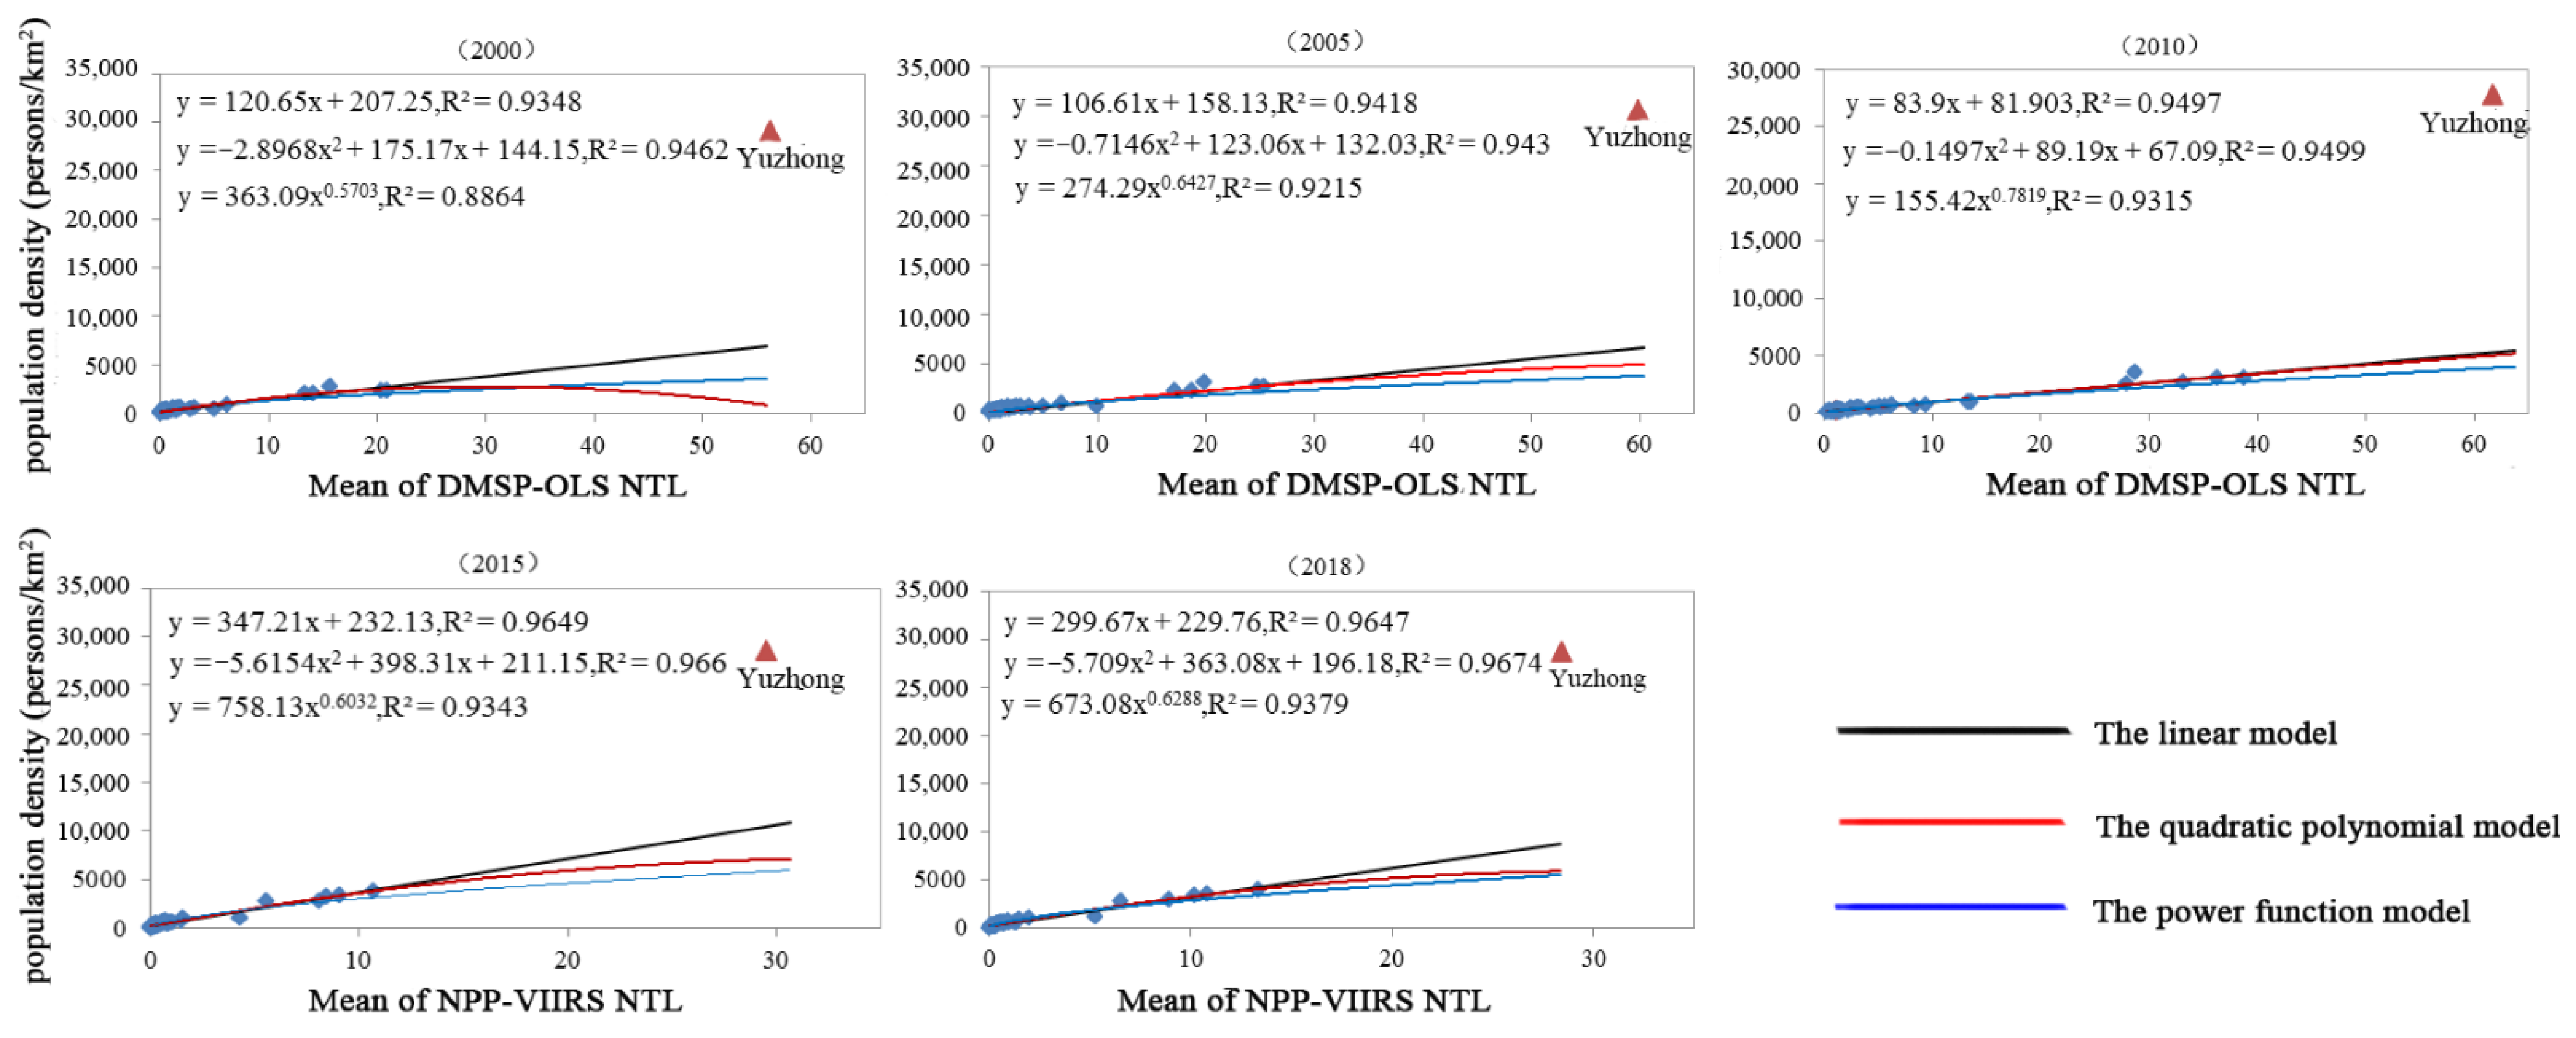
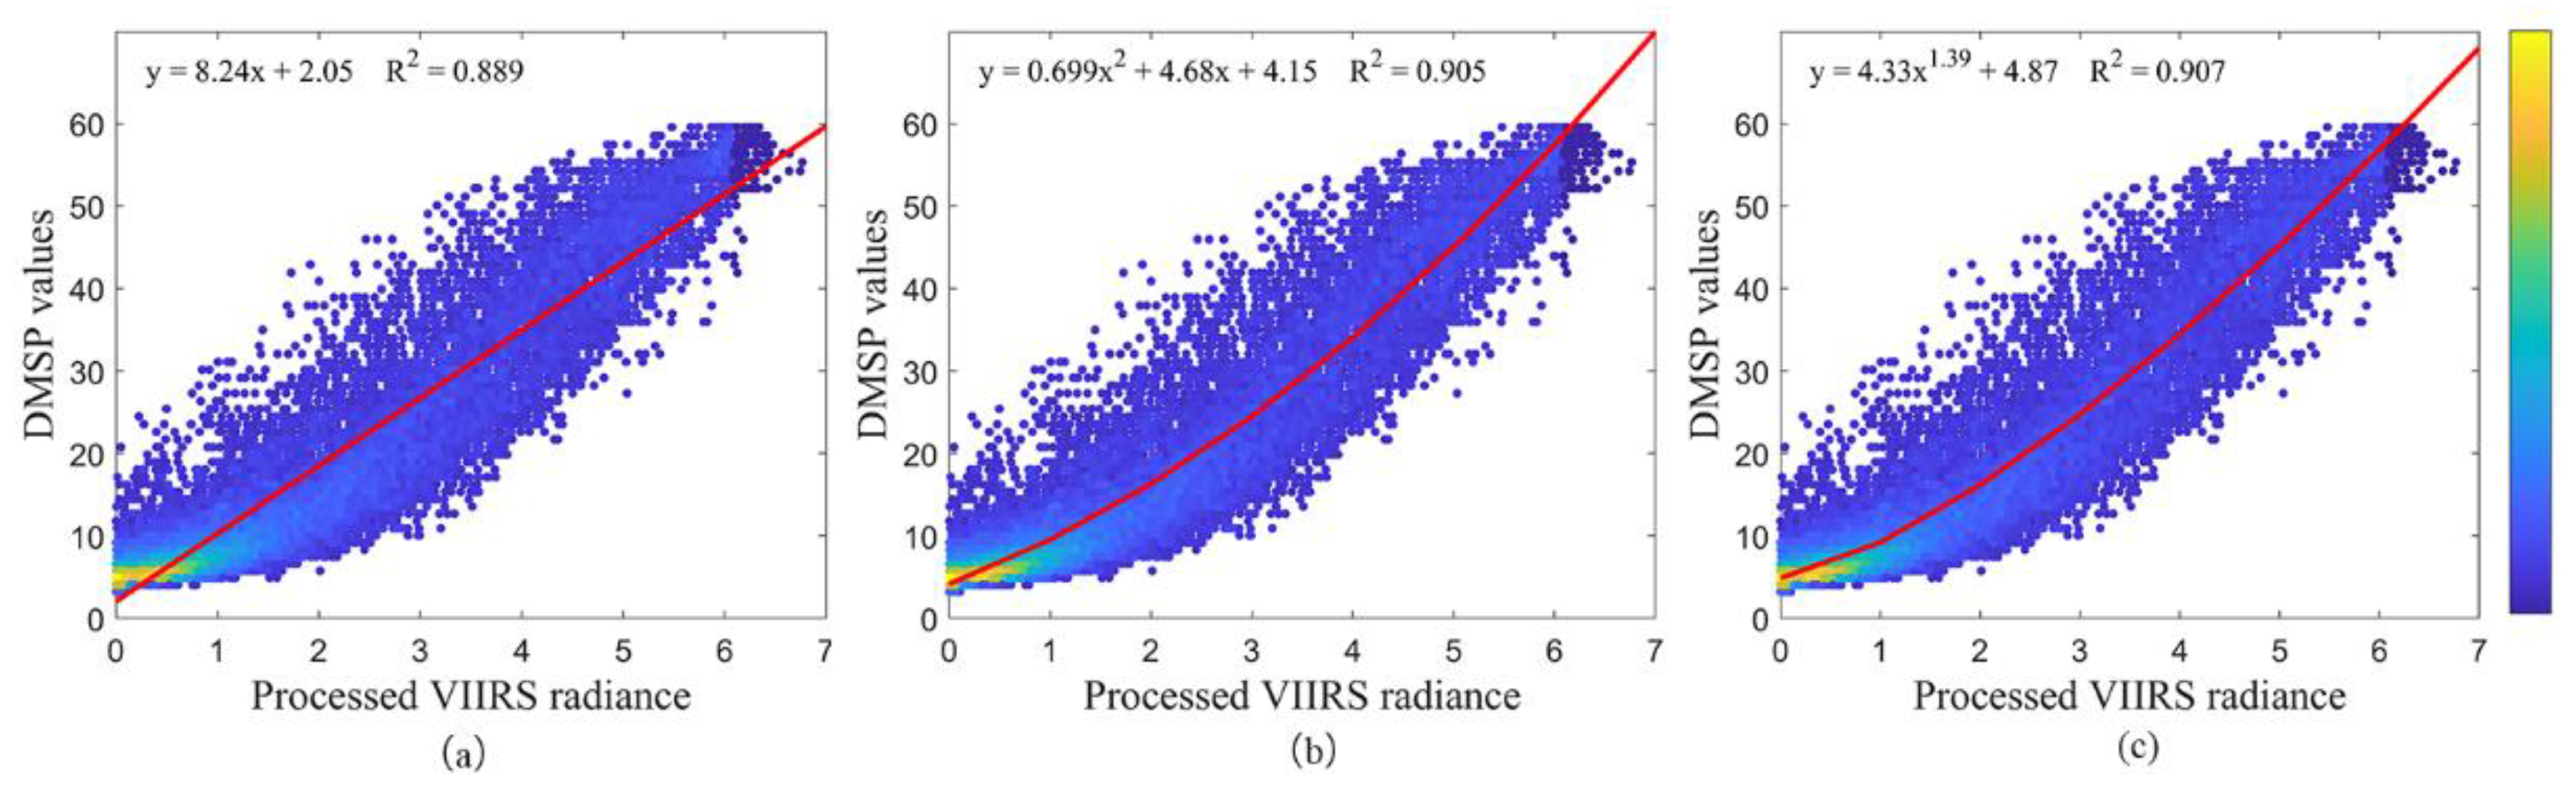
We integrated DMSP-OLS and NPP-VIIRS NTL data to construct a long-term NTL dataset, using the random-effect model with land-use data and corrected NTL data to model the spatiotemporal dynamics of the Chongqing’s population from 2000–2018. At the pixel level, there was a power function relationship between the two datasets (R2 = 0.907). Compared with an NTL integration model previously established at the provincial level, our model was 4.78% more accurate. In addition, accuracy tests using 2015 data resulted in an MRE of 26.98%, an improvement of nearly 20% when compared with previous studies of mountainous populations. Therefore, our approach is feasible and provides a technical method for monitoring spatiotemporal population changes in mountainous areas.
From 2000–2018, the spatial distribution of Chongqing’s population has increased in the west and decreased in the east, while also increasing in low-altitude areas and decreasing in the medium-high altitude areas. Moreover, population agglomeration was common. At the provincial level, high-density regions showed a significant increase, while decreasing in intermediate-density regions. The population density significantly increased in the central urban area and immediate surroundings in every district and county, while significantly decreased in non-urban areas, especially in the northeast.


 ,
, 


