Abstract
As humans continue to alter Earth systems, conservationists look to remote sensing to monitor, inventory, and understand ecosystems and ecosystem processes at large spatial scales. Multispectral remote sensing data are commonly integrated into conservation decision-making frameworks, yet imaging spectroscopy, or hyperspectral remote sensing, is underutilized in conservation. The high spectral resolution of imaging spectrometers captures the chemistry of Earth surfaces, whereas multispectral satellites indirectly represent such surfaces through band ratios. Here, we present case studies wherein imaging spectroscopy was used to inform and improve conservation decision-making and discuss potential future applications. These case studies include a broad array of conservation areas, including forest, dryland, and marine ecosystems, as well as urban applications and methane monitoring. Imaging spectroscopy technology is rapidly developing, especially with regard to satellite-based spectrometers. Improving on and expanding existing applications of imaging spectroscopy to conservation, developing imaging spectroscopy data products for use by other researchers and decision-makers, and pioneering novel uses of imaging spectroscopy will greatly expand the toolset for conservation decision-makers.
Keywords:
imaging spectroscopy; conservation; forest; coral reef; methane; urban; drylands; hyperspectral 1. Introduction
The Earth system is undergoing rapid change [1]. At the turn of the 21st century, 75% of ice-free terrestrial surfaces were used by humans in some fashion [2]. From 1982 to 2016, tropical regions experienced net forest loss. While temperate and boreal regions experienced net forest gains during the same period [3], many temperate forests have shifted in composition due to current and historic anthropogenic activities [4]. Remaining unaltered forest regions are highly fragmented and at risk of deforestation and degradation. Cropland expansion alone will remove an estimated 13.7% of the standing forest biomass and convert 3.8% of biodiversity hotspots by 2050 [5]. Marine regions are similarly affected. By 2070, over 70% of coral reefs will experience annual severe bleaching [6], and, in 2010, 10,000–40,000 tons of plastic floated in ocean surface waters [7]. Keystone species both on land and in the ocean are threatened by habitat loss and overharvesting. Exacerbating these direct anthropogenic impacts on ecosystems is human-induced climate change. Many human and natural communities are already experiencing the consequences of changing precipitation patterns and increasing temperatures, and these issues will continue to worsen if human action continues as usual. As rates of deforestation and carbon dioxide levels rise, decision-makers and conservationists look to science for solutions.
While nearly half of published conservation biology research has focused on documenting threats to biodiversity [8], an increasingly large subset of practitioners in this field is entrenched in conservation decision-making [9]. Remote sensing informs both of these communities and is used to document land-use/land-cover changes [10] that inform research and conservation decision-making [11,12,13]. The volume of remotely sensed data from commercial and governmental organizations allows Earth system monitoring at unprecedented spatiotemporal scales, yet many Earth system dimensions cannot be directly measured with multispectral satellites. Imaging spectroscopy offers a means to more directly measure many of these dimensions by filling in the gaps in the electromagnetic spectrum.
Imaging spectroscopy is a process of image formation from narrow wavelength intervals, referred to as channels. These channels are arranged in a way that captures a continuous portion of the electromagnetic spectrum from the visible (400 nm) to shortwave infrared (2500 nm), in contrast to other passive remote sensing platforms, such as Landsat and Sentinel-2, that have wide and spectrally discontinuous bands (Figure 1). Akin to laboratory spectroscopy, remote sensing based on imaging spectroscopy can directly measure Earth system characteristics such as vegetation canopy chemical traits, atmospheric methane, urban surface composition, and undersea coral reefs. These and other measurements or indicators from imaging spectroscopy, unlike multispectral imagery, are based on the molecular chemistry of Earth surfaces, which is becoming invaluable for conservation issues.
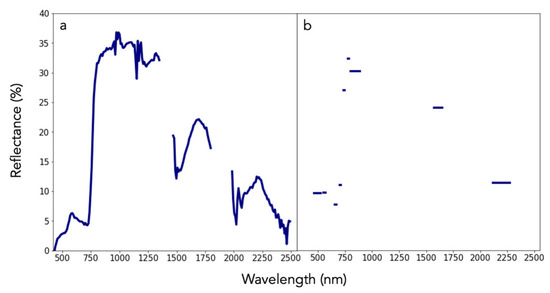
Figure 1.
Bottom-of-atmosphere reflectance spectra (400 to 2500 nm) from (a) the airborne visible/infrared imaging spectrometer (AVIRIS) and (b) Sentinel-2. While AVIRIS data represent 224 contiguous, equally sized bands (channels), Sentinel-2 data are discrete representations of the electromagnetic spectrum with variable bandwidths.
Imaging spectroscopy data are currently collected using aircraft, such as the Jet Propulsion Lab’s airborne visible/infrared imaging spectrometer (AVIRIS), the National Ecological Observatory Network (NEON)’s Airborne Observation Platform, and Arizona State University’s Global Airborne Observatory (GAO). Such data, however, are part of the next frontier in spaceborne Earth observations. To date, the only previous satellite-based imaging spectrometer for civil societal use was the Hyperion instrument onboard the National Aeronautics and Space Administration (NASA)’s Earth Observing-1 (EO-1) satellite. EO-1 was a technology demonstration and has been deorbited. However, newer and more advanced imaging spectrometers, such as AVIRIS and the GAO, are being redesigned for Earth orbit. Once achieved, spaceborne imaging spectroscopy will bring a wealth of data that expands the opportunities for actionable science, such as that directed to conservation solution spaces. Here we describe how imaging spectroscopy data have thus far been incorporated in conservation decision-making, illustrating new opportunities for future airborne and satellite-based data to be incorporated into decision-making frameworks.
2. Forests
2.1. Biodiversity
Humans have accelerated species extinction rates 1000 times over background rates of loss [14], an estimate projected to increase tenfold in the future [15]. With such rates making the earth more environmentally homogeneous, conservationists are racing to protect biodiversity. Protected areas serve as strongholds for biodiversity, and delineating new protected areas is an important conservation tool [16,17,18]. In some regions, protected areas have alleviated poverty [19]; however, in others, they have burdened local communities and resulted in competition for land and resources [20,21]. To achieve conservation goals, staffing and financial resources are necessary continued inputs [22], resulting in tradeoffs between the quantity of protected areas and the quality of their continued management. Protected areas have the potential to curtail extinction rates, but sparse resources and ecological–social tradeoffs necessitate careful consideration of protected area delineation.
Accurate, high-resolution spatially explicit biodiversity data are needed to empower conservation decisions and assess tradeoffs, but biodiversity is difficult to map and quantify. The spectral resolution of current satellite-based remote sensing platforms is too coarse to measure biodiversity directly, and data gaps in species trait measurements limit correlative models that upscale field-based biodiversity measurements to multispectral images [23].
Imaging spectroscopy offers the ability to measure biodiversity more directly at large spatial scales [24,25], and, as a result, these data have been used to inform conservation efforts to halt gold mining and delineate protected areas in the Peruvian Amazon. Across the entirety of the forested regions of Peru, the canopy chemical traits derived from imaging spectroscopy data were used to map 36 forest function classes [26]. Unique forest functional classes with high rates of forest conversion where intervention was most needed were identified. This map directly supported the decision to establish Yaguas National Park [27]. Furthermore, this mapping project highlighted the importance of indigenous lands, as compared to government-based protected area, in protecting the functional and biological diversity of Peruvian forests [28].
Capturing forest biodiversity using imaging spectroscopy takes advantage of the unique chemical and spectral fingerprints of canopy species. In humid tropical forests, leaf chemistry consistently shows greater interspecies than intraspecies variation, which provides the foundational signal relating species to chemistry to biodiversity [29]. Chemical bonds absorb, reflect, and refract light differently; thus, each molecule leaves a characteristic spectral signature [30], which can be captured across landscape scales with imaging spectroscopy. Species-specific leaf spectral fingerprints are largely a result of the leaf chemical composition and morphology [29], and, as the unit of measurement scales up from the leaf to the canopy, the canopy architecture and non-leaf structures contribute to the spectral signature. Supervised machine learning techniques have been used to map species in tropical [31] and temperate [32,33] forests, as well as discriminate genotypes in Populus tremuloides [34] using imaging spectroscopy. Yet, species mapping using supervised techniques is often not practical for diversity monitoring as it requires extensive fieldwork, especially in highly diverse regions. To circumvent this challenge, either the canopy chemical traits or the canopy spectral signature, derived from imaging spectroscopy data, can be clustered to reveal biodiversity patterns across the landscape (Figure 2) [35,36] in accordance with the spectral variation hypothesis. The spectral variation hypothesis states that spectral heterogeneity and species richness are positively correlated [37]. In practice, imaging spectroscopy has been used to map floristic gradients [38], plant composition [39], and species diversity [40] in a range of ecosystems using unsupervised learning, reducing the fieldwork necessary to map and monitor biodiversity. One unsupervised approach clusters overstory spectra into “spectral species” via k-means clustering [34]. When mapped over large regions, alpha, beta, and gamma biodiversity estimates from spectral species correlated with field-sampled biodiversity estimates [25,40]. Not only has this technology challenged theories of biodiversity developed at much smaller scales [41], but it also provides the data with which conservation tradeoffs can be assessed.
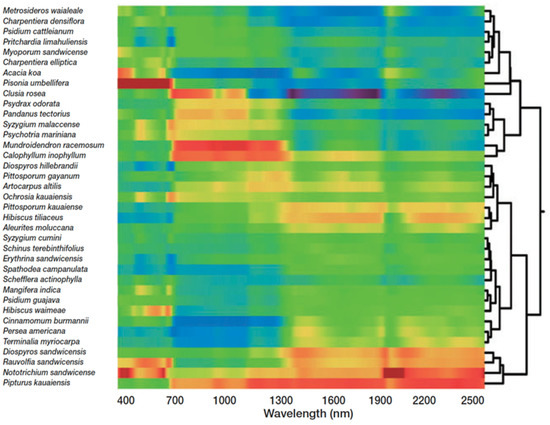
Figure 2.
A cluster analysis of the unique spectral signatures of rainforest species in the Hawaiian Islands. The colors represent spectral signatures or the reflected light of each species from 400 to 2500 nm. Yellows–reds and greens–blues show high and low reflectance, respectively [36].
Biodiversity metrics derived from imaging spectroscopy can be used to improve decision-making frameworks. Landscape-scale biodiversity estimates aid in assessing the efficacy of protected areas and biological corridors. Furthermore, these data improve our understanding of the effect of land-use change and edge effects on biodiversity. Another application of landscape-scale biodiversity estimates is balancing the tradeoffs between protecting areas for their biodiversity and for aboveground carbon biomass [42]. These tradeoffs using imaging spectroscopy and light detection and ranging (LiDAR), respectively, were assessed in Borneo [43], and the study is being expanded to Peru. Imaging spectroscopy-based biodiversity estimates are valuable for inventorying biodiversity and developing conservation decisions on the basis of an understanding of how that diversity varies across the landscape and for different management strategies.
As more data become available via spaceborne imaging spectroscopy, the temporal and spatial scales at which biodiversity can be monitored and studied will expand. Airborne imaging spectroscopy limits the timescale of analysis. While many Earth system processes directly measured using imaging spectroscopy have been upscaled to spaceborne multispectral satellites [44,45], continuous monitoring via imaging spectroscopy would provide more accurate assessments of conservation outcomes on biodiversity.
Monitoring is built into many conservation decision support frameworks [46] as it is important for improving existing management plans, adapting to evolving risk, and determining which decision framework will be most effective for other regions. Monitoring systems and global biodiversity mapping may not only identify protected areas that do not have adequate management and enforcement, but also contribute to tradeoff assessments between protected area expansion and increased enforcement [47]. By expanding our capacity to inventory and monitor forest biodiversity, imaging spectroscopy can help power conservation decision-making frameworks.
2.2. Forest Health
Worldwide forests are changing as stressors, such as drought and disease, alter the functioning of common and overstory species [48,49,50], and invasive species outcompete native species [51,52]. While preserving large tracts of intact forest can fortify forest communities to these stressors, additional intervention, such as prescribed fire, erecting fencing, and selective logging, is often necessary to ensure the health of forest communities. Yet, monitoring the vast tracts of forested land is time-consuming and burdensome, especially in difficult-to-access areas.
To monitor large, forested regions efficiently and to develop spatially explicit management decisions, forest managers are increasingly relying on remote sensing technologies. For example, LiDAR supports biomass estimates for carbon sequestration programs [53] and other routine forest monitoring efforts. Multispectral optical remote sensing from drones to satellites have been used to monitor deforestation and illegal logging and map and classify forests globally [11]. While remote sensing has long been a tool used by forest managers, imaging spectroscopy is less commonly used in forest health applications. Imaging spectroscopy complements other remote sensing technologies by providing more detailed information on forest health, such as tree pathogen detection, estimating nutrient status, monitoring drought impacts on tree water content, and mapping invasive species.
Tree pathogens and pests can be problematic when introduced from different regions of the world or when environmental or biological shifts increase the potency of pathogens and pests [50]. Monitoring and determining the source of the spread of pests and pathogens has resulted in successful campaigns to slow and contain their spread. In Hawai’i, imaging spectroscopy data have been used to detect and map a relatively new tree pathogen, Rapid Ohi’a Death (ROD) (Figure 3) [54]. ROD affects the vasculature of the native ohi’a (Metrosideros polymorpha), the most abundant tree across the Hawai’ian islands, and the spectral signature of infected ohi’a trees is consistently different than their healthy counterparts [55]. Other case studies using imaging spectroscopy to monitor tree health successfully identified declining floodplain eucalyptus trees [56] and basal stem rot in oil palm plantations [57].
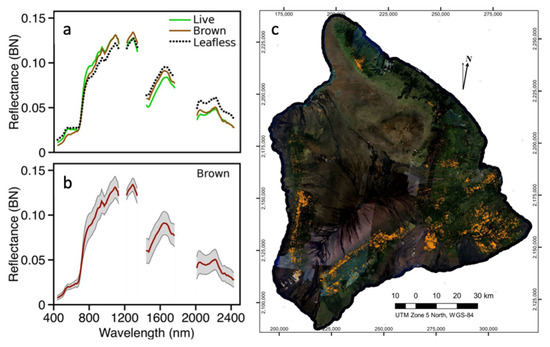
Figure 3.
In order to map and monitor Rapid Ohi’a Death (ROD) across the landscape, (a) the brightness-normalized mean spectra of live, brown, and leafless ohi’a trees were extracted from Global Airborne Observatory (GAO) data. (b) The mean and standard deviation spectra of brown (potential ROD infestations) ohi’a were used to (c) map and quantify brown ohi’a crowns [54].
In addition to mapping pathogen spread, imaging spectroscopy has been used to map invasive plants. Invasive plants outcompete native flora and can alter the biogeochemistry and/or disturbance regimes of a region, creating positive feedbacks that can result in monocultures of the invading plant [51]. Annually, invasive species cost the United States an estimated $120 billion [52]. Identifying regions where invasive species establish in order to remove the invading plants and prevent their spread is a means of containing these plants and curbing their competitive advantage over native species. Imaging spectroscopy has been used to locate regions where invasive grasses [58,59], wetland species [60], and trees [61] have established. Furthermore, in Hawai’i, highly invasive tree species were separable spectrally from native species [61], which would allow for more effective monitoring of invasive trees across the state.
Compounding many of the challenges driven by disease, pests, and invasive plants is drought. Drought is a major concern globally, especially as climate change [1] and land-use change [62,63,64] continue to alter hydrologic cycles. Forest cover both influences [63,64,65] and is influenced by [48,49] water availability. Imaging spectroscopy can link leaf-level biogeochemical responses to drought to whole canopies [66] at landscape scales [45,67] and in urban environments [68]. During periods of drought, canopy water content is predictive of tree mortality [45], and the spatial distribution of trees with low canopy water content can inform management solutions [66]. Canopy water content can also help managers predict wildfire, and the potential for both airborne and spaceborne imaging spectrometers to estimate fuel moisture has been demonstrated in California [69]. Estimating canopy water content using imaging spectroscopy is more accurate than using multispectral satellites [70]. In urban environments, these data can inform optimal watering schedules that conserve water and promote tree growth [68]. At the landscape scale, monitoring canopy water content can improve the modeling and assessment of forest carbon dynamics, wildfire risk, forest susceptibility to bark beetle mortality, and long-term forest cover shifts [67].
Imaging spectroscopy can provide valuable baselines for forest health metrics, especially when it is available for large areas of diverse landscapes with strong temporal regularity. Both spectroscopy measurements collected in the field and airborne imaging spectroscopy have been used to train algorithms that detect invasive grasses [44] and estimate canopy water content [45], respectively, in Landsat imagery. While the Landsat data provided greater spatial coverage, these data were less accurate than the imaging spectroscopy data. Furthermore, most of the abovementioned studies wherein imaging spectroscopy was used to measure and understand forest stressors and dynamics have not yet been expanded across many landscapes or extended time periods so as to be incorporated into routine forest health monitoring.
Spaceborne imaging spectroscopy data will allow for the early detection and mapping of forest pests, pathogens, and invasive plants, as well as stressors such as drought. This technology will expand the ability to monitor forest health, as field sampling is time-consuming and expensive. Furthermore, repeated data acquisitions will allow for phenological considerations, improving classification accuracy and the understanding of temporal patterns, as demonstrated on invasive species in Hawai’i using EO-1 Hyperion [71]. Beyond routine monitoring, the expansion of these data will allow researchers to study the biogeochemical changes and mechanisms for invasion associated with invasive species, as demonstrated on Myrica faya in Hawai’i [72,73]. The forest health metric maps and advances in understanding the biogeochemistry of forest health can be used to inform forest health models, predicting the rate and direction of disease or invasive species spread or assessing fire risk. The incorporation of imaging spectroscopy in monitoring and managing forest health can complement existing remote sensing technologies by providing a biochemical basis for understanding forest dynamics.
3. Drylands
Dryland ecosystems cover nearly half of the global land area [74], and approximately three billion people, or nearly 40% of the global population, live in dryland ecosystems [75]. Many communities that rely on drylands are marginalized and impoverished [76], and current social structures leave disadvantaged populations, such as women, less resilient to the consequences of arid landscapes [77]. Desertification causes a net expansion of bare soil and a decline in vegetation globally, in part due to agriculture practices and rainfall reductions [3]. While much work has been done to measure and predict these processes, there is no universal means of quantifying desertification, and attributing causal factors to the drying of these regions varies on the basis of social context and regional feedback mechanisms [76].
In drylands, both the vegetation and the soil can be studied using imaging spectroscopy. Efforts to monitor desertification in drylands using multispectral remote sensing often rely on the normalized difference vegetation index (NDVI), but the NDVI is largely driven by precipitation trends and does not account for vegetation composition change [76]. The high spectral resolution of imaging spectroscopy can capture vegetation composition change, and a prior study used imaging spectroscopy to quantify these changes to examine the effect of grazing on desertification [78]. Imaging spectroscopy has also been used to characterize how foliar nitrogen content varies with water availability across space [79] and to identify invasive plants in dryland ecosystems [58]. In drylands with bare ground, surface minerology can be mapped. Soil organic carbon [80], cation exchange capacity [81], and salinity [82] are a few examples of soil properties that have been measured using airborne imaging spectroscopy. In India, EO-1 Hyperion imaging spectroscopy data were used to map soil sand, clay, and organic matter with the intent of monitoring desertification over time (Figure 4) [83].
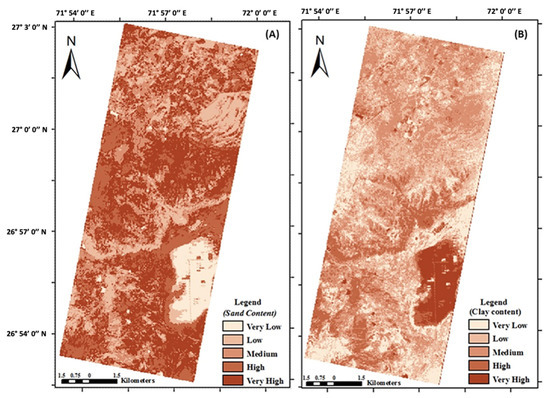
Figure 4.
Soil (a) sand and (b) clay content in northwestern India as estimated from Earth Observing-1 (EO-1) Hyperion. These spatial data demonstrate the potential for dryland soil monitoring over time using spaceborne imaging spectrometers [83].
Quantifying and identifying the drivers of desertification are challenging problems that have not been resolved [76]. The process of dryland degradation is multifaceted, and, as attempts to quantify desertification often use only one metric, there is no universal means of measuring the many forms of desertification [76]. Furthermore, drivers of desertification are related to both biophysical processes and local social and political factors; thus, disentangling the causal factors and feedback mechanisms behind desertification is often complex and region-specific. While case studies have demonstrated the proof of concept in mapping vegetation composition and soil characteristics using imaging spectroscopy, attempts to study vegetation–soil feedbacks or the process of desertification are largely lacking.
Imaging spectroscopy data can help address unanswered questions in dryland research. For example, NASA’s Earth Surface Mineral Dust Source Investigation (EMIT), scheduled to launch in 2022, will map surface mineral composition and investigate dust sources [84]. These data will provide a baseline of surface minerology and inform models investigating the role of aerosols in driving precipitation, allowing researchers to tackle climate feedback mechanisms and better predict precipitation patterns. Other potential applications of spaceborne imaging spectroscopy data include routine monitoring of vegetation composition shifts and invasive species. By combining vegetation and soil information derived from imaging spectroscopy data, landscape-level biophysical changes associated with desertification can be studied and linked to regional land management decisions and social contexts. Imaging spectroscopy can contribute much to the monitoring, studying, and predicting of desertification and management of dryland ecosystems in the face of climate change and continued human use of these ecosystems.
4. Urban
Fifty-five percent of the global population lives in urban areas, and 2.5 billion more people are expected to reside in urban areas by 2050. Balancing the growth of cities with environmental sustainability is a challenge faced by city governments globally, especially as urban growth exacerbates health-related environmental issues, such as the heat island effect, air pollution, and access to green spaces. Furthermore, communities of low socioeconomic status tend to be disproportionately burdened by the negative effects associated with poor air quality and heat [85,86]. For example, minority and impoverished neighborhoods in southern California were exposed to higher traffic density, placing residents at greater risk of exposure to vehicle-related air pollutants [87].
Governments at all levels are working to reform cities to be more equitable and sustainable through policy changes and green initiatives. Over 160 cities across the world have committed to 100% renewable energy by 2050 [88], and 35 cities have united to reduce particulate matter (PM)2.5 levels [89], an air pollutant associated with many health disorders that can lead to mortality. City governments attempt to cool cities by planting trees, erecting shade structures, and developing green and white roof initiatives. Land surface temperature, PM2.5 estimates, and NDVI derived from multispectral satellites are commonly used to assess health-related environmental issues, and these data are often integrated with census data to evaluate environmental injustices within cities. While these data provide a coarse representation of the city landscape, they could be refined using imaging spectroscopy data. Imaging spectroscopy can provide information on the surface material of cities which can inform urban process models, such as heat, groundwater recharge, and air purification [90,91]. Furthermore, urban canopy characteristics have been mapped [92] and urban tree health has been assessed [93] using imaging spectroscopy. Cities located in dryer regions need to balance water use and heat reduction. Imaging spectroscopy data collected over Los Angeles, California, revealed that watering trees in the early morning to reduce water loss resulted in water-stressed trees by midday [68]. Imaging spectroscopy data can improve the understanding of urban biophysical processes.
Imaging spectroscopy is underutilized by urban decision-makers, yet information gained by integrating imaging spectroscopy into urban research and decision-making processes can aid city governments in their efforts to improve the livelihood of their citizens. Potential future applications of these data include incorporating surface material information derived from imaging spectroscopy into urban process models to better understand the impact of different materials on the urban heat island effect. Another potential application is the creation of databases, developed and maintained using imaging spectroscopy data, specifying the location, species, and health of trees within the city. As the world becomes more urban, it will become increasingly important to address environmental challenges facing the urban environment, and imaging spectroscopy is one tool in understanding these challenges.
5. Marine
Oceans support and sustain life via climate regulation, via oxygen production, and as a food source, but they face many anthropogenic threats. Over 75% of coral reefs globally are threatened by direct (e.g., overfishing, pollution, coastal development) and/or indirect (rising sea temperatures and levels) human activities [94]. In the absence of management, the ecosystem services provided by reefs such as tourism, fish, and shoreline protection will continue to decline [95]. The information available to manage and monitor reefs is limited by the time and expense of diver-based field work, and the low spectral resolution of multispectral satellites restricts reef mapping to shallower depths with less detail. These challenges in mapping coral reefs leave many governments and conservation organizations with limited and/or outdated reef maps.
Marine protected areas (MPAs) are often established to protect reef ecosystems, but not all MPAs are equally effective [22]. Prioritizing continued support for MPAs, designating new MPAs, and managing reefs require accurate spatial and temporal information. Yet, only a fraction of the photons available in terrestrial environments are available to resolve benthic (seafloor) characteristics due to light attenuation by the water column. Large portions of the electromagnetic spectrum are absorbed by water and cannot be used for marine applications. Imaging spectroscopy increases the spectral resolution of the green and blue regions of the electromagnetic spectrum, improving the resolution of benthic features, including coral reefs [96,97]. In 2018, coral reefs in the Southeast Marine Sanctuary in the Dominican Republic were mapped using imaging spectroscopy data. This Sanctuary was established in response to the pressures of tourism on the reefs, and, as the Sanctuary is being expanded, these spatial reef data are being used to aid in the spatial planning of the Sanctuary expansion [98]. In addition to coral reef extent maps (Figure 5), spatial data of reef habitat complexity [96] and progressive reef degradation [99] have been successfully created using airborne imaging spectroscopy data.
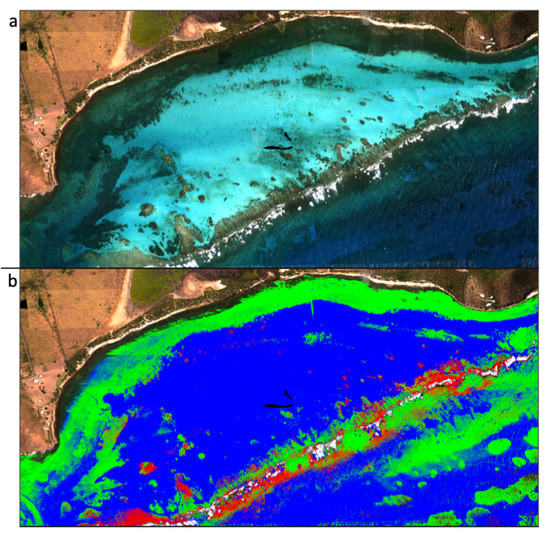
Figure 5.
(a) True color composite and (b) classification of live coral (red) and algae (green) developed from imaging spectroscopy data. Images courtesy of Global Airborne Observatory, Arizona State University.
Marine imaging spectroscopy has the potential to support marine conservation beyond coral reef mapping. Currently, much of marine imaging spectroscopy has focused on mapping benthic characteristics, such as the location of live corals. While live coral maps developed from imaging spectroscopy provide baseline data, insufficient temporal data limit the ability to assess management decisions on reefs or monitor the impact of bleaching events. As marine imaging spectroscopy advances, process-level information may be gained from these data.
Expanding the spatial and temporal extent of imaging spectroscopy is also useful for reef-to-ridge applications. Terrestrial processes affect the marine environment and vice versa, and there is a need to understand and develop conservation decisions on the basis of the bidirectional interactions between terrestrial and marine environments [100]. Integrating terrestrial and marine research via imaging spectroscopy is a gap in existing research. Beyond coral reef mapping and monitoring, spaceborne imaging spectroscopy will be an important addition to the ocean remote sensing toolset as it will expand the opportunities for monitoring and studying ocean ecosystems and pollution. Case studies have demonstrated the ability of imaging spectroscopy to monitor red tides [101] and ocean plastics [102], as well as map oil spills [103,104]. Furthermore, the potential of spaceborne imaging spectroscopy to monitor marine environments has been confirmed for kelp forests [105]. Imaging spectroscopy applications in marine environments are in their infancy compared to terrestrial applications, but there exists a lot of potential to map, monitor, and study ocean pollutants and environments.
6. Methane
From inducing phenological shifts to altering species biogeography, climate change threatens many biological systems. Sea level rise will drown some regions, while drought will leave others parched. Conservation decisions must not only account for direct threats to biodiversity and land change, but it must also account for the indirect consequences of rising levels of atmospheric carbon. The criticality of carbon dioxide emissions for climate change notwithstanding, attention to the suite of greenhouse gasses demands attention. Methane has over 20 times the global warming potential of carbon dioxide [106] and can be geolocated and quantified using imaging spectroscopy [107,108,109,110]. Methane can be detected in the thermal-infrared, mid-infrared, and shortwave infrared (SWIR) (1400–2500 nm) regions of the electromagnetic spectrum. Spaceborne thermal-infrared and imaging spectroscopy sensors can detect methane at kilometer scales, but these sensors are too coarse to detect point-source emission. The Scanning Imaging Absorption Spectrometer for Atmospheric Chartography (SCIAMACHY), a NASA spaceborne SWIR sensor, was able to identify abnormally high methane levels in the San Juan Basin located in the four corners region of the United States [111]; however, prior to the NASA AVIRIS-NG campaign, the source of the methane was unconfirmed.
AVIRIS-NG detected and geolocated 0.23–0.39 Tg/year of methane emissions from leaking storage units and pipelines, coal mine vents, and natural seeps in the San Juan Basin, all of which were reported to state authorities [109]. The Environmental Defense Fund featured the imaging spectroscopy results as evidence for the necessity of strengthened methane regulations in a recent report [112], and this organization has a representative on the New Mexico Methane Advisory Panel. The Panel released a technical report [113] that will inform the forthcoming methane legislature in the state. SCIAMACHY and AVIRIS-NG inspired recent and forthcoming methane regulations that protect public health and reduce carbon emissions.
Strict methane regulations alone do not ensure reduced methane emission [114]. Monitoring challenges, such as undetected leaks, technological and economic barriers, and incentives to underestimate self-reported data, among others, introduce enforcement challenges. In 2017, the California Air Resources Board responded to relaxed federal methane regulations by adopting state-level regulations, but these regulations hinge on self-reported data [115]. The cap-and-trade program likewise relies on self-reporting. The cap-and-trade program, adopted by 12 states including California, is a market-based approach to limit the total greenhouse gas emissions in participating states by placing a cap on emissions. These programs hinge on monitoring, and imaging spectroscopy offers a means of objectively monitoring point-source methane.
The California Methane Survey [110], developed in partnership with the California Air Resources Board, retrieved 2016 to 2017 point-source methane emissions from AVIRIS-NG, the results of which are publicly available via an interactive methane map (Figure 6) [107]. This survey identified the top methane emitters in California, and these super-emitters accounted for 60% of the point-source methane detected in the state while comprising only 10% of the sources. Industrial sectors were ranked according to their relative contribution of point-source methane, confirming speculations that waste management was the top methane emitter in the state; prior to this survey, sufficient data to understand methane emission were lacking. Dairy and concentrated animal feeding operations emissions are not available from the Environmental Protection Agency, yet the California Methane Survey identified this sector as the second-largest point-source methane emission in California. Interestingly but perhaps not surprisingly, this survey indicated that the self-reporting led to significant underestimates of methane emissions [110]. While the abovementioned recent advances in imaging spectroscopy have fueled stricter policies regarding and improved regulation of point-source methane emissions in the United States, the second-largest emitter of greenhouse gasses globally [116], continuous monitoring across the United States and other high methane-emitting regions could result in further policy reform and overall reduced methane emissions.
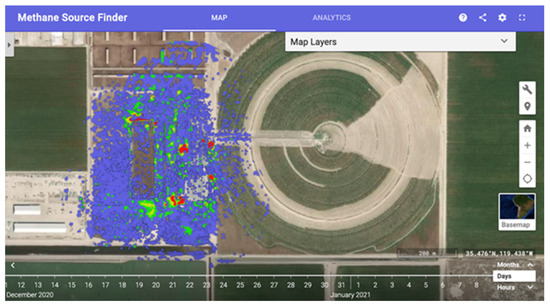
Figure 6.
Methane Source Finder: An interactive map of methane data in California developed from AVIRIS imaging spectroscopy data [107].
While precise methane geolocation and quantification via imaging spectroscopy are restricted to airborne campaigns, simulations of satellite methane detection indicate that the next generation of satellite imaging spectrometers will be able to monitor point-source methane emissions [106]. These data will not only allow better monitoring for regulating point-source emissions, but they also have the potential to refine the global methane budget. Continuous monitoring will allow both anthropogenic and natural sources of methane to be tracked over time. Natural methane sources, such as those from wetlands in Alaska, have been mapped by AVIRIS-NG [117], but melting permafrost will continue to accelerate methane release [118]. Imaging spectroscopy is a means to track and quantify the global methane budget, as well as monitor and regulate anthropogenic emissions.
7. Conclusions
Imaging spectroscopy is a powerful tool that can aid in conservation decision-making. These data can be applied to diverse ecosystems, such as forests, oceans, drylands, and urban areas, as well as detecting greenhouse gasses in the atmosphere. Imaging spectroscopy can provide information beyond traditional multispectral remote sensing instruments because it directly measures the chemistry of Earth surfaces. Measuring this chemistry allows conservationists and land managers to incorporate biodiversity metrics, processes such a canopy health decline, and more accurate maps, such as those of live coral reefs, into their decision-making frameworks. Furthermore, these data are not bounded to one ecosystem; connections between ecosystems such as reef to ridge or urban–forest interfaces can be investigated.
While more research into inter- and intra-ecosystem processes can help inform conservation decision-making, there is also a need to develop products from imaging spectroscopy data to bridge the gap between the researchers and decision-makers. The computational requirements of imaging spectroscopy data and required domain-specific knowledge in working with these data can be a barrier to organizations, governments, and individuals that could benefit from these data. Thus, collaborations between imaging spectroscopy researchers and decision-makers would address and reduce these barriers.
As imaging spectroscopy data become more widely available through the launch of spaceborne imaging spectroscopy sensors, the potential for continuous monitoring of biochemical processes will greatly expand. In recent years, numerous spaceborne imaging spectroscopy missions were launched, and more are in development. In 2018 and 2020, two imaging spectrometers, DESIS (German Aerospace Center Earth Sensing Imaging Spectrometer) [119] and HISUI (Hyperspectral Imager Suite) [120], respectively, launched. While these initial missions are important stepping stones, global monitoring via these instruments is not possible as both sensors orbit on the International Space Station (ISS), which does not provide global coverage. The Italian Space Agency launched PRISMA (Hyperspectral Precursor of the Application Mission) in 2019, and, while it is not bound to the ISS, the primary focus of PRISMA is monitoring and managing land degradation, agricultural, and natural hazards in the Euro-Mediterranean Regions [121]. As of 2020, global spaceborne hyperspectral missions such as SBG (Surface Biology and Geology) [122] and CHIME (Copernicus Hyperspectral Imaging Mission for the Environment), [123] have been proposed. While the usefulness of airborne imaging spectroscopy in conservation decision-making has been demonstrated through the many case studies presented here, this new wave of information can expand the use of these data in the conservation realm across space and time.
Author Contributions
M.S. developed the manuscript with support from G.P.A. All authors have read and agreed to the published version of the manuscript.
Funding
This study was supported by the NASA Strategic University Research Partnership (SURP) program.
Institutional Review Board Statement
Not applicable.
Informed Consent Statement
Not applicable.
Data Availability Statement
Data sharing not applicable.
Acknowledgments
We thank Billie L. Turner II for his expertise and comments on the manuscript.
Conflicts of Interest
The authors declare no conflict of interest.
References
- Pachauri, R.K.; Allen, M.R.; Barros, V.R.; Broome, J.; Cramer, W.; Christ, R.; Church, J.A.; Clarke, L.; Dahe, Q.; Dasgupta, P.; et al. Climate Change 2014: Synthesis Report. Contribution of Working Groups I, II and III to the Fifth Assessment Report of the Intergovernmental Panel on Climate Change; Pachauri, R.K., Meyer, L., Eds.; IPCC: Geneva, Switzerland, 2014; p. 151.
- Ellis, E.C.; Goldewijk, K.K.; Siebert, S.; Lightman, D.; Ramankutty, N. Anthropogenic Transformation of the Biomes, 1700 to 2000. Glob. Ecol. Biogeogr. 2010, 19, 589–606. [Google Scholar] [CrossRef]
- Song, X.-P.; Hansen, M.C.; Stehman, S.V.; Potapov, P.V.; Tyukavina, A.; Vermote, E.F.; Townshend, J.R. Global Land Change from 1982 to 2016. Nature 2018, 560, 639–643. [Google Scholar] [CrossRef]
- Millar, C.I.; Stephenson, N.L. Temperate Forest Health in an Era of Emerging Megadisturbance. Science 2015, 349, 823–826. [Google Scholar] [CrossRef]
- Molotoks, A.; Stehfest, E.; Doelman, J.; Albanito, F.; Fitton, N.; Dawson, T.P.; Smith, P. Global Projections of Future Cropland Expansion to 2050 and Direct Impacts on Biodiversity and Carbon Storage. Glob. Chang. Biol. 2018, 24, 5895–5908. [Google Scholar] [CrossRef]
- Van Hooidonk, R.; Maynard, J.; Tamelander, J.; Gove, J.; Ahmadia, G.; Raymundo, L.; Williams, G.; Heron, S.F.; Planes, S. Local-Scale Projections of Coral Reef Futures and Implications of the Paris Agreement. Sci. Rep. 2016, 6, 39666. [Google Scholar] [CrossRef]
- Cózar, A.; Echevarría, F.; González-Gordillo, J.I.; Irigoien, X.; Úbeda, B.; Hernández-León, S.; Palma, Á.T.; Navarro, S.; García-de-Lomas, J.; Ruiz, A.; et al. Plastic Debris in the Open Ocean. Proc. Natl. Acad. Sci. USA 2014, 111, 10239–10244. [Google Scholar] [CrossRef]
- Fazey, I.; Fischer, J.; Lindenmayer, D.B. What Do Conservation Biologists Publish? Biol. Conserv. 2005, 124, 63–73. [Google Scholar] [CrossRef]
- Bolam, F.C.; Grainger, M.J.; Mengersen, K.L.; Stewart, G.B.; Sutherland, W.J.; Runge, M.C.; McGowan, P.J.K. Using the Value of Information to Improve Conservation Decision Making. Biol. Rev. 2019, 94, 629–647. [Google Scholar] [CrossRef]
- Verburg, P.H.; Crossman, N.; Ellis, E.C.; Heinimann, A.; Hostert, P.; Mertz, O.; Nagendra, H.; Sikor, T.; Erb, K.-H.; Golubiewski, N.; et al. Land System Science and Sustainable Development of the Earth System: A Global Land Project Perspective. Anthropocene 2015, 12, 29–41. [Google Scholar] [CrossRef]
- Nagendra, H.; Lucas, R.; Honrado, J.P.; Jongman, R.H.G.; Tarantino, C.; Adamo, M.; Mairota, P. Remote Sensing for Conservation Monitoring: Assessing Protected Areas, Habitat Extent, Habitat Condition, Species Diversity, and Threats. Ecol. Indic. 2013, 33, 45–59. [Google Scholar] [CrossRef]
- Turner, W.; Spector, S.; Gardiner, N.; Fladeland, M.; Sterling, E.; Steininger, M. Remote Sensing for Biodiversity Science and Conservation. Trends Ecol. Evol. 2003, 18, 306–314. [Google Scholar] [CrossRef]
- Pettorelli, N.; Safi, K.; Turner, W. Satellite Remote Sensing, Biodiversity Research and Conservation of the Future. Philos. Trans. R. Soc. B Biol. Sci. 2014, 369, 20130190. [Google Scholar] [CrossRef]
- Andermann, T.; Faurby, S.; Antonelli, A.; Gimbdal, A.; Turvey, S.T.; Silvestro, D. Estimation of Past Extinction Rates to Predict Future Diversity Loss. EGUGA 2018, 20, 19480. [Google Scholar]
- De Vos, J.M.; Joppa, L.N.; Gittleman, J.L.; Stephens, P.R.; Pimm, S.L. Estimating the Normal Background Rate of Species Extinction. Conserv. Biol. J. Soc. Conserv. Biol. 2015, 29, 452–462. [Google Scholar] [CrossRef]
- Wilson, E.O. Half-Earth: Our Planet’s Fight for Life; Norton & Company: New York, NY, USA, 2016. [Google Scholar]
- Dinerstein, E.; Vynne, C.; Sala, E.; Joshi, A.R.; Fernando, S.; Lovejoy, T.E.; Mayorga, J.; Olson, D.; Asner, G.P.; Baillie, J.E.M.; et al. A Global Deal For Nature: Guiding Principles, Milestones, and Targets. Sci. Adv. 2019, 5, eaaw2869. [Google Scholar] [CrossRef]
- SCBD. COP-10 Decision X/2. Secretariat of the Convention on Biological Diversity. Available online: https://www.cbd.int/decision/cop/?id=12268 (accessed on 7 October 2020).
- Ferraro, P.J.; Hanauer, M.M.; Sims, K.R.E. Conditions Associated with Protected Area Success in Conservation and Poverty Reduction. Proc. Natl. Acad. Sci. USA 2011, 108, 13913–13918. [Google Scholar] [CrossRef]
- Norton-Griffiths, M.; Southey, C. The Opportunity Costs of Biodiversity Conservation in Kenya. Ecol. Econ. 1995, 12, 125–139. [Google Scholar] [CrossRef]
- Geisler, C.; Sousa, R.D. From Refuge to Refugee: The African Case. Public Adm. Dev. 2001, 21, 159–170. [Google Scholar] [CrossRef]
- Gill, D.A.; Mascia, M.B.; Ahmadia, G.N.; Glew, L.; Lester, S.E.; Barnes, M.; Craigie, I.; Darling, E.S.; Free, C.M.; Geldmann, J.; et al. Capacity Shortfalls Hinder the Performance of Marine Protected Areas Globally. Nature 2017, 543, 665–669. [Google Scholar] [CrossRef]
- Jetz, W.; Cavender-Bares, J.; Pavlick, R.; Schimel, D.; Davis, F.W.; Asner, G.P.; Guralnick, R.; Kattge, J.; Latimer, A.M.; Moorcroft, P.; et al. Monitoring Plant Functional Diversity from Space. Nat. Plants 2016, 2, 1–5. [Google Scholar] [CrossRef]
- Laliberté, E.; Schweiger, A.K.; Legendre, P. Partitioning Plant Spectral Diversity into Alpha and Beta Components. Ecol. Lett. 2020, 23, 370–380. [Google Scholar] [CrossRef]
- Carlson, K.M.; Asner, G.P.; Hughes, R.F.; Ostertag, R.; Martin, R.E. Hyperspectral Remote Sensing of Canopy Biodiversity in Hawaiian Lowland Rainforests. Ecosystems 2007, 10, 536–549. [Google Scholar] [CrossRef]
- Asner, G.P.; Martin, R.E.; Knapp, D.E.; Tupayachi, R.; Anderson, C.B.; Sinca, F.; Vaughn, N.R.; Llactayo, W. Airborne Laser-Guided Imaging Spectroscopy to Map Forest Trait Diversity and Guide Conservation. Science 2017, 355, 385–389. [Google Scholar] [CrossRef]
- Klein, J. Peru Moves to Protect “One of the Last Great Intact Forests.”. Available online: https://www.nytimes.com/2018/02/14/science/peru-yaguas-national-park.html (accessed on 13 October 2020).
- Asner, G.P.; Martin, R.E.; Tupayachi, R.; Llactayo, W. Conservation Assessment of the Peruvian Andes and Amazon Based on Mapped Forest Functional Diversity. Biol. Conserv. 2017, 210, 80–88. [Google Scholar] [CrossRef]
- Asner, G.P.; Martin, R.E. Spectral and Chemical Analysis of Tropical Forests: Scaling from Leaf to Canopy Levels. Remote Sens. Environ. 2008, 112, 3958–3970. [Google Scholar] [CrossRef]
- Ustin, S.L.; Roberts, D.A.; Gamon, J.A.; Asner, G.P.; Green, R.O. Using Imaging Spectroscopy to Study Ecosystem Processes and Properties. BioScience 2004, 54, 523–534. [Google Scholar] [CrossRef]
- Clark, M.L.; Roberts, D.A.; Clark, D.B. Hyperspectral Discrimination of Tropical Rain Forest Tree Species at Leaf to Crown Scales. Remote Sens. Environ. 2005, 96, 375–398. [Google Scholar] [CrossRef]
- Torabzadeh, H.; Leiterer, R.; Hueni, A.; Schaepman, M.E.; Morsdorf, F. Tree Species Classification in a Temperate Mixed Forest Using a Combination of Imaging Spectroscopy and Airborne Laser Scanning. Agric. For. Meteorol. 2019, 279, 107744. [Google Scholar] [CrossRef]
- Roth, K.L.; Roberts, D.A.; Dennison, P.E.; Alonzo, M.; Peterson, S.H.; Beland, M. Differentiating Plant Species within and across Diverse Ecosystems with Imaging Spectroscopy. Remote Sens. Environ. 2015, 167, 135–151. [Google Scholar] [CrossRef]
- Madritch, M.D.; Kingdon, C.C.; Singh, A.; Mock, K.E.; Lindroth, R.L.; Townsend, P.A. Imaging Spectroscopy Links Aspen Genotype with Below-Ground Processes at Landscape Scales. Philos. Trans. R. Soc. Lond. B Biol. Sci. 2014, 369. [Google Scholar] [CrossRef]
- Schäfer, E.; Heiskanen, J.; Heikinheimo, V.; Pellikka, P. Mapping Tree Species Diversity of a Tropical Montane Forest by Unsupervised Clustering of Airborne Imaging Spectroscopy Data. Ecol. Indic. 2016, 64, 49–58. [Google Scholar] [CrossRef]
- Asner, G.P.; Martin, R.E. Airborne Spectranomics: Mapping Canopy Chemical and Taxonomic Diversity in Tropical Forests. Front. Ecol. Environ. 2009, 7, 269–276. [Google Scholar] [CrossRef]
- Palmer, M.W.; Earls, P.G.; Hoagland, B.W.; White, P.S.; Wohlgemuth, T. Quantitative Tools for Perfecting Species Lists. Environmetrics 2002, 13, 121–137. [Google Scholar] [CrossRef]
- Harris, A.; Charnock, R.; Lucas, R.M. Hyperspectral Remote Sensing of Peatland Floristic Gradients. Remote Sens. Environ. 2015, 162, 99–111. [Google Scholar] [CrossRef]
- Schmidtlein, S.; Zimmermann, P.; Schüpferling, R.; Weiß, C. Mapping the Floristic Continuum: Ordination Space Position Estimated from Imaging Spectroscopy. J. Veg. Sci. 2007, 18, 131–140. [Google Scholar] [CrossRef]
- Féret, J.-B.; Asner, G.P. Mapping Tropical Forest Canopy Diversity Using High-Fidelity Imaging Spectroscopy. Ecol. Appl. 2014, 24, 1289–1296. [Google Scholar] [CrossRef]
- Draper, F.C.; Baraloto, C.; Brodrick, P.G.; Phillips, O.L.; Martinez, R.V.; Coronado, E.N.H.; Baker, T.R.; Gómez, R.Z.; Guerra, C.A.A.; Flores, M.; et al. Imaging Spectroscopy Predicts Variable Distance Decay across Contrasting Amazonian Tree Communities. J. Ecol. 2019, 107, 696–710. [Google Scholar] [CrossRef]
- Potts, M.D.; Kelley, L.C.; Doll, H.M. Maximizing Biodiversity Co-Benefits under REDD+: A Decoupled Approach. Environ. Res. Lett. 2013, 8, 024019. [Google Scholar] [CrossRef]
- Philip, G.; Brodrick; Evans, L.J.; Martin, R.E.; Chadwick, K.D.; Vaughn, N.R.; Heckler, J.W.; Knapp, D.E.; Asner, G.P. Strategic Conservation: Integrating Forest Carbon and Biodiversity Protection. 2021. (under review). [Google Scholar]
- Olsson, A.D.; Van Leeuwen, W.J.D.; Marsh, S.E. Feasibility of Invasive Grass Detection in a Desertscrub Community Using Hyperspectral Field Measurements and Landsat TM Imagery. Remote Sens. 2011, 3, 2283–2304. [Google Scholar] [CrossRef]
- Brodrick, P.G.; Asner, G.P. Remotely Sensed Predictors of Conifer Tree Mortality during Severe Drought. Environ. Res. Lett. 2017, 12, 115013. [Google Scholar] [CrossRef]
- Schwartz, M.W.; Cook, C.N.; Pressey, R.L.; Pullin, A.S.; Runge, M.C.; Salafsky, N.; Sutherland, W.J.; Williamson, M.A. Decision Support Frameworks and Tools for Conservation. Conserv. Lett. 2018, 11, e12385. [Google Scholar] [CrossRef]
- Kuempel, C.D.; Adams, V.M.; Possingham, H.P.; Bode, M. Bigger or Better: The Relative Benefits of Protected Area Network Expansion and Enforcement for the Conservation of an Exploited Species. Conserv. Lett. 2018, 11, e12433. [Google Scholar] [CrossRef]
- Michaelian, M.; Hogg, E.H.; Hall, R.J.; Arsenault, E. Massive Mortality of Aspen Following Severe Drought along the Southern Edge of the Canadian Boreal Forest. Glob. Chang. Biol. 2011, 17, 2084–2094. [Google Scholar] [CrossRef]
- Zhang, T.; Niinemets, Ü.; Sheffield, J.; Lichstein, J.W. Shifts in Tree Functional Composition Amplify the Response of Forest Biomass to Climate. Nature 2018, 556, 99–102. [Google Scholar] [CrossRef]
- Gilbert, G.S. Evolutionary Ecology of Plant Diseases in Natural Ecosystems. Annu. Rev. Phytopathol. 2002, 40, 13–43. [Google Scholar] [CrossRef]
- Pearson, D.E.; Ortega, Y.K.; Eren, Ö.; Hierro, J.L. Community Assembly Theory as a Framework for Biological Invasions. Trends Ecol. Evol. 2018, 33, 313–325. [Google Scholar] [CrossRef]
- Pimentel, D. Invasive Plants: Ecological and Agricultural Aspects; Inderjit, S., Ed.; Springer Science & Buisiness Media: Berlin, Germany, 2005. [Google Scholar]
- Ferraz, A.; Saatchi, S.; Mallet, C.; Jacquemoud, S.; Gonçalves, G.; Silva, C.A.; Soares, P.; Tomé, M.; Pereira, L. Airborne Lidar Estimation of Aboveground Forest Biomass in the Absence of Field Inventory. Remote Sens. 2016, 8, 653. [Google Scholar] [CrossRef]
- Vaughn, N.R.; Asner, G.P.; Brodrick, P.G.; Martin, R.E.; Heckler, J.W.; Knapp, D.E.; Hughes, R.F. An Approach for High-Resolution Mapping of Hawaiian Metrosideros Forest Mortality Using Laser-Guided Imaging Spectroscopy. Remote Sens. 2018, 10, 502. [Google Scholar] [CrossRef]
- Asner, G.P.; Martin, R.E.; Keith, L.M.; Heller, W.P.; Hughes, M.A.; Vaughn, N.R.; Hughes, R.F.; Balzotti, C. A Spectral Mapping Signature for the Rapid Ohia Death (ROD) Pathogen in Hawaiian Forests. Remote Sens. 2018, 10, 404. [Google Scholar] [CrossRef]
- Shafri, H.Z.M.; Hamdan, N. Hyperspectral Imagery for Mapping Disease Infection in Oil Palm Plantation Using Vegetation Indices and Red Edge Techniques. Am. J. Appl. Sci. 2009, 5, 1031–1035. [Google Scholar]
- Shendryk, I.; Broich, M.; Tulbure, M.G.; McGrath, A.; Keith, D.; Alexandrov, S.V. Mapping Individual Tree Health Using Full-Waveform Airborne Laser Scans and Imaging Spectroscopy: A Case Study for a Floodplain Eucalypt Forest. Remote Sens. Environ. 2016, 187, 202–217. [Google Scholar] [CrossRef]
- Skowronek, S.; Asner, G.P.; Feilhauer, H. Performance of One-Class Classifiers for Invasive Species Mapping Using Airborne Imaging Spectroscopy. Ecol. Inform. 2017, 37, 66–76. [Google Scholar] [CrossRef]
- Barbosa, J.M.; Asner, G.P.; Martin, R.E.; Baldeck, C.A.; Hughes, F.; Johnson, T. Determining Subcanopy Psidium Cattleianum Invasion in Hawaiian Forests Using Imaging Spectroscopy. Remote Sens. 2016, 8, 33. [Google Scholar] [CrossRef]
- Pengra, B.W.; Johnston, C.A.; Loveland, T.R. Mapping an Invasive Plant, Phragmites Australis, in Coastal Wetlands Using the EO-1 Hyperion Hyperspectral Sensor. Remote Sens. Environ. 2007, 108, 74–81. [Google Scholar] [CrossRef]
- Asner, G.P.; Jones, M.O.; Martin, R.E.; Knapp, D.E.; Hughes, R.F. Remote Sensing of Native and Invasive Species in Hawaiian Forests. Remote Sens. Environ. 2008, 112, 1912–1926. [Google Scholar] [CrossRef]
- Andrich, M.; Imberger, J. The Effect of Land Clearing on Rainfall and Fresh Water Resources in Western Australia: A Multi-Functional Sustainability Analysis. Int. J. Sustain. Dev. World Ecol. 2013, 20, 549–563. [Google Scholar] [CrossRef]
- Lee, J.-E.; Lintner, B.R.; Boyce, C.K.; Lawrence, P.J. Land Use Change Exacerbates Tropical South American Drought by Sea Surface Temperature Variability. Geophys. Res. Lett. 2011, 38. [Google Scholar] [CrossRef]
- Ogden, F.L.; Crouch, T.D.; Stallard, R.F.; Hall, J.S. Effect of Land Cover and Use on Dry Season River Runoff, Runoff Efficiency, and Peak Storm Runoff in the Seasonal Tropics of Central Panama. Water Resour. Res. 2013, 49, 8443–8462. [Google Scholar] [CrossRef]
- Roche, J.W.; Goulden, M.L.; Bales, R.C. Estimating Evapotranspiration Change Due to Forest Treatment and Fire at the Basin Scale in the Sierra Nevada, California. Ecohydrology 2018, 11, e1978. [Google Scholar] [CrossRef]
- Martin, R.E.; Asner, G.P.; Francis, E.; Ambrose, A.; Baxter, W.; Das, A.J.; Vaughn, N.R.; Paz-Kagan, T.; Dawson, T.; Nydick, K.; et al. Remote Measurement of Canopy Water Content in Giant Sequoias (Sequoiadendron Giganteum) during Drought. For. Ecol. Manag. 2018, 419–420, 279–290. [Google Scholar] [CrossRef]
- Asner, G.P.; Brodrick, P.G.; Anderson, C.B.; Vaughn, N.R.; Knapp, D.E.; Martin, R.E. Progressive Forest Canopy Water Loss during the 2012–2015 California Drought. Proc. Natl. Acad. Sci. USA 2016, 113, E249–E255. [Google Scholar] [CrossRef] [PubMed]
- Miller, D.L.; Alonzo, M.; Roberts, D.A.; Tague, C.; McFadden, J.P. Drought Response of Urban Trees and Turfgrass using Airborne Imaging Spectroscopy. Remote Sens. Environ. 2020, 240, 111646. [Google Scholar] [CrossRef]
- Ustin, S.L.; Roberts, D.A.; Gardner, M.; Dennison, P. Evaluation of the Potential of Hyperion Data to Estimate Wildfire Hazard in the Santa Ynez Front Range, Santa Barbara, California. IEEE Int. Geosci. Remote Sens. Symp. 2002, 2, 796–798. [Google Scholar] [CrossRef]
- Roberts, D.A.; Dennison, P.E.; Gardner, M.E.; Hetzel, Y.; Ustin, S.L.; Lee, C.T. Evaluation of the Potential of Hyperion for Fire Danger Assessment by Comparison to the Airborne Visible/Infrared Imaging Spectrometer. IEEE Trans. Geosci. Remote Sens. 2003, 41, 1297–1310. [Google Scholar] [CrossRef]
- Somers, B.; Asner, G.P. Invasive Species Mapping in Hawaiian Rainforests Using Multi-Temporal Hyperion Spaceborne Imaging Spectroscopy. IEEE J. Sel. Top. Appl. Earth Obs. Remote Sens. 2013, 6, 351–359. [Google Scholar] [CrossRef]
- Asner, G.P.; Vitousek, P.M. Remote Analysis of Biological Invasion and Biogeochemical Change. Proc. Natl. Acad. Sci. USA 2005, 102, 4383–4386. [Google Scholar] [CrossRef]
- Asner, G.P.; Martin, R.E.; Carlson, K.M.; Rascher, U.; Vitousek, P.M. Vegetation–Climate Interactions among Native and Invasive Species in Hawaiian Rainforest. Ecosystems 2006, 9, 1106–1117. [Google Scholar] [CrossRef]
- Koutroulis, A.G. Dryland Changes under Different Levels of Global Warming. Sci. Total Environ. 2019, 655, 482–511. [Google Scholar] [CrossRef]
- Van der Esch, S.; Brink, B.; Stehfest, E.; Bakkenes, M.; Sewell, A.; Bouwman, A.; Meijer, J.; Westhoek, H.; van den Berg, M.; Born, G.J.; et al. Exploring Future Changes in Land Use and Land Condition and the Impacts on Food, Water, Climate Change and Biodiversity: Scenarios for the UNCCD Global Land Outlook. 2017. Available online: https://www.pbl.nl/sites/default/files/downloads/pbl-2017-exploring-future-changes-in-land-use-and-land-condition-2076b_1.pdf (accessed on 17 December 2020).
- Mirzabaev, A.; Wu, J.; Evans, J.; Garcia-Oliva, F.; Hussein, I.A.G.; Iqbal, M.H.; Kimutai, J.; Knowles, T.; Meza, F.; Nedjroaoui, D.; et al. Desertification. Climate Change and Land: An IPCC Special Report on Climate Change, Desertification, Land Degradation, Sustainable Land Management, Food Security, and Greenhouse Gas Fluxes in Terrestrial Ecosystems. Shukla, P.R., Skeg, J., Buendia, E.C., Masson-Delmotte, V., Pörtner, H.-O., Roberts, D.C., Zhai, P., Slade, R., Connors, S., van Diemen, S., et al., Eds.; 2019. Available online: https://www.ipcc.ch/srccl/chapter/chapter-3/ (accessed on 17 December 2020).
- Sultana, F. Gendering Climate Change: Geographical Insights. Prof. Geogr. 2014, 3, 372–381. [Google Scholar] [CrossRef]
- Asner, G.P.; Borghi, C.E.; Ojeda, R.A. Desertification in Central Argentina: Changes in Ecosystem Carbon and Nitrogen from Imaging Spectroscopy. Ecol. Appl. 2003, 13, 629–648. [Google Scholar] [CrossRef]
- Maloney, M. A Comparison of Methods for Scaling Field Data for Use in Mapping Dryland Ecosystem Vegetation with Airborne Imaging Spectroscopy. Ph.D. Thesis, Appalachian State University, Boone, NC, USA, 2017. [Google Scholar]
- Stevens, A.; Miralles, I.; van Wesemael, B. Soil Organic Carbon Predictions by Airborne Imaging Spectroscopy: Comparing Cross-Validation and Validation. Soil Sci. Soc. Am. J. 2012, 76, 2174–2183. [Google Scholar] [CrossRef]
- Gomez, C.; Lagacherie, P.; Bacha, S. Using an Vis-NIR Hyperspectral Image to Map Topsoil Properties over Bare Soil Surfaces of the Lebna Catchment in Tunisia (300 Km2). In Proceedings of the 5th Global Workshop on Digital Soil Mapping, Sydney, Australia, 10–13 April 2012; Volume 14, p. 6465. [Google Scholar]
- Koch, M.; Schmid, T.; Gumuzzio, J.; Mather, P. Use of Imaging Spectroscopy to Assess the Impact of Land Use Changes in a Semi-Arid Karstic Landscape: Los Monegros, Spain. In Proceedings of the 4th EARSeL Workshop on Imaging Spectroscopy, Warsaw, Poland, 27–29 April 2005. [Google Scholar]
- Sur, K.; Chauhan, P. Imaging Spectroscopic Approach for Land Degradation Studies: A Case Study from the Arid Land of India. Geomat. Nat. Hazards Risk 2019, 10, 898–911. [Google Scholar] [CrossRef]
- Green, R.O.; Mahowald, N.; Ung, C.; Thompson, D.R.; Bator, L.; Bennet, M.; Bernas, M.; Blackway, N.; Bradley, C.; Cha, J.; et al. The Earth Surface Mineral Dust Source Investigation: An Earth Science Imaging Spectroscopy Mission. In Proceedings of the 2020 IEEE Aerospace Conference, Big Sky, MT, USA, 3–14 July 2020; pp. 1–15. [Google Scholar] [CrossRef]
- Kioumourtzoglou, M.-A.; Schwartz, J.; James, P.; Dominici, F.; Zanobetti, A. PM2.5 and Mortality in 207 US Cities: Modification by Temperature and City Characteristics. Epidemiology 2016, 27, 221–227. [Google Scholar] [CrossRef] [PubMed]
- Li, Y.; Sun, Y.; Li, J.; Gao, C. Socioeconomic Drivers of Urban Heat Island Effect: Empirical Evidence from Major Chinese Cities. Sustain. Cities Soc. 2020, 63, 102425. [Google Scholar] [CrossRef]
- Houston, D.; Wu, J.; Ong, P.; Winer, A. Structural Disparities of Urban Traffic in Southern California: Implications for Vehicle-Related Air Pollution Exposure in Minority and High-Poverty Neighborhoods. J. Urban Aff. 2004, 26, 565–592. [Google Scholar] [CrossRef]
- Sierra Club. Available online: https://www.sierraclub.org/ready-for-100/commitments (accessed on 10 October 2020).
- C40 Cities. C40 Cities: 35 Cities Unite to Clean the Air Their Citizens Breath, Protecting the Health of Millions. Available online: https://www.c40.org/press_releases/35-cities-unite-to-clean-the-air-their-citizens-breathe-protecting-the-health-of-millions (accessed on 10 October 2020).
- Behling, R.; Bochow, M.; Foerster, S.; Roessner, S.; Kaufmann, H. Automated GIS-Based Derivation of Urban Ecological Indicators Using Hyperspectral Remote Sensing and Height Information. Ecol. Indic. 2015, 48, 218–234. [Google Scholar] [CrossRef]
- Heiden, U.; Segl, K.; Roessner, S.; Kaufmann, H. Determination of Robust Spectral Features for Identification of Urban Surface Materials in Hyperspectral Remote Sensing Data. Remote Sens. Environ. 2007, 111, 537–552. [Google Scholar] [CrossRef]
- Gu, H.; Singh, A.; Townsend, P.A. Detection of gradients of forest composition in an urban area using imaging spectroscopy. Remote Sens. Environ. 2015, 167, 168–180. [Google Scholar] [CrossRef]
- Degerickx, J.; Roberts, D.A.; McFadden, J.P.; Hermy, M.; Somers, B. Urban Tree Health Assessment Using Airborne Hyperspectral and LiDAR Imagery. Int. J. Appl. Earth Obs. Geoinf. 2018, 73, 26–38. [Google Scholar] [CrossRef]
- Burke, L.; Reytar, K.; Spalding, M.; Perry, A. Reefs at Risk Revisited; World Resources Institute: Washington, DC, USA, 2011. [Google Scholar]
- Rogers, A.; Harborne, A.R.; Brown, C.J.; Bozec, Y.-M.; Castro, C.; Chollett, I.; Hock, K.; Knowland, C.A.; Marshell, A.; Ortiz, J.C.; et al. Anticipative Management for Coral Reef Ecosystem Services in the 21st Century. Glob. Chang. Biol. 2015, 21, 504–514. [Google Scholar] [CrossRef]
- Asner, G.P.; Vaughn, N.R.; Balzotti, C.; Brodrick, P.G.; Heckler, J. High-Resolution Reef Bathymetry and Coral Habitat Complexity from Airborne Imaging Spectroscopy. Remote Sens. 2020, 12, 310. [Google Scholar] [CrossRef]
- Botha, E.J.; Brando, V.E.; Anstee, J.M.; Dekker, A.G.; Sagar, S. Increased Spectral Resolution Enhances Coral Detection under Varying Water Conditions. Remote Sens. Environ. 2013, 131, 247–261. [Google Scholar] [CrossRef]
- Asner, G.P.; Leduff, C. Bold Initiative Aims to Protect Coral Reefs in the Dominican Republic. Available online: https://news.mongabay.com/2018/07/bold-initiative-aims-to-protect-coral-reefs-in-the-dominican-republic/ (accessed on 10 October 2020).
- Bajjouk, T.; Mouquet, P.; Ropert, M.; Quod, J.-P.; Hoarau, L.; Bigot, L.; Le Dantec, N.; Delacourt, C.; Populus, J. Detection of Changes in Shallow Coral Reefs Status: Towards a Spatial Approach Using Hyperspectral and Multispectral Data. Ecol. Indic. 2019, 96, 174–191. [Google Scholar] [CrossRef]
- Carlson, R.R.; Foo, S.A.; Asner, G.P. Land Use Impacts on Coral Reef Health: A Ridge-to-Reef Perspective. Front. Mar. Sci. 2019, 6, 562. [Google Scholar] [CrossRef]
- Dierssen, H.; McManus, G.B.; Chlus, A.; Qiu, D.; Gao, B.-C.; Lin, S. Space Station Image Captures a Red Tide Ciliate Bloom at High Spectral and Spatial Resolution. Proc. Natl. Acad. Sci. USA 2015, 112, 14783–14787. [Google Scholar] [CrossRef]
- Garaba, S.P.; Aitken, J.; Dierssen, H.M.; Lebreton, L.; Zielinski, O.; Reisser, J. Sensing Ocean Plastics with an Airborne Hyperspectral Shortwave Infrared Imager. Environ. Sci. Technol. 2018, 52, 11699–11707. [Google Scholar] [CrossRef]
- Clark, R.N.; Swayze, G.A.; Leifer, I.; Livo, K.E.; Kokaly, R.; Hoefen, T.; Sature, C. A Method for Quantitative Mapping of Thick Oil Spills Using Imaging Spectroscopy; US Geological Survey Open-File Report 2010; USGS: Reston, VI, USA, 2010; pp. 1–51. [Google Scholar] [CrossRef]
- Shi, J.; Jiao, J.; Lu, Y.; Zhang, M.; Mao, Z.; Liu, Y. Determining Spectral Groups to Distinguish Oil Emulsions from Sargassum over the Gulf of Mexico Using an Airborne Imaging Spectrometer. ISPRS J. Photogramm. Remote Sens. 2018, 146, 251–259. [Google Scholar] [CrossRef]
- Bell, T.W.; Cavanaugh, K.C.; Siegel, D.A. Remote Monitoring of Giant Kelp Biomass and Physiological Condition: An Evaluation of the Potential for the Hyperspectral Infrared Imager (HyspIRI) Mission. Remote Sens. Environ. 2015, 167, 218–228. [Google Scholar] [CrossRef]
- Forster, P.; Ramaswamy, V.; Artaxo, P.; Berntsen, T.; Betts, R.; Fahey, D.W.; Haywood, J.; Lean, J.; Lowe, D.C.; Myhre, G.; et al. Changes in Atmospheric Constituents and in Radiative Forcing. Chapter 2. Climate Change 2007: The Physical Science Basis. 2007. Available online: https://www.ipcc.ch/site/assets/uploads/2018/02/ar4-wg1-chapter2-1.pdf (accessed on 17 December 2020).
- Thorpe, A.; Duren, R.; Tapella, R.; Bue, B.; Foster, K.; Yadav, V.; Rafiq, T.; Hopkins, F.; Gill, K.; Rodriguez, J.; et al. Methane Source Finder: A Web-Based Data Portal for Exploring Methane Data. Am. Geophys. Union 2020, 22, 9923. [Google Scholar]
- Roberts, D.A.; Bradley, E.S.; Cheung, R.; Leifer, I.; Dennison, P.E.; Margolis, J.S. Mapping Methane Emissions from a Marine Geological Seep Source Using Imaging Spectrometry. Remote Sens. Environ. 2010, 114, 592–606. [Google Scholar] [CrossRef]
- Frankenberg, C.; Thorpe, A.K.; Thompson, D.R.; Hulley, G.; Kort, E.A.; Vance, N.; Borchardt, J.; Krings, T.; Gerilowski, K.; Sweeney, C.; et al. Airborne Methane Remote Measurements Reveal Heavy-Tail Flux Distribution in Four Corners Region. Proc. Natl. Acad. Sci. USA 2016, 113, 9734–9739. [Google Scholar] [CrossRef] [PubMed]
- Duren, R.M.; Thorpe, A.K.; Foster, K.T.; Rafiq, T.; Hopkins, F.M.; Yadav, V.; Bue, B.D.; Thompson, D.R.; Conley, S.; Colombi, N.K.; et al. California’s Methane Super-Emitters. Nature 2019, 575, 180–184. [Google Scholar] [CrossRef] [PubMed]
- Kort, E.A.; Frankenberg, C.; Costigan, K.R.; Lindenmaier, R.; Dubey, M.K.; Wunch, D. Four Corners: The Largest US Methane Anomaly Viewed from Space. Geophys. Res. Lett. 2014, 41, 6898–6903. [Google Scholar] [CrossRef]
- Environmental Defense Fund. Oil and Gas Methane Emissions in New Mexico. 2020. Available online: http://www.edf.org/sites/default/files/new-mexico-methane-analysis.pdf (accessed on 17 December 2020).
- New Mexico Environment Department & New Mexico Energy; Minerals and Natural Resources Department. Methane Advisory Panel. 2019. Available online: https://www.env.nm.gov/new-mexico-methane-strategy/wp-content/uploads/sites/15/2019/08/MAP-Technical-Report-December-19-2019-FINAL.pdf (accessed on 17 December 2020).
- McAllister, L.K. The enforcement challenge of cap-and-trade regulation. Environ. Law 2010, 40, 1195–1230. [Google Scholar]
- California Air Resources Board. CARB’s Oil and Gas Methane Regulation. 2017. Available online: https://ww2.arb.ca.gov/sites/default/files/2020-04/CARB_Oil_and_Gas_Fact_Sheet_8-15-18_0.pdf (accessed on 17 December 2020).
- Emissions Gap Report 2019|UNEP—UN Environment Programme. Available online: https://www.unenvironment.org/resources/emissions-gap-report-2019 (accessed on 10 October 2020).
- Baskaran, L.; Elder, C.; Thompson, D.R.; Miller, C.E.; Thorpe, A.K. Environmental Drivers of Arctic Methane Emissions Hot Spots Determined from Remote Sensing Datasets. AGU Fall Meet. Abstr. 2019. Available online: https://agu.confex.com/agu/fm19/meetingapp.cgi/Paper/609637 (accessed on 17 December 2020).
- Anthony, K.M.W.; Anthony, P.; Grosse, G.; Chanton, J. Geologic Methane Seeps along Boundaries of Arctic Permafrost Thaw and Melting Glaciers. Nat. Geosci. 2012, 6, 419–426. [Google Scholar] [CrossRef]
- Müller, R.; Alonso, K.; Krawczyk, H.; Bachmann, M.; Cerra, D.; Krutz, D.; Dietrich, D.; Gerasch, B.; Ziel, V.; Heiden, U.; et al. Overview and Status of the DESIS Mission. In Proceedings of the DESIS Hyperspectral Imager, Amsterdam, The Netherlands, 23–26 September 2018. [Google Scholar]
- Iwasaki, A.; Tanii, J.; Kashimura, O.; Ito, Y. Prelaunch Status of Hyperspectral Imager Suite (Hisui). In Proceedings of the IGARSS 2019-2019 IEEE International Geoscience Remote Sensing Symposium, Yokohama, Japan, 28 July–2 August 2019; pp. 5887–5890. [Google Scholar] [CrossRef]
- Lopinto, E.; Ananasso, C. The Prisma Hyperspectral Mission. In Proceedings of the Living Planet Symposium, Prague, Czech Republic, 9–13 May 2016. [Google Scholar]
- Culver, T.; Rydeen, A.; Dix, M.; Camello, M.; Gallaher, M.; Lapidus, D.; Brown, E.; Lee, C.; Luvall, J.; Stavros, N.; et al. SBG User Needs and Valuation Study; RTI Innovation Advisors. 2020. Available online: https://sbg.jpl.nasa.gov/doc_links/user-needs-and-valuation-study (accessed on 17 December 2020).
- Contracts Signed for Three High-Priority Environmental Missions. Available online: https://www.esa.int/Applications/Observing_the_Earth/Copernicus/Contracts_signed_for_three_high-priority_environmental_missions (accessed on 5 January 2021).


Publisher’s Note: MDPI stays neutral with regard to jurisdictional claims in published maps and institutional affiliations. |
© 2021 by the authors. Licensee MDPI, Basel, Switzerland. This article is an open access article distributed under the terms and conditions of the Creative Commons Attribution (CC BY) license (http://creativecommons.org/licenses/by/4.0/).