Article

MorphEst: An Automated Toolbox for Measuring Estuarine Planform Geometry from Remotely Sensed Imagery and Its Application to the South Korean Coast

1
Department of Oceanography, Inha University, 100 Inharo, Incheon 22212, Korea
2
Department of Mathematics, Inha University, 100 Inharo, Incheon 22212, Korea
*
Author to whom correspondence should be addressed.
Remote Sens. 2021, 13(2), 330; https://doi.org/10.3390/rs13020330
Submission received: 29 December 2020 / Revised: 15 January 2021 / Accepted: 15 January 2021 / Published: 19 January 2021

Abstract

:
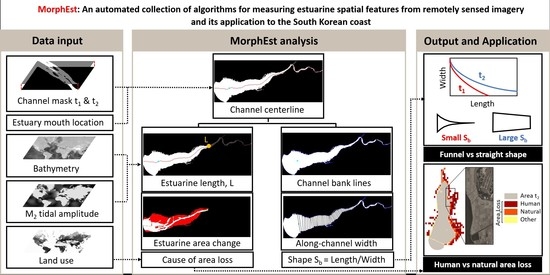
The rapid advance of remote sensing technology during the last few decades provides a new opportunity for measuring detectable estuarine spatial change. Although estuarine surface area and convergence are important hydraulic parameters often used to predict long-term estuarine evolution, the majority of automated analyses of channel plan view dynamics have been specifically written for riverine systems and have limited applicability to most of the estuaries in the world. This study presents MorphEst, a MATLAB-based collection of analysis tools that automatically measure estuarine planform geometry. MorphEst uses channel masks to extract estuarine length, convergence length, estuarine shape, and areal gain and loss of estuarine surface area due to natural or human factors. Comparisons indicated that MorphEst estimates closely matched with independent measurements of estuarine surface area (r = 0.99) and channel width (r = 0.92) of 39 estuaries along the South Korean coast. Overall, this toolbox will help to improve the ability to solve research questions commonly associated with estuarine evolution as it introduces a tool to automatically measure planform geometric features from remotely sensed imagery.

Graphical Abstract

1. Introduction

Estuaries exhibit a wide range of human impacts as many of the world’s ports and cities are located in close proximity to an estuary [1,2]. Large engineering projects such as industrial and urban development of estuaries have led to severe degradation of ecosystems [3,4], and changes to shoreline location, river discharge, tidal characteristics, as well as sediment dynamics throughout the last century [5,6,7,8,9]. The shape and size of modern-day estuaries therefore represent the adjustment to longer-term, larger-scale effects together with more recent, anthropogenic impacts from urban development and engineering structures [10]. As sea level is predicted to rise between 0.3 and 1.0 m within the next century [11] and the coastal population is anticipated to reach approximately six billion by 2025 [1], engineering structures and land reclamation projects are also expected to further increase within estuaries globally [12,13]. To determine how current and future anthropogenic alterations influence estuarine evolution, it is essential to understand estuarine systems that have already undergone such changes and their processes.
Estuarine processes are largely controlled by the interaction between climate-related changes in sea level, environmental factors, such as the oceanographic regime, sediment availability, and tectonics, as well as anthropogenic impacts [14,15,16,17,18,19]. The interplay of these factors results in a variety of different estuarine settings, ranging from wave-dominated, microtidal estuaries to macrotidal estuaries with extensive gently sloping coastal plains [14]. In particular, estuaries are widely considered to reflect the relative importance of wave, tide, and river forcing [20,21,22,23,24,25]. For example, tide-dominated estuaries tend to widen downstream [24] and, therefore, exhibit a funnel-shape [26], whereas wave- and river-dominated estuaries are more likely to be straight as occasional large fluvial floods transport sediment to the mouth [27]. Other work suggests that the size and geometry of the estuary mouth are the main factors in determining water levels, tidal currents, wave action, sediment transport, and estuarine evolution [28]. Here, funnel-shaped estuaries with a narrow mouth tend to be flood-dominated, whereas upstream-widening estuaries with a narrow mouth are expected to be ebb-dominated. Estuaries with a wide mouth are generally affected to a larger degree by waves compared to estuaries with a narrow mouth. However, the shape and position of an estuary mouth may change due to anthropogenically accelerated deposition and erosion [29] to the effect that humanly altered estuarine dynamics may deviate from their natural conditions. In fact, anthropogenic impacts have already exceeded the forces of natural factors on estuarine planform geometry in many parts of the world [15,19,30,31]. Easy and quick measurements of estuarine size and shape have therefore become essential in order to predict long-term estuarine spatial evolution, hydrodynamics, and the effects of human alterations on them.
Estuarine shape and size as well as the extent of local land reclamation are commonly measured based on remotely sensed imagery [26,32]. In addition, an emerging number of image-processing methodologies have been developed to directly quantify channel width continuously downstream and channel dynamics [33,34,35,36,37,38,39,40] as well as automatically measure channel erosion and accretion [41,42], which has increased our ability to understand channel geometry from space [43]. Even though estuarine surface area and shape are important hydraulic parameters often used to predict long-term estuarine spatial evolution, the majority of automated analyses of channel plan view dynamics have been specifically written for riverine systems and are not suitable for most of the estuaries in the world. So far, remotely sensed measurements of estuarine size and shape are limited to only a few selected sites [26], and there is no global areal change or convergence shape dataset. Furthermore, there is not one that differentiates between natural and human drivers of change. The implementation of new estuarine planform geometry tools therefore remains crucial to characterize the impacts of present and future human alterations on estuarine systems.
This study introduces Morphology of Estuaries (MorphEst), the first toolbox that automatically measures estuarine spatial features with minimal user input. It includes a collection of modified and new functions written for rapid determination of estuarine length, convergence length, shape, and surface area change due to human or natural factors. Moreover, its advantage is its automation that requires no additional manual processing or post-editing. MorphEst was tested with 39 South Korean estuaries which are well-known for their wide range of human alterations such as land reclamation and estuarine dams as well as various tidal ranges from microtidal to super-macrotidal. In particular, the extent of anthropogenic alterations and their effects on estuarine surface area change and shape were quantified. Section 2 describes the general attributes and functions of the toolbox, while Section 3 validates its output and discusses potential implications of estuarine planform geometry change in the Anthropocene.

2. Material and Methods

2.1. MorphEst

2.1.1. MorphEst Overview

The inputs, workflow, and outputs of MorphEst are shown in Figure 1. MorphEst is the first set of tools that automatically measures estuarine spatial features including estuarine length, convergence length, shape, and estuarine surface area change due to natural or anthropogenic factors. MorphEst includes a collection of three modified and four newly developed functions (Table 1) that can be applied to a pre-defined channel mask without additional processing or post-editing. In particular, the toolbox is specifically designed to be easily used for temporal analyses of estuarine planform geometry for large datasets. The toolbox was tested with MATLAB versions 2018a and 2019b.
Several tools and methods measure various channel properties based on remotely sensed imagery. Table 2 includes a detailed overview of representative channel analysis methods, their metrics, and objectives. Table 2 highlights the newly developed analysis tools for estuaries introduced by MorphEst. The majority of previous methods were specifically written for the quantification of channel width and plan view dynamics of riverine systems to automatically create large-scale width datasets or to identify the extent of channel migration [38,41,42,44]. Thus, these methodologies have limited applicability to most of the estuaries in the world because, unlike rivers, estuarine spatial and hydraulic processes are commonly driven by the complicated interaction between tides, waves, and river discharge. For example, tidal amplitude, river flow, and bathymetry generally control the nature of the saline intrusion in an estuary, determining its upstream extent [10]. River-based methodologies generally lack the necessary functions to limit the upstream channel extent to the maximum reach of the saline intrusion. Furthermore, previous work commonly developed channel analysis engines under the assumption that human interventions are absent. In contrast, estuaries are hotspots of environmental change [45], with more than 7000 km2 of the intertidal area within and around estuaries, being lost due to land reclamation in the Yellow Sea alone over the last five decades [32]. Therefore, a new toolbox, MorphEst, was developed to account for these unique features of various channelized coastal environments.
The details of functions in MorphEst are described in the following sections. Section 2.1.2. MorphEst Input defines the necessary input files. Section 2.1.3. Extraction of Channel Centerline explains the automated creation of the channel centerline. Section 2.1.4. Calculation of Estuarine Surface Area Change between Two Time Intervals describes calculations of estuarine length, estuarine surface area at time 1 and 2, as well as estuarine surface area change due to human and natural factors. Then, Section 2.1.5. Measuring Estuarine Convergence Length and Shape depicts the creation of channel bank lines, along-channel width measurements, and the estimation of estuarine shape. Finally, the output files are shown in Section 2.1.6. MorphEst Output.

2.1.2. MorphEst Input

MorphEst requires the input of three to four text/ASCII files. One or two text files include the coordinates (in meters) of the lower-left corner of the channel mask raster extent as well as the overall areal extent of the channel mask at time 1 and time 2 in binary code. If area change calculations are desired, two channel mask text files (i.e., same estuary at two time steps) are required, whereas one channel mask text file suffices for shape calculations. The remaining two text files include the coordinates (one text file in meters and one text file in decimal degrees) and width (in meters) of the estuary mouth. The generation of channel masks is beyond the scope of MorphEst, but can be obtained by using previous image classifications and water masks extraction methods [46,47,48,49,50,51,52,53,54,55,56,57]. Here, channel mask pixels have a value of 1, while all non-channel mask pixels have a value of 0. Finally, MorphEst requires the input of a bathymetry, M2 tidal amplitude, and land cover dataset covering the area of interest (see Section 2.1.4. Calculation of Estuarine Surface Area Change between Two Time Intervals).

2.1.3. Extraction of Channel Centerline

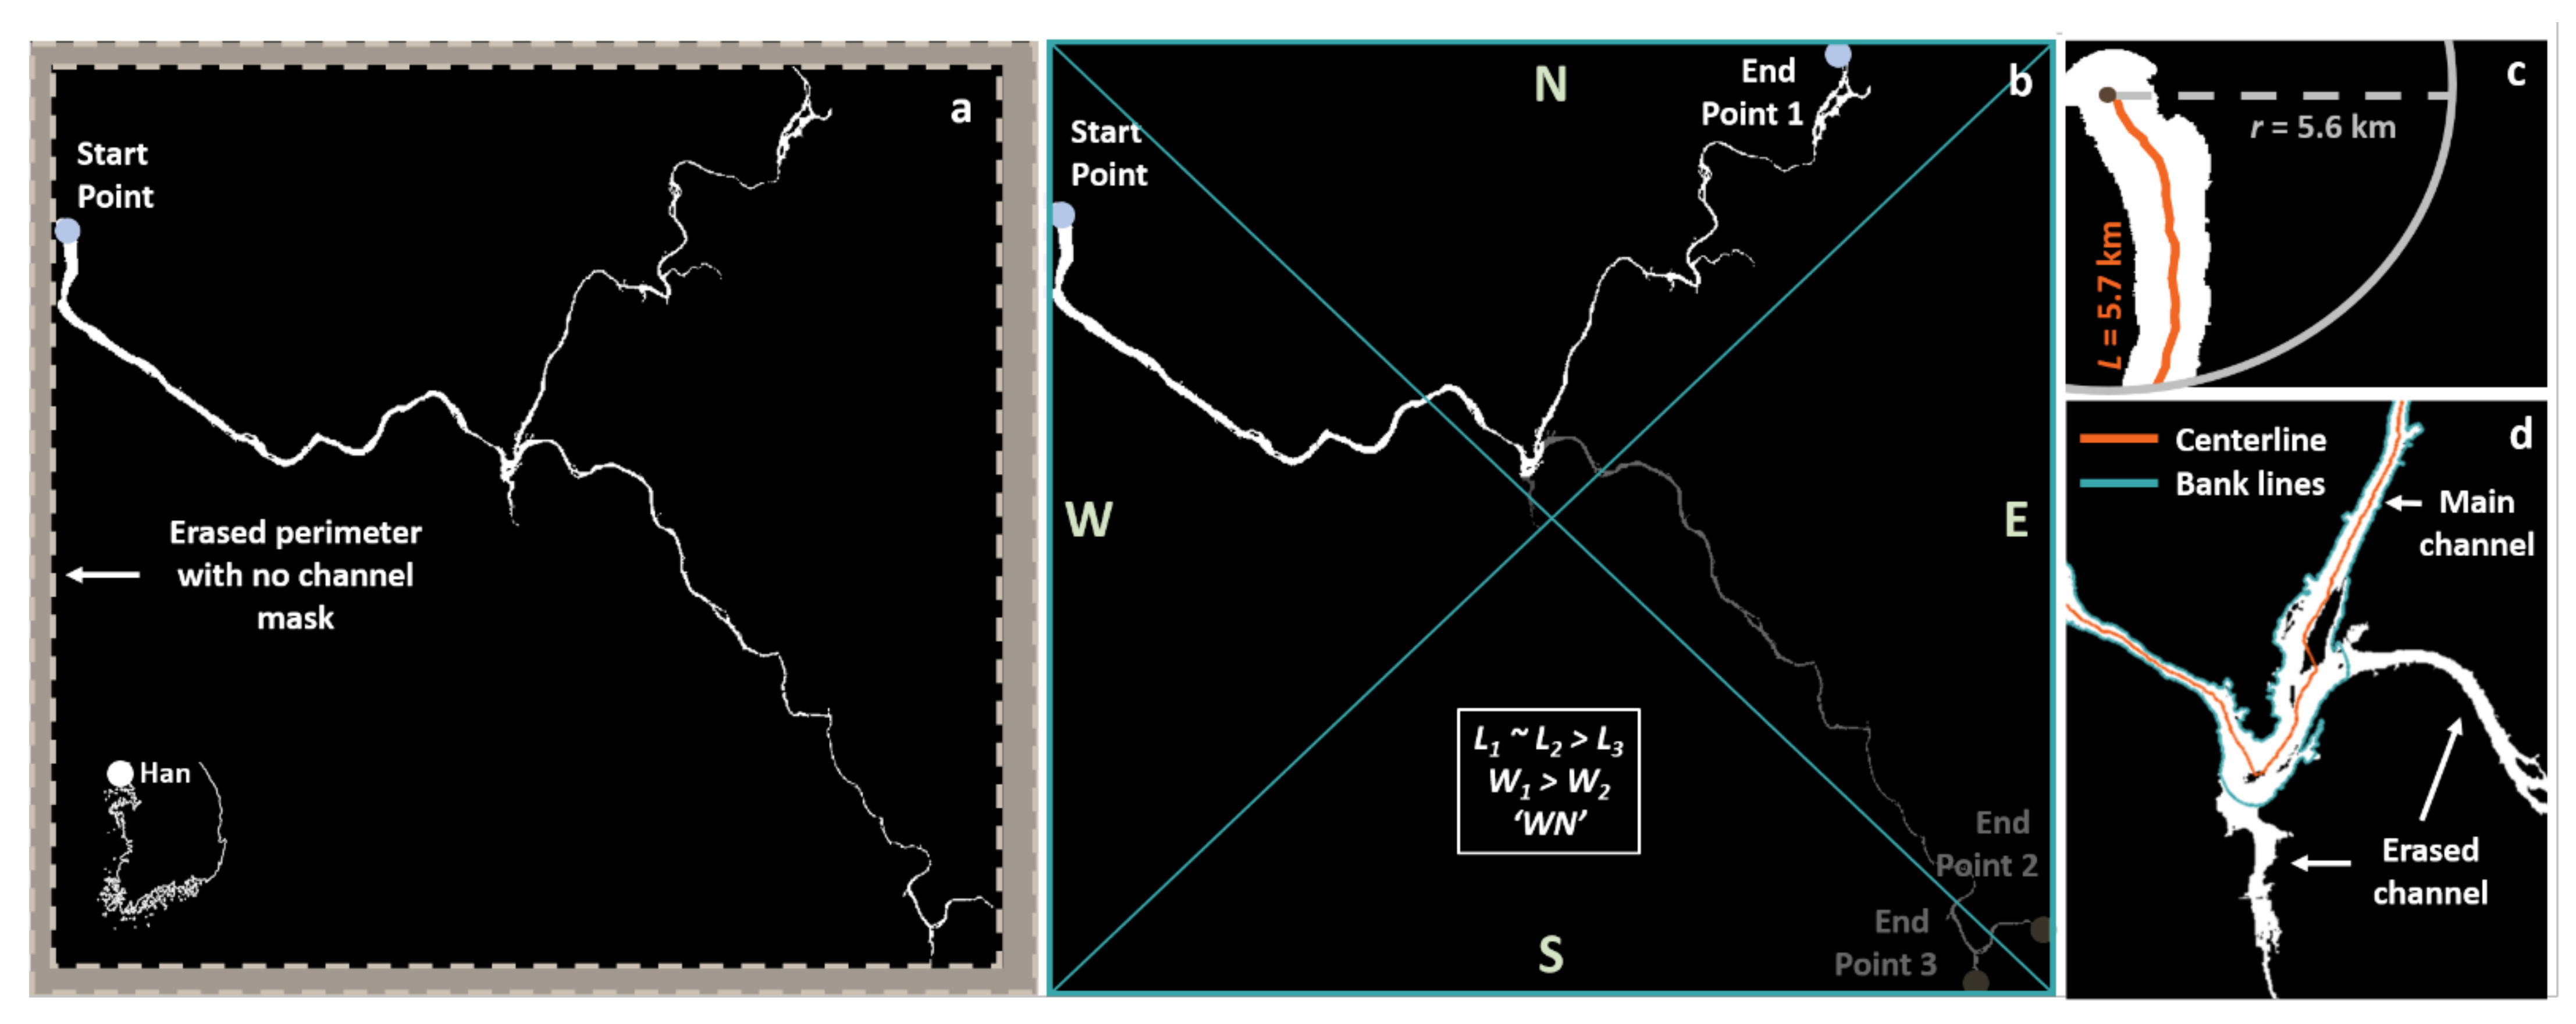
To extract a centerline, MorphEst uses the previously developed RivMAP centerline_from_mask tool and modified it to centerline_from_mask_MorphEst [42]. The pre-modified version of the tool requires the manual input of a two-character variable that represents the cardinal directions of the channel entering (upstream) and leaving (downstream) the raster edges (e.g., ‘NW’, ‘WS’, etc.) (Figure 2). The modified centerline_from_mask_MorphEst tool now automatically determines the sides where the channel enters and leaves the raster edges. Here, MorphEst defines the location of the estuary mouth within the overall estuary extent. The raster perimeter for the columns and rows that do not contain any channel mask pixels are then removed so that estuary starting and end points directly intersect with the raster edges (Figure 2a). The cardinal direction of the mouth is then defined within the estuary raster extent by dividing the raster extent into four triangles, where each triangle represents one cardinal direction (blue lines in Figure 2b). If an estuary mouth lies exactly on the intersecting line between two triangles, MorphEst prioritizes ‘West’ and ‘East’ over ‘North’ and ‘South’.
Based on the direction of the starting point, MorphEst determines all possible directions of the end point under the assumption that an estuary does not enter and leave the raster on the same side. In Figure 2b, the start point is located on the west so that the possible end points are located on the ‘N’, ‘E’, and ‘S’ direction as indicated by end points 1, 2 and 3, respectively. MorphEst then obtains a centerline for all three possible end point cases by generating the shortest path from the starting point to each end point. The cardinal direction of the most likely estuary end point (upstream) is then extracted at the intersection point of the raster edge and the longest and widest (for estuaries with multiple branches) channel mask.

2.1.4. Calculation of Estuarine Surface Area Change between Two Time Intervals

To limit the upstream extent of an estuary to the maximum extent of the saline intrusion, the MorphEst function Est_Length calculates the length of an estuary based on the depth at the mouth ( D 0 ) and the M2 tidal amplitude ( ζ ^ 0 ) [58]:
L = 2460 × D 0 5 / 4 / ζ ^ 0 1 / 2 ,
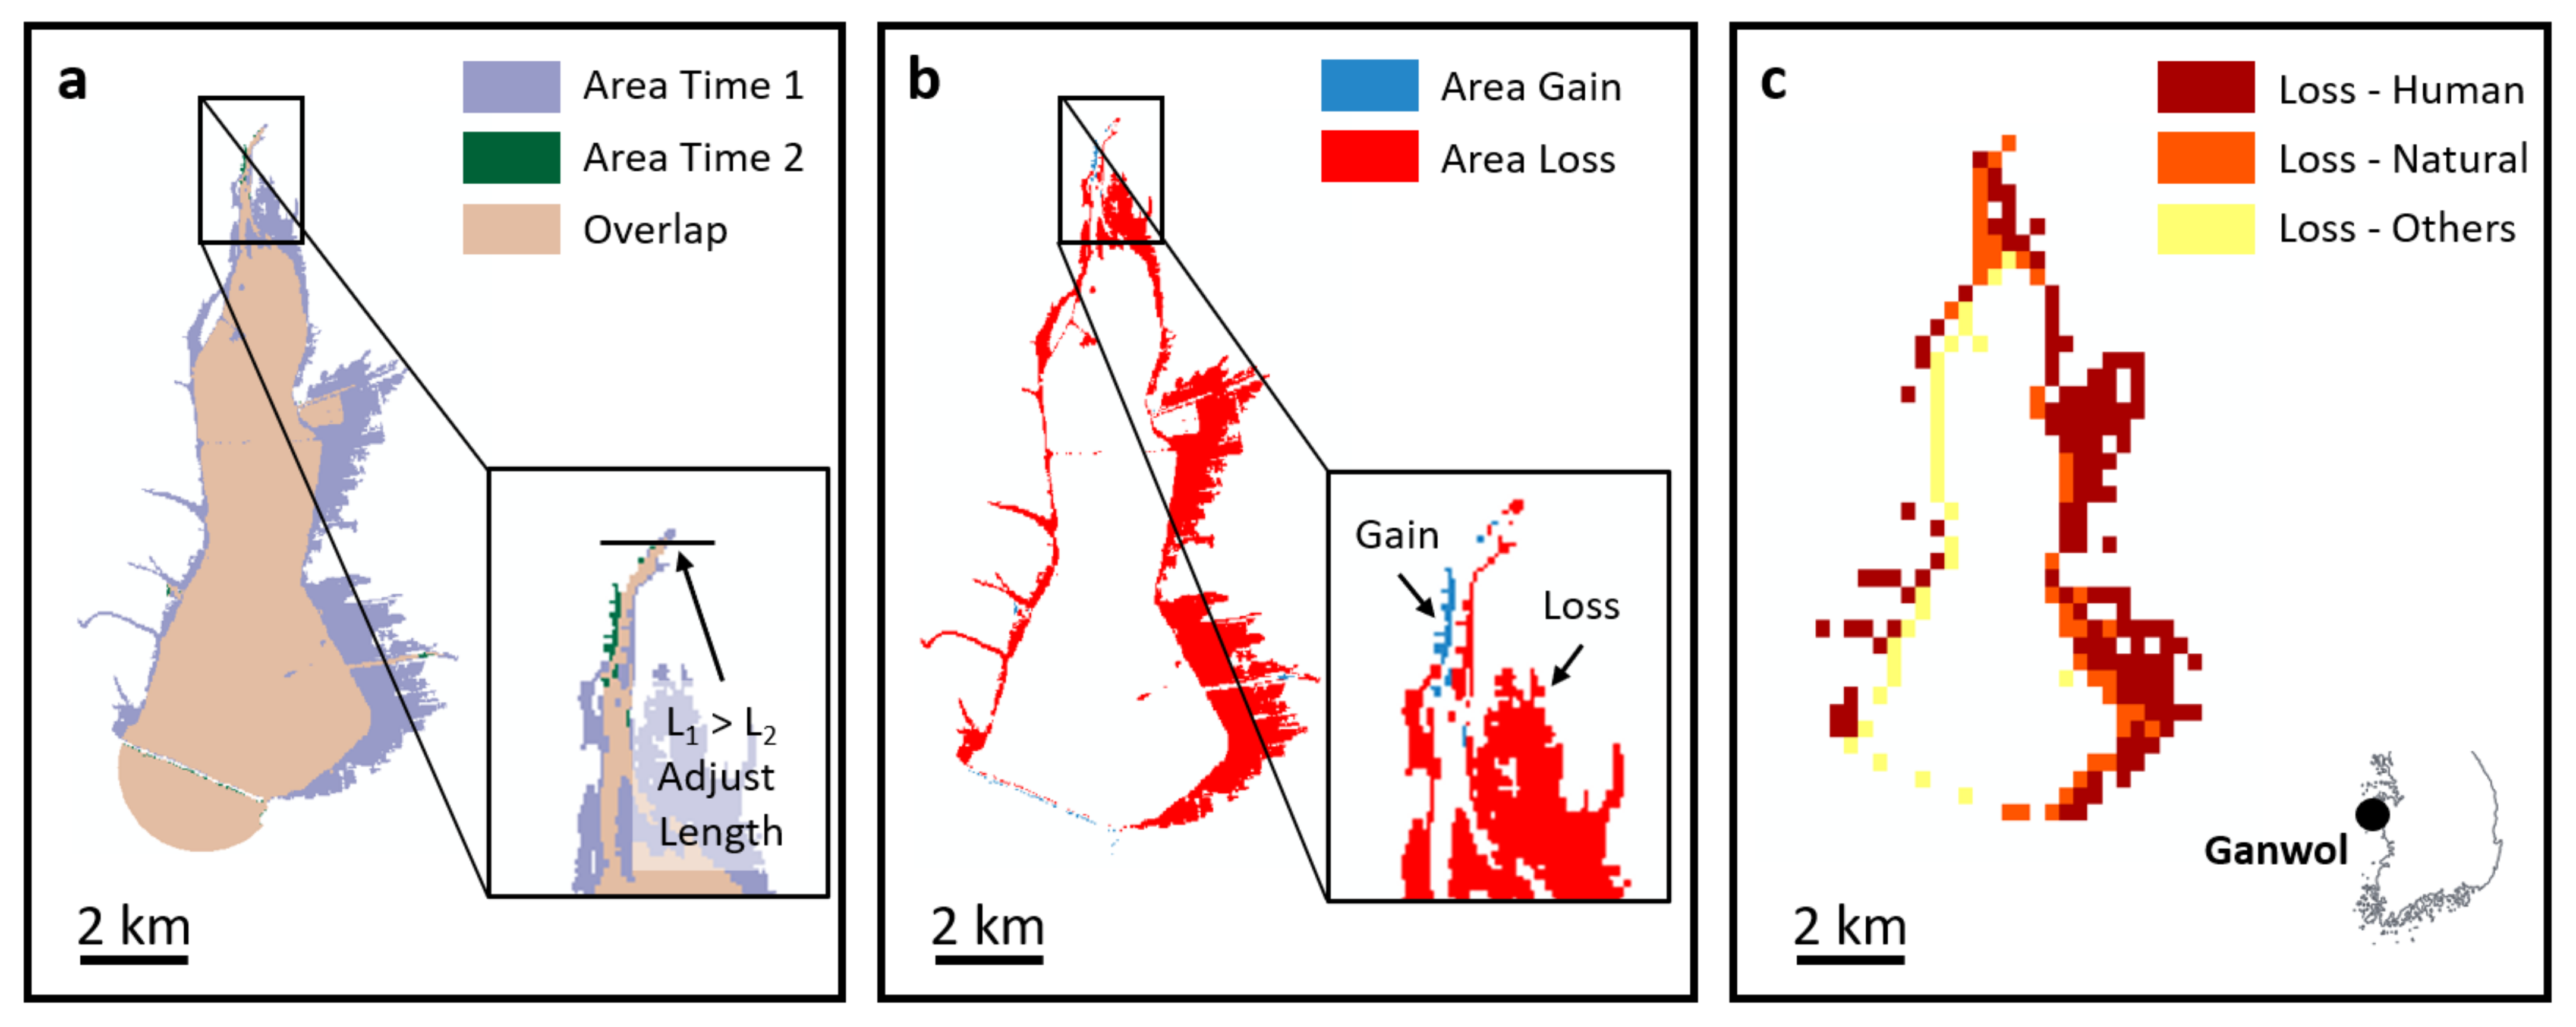
Prandle [59] found that field measurements of estuarine length from 50 estuaries located around the UK coastline and the eastern USA generally agreed with theoretical values of D 0 5 / 4 / ζ ^ 0 1 / 2 . Here, depth and M2 tidal amplitude are extracted at the estuary mouth as a point measurement. A buffer is then drawn around the estuary mouth point with the buffer radius defined as the straight line connecting the estuary mouth and the estuarine length, where the latter was measured along the centerline (Figure 2c). If the calculated estuarine length exceeds the upstream length of an estuary (i.e., when the channel width is less than 30 m), the Est_Length function adjusts the upstream estuarine extent to the shorter channel mask in both time steps to ensure that measured changes in estuarine surface area are not an artifact of changes in length (Figure 3a).
The Est_AreaChange function creates a new raster of change in estuarine surface area between two user-specified time steps by subtracting the more recent estuarine channel mask from the older channel mask (Figure 3). This step results in a raster with values of −1 for regions of estuarine surface area loss, 0 for no change, and 1 for regions of estuarine surface area gain (Figure 3b). Areas of change are then measured by adding the number of pixels in each erosion/accretion region and multiplying them by the pixel resolution. Finally, total estuarine surface area at time 1 is measured by totaling areas of estuarine surface area loss and no change, while total estuarine surface area at time 2 is measured by summing areas of estuarine surface area gain and no change.
MorphEst further divides areas of estuarine surface area loss into natural or human-induced loss, using the Est_AreaChange_Land function. The Est_AreaChange_Land function identifies land-use within regions of estuarine surface area loss based on a land cover dataset (see Section 2.2.2 Data preparation). Human-induced surface area loss generally includes loss due to agricultural or urban expansion following major land reclamation projects, whereas natural surface area loss includes loss due to sediment accretion (Figure 3c). Other surface area loss includes regions that may be misclassified as water due to the different resolutions of the input datasets. On the other hand, estuarine surface area gain is assumed to result from the sea level rise-induced flooding of low-lying terrains.

2.1.5. Measuring Estuarine Convergence Length and Shape

MorphEst calculates estuarine shape based on along-channel width and length, using the modified functions banklines_from_mask_MorphEst and width_from_mask_MorphEst, which are based on RivMAP’s banklines_from_mask and width_from_mask functions [42], respectively. RivMAP’s banklines_from_mask function separates the channel images into left and right banks by removing all pixels at the image boundaries except the bank line pixels (two for each exit side) [42]. However, this function only supports individual channels, and cannot be applied to branching estuaries (or rivers) (for example Figure 2). Based on the assumption that the mouth represents the widest point within an estuary [26,60,61], the banklines_from_mask_MorphEst function draws buffers around the centerline with a radius of each buffer based on the estuary mouth width (i.e., (W/2) + 100, where W is the width at the estuary mouth) and removed parts of the estuary outside of the buffer (Figure 2d). This process erases branches of all sizes and focuses width calculations on the estuary main channel (Figure 2b).
RivMAP’s banklines_from_mask function extracts bank lines from the main channel for the majority of estuaries. However, it tends to fail for estuaries with narrower channels, attached lakes, or small branches, where bank lines are separated by less than two pixels, so that manual editing and cleaning of the channel masks is necessary. To overcome this limitation and to automatically calculate robust bank lines for all sizes of estuaries, banklines_from_mask_MorphEst fills in all holes within the estuary and adds pixels in the form of a disk along the outside two rows/columns for each start and end direction and in the form of a rectangle within the inner part of the raster. Although this approach increases the estuarine width by approximately 200 m, buffers added to the banks are in many cases small relative to the channel width. Comparisons between the smoothed channel mask and the ‘raw’ channel mask suggest that the along-channel width profiles closely match each other (r = 0.996, p ≪ 0.05), preserving the overall shape as well as area calculations.
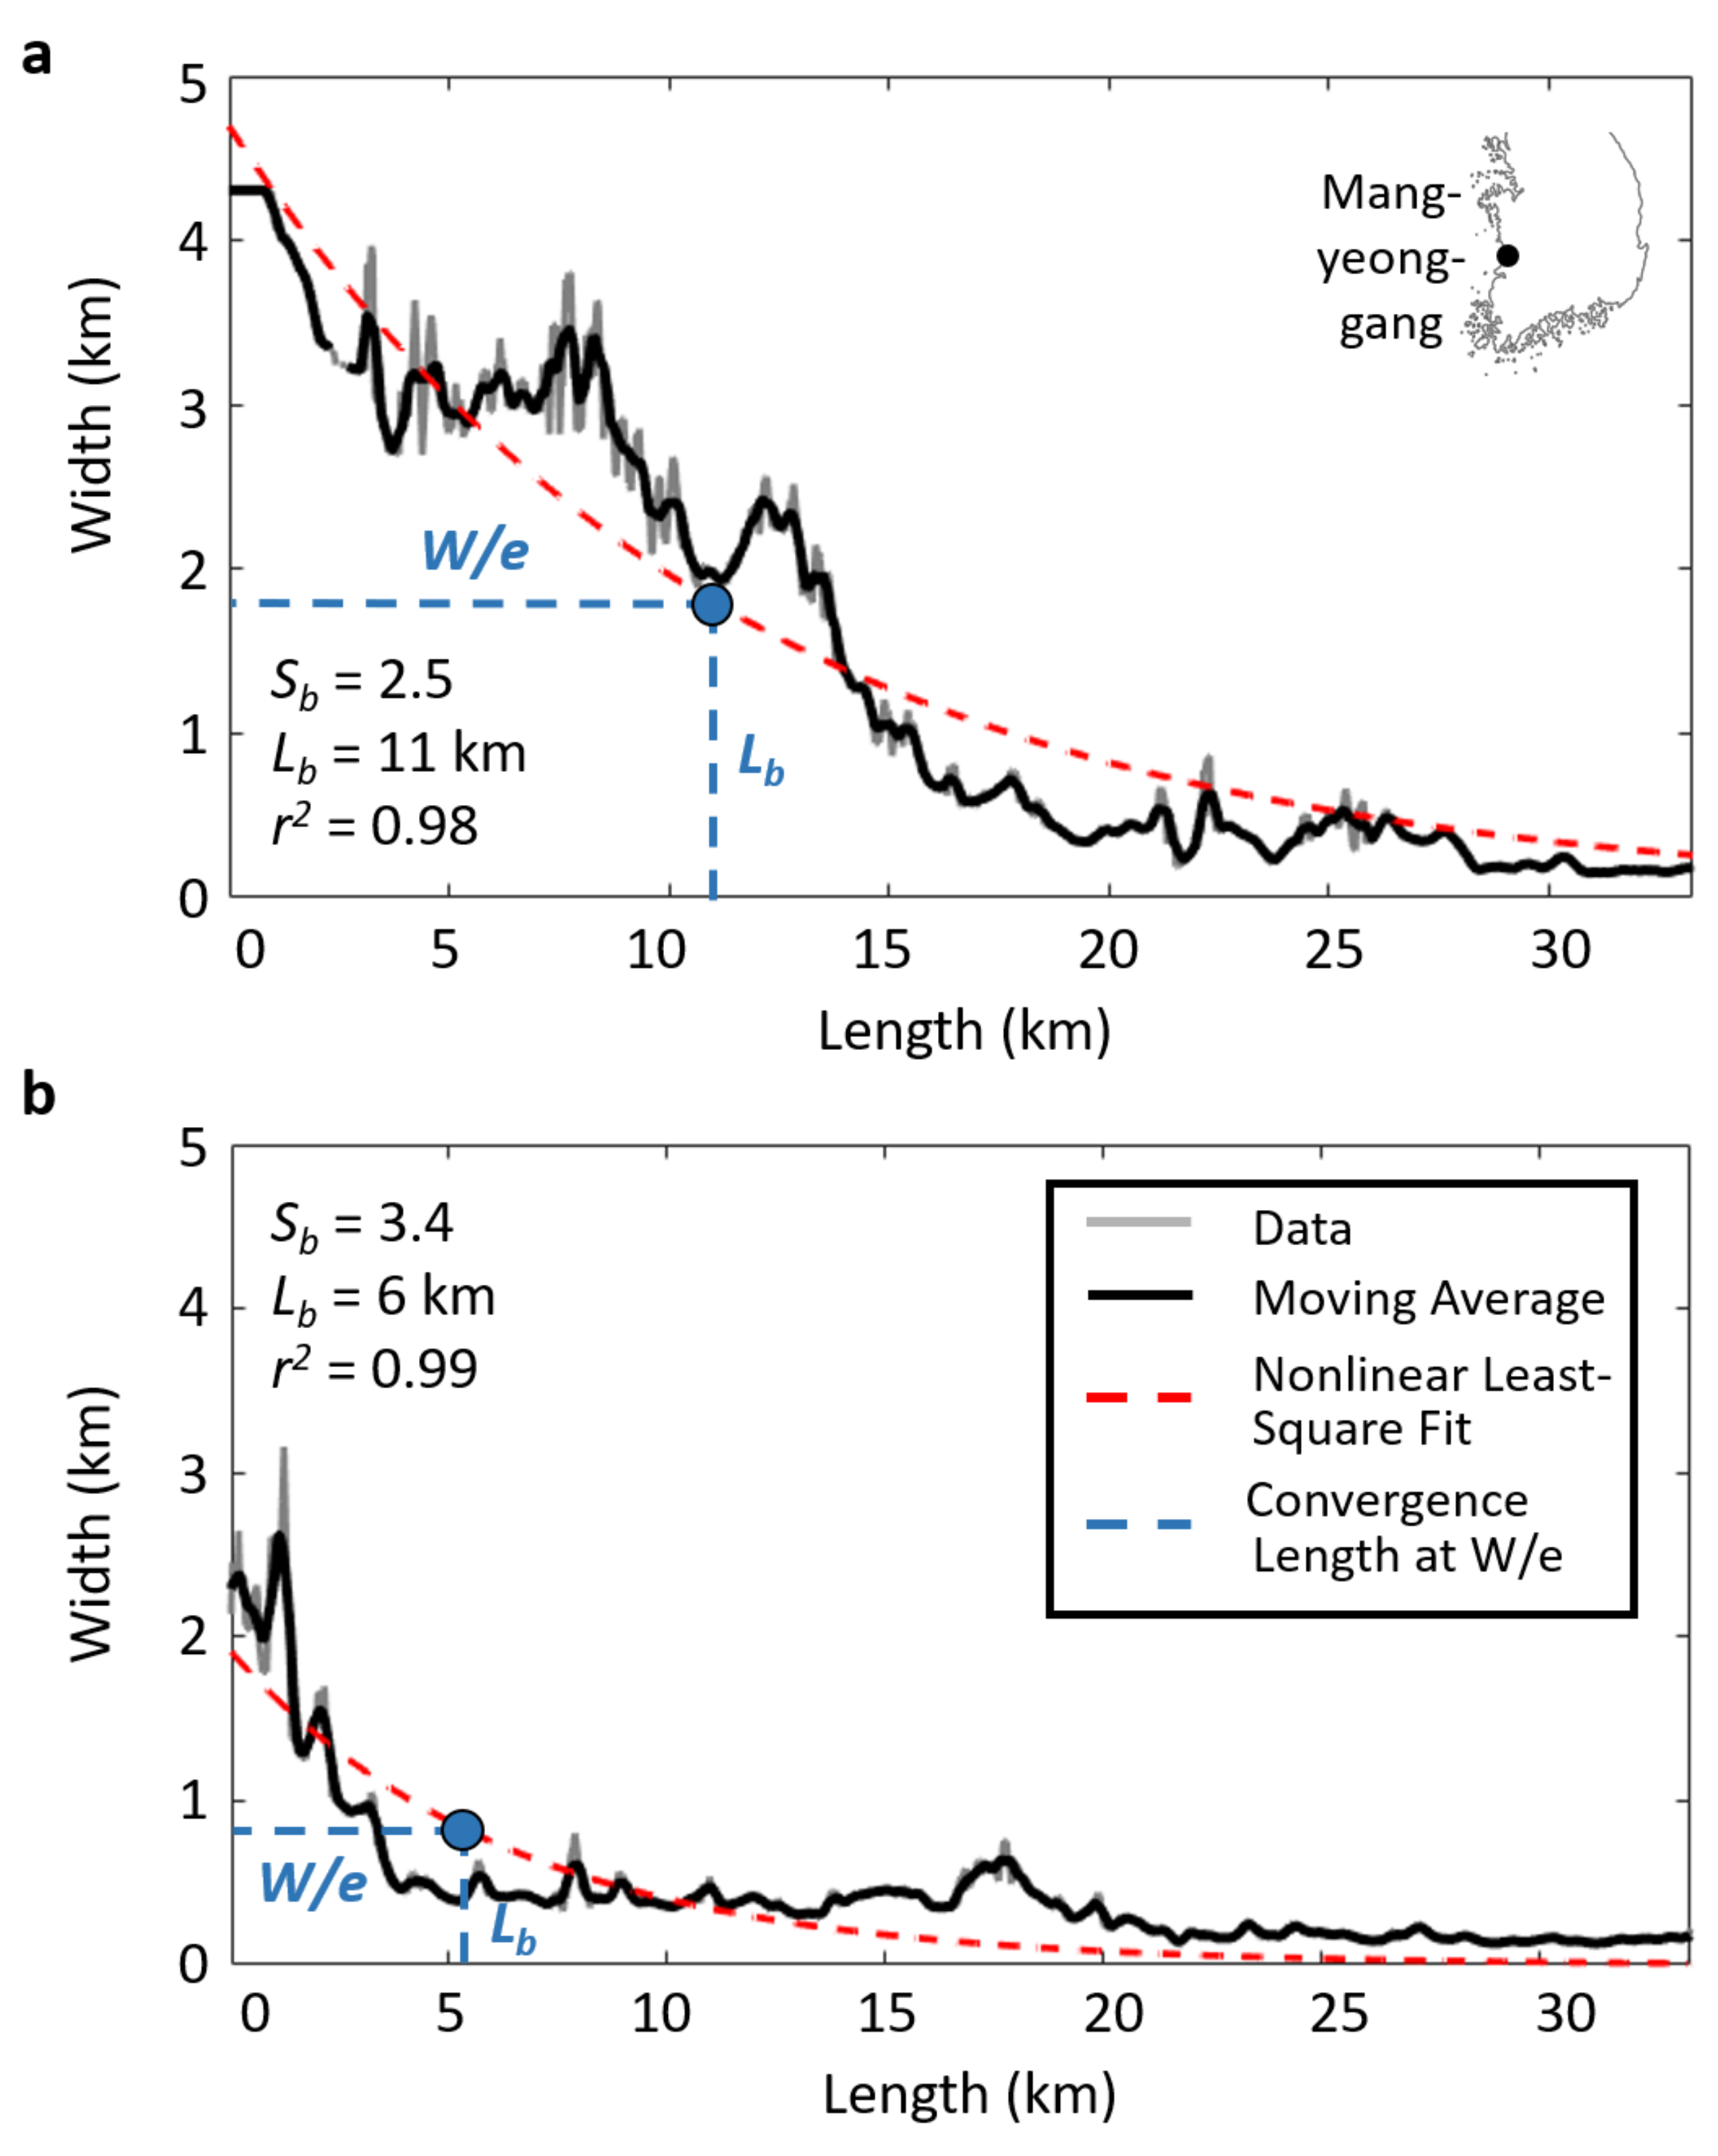
MorphEst calculates changes in estuarine width throughout the main channel, using the width_from_mask_MorphEst function. RivMAP’s width_from_mask function calculates the average channel width at specified intervals along the channel centerline and returns the wetted width for both single-threaded and multi-threaded channels [42]. This function uses MATLAB’s intersection tool to calculate the intersection points between vectors perpendicular to the centerline and the bank lines, which fails to compute the location where two curves intersect in the case of NaNs or N–S directed segments. The modified width_from_mask_MorphEst function now includes width measurements for N–S directed transects by estimating the difference between the two closest bank lines. MorphEst’s Est_Shape function then calculates the length of an estuary from the mouth and fitted nonlinear least-square curves to the data on which convergence length and shape estimates are based [26]. Convergence length Lb is defined as the length where the channel width decreases to W/e (W is the estuarine mouth width and e is 2.72), and estuarine shape Sb is defined as a measure of how ‘funnel-shaped’ the width-length profile is (i.e., Sb = Lb/W) (Figure 4). The fitted estuarine mouth width is determined as the intersection point between the exponential fit and the y-axis (i.e., x = 0). The adequacy of the exponential fit is automatically calculated as r2 (1-residual variance/total variance).

2.1.6. MorphEst Output

MorphEst produces an excel table and a MATLAB table as output. The resulting tables contain information about the longitude and latitude of the estuary mouth, measured depth at the mouth, corrected depth at the mouth (i.e., minimum depth of 1.3 m (see Section 2.2.2 Data Preparation)), M2 tidal amplitude, estuarine length, estuarine surface area at time 1 and 2, estuarine surface area change (in area and percent relative to its size at time 1), total area of estuarine surface loss as well as area loss due to natural, human and other factors, total estuarine surface area gain due to relative sea level rise, convergence length, shape, and r2 (Supplementary Tables S1–S3). The output data (e.g., regions of area change, centerline, width, etc.) can be visualized in MATLAB or exported to use in other geospatial programs such as ArcGIS.

2.2. MorphEst Validation

2.2.1. Study Area

South Korea is located between 34° to 38° N latitude and 126° to 130° E longitude (Figure 5). The east coast of the peninsula faces a narrow continental shelf and continental slope with a width varying between 10 and 20 km and a steepness of 0.4° [62], whereas the west coast of Korea extends to a wider and shallower continental shelf with vast areas of intertidal sand and mudflats that have formed in a tide-dominated environment [63] (Figure 5). Because of the varying ocean morphology, the tide range varies significantly between less than 1 m on the east coast and 10.5 m in Incheon on the northwest side of the Korean peninsula [64]. This large tidal range from the east coast to the northwest coast offers the possibility to explore a variety of estuarine shapes. Moreover, South Korean estuaries and coasts have been altered by major engineering projects such as the installment of estuarine dams or seawalls for land reclamation projects (Figure 5) [9,65]. Approximately half of the previously identified 463 estuaries are classified as closed following the installment of an estuarine dam or sluice gate [66], and more than 1000 km2 of tidal flats have been reclaimed since the early 1980s [67,68]. These large-scale engineering projects modified the tidal regime along the coasts and estuaries within the last century [5,9,65,69]. South Korean estuaries are therefore a good example of modified systems that have undergone changes in size and shape over the last few decades and are an ideal study site to investigate the effect of human impacts on modern-day estuaries.

2.2.2. Data Preparation

To test MorphEst, channel masks for 39 estuaries with a mouth width of >90 m along the South Korean peninsula in 1985 and 2015 were extracted based on the global surface water dataset (Table 3) [71]. The global surface water dataset provides the yearly extent of the seasonal (tidal flats) and permanent (open water) water occurrence with a pixel resolution of 30 m × 30 m. Extracted channel masks include the permanent and seasonal extent of estuarine surface waters because human alterations, such as land reclamation commonly occur in shallow waters and intertidal regions [32,67]. The start year of 1985 was chosen as it marks the beginning of the Landsat 7 missions and, therefore, high-resolution satellite images. Additionally, the minimum estuary mouth width of 90 m was chosen as it includes at least three pixels to ensure robust estuarine shape calculations. The location and width of the estuary mouth were manually measured in Google Earth using the show ruler tool.
Estuarine length-related depth and M2 tidal amplitude information are based on the SRTM15+ [70] and FES2004 datasets [72], respectively (Table 3). In some cases, the SRTM15+ dataset may only contain land elevation information at the estuary mouth due to the coarser resolution of the bathymetry dataset compared to the resolution of the channel mask. In this case, depth information of the water point closest to the estuarine mouth location was extracted. Because the global bathymetry dataset may underestimate the depth at the estuarine mouth (‘Depth Measured’, Supplementary Table S1), MorphEst’s Est_Length function applies a minimum depth of 1.3 m based on the depth distribution of 62 estuaries worldwide (‘Depth Corrected’, Supplementary Table S1) [10,61,73,74].
The differentiation between natural and human-induced estuarine surface area loss was extracted from the 2010 Land Cover Climate Change Initiative Climate Research Data Package [75] (Table 3). The global land cover dataset identifies the main land-use practice within a 300 m × 300 m area and assigns a number to each land-use classification. Here, MorphEst defines reclaimed land as land classified as urban and/or agriculture, while natural land represents land classified as forest, grassland, or barren land. Misclassifications of estuarine surface area loss as water arise from the different resolution of the land-use dataset (300 m × 300 m) and the channel mask (30 m × 30 m). However, this issue can be solved with the input of a higher resolution land-use dataset. Unfortunately as of this writing, the authors are unaware of the existence of a global land-use dataset with a higher resolution than the one used as input for MorphEst.

2.2.3. Error and Sensitivity Analysis

To assess the performance of MorphEst, MorphEst-based estimates for estuarine surface area and area change were compared with ArcGIS-based measurements of all 39 Korean estuaries. Here, ArcGIS-based measurements were based on the same channel mask used as input for MorphEst to test the performance of MorphEst independent of the accuracy of the channel mask. To summarize ArcGIS-based changes in estuarine surface area through time, the estuarine length was manually located along each estuary channel in 1985 and 2015 using the Measure tool in ArcGIS, where estuarine length estimates are based on previous MorphEst outputs. It is noted that the manual measurement of the estuarine length along the approximate middle of the estuarine channel may be less accurate due to manual digitizing errors so that estuarine surface area calculations may slightly diverge from estimates provided by MorphEst. Each estuary was then cut at the estuarine length location, and estuarine surface area for both time steps was measured using the Calculate Geometry tool. Areal loss was summarized between two timesteps by erasing the 1985 estuarine surface area from the 2015 estuarine surface area with the Erase tool, while areal gain was summarized by erasing the 2015 estuarine surface area from the 1985 estuarine surface area. ArcGIS-based estuarine surface area in 1985 and 2015 as well as surface area gain and loss were then compared with similar MorphEst outputs. Goodness of fit was characterized using Spearman’s nonparametric correlation coefficient [40], and the Nash–Sutcliffe efficiency (NSE) coefficient [76]:
N S E = 1 i = 1 n Y i o b s Y i s i m 2 i = 1 n ( Y i o b s Y m e a n ) 2 ,
where Y i o b s is the ith observation of the variable being considered, Y i s i m is the ith simulated value for the variable being considered, Y m e a n is the average value of the considered variable, and n is the total number of observations [77]. The NSE coefficient was developed for hydrological modeling and results in values ranging from –∞ to 1, where a value of 1 indicates a perfect agreement between model predictions and observed data [41]. Finally, the standard deviation was calculated, using MATLAB’s built-in statistical functions.
To validate MorphEst-based shape estimates, ArcGIS-based along-channel width of four representative large estuaries (Han River, Geum River, Yeongsan River, Nakdong River) were calculated in 2015. The Polygon to Centerline Tool for ArcGIS [78] created a centerline for each estuary. At the same time, estuaries with irregular bank shapes produced spurious branches along the centerline. These branches were then manually trimmed so that the final centerline follows the overall channel structure. Once the centerline is created, the Transect tool [79] was used to create lines perpendicular to the centerline with a distance of 200 m between individual transects. Here, the Transect tool requires the input of a pre-defined transect length, which is defined as the width at the estuary mouth as this is commonly assumed to be the widest region of the estuary [26,60,61]. This ensured that the transects cover all portions of the estuary. The transect lines were then clipped to the estuary channel extent delineating the along-channel width as the length of each transect. However, some transect lines along the main channel seem to overestimate the estuarine width when compared to the width of close by smaller branches. A 200 m reduction from each of the MorphEst width measurements was applied to account for pixels that were previously added during the smoothing process. MorphEst width estimates were then compared at each transect-centerline intersection to the spatially closest ArcGIS-based width measurement while excluding width points that were more than 10 pixels (i.e., 300 m) upstream or downstream from the intersection (n = 3833). Finally, the NSE coefficient was calculated and the Spearman’s nonparametric correlation coefficient was used to estimate the goodness of fit.
In order to test the effect of decreasing spatial resolution of the estuary channel mask on the MorphEst outputs, the original 30 m channel masks were resampled to a resolution of 60, 90, and 120 m for 22 channel masks as described in [38]. Then, total estuarine surface area in 1985 and 2015, estuarine surface area net change between 1985 and 2015, and the average shape value were calculated and compared for 22 channel masks with different pixel resolution.
In many cases, the run-time of ArcGIS-based calculations, especially centerline creation, exceeded the run-time of calculations using the MorphEst package. For example, area change and shape calculations of the 4972 pixel × 4811 pixel channel mask of Han River (Figure 2) using MorphEst required approximately 10 min, whereas the same calculations using manual processing in ArcGIS required several hours.

3. Results

3.1. Validation and Sensitivity of MorphEst Measurements

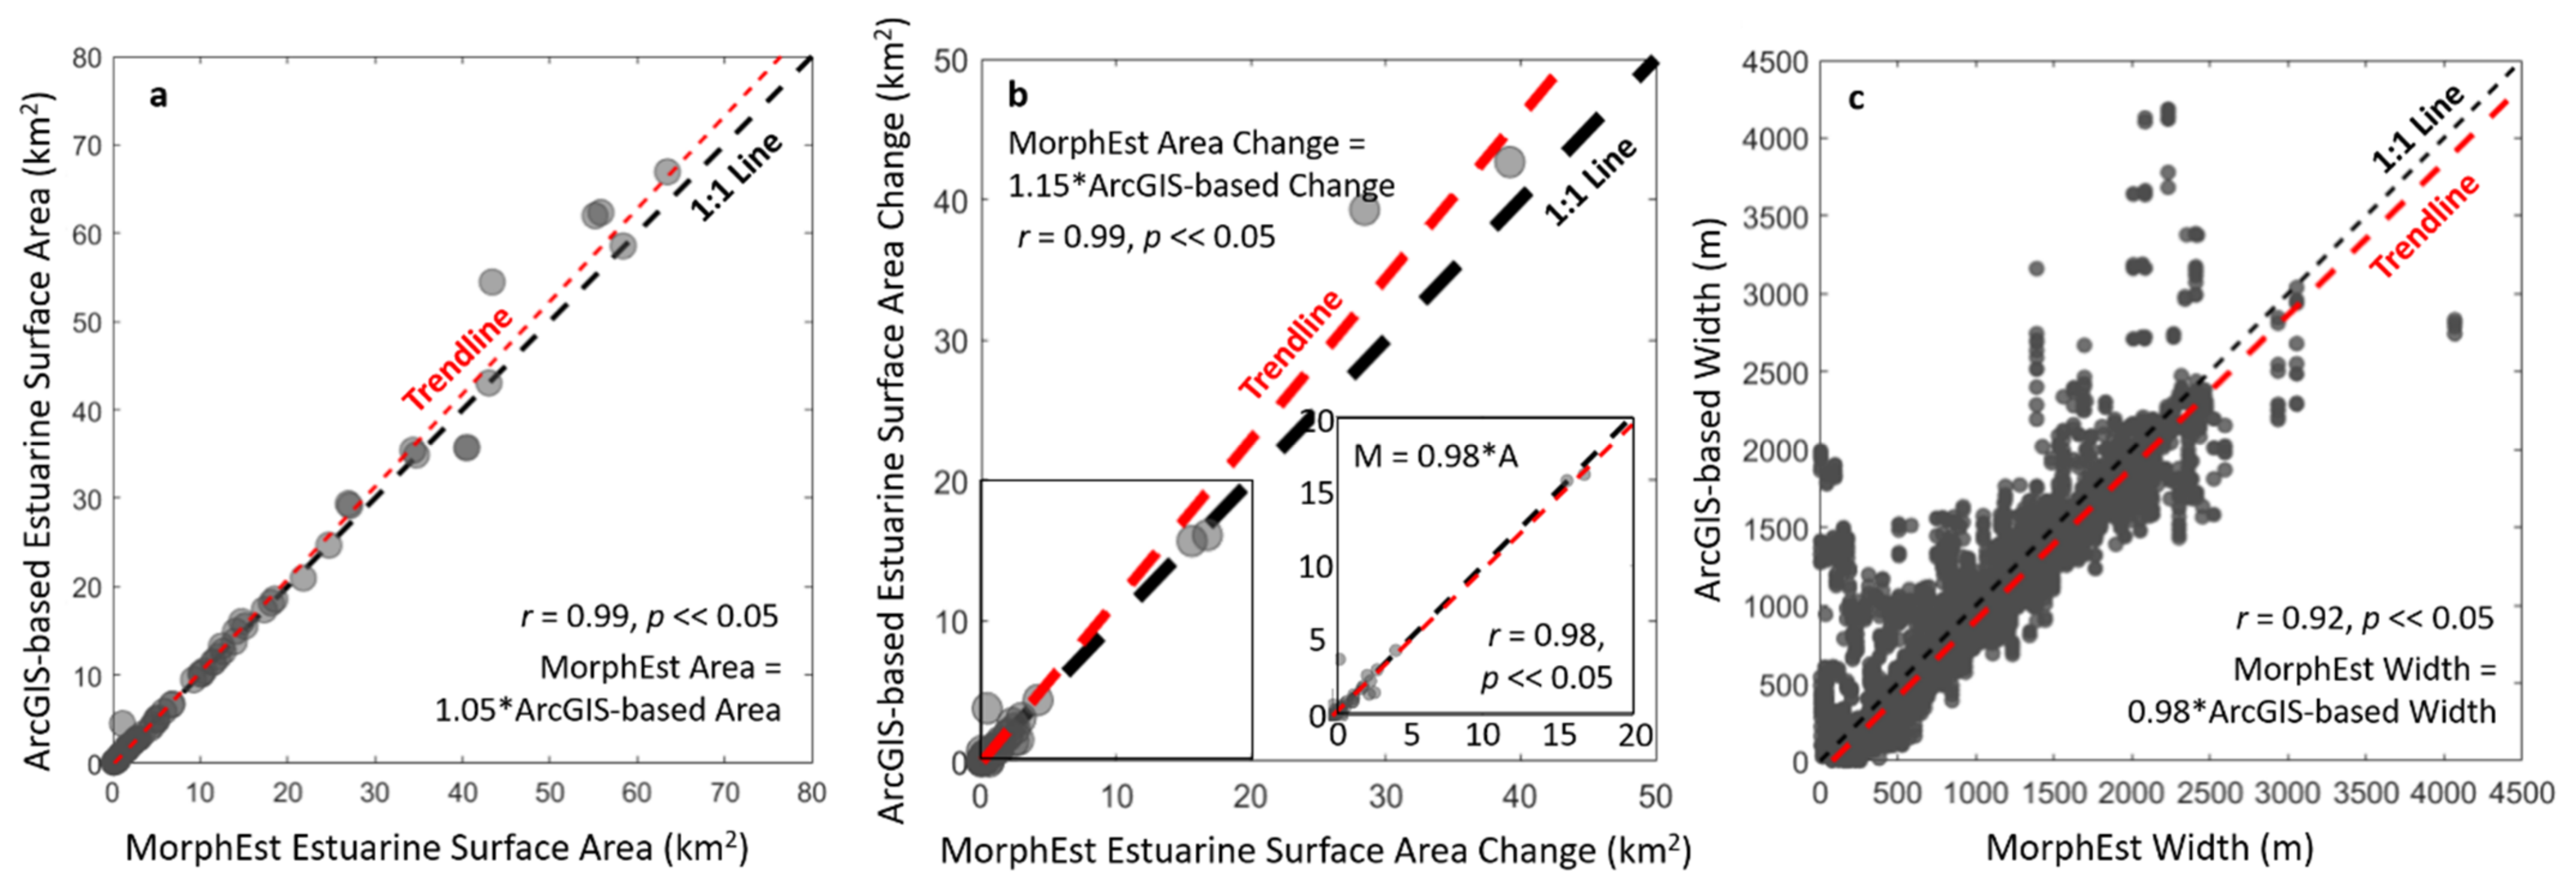
All data is displayed in Supplementary Tables S1–S3. Estuarine surface area and estuarine surface area change computed using MorphEst closely matched ArcGIS-based measurements (area: r = 0.99, p ≪ 0.05; area change: r = 0.98, p ≪ 0.05) (Figure 6a,b). On average, MorphEst correctly estimated 98% of both the manually measured estuarine surface area and area change, respectively. The NSE coefficients were 0.98 for estuarine surface area and 0.95 for estuarine surface area change, and lie within the range of previous NSE coefficients estimated for river channel area change (e.g., 0.63–1.00 [41]). Inconsistencies between the two approaches were mainly from the inaccurate manual measurement of the centerline and estuarine length using the ArcGIS-based approach. These results suggest that MorphEst-generated area measurements agree well with manual estimates.
MorphEst width measurements were closely related with ArcGIS-based estimates (r = 0.92, p ≪ 0.05) (Figure 6c). On average, MorphEst correctly estimated 82% of the manually measured width values. The NSE coefficient was 0.82 and lies within the range of previous NSE coefficients estimated for river width (e.g., 0.06–1.00 [41]). Regression of MorphEst widths and ArcGIS-based estimates yields a slope that deviates by 2% from unity. The goodness of fit and slope deviations of the four Korean estuaries analyzed here were similar to those reported in other width studies of river channels (e.g., r = 0.83 [40], r = 0.74–0.85 [45]; <1% deviation [44]; 3–16% deviation [40]), but tend to deviate in regions with small channel branches. The ArcGIS Transect tool requires the input of one pre-defined transect length, which is applied to all transects throughout the entire estuary so that transects in narrower regions may crossover to smaller branches. Comparisons between width estimates along the main channel and estimates of smaller branches within a distance of less than 300 m then result in an overestimation of MorphEst widths (Figure 6c). On average, these results suggest that MorphEst provides a good representation of channel widths, which can then be used to calculate estuarine shape.
Sensitivity analyses showed that decreasing pixel size results in only small changes in total estuarine surface area in 1985 and 2015, net area change, and average shape (Table 4). Although total area in 1985 and 2015 and average shape somewhat increased with pixel size, differences in net area change were minimal (maximum change less than 6%). Together, these results suggest that the accuracy of MorphEst only slightly decreased with decreasing pixel size, and that MorphEst can capture the overall trend of area change regardless of the resolution of the input channel mask.

3.2. Surface Area Change of South Korean Estuaries between 1985 and 2015

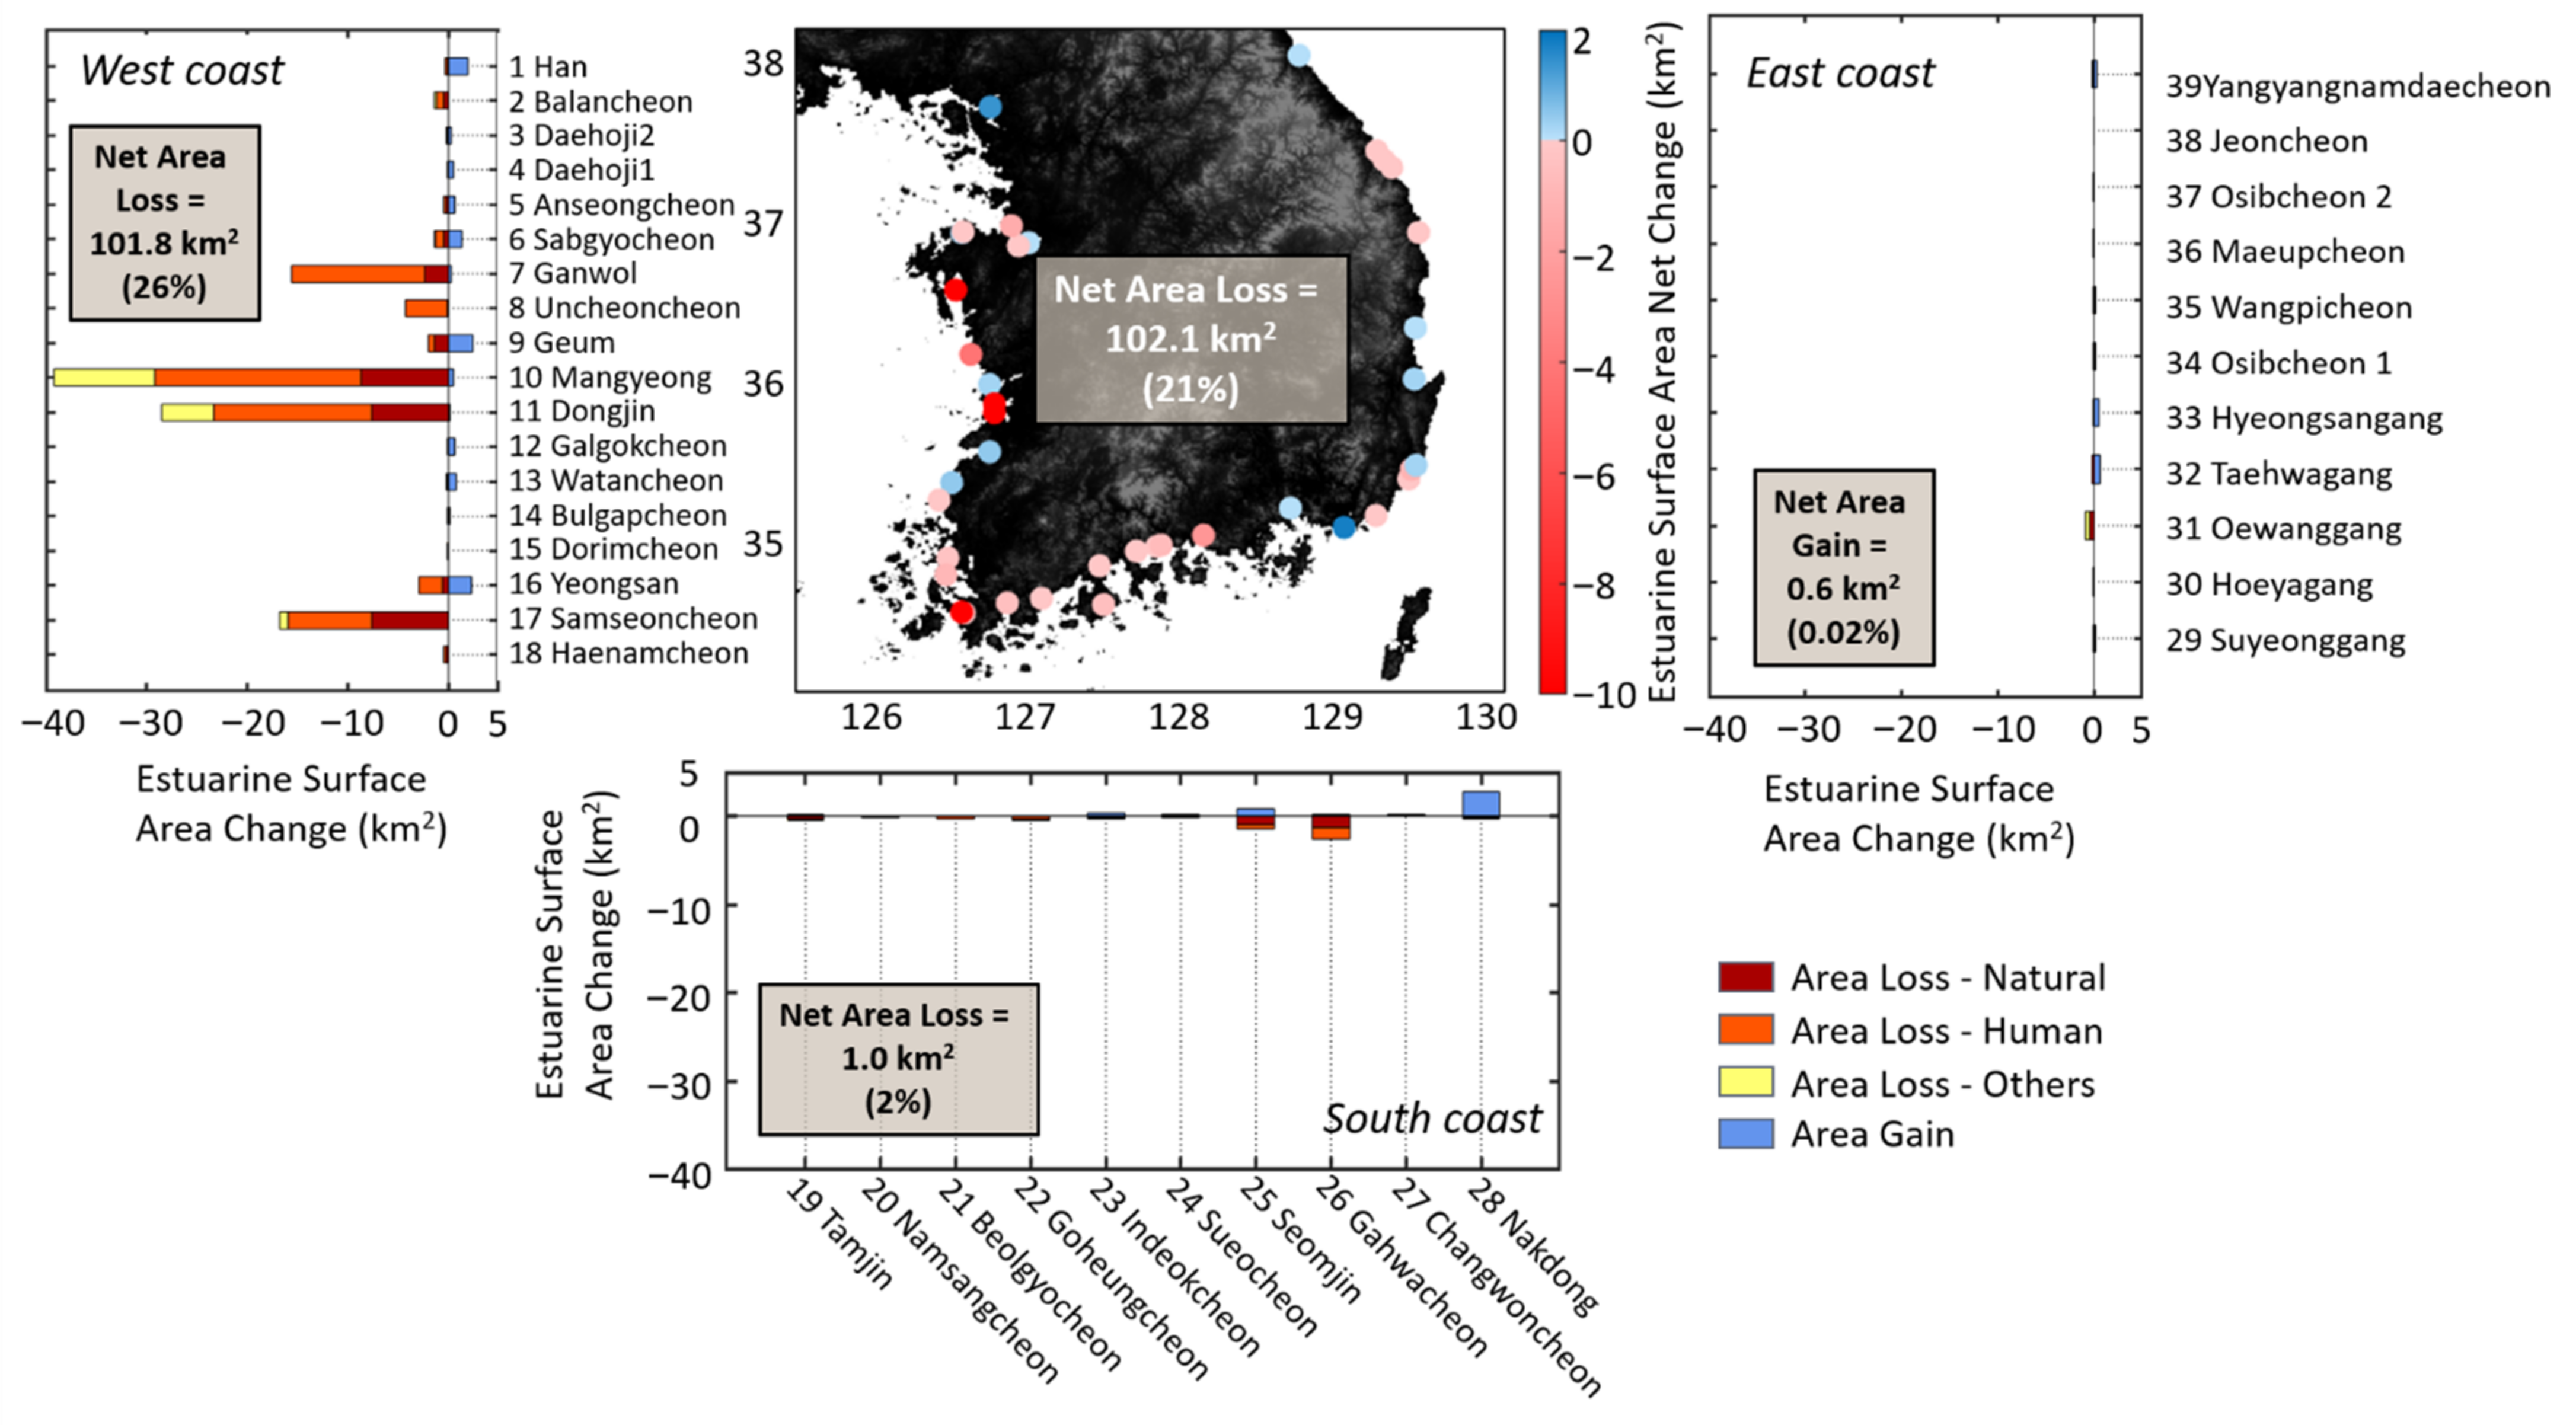
Estuaries in 1985 included 487.7 ± 17.7 (1 SD) km2 of surface water, and the same estuaries included 385.4 ± 13.6 km2 of surface water in 2015 (Supplementary Table S2). Estuarine surface area along the west coast of South Korea was 398.5 ± 21.3 and 296.7 ± 16.6 km2 in 1985 and 2015, respectively, while it was 58.4 ± 5.3 and 57.4 ± 5.4 km2 in 1985 and 2015, respectively, along the south coast. On the other hand, estuarine surface area along the east coast was 30.8 ± 5.1 and 31.3 ± 5.1 km2 in 1985 and 2015, respectively (Supplementary Table S2). Overall, the total extent of estuaries along the South Korean peninsula has decreased throughout the last thirty years (Figure 7). Estuarine surface area loss exceeded surface area gain along all three Korean coasts, where the majority of change occurred along the west coast of South Korea. Summed across the entire country, 18.9 ± 0.7 km2 of new estuarine surface area was created and 121.2 ± 8.2 km2 of estuarine surface area was lost, resulting in a total net area loss of about 102.1 ± 8.2 km2 or 21%.
Net change in estuarine surface area differed widely between individual estuarine systems (Supplementary Table S2). For example, a maximum loss of ~77% of estuarine surface area was observed for Haenamcheon (#18 on Figure 7), while a maximum gain of ~188% of estuarine surface area was observed for Galgokcheon (#12 on Figure 7). Eleven out of 39 estuaries had area gain exceeding 10%, 12 estuaries had area loss exceeding 10%, and 16 estuaries showed a net change of less than 10%. Overall, estuarine surface area loss ranged between 0.01 and 39.2 km2 with area loss peaking along the middle portions of the west coast and the smallest area loss occurring along the east coast of South Korea (Figure 7). Estuarine surface area gain ranged between 0.02 and 2.8 km2 with the largest area gain also occurring along the middle portions of the west coast and the smallest area gain occurring along the east coast.
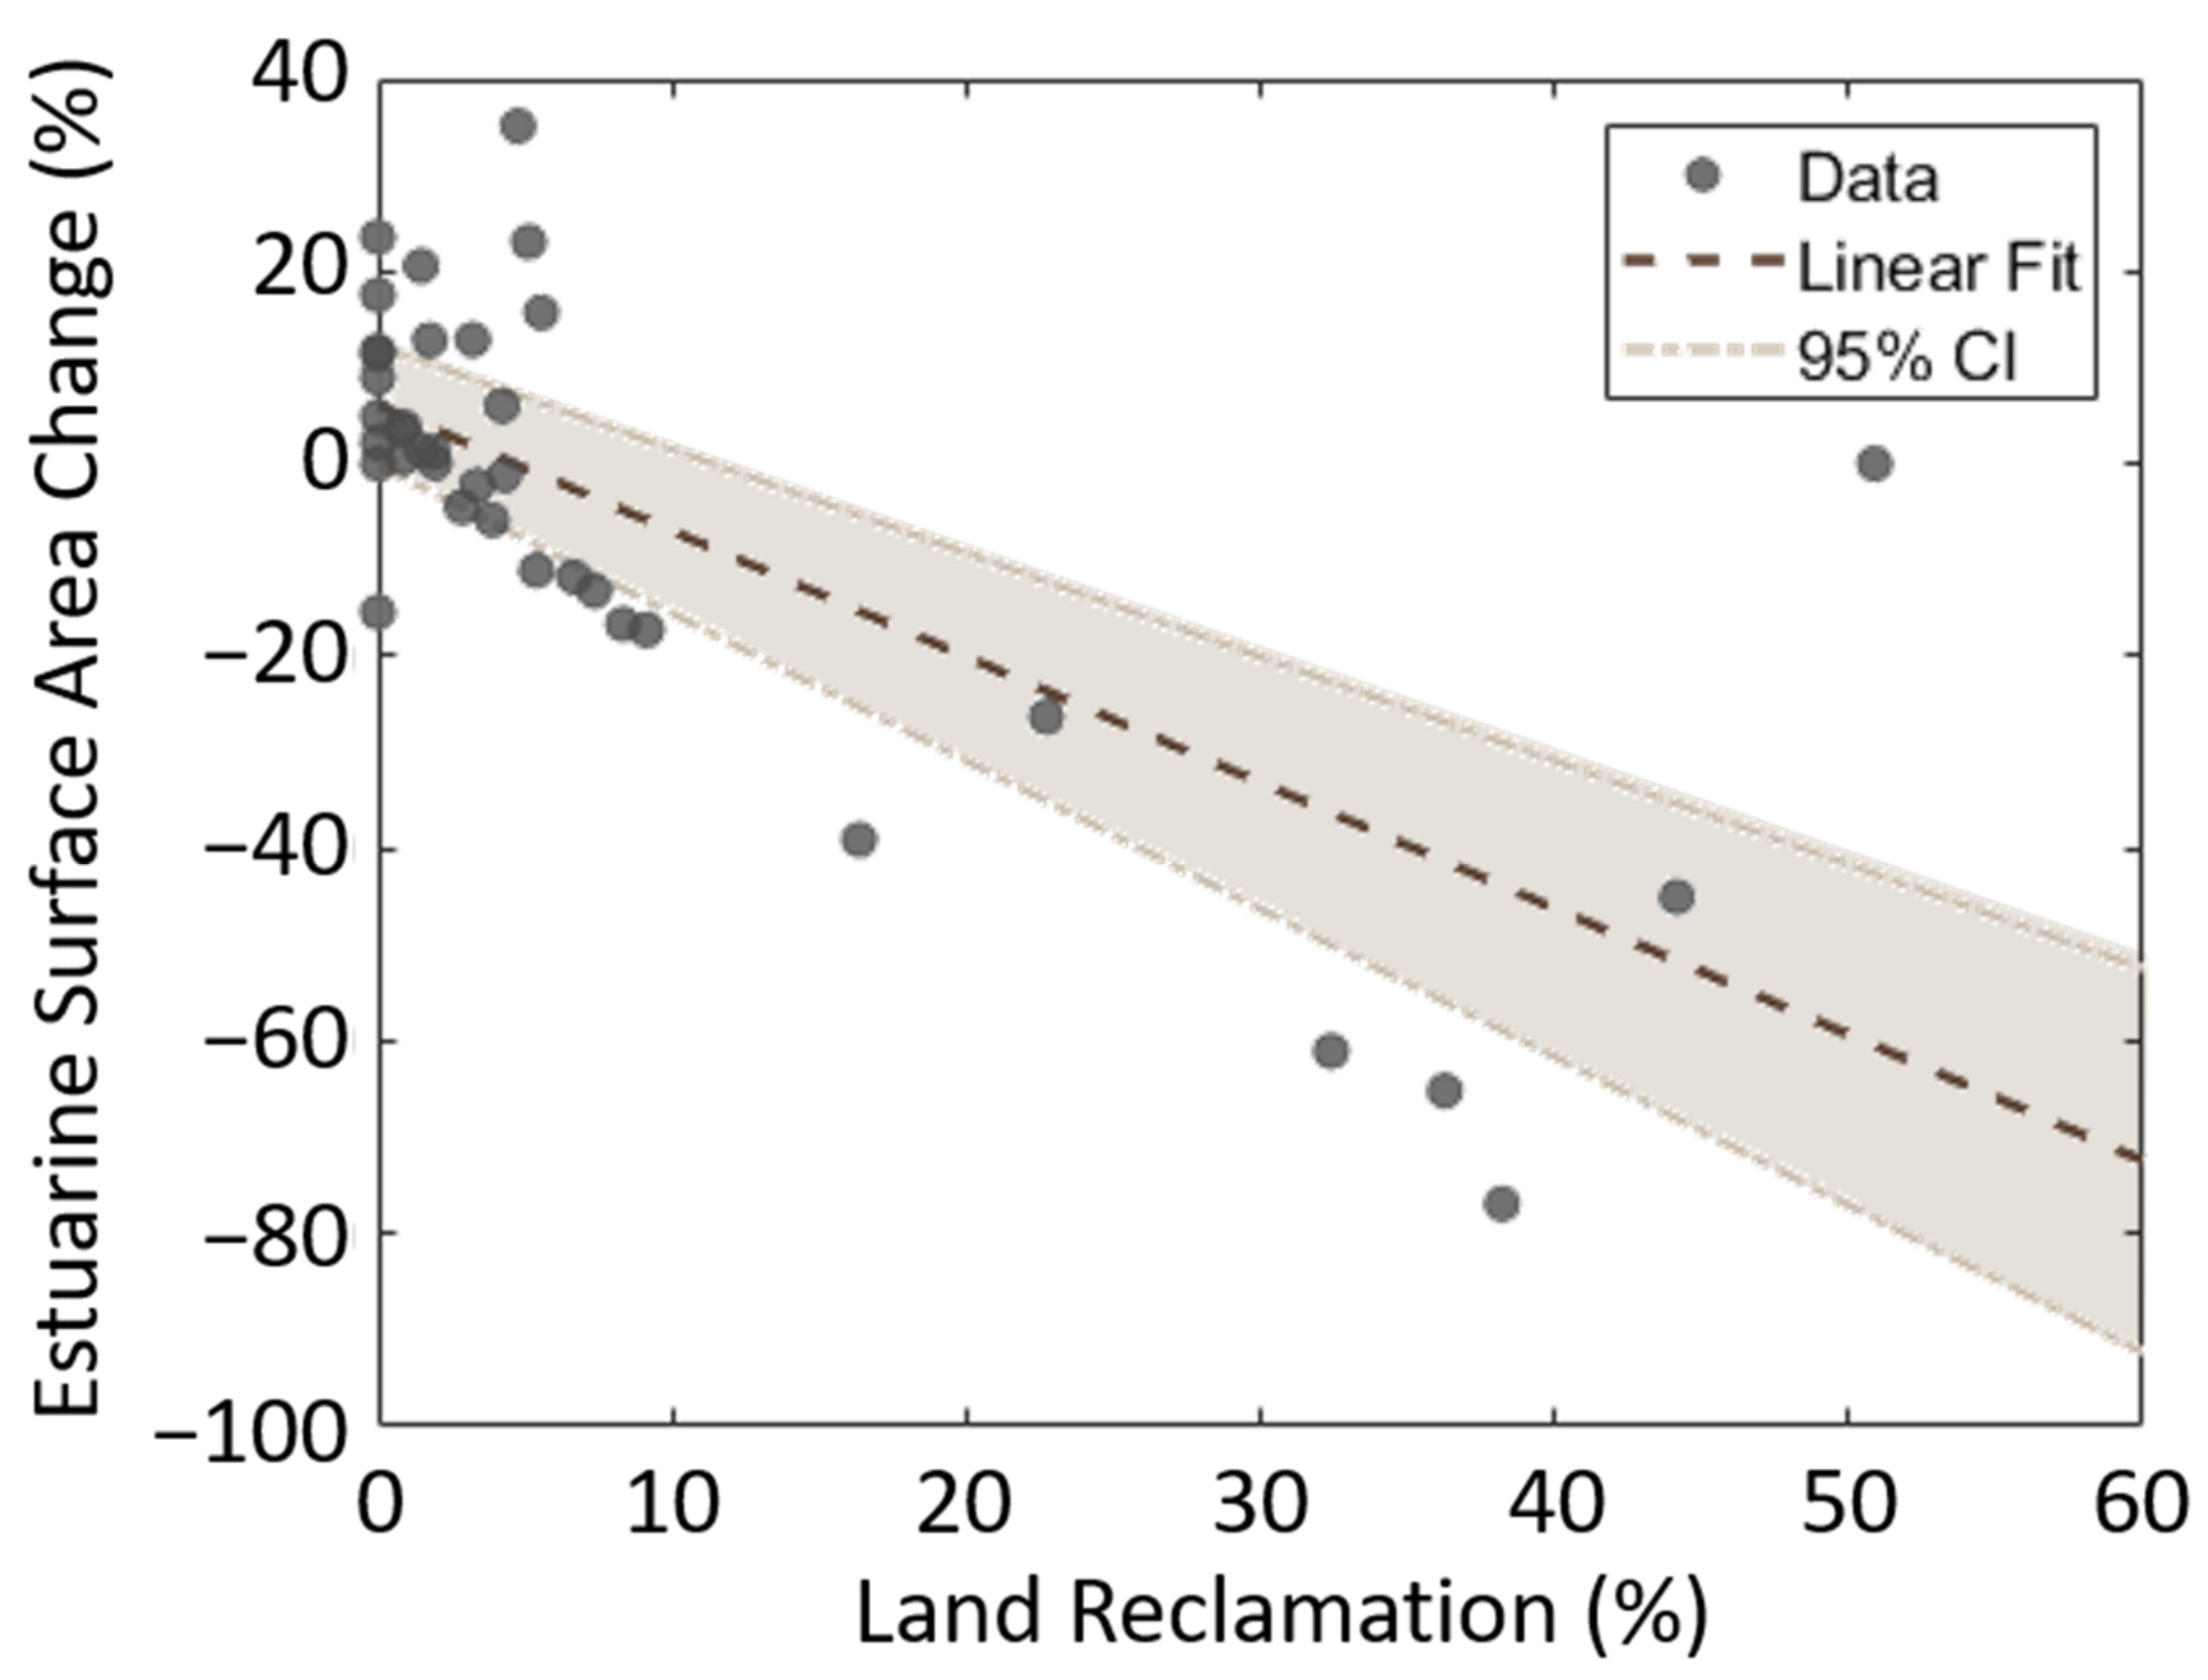
Estuarine surface area loss was 58% due to human-induced causes, 28% due to natural causes, and 14% due to other reasons (Figure 7). Natural area loss ranged between 0.01 and 8.6 km2 and was most prominent along the west coast. Human-induced area loss varied between 0 and 20.6 km2 and mostly occurred along the middle portions of the west coast. Overall, approximately 33.6 km2 of estuarine surface area were lost naturally due to sediment accretion, while human alterations resulted in the loss of about 70.1 km2 of estuarine surface area. Simple linear regression indicated a negative relationship between estuarine surface area change and land reclamation (r = −0.72, p ≪ 0.05) (Figure 8). In general, both estuarine surface area expansion and contraction mainly occurred along the west coast of South Korea, which is generally characterized as a gently sloped macrotidal environment with several large estuaries (Figure 5).

3.3. Shape Distribution of South Korean Estuaries

The shape of Korean estuaries varied substantially throughout the entire peninsula, ranging from funnel-shaped (Sb = 1.2) to straight (Sb = 7 × 10⁵) (Figure 9; Supplementary Table S3). The smallest shape value was observed for Changwoncheon (#27 on Figure 5), which is located along the south coast of Korea, whereas the largest shape value was found in the Galgokcheon (#12 on Figure 5) estuary along the west coast. Twenty-one out of 39 estuaries had shape values less than 10, 15 out of 39 estuaries had shape values between 10 and 100, and 3 out of 39 estuaries had shape values larger than 100. Simple linear regression indicated no relationship between estuarine shape and land reclamation (p ≫ 0.1) (not shown). Overall, estuaries along the tide-dominated west coast were generally more funnel-shaped compared to straighter estuaries along the wave-dominated east coast of Korea.

4. Discussion

4.1. Land Reclamation as Main Driver of Estuarine Surface Area Loss

Our results that Korean estuaries have decreased in surface area over the last three decades is consistent with previous findings that identified Korean tidal flats as vulnerable to human impacts such as land reclamation. Tidal flats along the west coast of Korea, for example, are well recognized to be disappearing as a result of urban, industrial, and agricultural land reclamation [32,67]. Approximately 83.1% of the area reclaimed by the Korea Rural Community Cooperation since 1970 was located along the west coast [67], with a total loss of 1606.7 km2 since the 1970s [67] and 572.5 km2 since the early 1980s [32]. Although many differences between methods and study site extent could be responsible for the disparity, our estuarine surface area loss measurements (121.2 km2 between 1985 and 2015) are likely lower than previous estimates since this study mostly includes estuarine environments, whereas previous work focused on tidal flats along the entire west coast of Korea including regions outside of estuaries (e.g., Incheon Airport). Nevertheless, our results suggest that land reclamation has led to approximately 60% of the observed estuarine surface area loss and that estuarine environments are sensitive to human alterations.

4.2. Human Impacts on the Shape of South Korean Estuaries

Estuarine morphology is widely considered to reflect the relative importance of wave, tide, and river forcing [20,21,22,23,24,25]. Tide-dominated estuaries tend to widen downstream [24] and therefore exhibit a funnel-shape [26], whereas wave- and river-dominated estuaries are more likely to be straight as occasional large fluvial floods transport sediment to the mouth [27]. Although Korean estuaries generally followed this trend, where estuaries along the tide-dominant west coast tend to be funnel-shaped compared to straight estuaries along the wave-dominated east coast, the shape of some estuaries was variable compared to the shape that would be predicted based on the dominant forcing due to human development (Figure 9). Land reclamation, for example, may increase estuarine shape and lead to channel straightening to the effect that their shape more closely resembles a wave- or river-dominated estuary. A similar relationship was observed along the Nakdong estuary, where anthropogenic alterations have resulted in a shift from a tide-dominated to a wave-dominated estuary [9].
There was no significant relationship between estuarine shape and the amount of land reclamation (p ≫ 0.1) (not shown). Land-use-derived land reclamation estimates may therefore not be sufficiently accurate to identify correlations between human constructions and estuarine spatial features. In particular, our land reclamation estimates simply state the relative amount of lost estuarine surface area that has turned into urban or agricultural land, rather than the position within the estuary. Figure 10 shows the position of land reclamation within an estuary along the west coast of South Korea, which is a site where land reclamation along the upstream portions of the estuary has resulted in an overall funneling rather than the expected straightening. On the other hand, land reclamation close to the estuary mouth generally leads to channel straightening. Our findings therefore emphasize that estuarine shape is largely controlled by the dominant forcing and that human alterations, such as land reclamation, may lead to changes in the overall estuarine planform geometry.

4.3. Future Research

South Korean estuaries represent a good example of how human alterations have historically altered estuarine spatial attributes. Land reclamation has resulted in the loss of estuarine surface area along the South Korean peninsula, but it is unclear how the balance between human-induced and natural change affects estuarine shape. Our results therefore suggest that there are important limitations to simple land reclamation estimates and that more process-based studies are needed to discern the role of coastal development and natural processes in determining estuarine shape. Future work should therefore focus on determining the location of land reclamation within the estuary to clearly distinguish between the straightening and funneling effects of human development. Additionally, because Korean estuaries are considered to be altered, further research focusing on more natural environments is needed to emphasize the relative importance of the dominant forcing such as waves, tides, and river discharge.

5. Conclusions

This study presents MorphEst, the first toolbox that automatically measures estuarine planform geometry including estuarine length, estuarine convergence length, shape, and estuarine surface area change due to natural or human factors. The accuracy of MorphEst was validated with ArcGIS-based area change and width measurements, suggesting that MorphEst accurately estimates estuarine surface area, area change, and shape. Our results showed that large-scale land reclamation projects during the last thirty years have resulted in the loss of estuarine surface area along the South Korean peninsula so that the size and shape of Korea’s modern-day estuaries largely deviate from what may be expected based on the natural forcing. Overall, MorphEst will help to improve the ability to solve research questions associated with estuarine morphological evolution as it introduces a tool to efficiently measure estuarine spatial features from remotely sensed imagery.

Supplementary Materials

The following are available online at https://www.mdpi.com/2072-4292/13/2/330/s1, Table S1: Summary of estuary properties, Table S2: Summary of natural and human-induced estuarine surface area change, Table S3: Summary of estuarine convergence. The source code, information about all publicly available data required as input for MorphEst, and example files are available in the Supplementary Material.

Author Contributions

G.-h.L. designed the project; N.W.J., Y.J., and T.-C.J. developed the toolbox; J.C. and S.M.F. modified the toolbox, N.W.J. and K.D.L. designed the figures, N.W.J. and G.-h.L. wrote the paper. All authors have read and agreed of the published version of the manuscript.

Funding

This research was supported by Basic Science Research Program (2017R1D1A1B05033162) and Center for Anthropocene Studies (2018R1A5A7025409) through the National Research Foundation of Korea (NRF).

Acknowledgments

We would like to thank the two anonymous reviewers and the academic editor for their constructive comments that helped to improve the paper.

Conflicts of Interest

The authors declare no conflict of interest.

References

  1. Kennish, M.J. Environmental threats and environmental future of estuaries. Environ. Conserv. 2002, 29, 78–107. [Google Scholar] [CrossRef]
  2. McGranahan, G.; Balk, D.; Anderson, B. The rising tide: Assessing the risks of climate change and human settlements in low elevation coastal zones. Environ. Urban. 2007, 19, 17–37. [Google Scholar] [CrossRef]
  3. Lotze, H.K.; Lenihan, H.S.; Bourque, B.J.; Bradbury, R.H.; Cooke, R.G.; Kay, M.C.; Kidwell, S.M.; Kirby, M.X.; Peterson, C.H.; Jackson, J.B.C. Depletion, degradation, and recovery potential of estuaries and coastal seas. Science 2006, 312, 1806–1809. [Google Scholar] [CrossRef]
  4. Cooper, J.A.G. Anthropogenic impacts on estuaries. In Coastal Zones and Estuaries; Ignacio, F., Iribarne, O., Eds.; Eolss Publishers Co Ltd.: Oxford, UK, 2009; p. 523. [Google Scholar]
  5. Byun, D.S.; Wang, X.H.; Holloway, P.E. Tidal characteristic adjustment due to dyke and seawall construction in the Mokpo Coastal Zone, Korea. Estuar. Coast. Shelf Sci. 2004, 59, 185–196. [Google Scholar] [CrossRef]
  6. Syvitski, J.P.M.; Vörösmarty, C.J.; Kettner, A.J.; Green, P. Impact of humans on the flux of terrestrial sediment to the global coastal ocean. Science 2005, 308, 376–380. [Google Scholar] [CrossRef] [PubMed]
  7. Walling, D.E. Human impact on land-ocean sediment transfer by the world’s rivers. Geomorphology 2006, 79, 192–216. [Google Scholar] [CrossRef]
  8. Wang, Y.; Dong, P.; Oguchi, T.; Chen, S.; Shen, H. Long-term (1842–2006) morphological change and equilibrium state of the Changjiang (Yangtze) Estuary, China. Cont. Shelf Res. 2013, 56, 71–81. [Google Scholar] [CrossRef]
  9. Williams, J.; Dellapenna, T.; Lee, G. Shifts in depositional environments as a natural response to anthropogenic alterations: Nakdong Estuary, South Korea. Mar. Geol. 2013, 343, 47–61. [Google Scholar] [CrossRef]
  10. Prandle, D. Estuaries: Dynamics, Mixing, Sedimentation and Morphology; Cambridge University Press: Cambridge, UK, 2009. [Google Scholar]
  11. Church, J.A.; Clark, P.U.; Cazenave, A.; Gregory, J.M.; Jevrejeva, S.; Levermann, A.; Merrifield, M.a.; Milne, G.A.; Nerem, R.S.; Nunn, P.D.; et al. Sea Level Change; PM Cambridge University Press: Cambridge, UK, 2013. [Google Scholar]
  12. Morris, R.K. Geomorphological analogues for large estuarine engineering projects: A case study of barrages, causeways and tidal energy projects. Ocean Coast. Manag. 2013, 79, 52–61. [Google Scholar] [CrossRef]
  13. Kidd, I.M.; Fisher, A.; Chai, S.; Davis, J.A. A scenario-based approach to evaluating potential environmental impacts following a tidal barrage installation. Ocean Coast. Manag. 2015, 116, 9–19. [Google Scholar] [CrossRef]
  14. Kench, P.S. Geomorphology of Australia estuaries: Review and prospect. Austral. Ecol. 1999, 24, 367–380. [Google Scholar] [CrossRef]
  15. Van der Wal, D.; Pye, K.; Neal, A. Long-term morphological change in the Ribble Estuary, northwest England. Mar. Geol. 2002, 189, 249–266. [Google Scholar] [CrossRef]
  16. Tanaka, H.; Nguyen, X.T.; Makoto, U.; Ryutaro, H.; Eko, P.; Mano, A.; Udo, K. Coastal and estuarine morphology changes induced by the 2011 Great East Japan Tsunami. Coast. Eng. 2012, 54, 1250010. [Google Scholar] [CrossRef]
  17. Mulligan, R.P.; Mallinson, D.J.; Clunies, G.J.; Rey, A.; Culver, S.J.; Zaremba, N.; Leorri, E.; Mitra, S. Estuarine responses to long-term changes in inlets, morphology, and sea level rise. J. Geophys. Res. Ocean. 2019, 124, 9235–9257. [Google Scholar] [CrossRef]
  18. Chang, J.; Lee, G.; Harris, C.K.; Song, Y.; Figueroa, S.M.; Schieder, N.W.; Lagamayo, K.D. Sediment transport mechanisms in altered depositional environments of the Anthropocene Nakdong Estuary: A numerical modeling study. Mar. Geol. 2020, 430, 106364. [Google Scholar] [CrossRef]
  19. Figueroa, S.M.; Lee, G.; Chang, J.; Schieder, N.W.; Kim, K.; Kim, S.-Y. Evaluation of along-channel sediment flux gradients in an Anthropocene estuary with an estuarine dam. Mar. Geol. 2020, 429, 106318. [Google Scholar] [CrossRef]
  20. Wright, L.D.; Coleman, J.M. Variations in morphology of major river deltas as functions of ocean wave and river discharge regimes. AAPG Bull. 1973, 57, 370–398. [Google Scholar]
  21. Galloway, W.D. Deltas, Models for Exploration; Broussard, M.L., Ed.; Houston Geological Society: Houston, TX, USA, 1975; pp. 86–98. [Google Scholar]
  22. Gisen, J.I.A.; Savenije, H.H.G. Relationship between estuary shape and hydrodynamics in alluvial estuaries. Geophys. Res. Abstr. 2012, 14, EGU2012–EGU2550. [Google Scholar]
  23. Nienhuis, J.H.; Ashton, A.D.; Giosan, L. What makes a delta wave-dominated? Geology 2015, 43, 511–514. [Google Scholar] [CrossRef] [Green Version]
  24. Nienhuis, J.H.; Hoitink, A.J.F.; Tornqvist, T.E. Future change to tide-influenced deltas. Geophys. Res. Lett. 2018, 45, 3499–3507. [Google Scholar] [CrossRef] [Green Version]
  25. Nienhuis, J.H.; Ashton, A.D.; Edmonds, D.A.; Hoitink, A.J.F.; Kettner, A.J.; Rowland, J.C.; Törnqvist, T.E. Global-scale human impact on delta morphology has led to net land area gain. Nature 2020, 577, 514–518. [Google Scholar] [CrossRef] [PubMed]
  26. Davies, G.; Woodroffe, C.D. Tidal estuary width convergence: Theory and form in North Australian estuaries. Earth Surf. Process. Landf. 2010, 35, 737–749. [Google Scholar] [CrossRef]
  27. Wolanski, E.; Moore, K.; Spagnol, S.; D’Adamo, N.; Pattiaratchi, C. Rapid, human-induced siltation of the macro-tidal Ord River Estuary, Western Australia. Estuar. Coast. Shelf Sci. 2001, 53, 717–732. [Google Scholar] [CrossRef]
  28. Pye, K.; Blott, S.J. The geomorphology of UK estuaries: The role of geological controls, antecedent conditions and human activities. Estuar. Coast. Shelf Sci. 2014, 150B, 196–214. [Google Scholar] [CrossRef]
  29. Bourman, R.P.; Murray-Wallace, C.V.; Belperio, A.P.; Harvey, N. Rapid coastal geomorphic change in the River Murray Estuary of Australia. Mar. Geol. 2000, 170, 141–168. [Google Scholar] [CrossRef]
  30. Blott, S.J.; Pye, K.; Van der Wal, D.; Neal, A. Long-term morphological change and its causes in the Mersey Estuary, NW England. Geomorphology 2006, 81, 185–206. [Google Scholar] [CrossRef]
  31. Luan, H.L.; Ding, P.X.; Wang, Z.B.; Ge, J.Z.; Yang, S.L. Decadal morphological evolution of the Yangtze Estuary in response to river input changes and estuarine engineering projects. Geomorphology 2016, 265, 12–23. [Google Scholar] [CrossRef]
  32. Murray, N.J.; Clemens, R.S.; Phinn, S.R.; Possingham, H.P.; Fuller, R.A. Tracking the rapid loss of tidal wetlands in the Yellow Sea. Front. Ecol. Environ. 2014, 12, 267–272. [Google Scholar] [CrossRef] [Green Version]
  33. Aalto, R.; Lauer, J.W.; Dietrich, W.E. Spatial and temporal dynamics of sediment accumulation and exchange along Strickland River floodplains (Papua New Guinea) over decadal-to-centennial timescales. J. Geophys. Res. 2008, 113, F01S04. [Google Scholar] [CrossRef] [Green Version]
  34. Legg, N.T.; Heimburg, C.; Collins, B.D.; Olson, P.L. The Channel Migration Toolbox: ArcGIS Tools for Measuring Stream; Department of Ecology State of Washington: Bellevue, WA, USA, 2014. [Google Scholar]
  35. Monegaglia, F.; Zolezzi, G.; Güneralp, I.; Henshaw, A.J.; Tubino, M. Automated extraction of meandering river morphodynamics from multitemporal remotely sensed data. Environ. Model. Softw. 2018, 105, 171–186. [Google Scholar] [CrossRef]
  36. Miller, Z.F.; Pavelsky, T.M.; Allen, G.H. Quantifying river form variations in the Mississippi Basin using remotely sensed imagery. Hydrol. Earth Syst. Sci. 2014, 18, 4883–4895. [Google Scholar] [CrossRef] [Green Version]
  37. O’Loughlin, F.; Trigg, M.A.; Schumann, G.J.P.; Bates, P.D. Hydraulic characterization of the middle reach of the Congo River. Water Resour. Res. 2013, 49, 5059–5070. [Google Scholar]
  38. Pavelsky, T.M.; Smith, L.C. RivWidth: A software tool for the calculation of river widths from remotely sensed imagery. IEEE Geosci. Remote. Sens. Lett. 2008, 5, 70–73. [Google Scholar] [CrossRef]
  39. Yamazaki, D.; O’Loughlin, F.; Trigg, M.A.; Miller, Z.F.; Pavelsky, T.M.; Bates, P.D. Development of the global width database for large rivers. Water Resour. Res. 2014, 50, 3467–3480. [Google Scholar] [CrossRef]
  40. Allen, G.H.; Pavelsky, T.M. Patterns of river width and surface area revealed by the satellite-derived North American River Width data set. Geophys. Res. Lett. 2015, 42, 395–402. [Google Scholar] [CrossRef]
  41. Rowland, J.C.; Shelef, E.; Pope, P.A.; Muss, J.; Gangodagamage, C.; Brumby, S.P.; Wilson, C.J. A morphology independent methodology for quantifying planview river change and characteristics from remotely sensed imagery. Remote Sens. Environ. 2016, 184, 212–228. [Google Scholar] [CrossRef] [Green Version]
  42. Schwenk, J.; Khandelwal, A.; Fratkin, M.; Kumar, V.; Foufoula-Georgiou, E. High spatiotemporal resolution of river planform dynamics from Landsat: The RivMAP toolbox and results from the Ucayali River. Earth Space Sci. 2016, 4, 46–75. [Google Scholar] [CrossRef]
  43. Yang, X.; Pavelsky, T.M.; Allen, G.H.; Donchyts, G. RivWidthCloud: An automated Google Earth Engine algorithm for river width extraction from remotely sensed imagery. IEEE Geosci. Remote. Sens. Lett. 2020, 17, 217–221. [Google Scholar] [CrossRef]
  44. Fisher, G.B.; Bookhagen, B.; Amos, C.B. Channel planform geometry and slopes from freely available high-spatial resolution imagery and DEM fusion: Implications for channel width scalings, erosion proxies, and fluvial signatures in tectonically active landscapes. Geomorphology 2013, 194, 46–56. [Google Scholar] [CrossRef]
  45. Isikdogan, F.; Bovik, A.; Passalacqua, P. RivaMap: An automated river analysis and mapping engine. Remote Sens. Environ. 2017, 202, 88–97. [Google Scholar] [CrossRef]
  46. McFeeters, S. The use of the Normalized Difference Water Index (NDWI) in the delineation of open water features. Int. J. Remote Sens. 1996, 17, 1425–1432. [Google Scholar] [CrossRef]
  47. Schowengerdt, R. Remote Sensing: Models and Methods for Image Processing, 2nd ed.; Academic: San Diego, CA, USA, 1997. [Google Scholar]
  48. Brumby, S.P.; Theiler, J.; Perkins, S.J.; Harbey, N.J.; Szymanski, J.J.; Bloch, J.J.; Mitchell, M. Investigation of image feature extraction by a genetic algorithm. In Proceedings of the Applications and Science of Neural Networks, Fuzzy Systems and Evolutionary Computation II, Denver, CO, USA, 18–23 July 1999; SPIE’s International Society for Optics and Photonics: Bellingham, WA, USA, 1999; pp. 24–31. [Google Scholar]
  49. Dillabaugh, C.R.; Niemann, K.O.; Richardson, D.E. Semi-automated extraction of rivers from digital imagery. GeoInformatica 2002, 6, 263–284. [Google Scholar] [CrossRef]
  50. Quackenbush, L.J. A review for techniques for extracting linear features from imagery. Photogramm. Eng. Remote Sens. 2004, 70, 1383–1392. [Google Scholar] [CrossRef] [Green Version]
  51. Canty, M.J. Image Analysis, Classification, and Change Detection in Remote Sensing: With Algorithms for ENVI/IDL; CRC Press: Boca Raton, FL, USA, 2006. [Google Scholar]
  52. Xu, H. Modification of normalized difference water index (NDWI) to enhance open water features in remotely sensed imagery. Int. J. Remote Sens. 2006, 27, 3025–3033. [Google Scholar] [CrossRef]
  53. Hamilton, S.K.; Kellndorfer, J.; Lehner, B.; Tobler, M. Remote sensing of floodplain geomorphology as a surrogate for biodiversity in a tropical river system (Madre de Dios, Peru). Geomorphology 2007, 89, 23–38. [Google Scholar] [CrossRef]
  54. Merwade, V.M. An automated GIS procedure for delineating river and lake boundaries. Trans. GIS 2007, 11, 213–231. [Google Scholar] [CrossRef]
  55. Zolezzi, G.; Luchi, R.; Tubino, M. Modeling morphodynamics processes in meandering rivers with spatial width variations. Rev. Geophys. 2012, 50. [Google Scholar] [CrossRef] [Green Version]
  56. Dey, A.; Bhattacharya, R.K. Monitoring of river center line and width—A study on river Brahmaputra. J. Indian Soc. Remote Sens. 2013, 42, 1–8. [Google Scholar] [CrossRef]
  57. Marra, W.A.; Kleinhans, M.G.; Addink, E.A. Network concepts to describe channel importance and change in multichannel systems: Test results for the Jamuna River, Bangladesh. Earth Surf. Process. Landf. 2014, 39, 766–778. [Google Scholar] [CrossRef]
  58. Prandle, D. How tides and river flows determine estuarine bathymetries. Prog. Oceanogr. 2004, 61, 1–26. [Google Scholar] [CrossRef]
  59. Prandle, D. Relationships between tidal dynamics and bathymetry in strongly convergent estuaries. J. Phys. Oceanogr. 2003, 33, 2738–2750. [Google Scholar] [CrossRef]
  60. Savenije, H.; Toffolon, M.; Haas, J.; Veling, E.J.M. Analytical description of tidal dynamics in convergent estuaries. J. Geophys. Res. 2008, 113, C10025. [Google Scholar] [CrossRef]
  61. Dronkers, J. Convergence of estuarine channels. Cont. Shelf Res. 2017, 144, 120–133. [Google Scholar] [CrossRef]
  62. Shin, H.C.; Kohl, C.-H. Distribution and abundance of ophiuroids on the continental shelf and slope of the East Sea (southwestern Sea of Japan), Korea. Mar. Biol. 1993, 115, 393–399. [Google Scholar] [CrossRef]
  63. Wells, J.T.; Adams, C.E., Jr.; Park, Y.-A.; Frankenberg, E.W. Morphology, sedimentology and tidal channel processes on a high-tide-range mudflat, west coast of South Korea. Mar. Geol. 1990, 95, 111–130. [Google Scholar] [CrossRef]
  64. National Atlas of Korea, Ocean Currents. Available online: http://nationalatlas.ngii.go.kr/pages/page_1274.php (accessed on 5 December 2020).
  65. Williams, J.; Dellapenna, T.; Lee, G.; Louchouarn, P. Sedimentary impacts of anthropogenic alterations on the Yeongsan Estuary, South Korea. Mar. Geol. 2014, 357, 256–271. [Google Scholar] [CrossRef]
  66. Lee, K.-H.; Rho, B.-H.; Cho, H.-J.; Lee, C.-H. Estuary classification based on the characteristics of geomorphological features, natural habitat distributions and land uses. Sea 2011, 16, 53–69. [Google Scholar] [CrossRef] [Green Version]
  67. Choi, Y.R. Modernization, development and underdevelopment: Reclamation of Korean tidal flats, 1950s-2000s. Ocean Coast. Manag. 2014, 102, 426–436. [Google Scholar] [CrossRef]
  68. Koh, C.-H.; Khim, J.S. The Korean tidal flat of the Yellow Sea: Physical setting, ecosystem and management. Ocean Coast. Manag. 2014, 102, 398–414. [Google Scholar] [CrossRef]
  69. Yoo, S.-C.; Suh, S.-W. Simulation of environmental changes considering sea-level rise near a mega-scale coastal dike (Saemangeum [SMG] Dike, Korea). J. Coast. Res. 2020, 95, 309–314. [Google Scholar] [CrossRef]
  70. Tozer, B.; Sandwell, D.T.; Smith, W.H.; Olson, C.; Beale, J.R.; Wessel, P. Global bathymetry and topography at 15 arc sec: SRTM15+. Earth Space Sci. 2019, 6, 1847–1864. [Google Scholar] [CrossRef]
  71. Pekel, J.-F.; Cottam, A.; Gorelick, N.; Belward, A.S. High-resolution mapping of global surface water and its long-term changes. Nature 2016, 540, 418–422. [Google Scholar] [CrossRef] [PubMed]
  72. Lyard, F.; Lefevre, F.; Letellier, T.; Francis, O. Modelling the global ocean tides: Modern insights from FES2004. Ocean Dyn. 2006, 56, 394–415. [Google Scholar] [CrossRef]
  73. Yates, M.G.; Clarke, R.T.; Swetnma, R.D.; Eastwood, J.A.; Durell, S.E.A.; West, J.R.; Goss-Custard, J.D.; Clarke, N.A.; Remfish, M. Estuaries, Sediments and Shorebirds. 1. Determinants of the Intertidal Sediments of Estuaries; Institute of Terrestrial Ecology: Monks Wood, UK, 1996. [Google Scholar]
  74. Savenije, H. Salinity and Tides in Alluvial Estuaries; Elsevier: Amsterdam, The Netherlands, 2005. [Google Scholar]
  75. Lamarche, C.; Santoro, M.; Bontemps, S.; d’Andrimont, R.; Radoux, J.; Giustarini, L.; Brockmann, C.; Wevers, J.; Defourny, P.; Arino, O. Compilation and validation of SAR and optical data products for a complete and global map of inland/ocean water tailored to the climate modeling community. Remote Sens. 2017, 9, 36. [Google Scholar] [CrossRef] [Green Version]
  76. Nash, J.E.; Sutcliffe, J.V. River flow forecasting through conceptual models part I—A discussion of principles. J. Hydrol. 1970, 10, 282–290. [Google Scholar] [CrossRef]
  77. Moriasi, D.; Arnold, J.; Van Liew, M.W.; Bingner, R. Model evaluation guidelines for systematic quantification of accuracy in watershed simulations. Trans. ASABE 2007, 50, 885–900. [Google Scholar] [CrossRef]
  78. Dilts, T.E. Polygon to Centerline Tool for ArcGIS. University of Nevada Reno. Available online: http://www.arcgis.com/home/item.html?id=bc642731870740aabf48134f90aa6165 (accessed on 21 July 2018).
  79. Cooley, S.W. Perpendicular Transects (Ferreira). Available online: http://gis4geomorphology.com/stream-transects-partial/ (accessed on 28 July 2018).
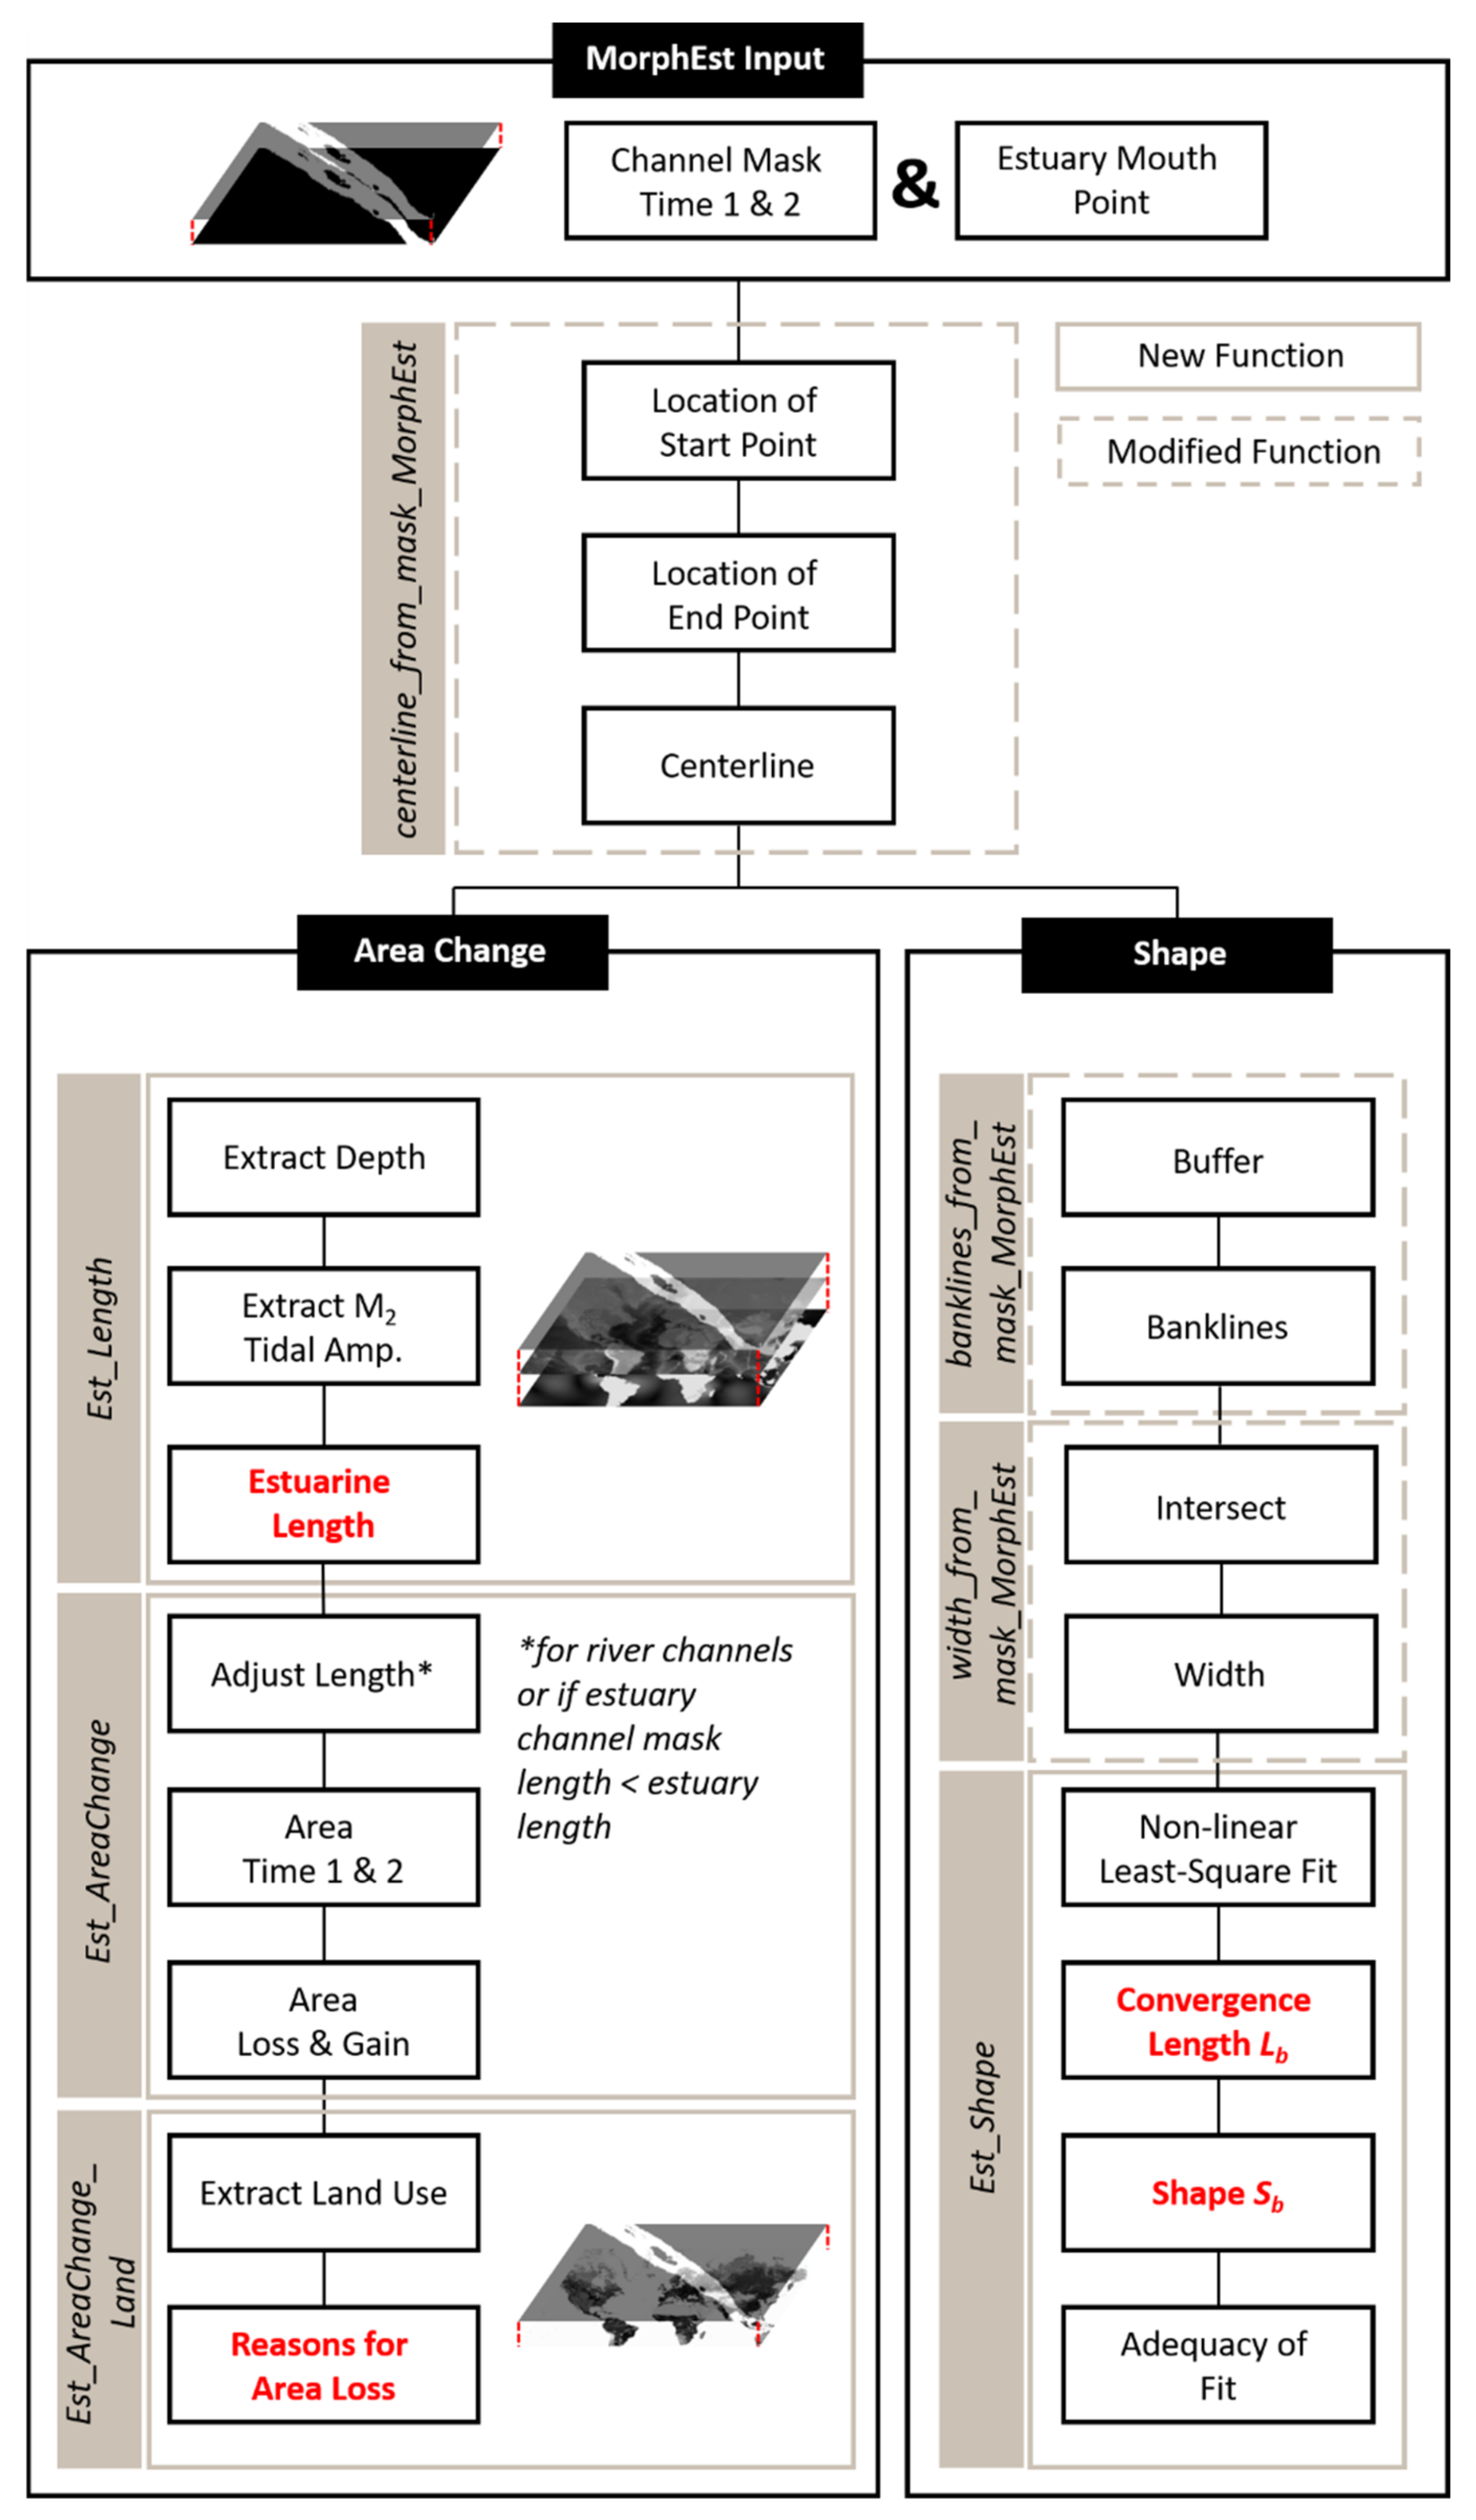
Figure 1. MorphEst workflow. Bold, red fields indicate newly developed functions implemented in MorphEst (Table 1 and Table 2). Methods for centerline creation, area change, convergence length, and shape are displayed in Figures 2–4, respectively.
Remotesensing 13 00330 g001
Figure 2. Centerline. Results are from Han River, South Korea, which show how MorphEst can be applied to estuaries with several branches. (a) Columns and rows with no channel mask pixels along the edge of the raster are deleted so that the channel mask directly intersects with the raster edge. (b) The location of the start point is based on the input estuary mouth point, and the location of the potential end points is determined by the intersection of the channel mask and the raster edges. MorphEst picks the final end point for channels, with the largest length (L) and width (W). Here, L1 indicates the centerline length between the start point and end point 1, L2 indicates the centerline length between the start point and end point 2, etc. W1 is the width at end point 1, W2 is the width at end point 2, etc. The cardinal directions of the start and end point are determined based on their location within the pre-defined triangles (blue lines). MorphEst then creates a centerline with the input cardinal directions determined by the start and end point location. (c) Estuarine surface area is measured within a buffer with a radius (r) defined by the straight line connecting the along-channel estuarine length (L) and the estuary mouth. (d) Buffers are drawn along the centerline with a radius defined by the width of the estuary mouth. Channel pixels outside of the buffer are then erased.
Remotesensing 13 00330 g002
Figure 3. Area change and cause of area change. Results are from Ganwol Estuary, South Korea, which is an estuary that has been heavily altered due to land reclamation over the last thirty years. (a). Channel mask at time 1, time 2, and overlapping area. If the dataset length is less than the estuarine length and if the length of the two datasets (L1 = length of estuary at time 1 and L2 = length of estuary at time 2) is different, the upstream extent of the longer dataset is adjusted to the length of the shorter channel mask. (b) Regions of areal gain and loss are calculated by subtracting the channel mask at time 2 from the channel mask at time 1. (c). Cause of estuarine surface area loss. Land-use is determined for areas of estuarine surface area loss, where areas classified as urban or agriculture are defined as human-induced loss and areas classified as grass, barren land, or forest are defined as natural loss. The remaining regions are classified as others due to the difference in the dataset resolution.
Remotesensing 13 00330 g003
Figure 4. Estuarine shape. Results are from Mangyeonggang estuary, South Korea, in 1985 (a) and in 2015 (b). The Mangyeonggang estuary is an example, where land reclamation at the estuary mouth has resulted in channel straightening (i.e., increase in estuarine shape Sb). Estuarine convergence length (Lb) is calculated by fitting nonlinear least-square fit and determining the point, where the channel width is W/e (W = width at channel mouth and e = 2.72) (blue dashed line). Estuarine shape is calculated based on the width at the estuary mouth and the convergence length. r2 indicates the adequacy of the exponential fit.
Remotesensing 13 00330 g004
Figure 5. (a) Location of analyzed South Korean estuaries. Bathymetry is based on SRTM15+ [70]. Numbers indicate individual estuaries, and are arranged from north to south along the west coast, west to east along the south coast, and south to north along the east coast. Satellite images were downloaded from https://earth.esa.int/web/earth-watching/home/-/article/saemangeum-dam-south-korea, and show increasing human modifications for the Saemangeum estuary between 1987 (b) and 2013 (c).
Remotesensing 13 00330 g005
Figure 6. Estuarine surface area and along-channel width validation. (a) Estuarine surface area validation (n = 39). (b) Estuarine surface area change validation (n = 39). The large deviation between the 1:1 line and the regression line results from outliers with area change exceeding 20 km2. The inset shows data points and the regression line with area changes of less than 20 km2. M is MorphEst area change and A is ArcGIS-based area change (c). Along-channel width validation for four major estuaries (n = 3833). Comparisons between MorphEst measurements and ArcGIS-based estimates suggest that MorphEst accurately quantifies estuarine geometry.
Remotesensing 13 00330 g006
Figure 7. Estuarine surface area change along the South Korean peninsula between 1985 and 2015. Cool colors indicate estuarine surface area gain, and warm colors indicate estuarine surface area loss. Percentages in parentheses indicate percent net change relative to the estuaries’ initial size in 1985 summed by coast. Area information for each estuary can be found in Supplementary Table S2. Estuarine surface area loss can be divided into natural, human, and others. Human-induced surface area loss generally includes loss due to agricultural or urban expansion following major land reclamation projects, whereas natural surface area loss includes loss due to sediment accretion. Other surface area loss includes regions misclassified as water due to the different resolution of the land-use dataset and channel mask. Overall, estuarine surface area decreased between 1985 and 2015, with the largest net area loss occurring along the west coast of the Korean peninsula.
Remotesensing 13 00330 g007
Figure 8. Comparison of land reclamation (%) and net change in estuarine surface area (%) between 1985 and 2015. CI indicates a 95% confidence interval. Net estuarine surface area change was negatively correlated with land reclamation (r = −0.72, p ≪ 0.05) so that estuarine surface area tends to contract in areas of large land reclamation projects.
Remotesensing 13 00330 g008
Figure 9. Shape distribution (Sb) of Korean estuaries in 2015. Small estuarine shape values indicate funnel-shaped estuaries, whereas large estuarine shape values indicate straight channels. Overall, estuaries along the tide-dominated west coast of Korea are more funnel-shaped compared to straighter estuaries along the wave-dominated east coast of Korea. Variations in estuarine shape may arise from human alterations such as land reclamation (see Figures 4 and 10).
Remotesensing 13 00330 g009
Figure 10. Importance of the location of land reclamation. Example is shown for Watancheon estuary, where land reclamation further upstream within the estuary has resulted in a decrease in estuarine shape. The yellow outline indicates the estuarine extent in 1985 (a) and 2015 (b), and the red outline shows the location of land reclamation between 1985 and 2015. The location of land reclamation within an estuary determines if an estuary becomes straighter or more funnel-shaped. Land reclamation at the mouth of the estuary generally results in channel straightening (see Figure 4), whereas land reclamation located further upstream results in an overall funneling.
Remotesensing 13 00330 g010
Table 1. Overview of modified and newly developed functions to measure estuarine planform geometry. Superscripts indicate modified functions from RivMAP [42], and bold description indicates added modification. Bold functions indicate newly developed functions.
FunctionsDescription
Modifiedcenterline_from_mask_MorphEst aAutomatically identifies location of start and end point of channel mask and generates centerline
banklines_from_mask_MorphEst bCreates buffer to eliminate side branches outside of the main channel and draws channel bank lines
width_from_mask_MorphEst cCalculates width between bank lines along transects and enables width calculations along N-S directed transects as well
NewEst_LengthCalculates the upstream limit of an estuary based on the depth at the estuary mouth and the M2 tidal amplitude
Est_AreaChangeCalculates areas of surface gain and loss as well as area at time 1 and 2
Est_AreaChange_LandCalculates estuarine surface area lost due to natural (i.e., forest, baren land, grassland) or human (agriculture, urban) causes
Est_ShapeCalculates the length over which the estuarine width decreases, and defines the shape of an estuary (i.e., straight, or funnel-shaped)
Modified from RivMAP’s a centerline_from_mask, b banklines_from_mask, and c width_from_mask functions.
Table 2. Summary of representative channel analysis methods and metrics. Red-colored metrics indicate newly developed functions. Metrics are based on [41].
MethodPlan. Stat. Toolbox [33]Chan. Migr. Toolbox [34]Riv-Width [38]ChanGeom [44]SCREAM [41]Riv-MAP [42]Riv-Width-Cloud [43]PyRIS [35]Riva-Map [45]Delta Morph. [25]River Width [39]MorphEst
Metric
ObjectiveRiver Dyn.River Dyn.Width DataRiver GeometryRiver Dyn.River Dyn.Width DataRiver Dyn.Width DataDelta Morph.Width DataEstuary Morph.
MorphologySSS/MSS/MS/MS/MS/MS/MS/MS/MS/M
Target
system
RRRRRRRRRDRE
Linear rates of channel migrationXX---------X---X------------
Channel erosion/
accretion
------------XX---------X---X
Change as % of channel area------------X-----------------X
Cause of erosion (natural vs. human)---------------------------------X
Channel widthXXXXXXXXX---XX [42]
Centerline curvatureX------------------X------------
Bank lines and
dynamics
------------XX---------------X [42]
Channel elongationX---------------------------------
Islands
statistics
------------X---------------------
Sediment bar
dynamics
---------------------X------------
Estuarine length *---------------------------------X
Convergence length *---------------------------------X
Estuarine shape *---------------------------------X
S—single-threaded channel; M—multi-threaded channel; R—river; D—delta; E—estuary; Dyn. = Dynamics; Morph. = Morphology; * Applicable only to estuarine systems.
Table 3. Data source for functions and spatial resolution of datasets. Datasets have global coverage so that they can be applied to every estuary in the world. For local studies, the datasets can be exchanged for higher-resolution datasets.
Data SourceVariableSpatial ResolutionFunction
Global Surface Water
Dataset [71]
Channel Mask30 m × 30 mInput
FES2004 [72]M2 Tidal Amplitude1/8°Est_Length
SRTM15+ [70]Bathymetry15 arcsecondsEst_Length
Land Cover Climate Change Initiative Climate Research Data Package [75]Land Use300 m × 300 mEst_AreaChange_Land
Table 4. Sensitivity analysis. Variations in the total area in 1985 and 2015, net area change as well as mean shape based on the resampled channel masks (n = 22) to four different spatial resolutions.
Resolution
(m)
Sum Area 1985 (km2)Sum Area 2015 (km2)Area Change
(km2)
Mean Shape
(Dimensionless)
30468.4366.4−102.013.0
60479.2378.5−100.714.8
90490.6387.2−103.414.5
120495.5388.7−106.818.0
Publisher’s Note: MDPI stays neutral with regard to jurisdictional claims in published maps and institutional affiliations.