Article

Proof of Concept Study of an Electrochemical Sensor for Inland Water Monitoring with a Network Approach

1
Department of Engineering, Unit of Electronics for Sensor Systems, Campus Bio-Medico University of Rome, 00128 Rome, Italy
2
Department of Science and Technology for Humans and the Environment, Unit of Electronics for Sensor Systems, Campus Bio-Medico University of Rome, 00128 Rome, Italy
3
Department of Engineering, Unit of Computational Systems and Bioinformatics, Campus Bio-Medico University of Rome, 00128 Rome, Italy
*
Author to whom correspondence should be addressed.
Remote Sens. 2021, 13(20), 4026; https://doi.org/10.3390/rs13204026
Submission received: 3 August 2021 / Revised: 25 September 2021 / Accepted: 6 October 2021 / Published: 9 October 2021
(This article belongs to the Special Issue Estimating Inland Water Quality from Remote Sensing Data)

Abstract

:
The technologies most suitable for monitoring the ecosystem of inland waters are image spectrometry and electrochemical sensors. The reason is that these instruments are able to ensure accuracy in the surveillance of very large areas through reliable and frequent measurements performed remotely. Electrochemical systems provide low-cost, miniaturized, reliable sensors that can be organized, when equipped with commercial on the shelf (COTS) low-power radio components implementing LoRaWAN, Sigfox or NB-IoT communications, in a dense network of sensors achieving the aforementioned requirements. In this work, a low-cost, low-size and low-noise electrochemical sensor endowed with protocols for network configuration, management and monitoring is presented. The electronic interface of the sensor allows high reproducible responses. As proof of concept for its utilization in inland water monitoring, the device has been tested for water composition analysis, bacteria identification and frequent pollutant detection: atrazine, dichloromethane and tetrachloroethene. The results are promising, and future investigations will be oriented to unlock the true potential of a general-purpose approach exploiting the continuous fusion of distributed data in each of the three considered application scenarios. A new device, with reduced power consumption and size, has been also developed and tested; this new device should be a node of a large network for inland water monitoring.

1. Introduction

In the fragile and critical situation currently determined by global climate change, sustainable management of water bodies asks for clear and challenging directives [1], based on an accurate maintenance program of the inland water ecosystem, which has great sanitary and economic implications [2]. Such a strategy for effective monitoring systems should be reliable, frequent, widespread, and should allow rapid intervention. Remote monitoring is the most effective solution to fulfill all these requirements in such a complex and rapidly evolving scenario [3,4,5]. Nowadays, imaging spectrometry and electrochemical sensors allow us to set up a remote monitoring action [6,7,8]. Imaging techniques are intrinsically remote, and they can rely on satellite monitoring supported by complex and analytic procedures [9]. In addition, a widespread network for image-based monitoring can be set up by using specific Apps running on citizens’ smartphones [10]: this solution is obviously cheap, and it can provide a widespread monitoring action, whose effectiveness strongly depends on technology standardization and individual involvements. Among the available sensor technologies, electrochemical systems provide low-cost, miniaturized, reliable sensors [11,12] that can be organized, when equipped with COTS low-power radio components implementing LoRaWAN, Sigfox or NB-IoT communications [13], in a dense network of sensors achieving the aforementioned requirements. The role of electrochemistry in this field is mainly addressed to water analysis [14]. In this work, a low-cost, low-size and low-noise electrochemical sensor endowed with protocols for network configuration, management and monitoring is presented. The device here tested is based on a previous version of the instrument [15] designed and developed by the authors and mainly tested in the medical and food monitoring fields [16,17]. The electronic interface of the sensor grants highly reproducible responses, allowing us to exploit the electrochemical sensors also in a working condition where the integrity, and thus the stability of the device, is a critical aspect. As proof of concept for its utilization in inland water monitoring, it has been tested for water composition analysis, bacteria identification and frequent pollutants: atrazine (31212, Merck KGaA, Darmstadt, Germany), dichloromethane (48600, Merck KGaA, Darmstadt, Germany) and tetrachloroethene (40083, Merck KGaA, Darmstadt, Germany). Considering that the first version of the sensor has been already tested in previous works in the characterization of drinkable water [18,19], and also in the detection of bacteria [20], here an advanced release of the instrument has been developed with a reduced size and power consumption suitable for its utilization in a sensor network on field.

2. Materials and Methods
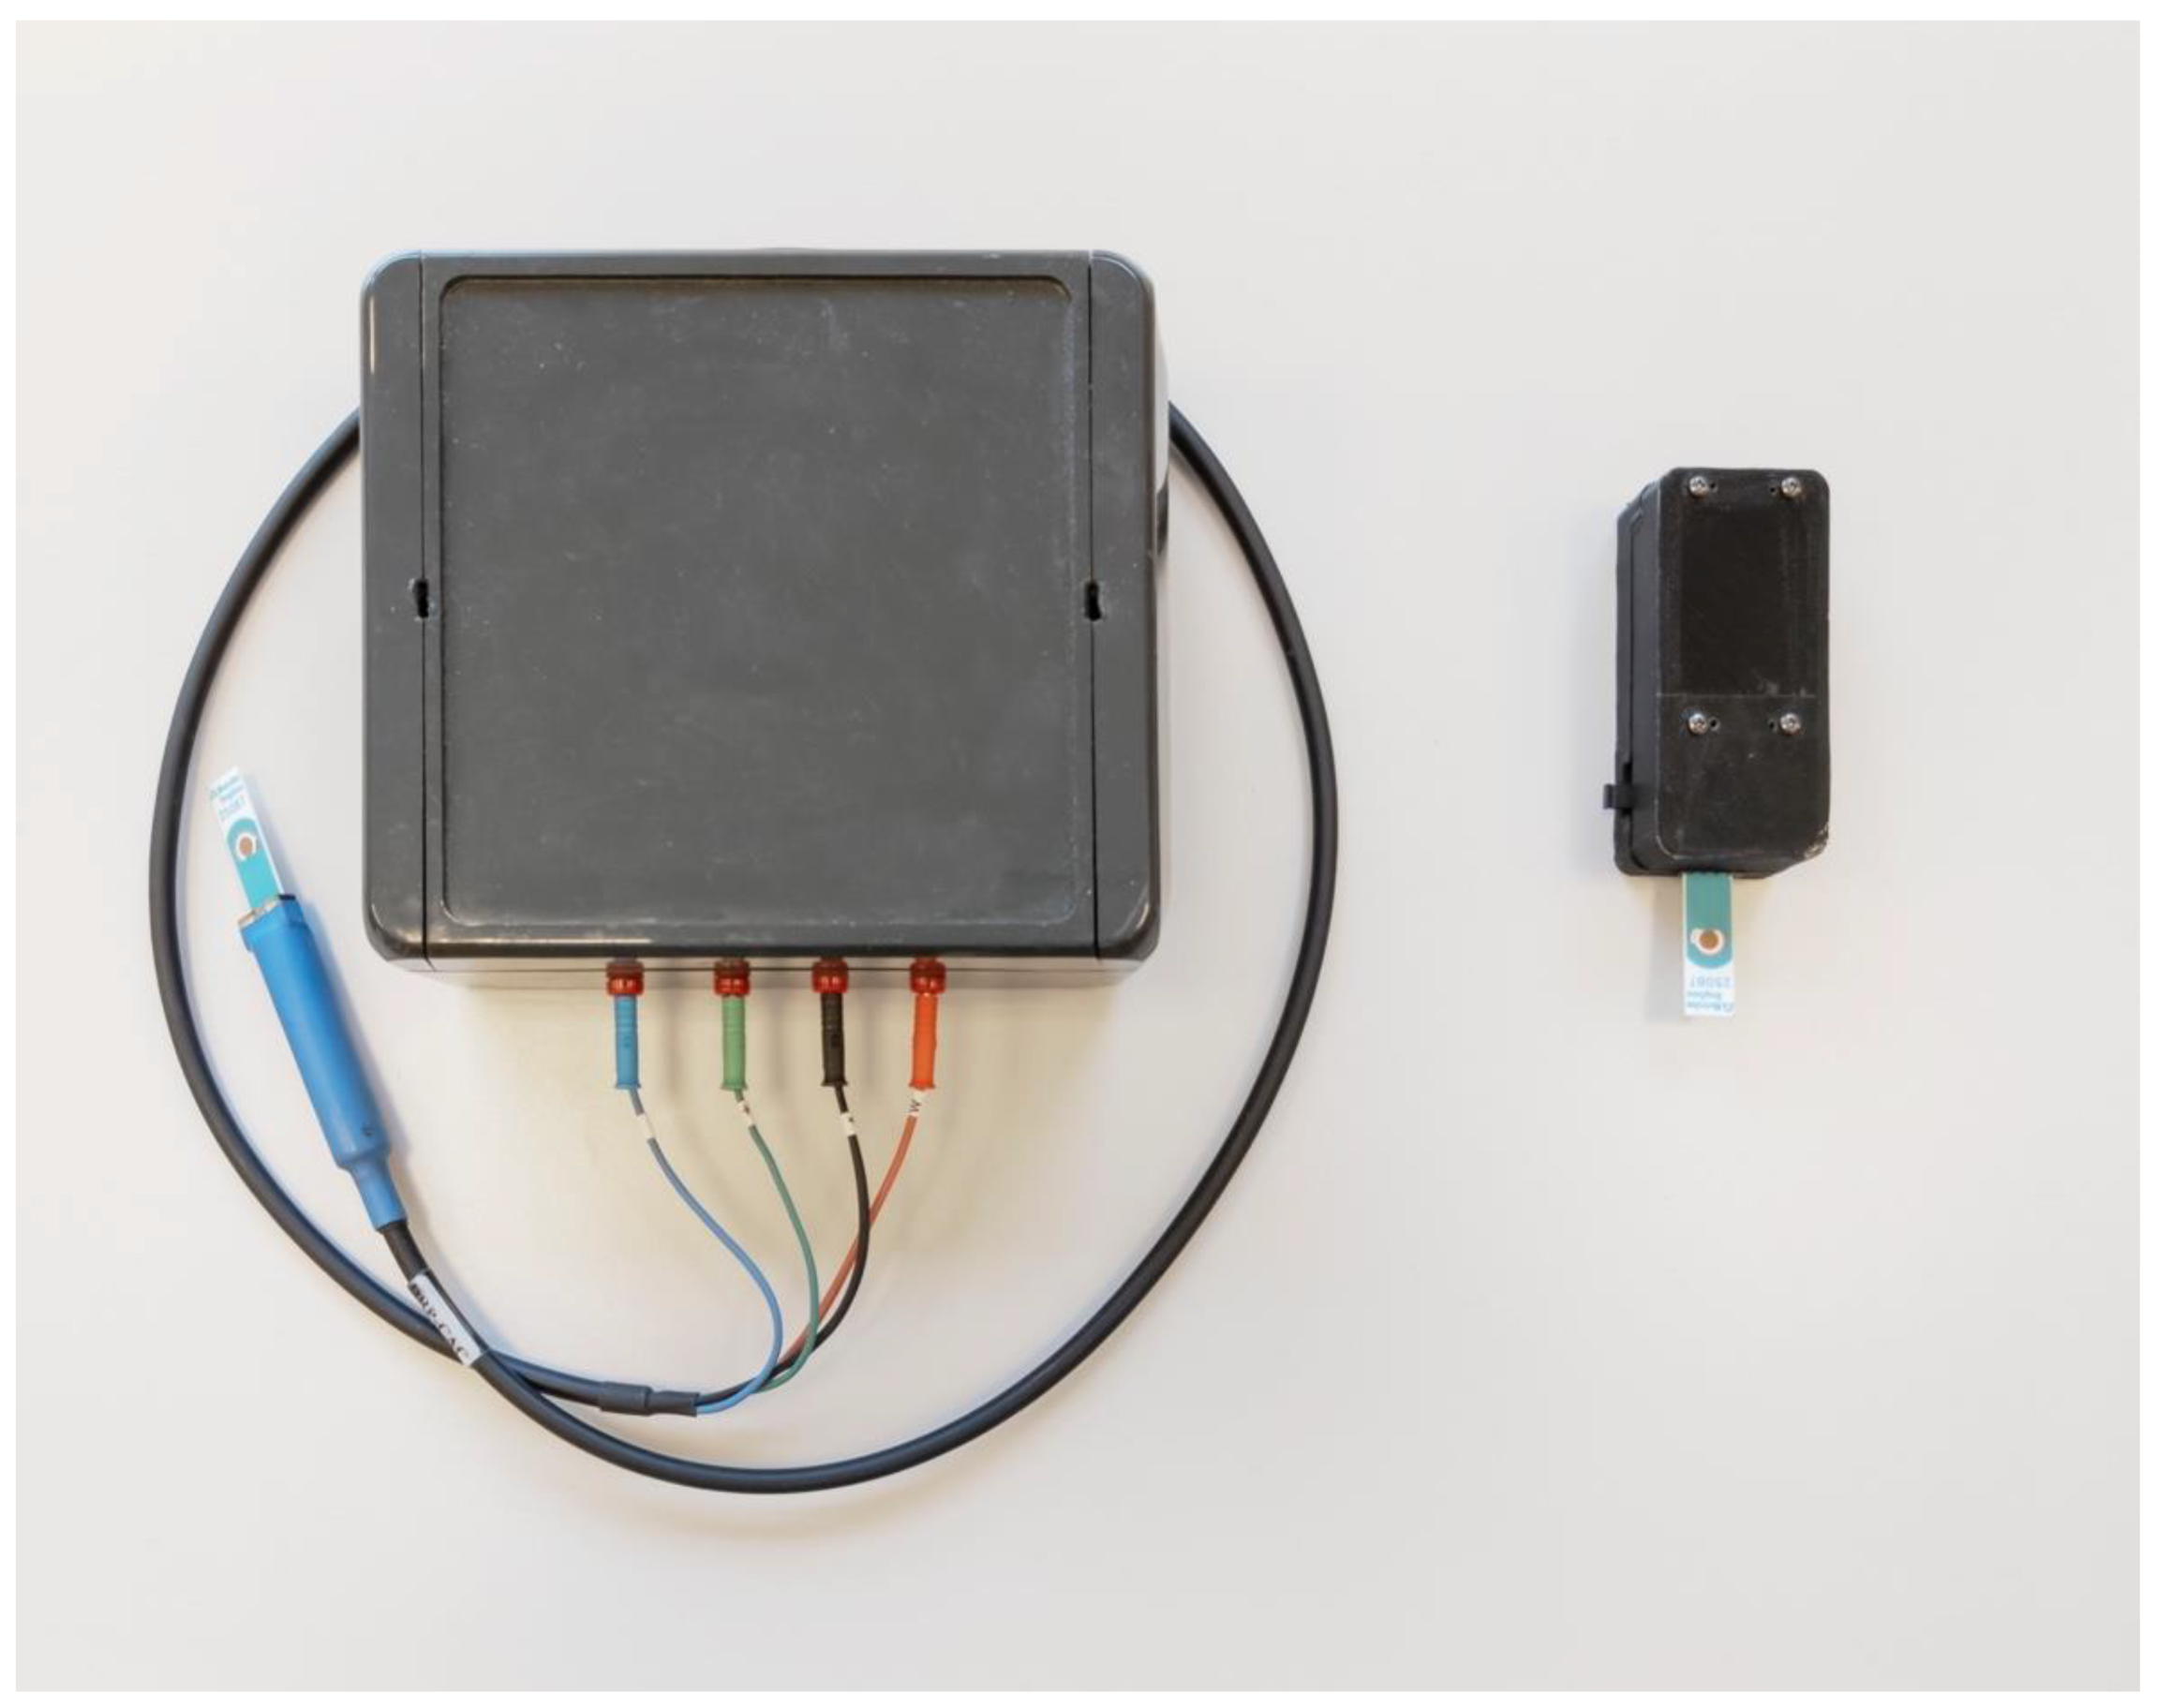
The sensor device for inland water monitoring has been tested in the analysis of water composition, bacterial contamination, and pollutant identification. In this section, the sensor system is presented, together with the methods used for testing it in assessing water composition, bacterial contamination and pollutant identification.

2.1. Sensors

The sensor used exploits the voltammetric working principle for liquid analysis performed using an electrochemical cell and is based on a Screen-Printed Electrode (SPE; DRP-250BT, Metrohm, Herisau, Switzerland) probe (Working: Gold; Counter: Platinum; Reference: Silver); the electronic front-end of the system provides the input signal (a triangular voltage waveform from +1 V to −1 V) and records the output data. The SPE is immersed in the target solution, and the applied input voltage induces oxi-reduction phenomena in the liquid sample. The output data are a current generated by the electrons involved in the reactions taking place in the liquid sample as consequence of the applied voltage. This current is converted in voltage by a trans-impedance circuit. The input signal frequency is 0.01 Hz; the output signal is acquired with a rate of 200 ms (500 samples per measurement). This sensor is based on a previous developed system, which is here arranged in its portable version [15] as node of a sensor network for environmental monitoring of large areas. This sensor system has been named BIONOTE for Liquids: BIONOTE-L [19]. After the calibration procedure described below in the next sub-sections, a new prototype has been designed, developed and tested. This last version of the instrument has characteristics that are suitable for its utilization on field, organized in a sensor network installed on a large area. The BIONOTE-L system as its base configuration was composed of an electronic board, powered at 12 V (±6 V), measuring 78 mm × 62 mm, equipped with an Arduino Due board, powered at 5 V, measuring 102 mm × 51 mm. The data transmission to the PC and the connection of the electronics to the sensor take place via cable. Here, the new device features an electronic interface measuring 65.5 mm × 28.0 mm equipped with a 51 mm × 23 mm Adafruit Feather M0 Bluefruit LE board, both powered by a 3.7 V lithium battery. The electrode is connected directly to the device and the data can be transmitted via the integrated Bluetooth Low-Energy module. In the Results section, some of the experiment, relative to the calibration to water composition, has been repeated with the new device in order to ensure the same performance obtained with the BIONOTE-L.
The new device and the BIONOTE-L are reported in Figure 1. The comparison of their main features is reported in Table 1.

2.2. Water Composition

The ability of the sensor in the characterization of water samples in terms of salt composition has been already demonstrated in a previous work [18]. The same sensor has been shown to be able to detect extraneous compounds, meaning compounds that usually are not, or should not be, present in a water sample, such as ethanol, isopropanol and hexane [19]. Here, some measurements with four specific water samples, fully characterized before the measurements, have been repeated in order to show the same behavior of the new device described in Section 2.1 with respect to the BIONOTE-L. The details and results given by this comparison test are reported in the Results section.

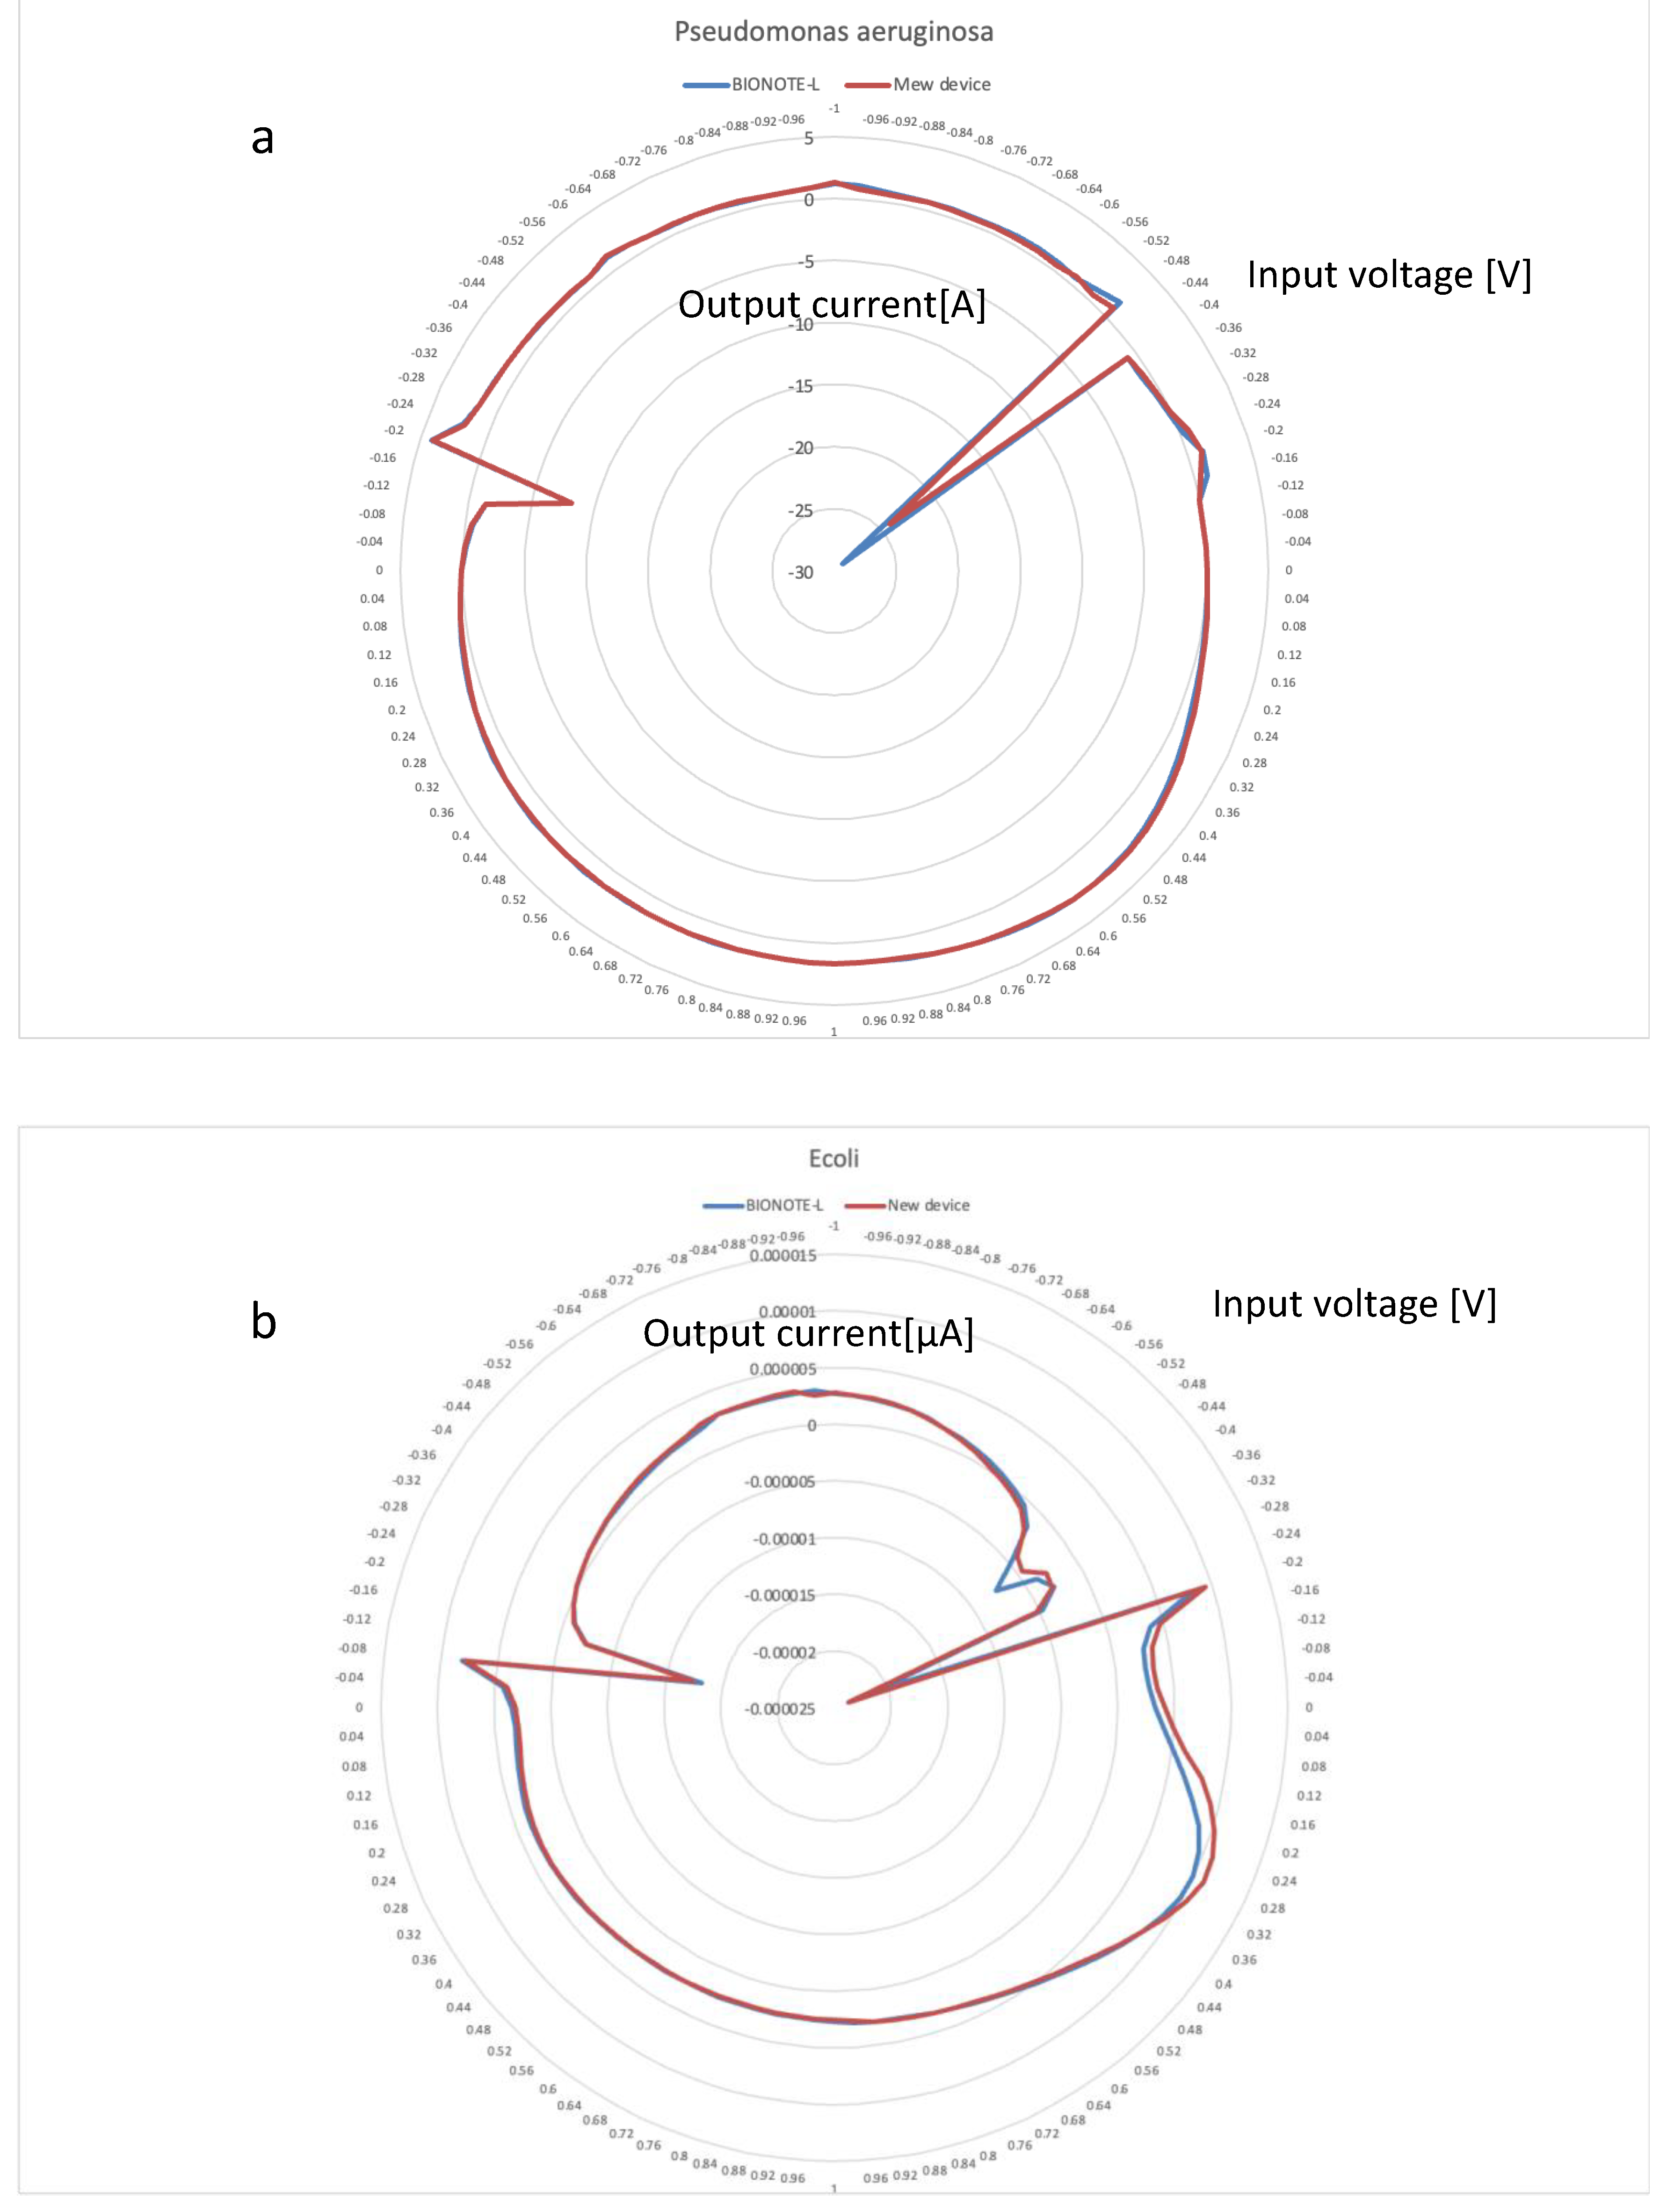
2.3. Bacterial Contamination

The ability of the sensor in the detection of bacteria has been already demonstrated in a previous work [20]. Here, some measurements with two specific bacteria have been repeated in order to show the same behavior of the new device described in Section 2.1 with respect to the BIONOTE-L. The bacteria selected are the same of the first experiment [20]: Pseudomonas aeruginosa aeruginosa and E. coli. In the previous experiment on bacteria detection, output consisted in a pattern of current values. Thus, also in this second experiment with the new device, current values have been extracted for comparison. In order to distinguish the results obtained in the current and in the voltage, the first ones have been represented with radar plots. The details and results given by this comparison test are reported in the Results section.

2.4. Pollutant Identification

The calibration of the voltammetric sensor against frequent inland water pollutants was performed using atrazine (31212, Merck KGaA, Darmstadt, Germany), dichloromethane (48600, Merck KGaA, Darmstadt, Germany) and tetrachloroethene (40083, Merck KGaA, Darmstadt, Germany) chemical standards. Chemicals were purchased as solutions at certified concentration, and final calibration samples were prepared by dilution. Particularly, atrazine was analyzed at concentrations of 0.15, 0.3, 0.6, 1.2 and 2.4 µg/L; dichloromethane was analyzed at concentrations of 5, 10, 20, 40 and 80 µg/L; tetrachloroethene was analyzed at concentrations of 2.5, 5, 10, 20 and 40 µg/L. All dilutions were performed in bi-distilled water (https://www.sigmaaldrich.com/IT/en/product/sial/00612?context=product) accessed on 8 October 2021. Pollutant samples were freshly prepared diluting chemical stock solution in bi-distilled water and then were stored in ice until use. Voltammetric measurements were performed with an unmodified Screen-Printed Electrode probe (SPE; DRP-250BT, Working: Gold, Counter: Platinum, Reference: Silver; Metrohm) and a dedicated electronic interface providing the input signal and recording the output data [19]. The current generated by the electrons involved in the reactions is captured by the system and converted in voltage by a trans-impedance circuit. The frequency of the input signal was set to 0.01 Hz, and 500 samples were acquired per measurement. Ten consecutive independent analysis cycles were run for each sample. An overview of the calibration process is reported in Figure 2.

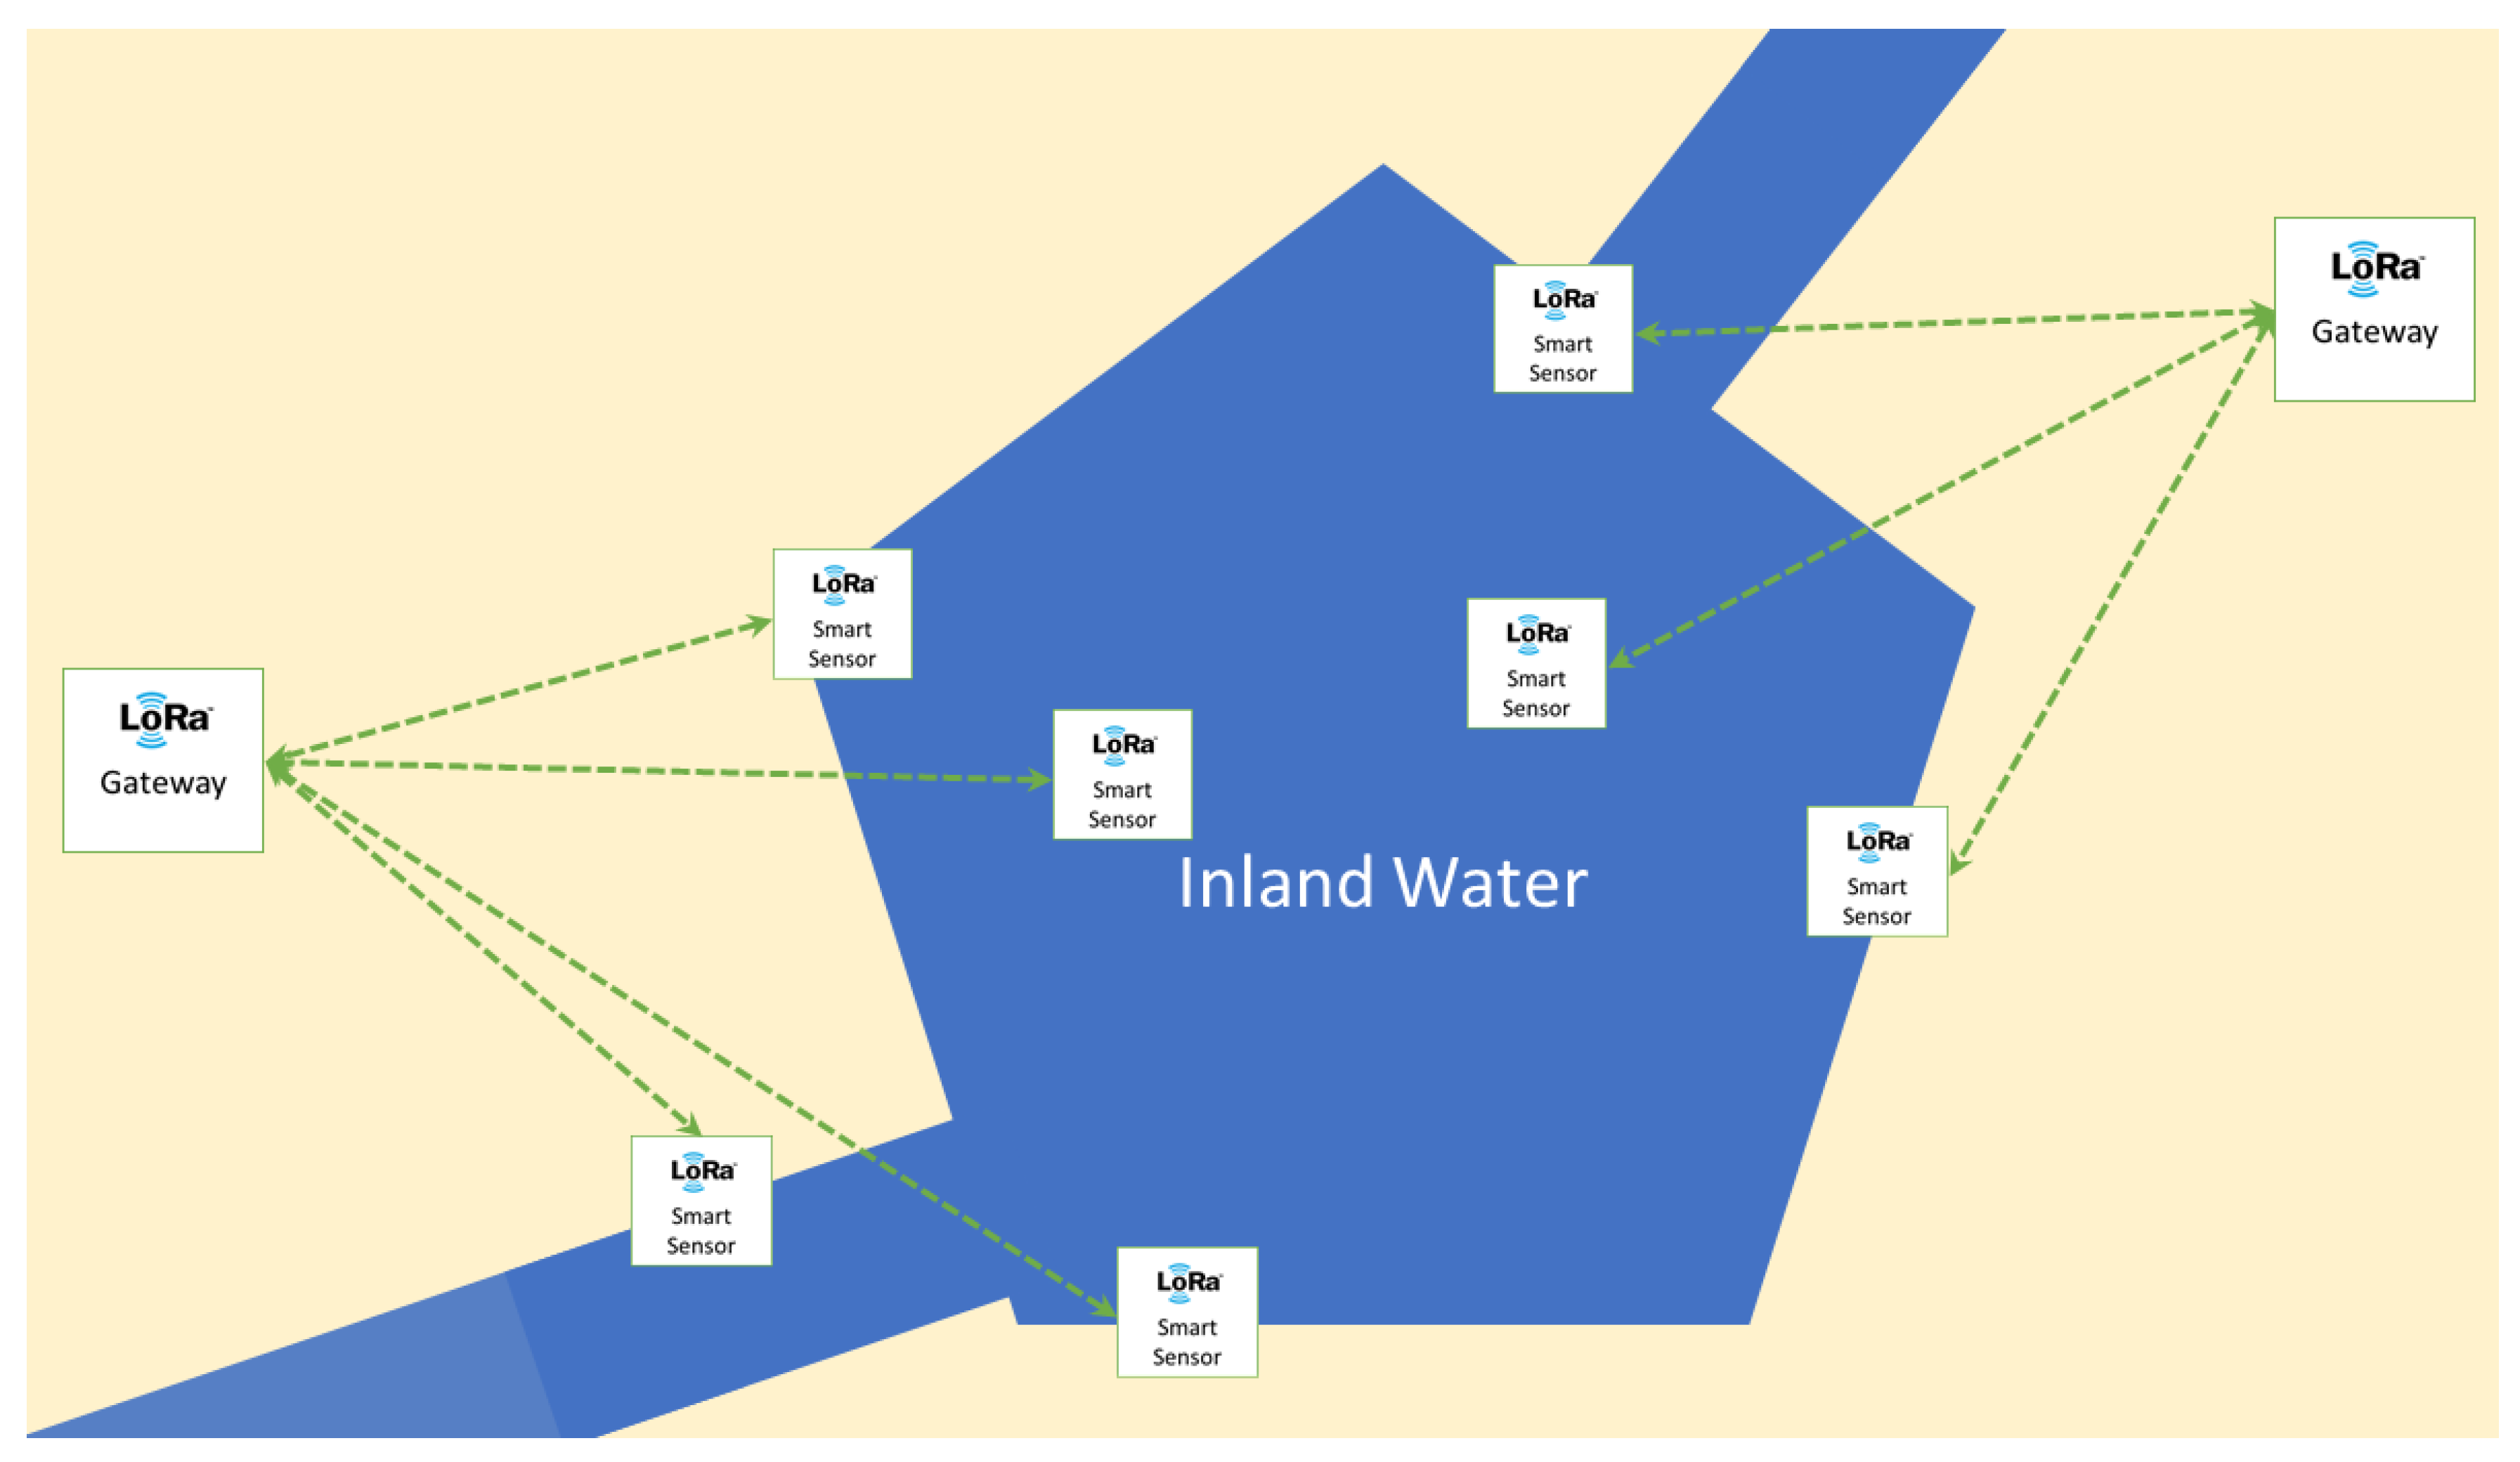
2.5. Sensor Connectivity

Transduction and processing of raw signals have been embedded within a smart sensor architectural model [21]. This model has the purpose of modularizing the electronic and digital conversion functionalities of raw data, interfacing them to typical IoT sensor functionalities: (i) the local data processing functionality; (ii) the data transmission functionality. This modularity allows for changing the digital hardware supporting the sensor easily. This modularity has been leveraged to guarantee long-distance communications for a potentially large number of monitoring devices. This was made possible by replacing, in a new prototypal system, the Adafruit board with an ESP32-based model, equivalent in terms of ADC conversion and power consumption, but equipped with LoRaWAN connectivity (the LoPy4). Since LoRaWAN is a very low-throughput protocol, designed more for event monitoring than for high-frequency tracking of environmental parameters, and to avoid the consumption of too much power in transmissions, a second key feature of the architectural model has been exploited: the possibility to locally implement processing logic according to the IoT edge computing model. This prototypal sensor thus implements a programmable sampling mechanism and a transmission limited to reports on data collected between two successive message exchanges. In the following, we will refer to both the Adafruit-based and LoPy4-based devices as the new device. Whenever we refer to interactions with LoRaWAN systems, the reference is to the latter implementation, while for all other tests the reference is to the former.
The remote sensing version of the sensor allows us to extend its effective use in different contexts, enabling not only its massive use at low cost, but also allowing the implementation of strategies that improve the quality, robustness and resilience of the whole monitoring system. For example, the ability to install multiple sensors with redundancy can be useful for delaying maintenance or sensor replacement time, allowing monitoring system administrators to trade off installation costs (spent once) for maintenance costs (repetitive). A simple model can show the significant impact introduced in this scenario.
In the model, the failure time, i.e., the time from installing the sensor to encountering a condition that limits its usability, is modelled as an exponential random variable T F , whose CDF is:
F T F ( t ) = P { T F t } = ( 1 e μ t ) u ( t )
where μ is the average failure rate (reciprocal of the average time to failure), and u ( t ) is the Heaviside function. From the CDF, it is possible to determine the binary stochastic process that describes the state of the sensor:
S ( t ) { D O W N , U P }
P { S ( t ) = D O W N } = F T F ( t ) = p ( t )
From the stochastic description of the individual sensor, it is then possible to formulate a global description based on the stochastic process A ( t ) that describes the number of active sensors at the time t :
P { A ( t ) = k } = ( n k ) [ 1 p ( t ) ] k [ p ( t ) ] ( n k )
where n is the number of installed sensors, and k is the number of active ones.
Based on this simple model, it is possible to verify the impact of the time to failure, i.e., the average time until a sensor is unavailable for any cause (failure, battery exhaustion), on the life of the remote monitoring system.
Identifying the end-of-life of the sensor system with the exceeding of a minimum value for the density of sensors available in the monitored area with a sufficiently high probability, the value at which that time is reached can be expressed with:
T L = a r g m i n t { P { A ( t ) < d   S } p l }
where d is the minimum sensor density, S is the area to monitor, and p l is the probability limit.
The results obtained by using this model will be shown in the Results section.

2.6. Data Analysis

The overall sensors’ responses, composed of an array of 500 elements for each sample, have been elaborated through multivariate data analysis techniques. Partial Least Square Discriminant Analysis (PLS-DA) was performed using PLS-Toolbox (Eigenvector Research Inc., Manson, WA, USA) in the Matlab Environment (The MathWorks, Natick, MA, USA). PLS-DA models have been calculated in order to detect water pollutants and investigate BIONOTE-L as potential device for inland water analysis.

3. Results

In this section, the results obtained will be reported into two different subsections: calibration to pollutants; confirmation of the new device performance in water characterization.

3.1. Calibration to Pollutants

According to the Directive 2008/105/EC of the European Parliament and of the Council of 16 December 2008 on environmental quality standards (EQS) in the field of water policy, the EQS annual average values (AA-EQS) reported in the ANNEX I were used as concentration reference for the calibration setup. The target value for atrazine, dichloromethane and tetrachloroethene was chosen as the median point of the calibration curve in order to assess BIONOTE-L ability against both higher and lower concentrations. The prepared pollutant admixtures were analyzed through the BIONOTE-L system, performing ten measuring cycles each. The last five measures were then sub-sampled from the overall acquired data to guarantee electrode signal stabilization. The voltammograms relative to each pollutant are reported in Figure 3.
These patterns are relative to the measurements obtained when testing the highest concentration selected for each different pollutant. Three different shapes can be observed for the three pollutants. In Figure 4, the modification of each pattern as consequence of the concentration shift can also be observed.
The differences put in evidence in Figure 4 suggest the ability of the system in the prediction of the concentration. A PLS-DA model has been calculated for the data set of each calibration test for each of the three pollutants in the range of interest. The results reported in Figure 5 account for a good ability of the sensor.
The calculated PLS-DA models highlighted the ability of the system to detect all three water pollutants with a high degree of accuracy in the concentration discrimination. The system was able to predict the presence of chemical contamination up to concentration values lower than the established thresholds. The Root Mean Square Error in Cross Validation (RMSECV), using the Leave One Out criterion, was different among the three kinds of pollutant. System performance was similar for dichloromethane and tetrachloroethene with RMSECV of 4.67 and 3.71 µg/L, respectively, while for atrazine the calibration error decreased up to 0.28 µg/L. Considering these errors and looking at the concentration levels tested in the calibration, a reasonable limit of detection for each pollutant can be set at 3.71, 5.0 and 0.3 µg/L for tetrachloroethene, dichloromethane and atrazine, respectively. Despite the lower RMSECV, the detection of atrazine and tetrachloroethene resulted in slightly less precision, accounting for a higher relative error considering both the analyzed range of concentration and the threshold value. Particularly, BIONOTE-L was able to perceive dichloromethane pollutant at concentration about fourfold lower than AA-EQS value, while the atrazine and tetrachloroethene sensibility was half of the threshold.

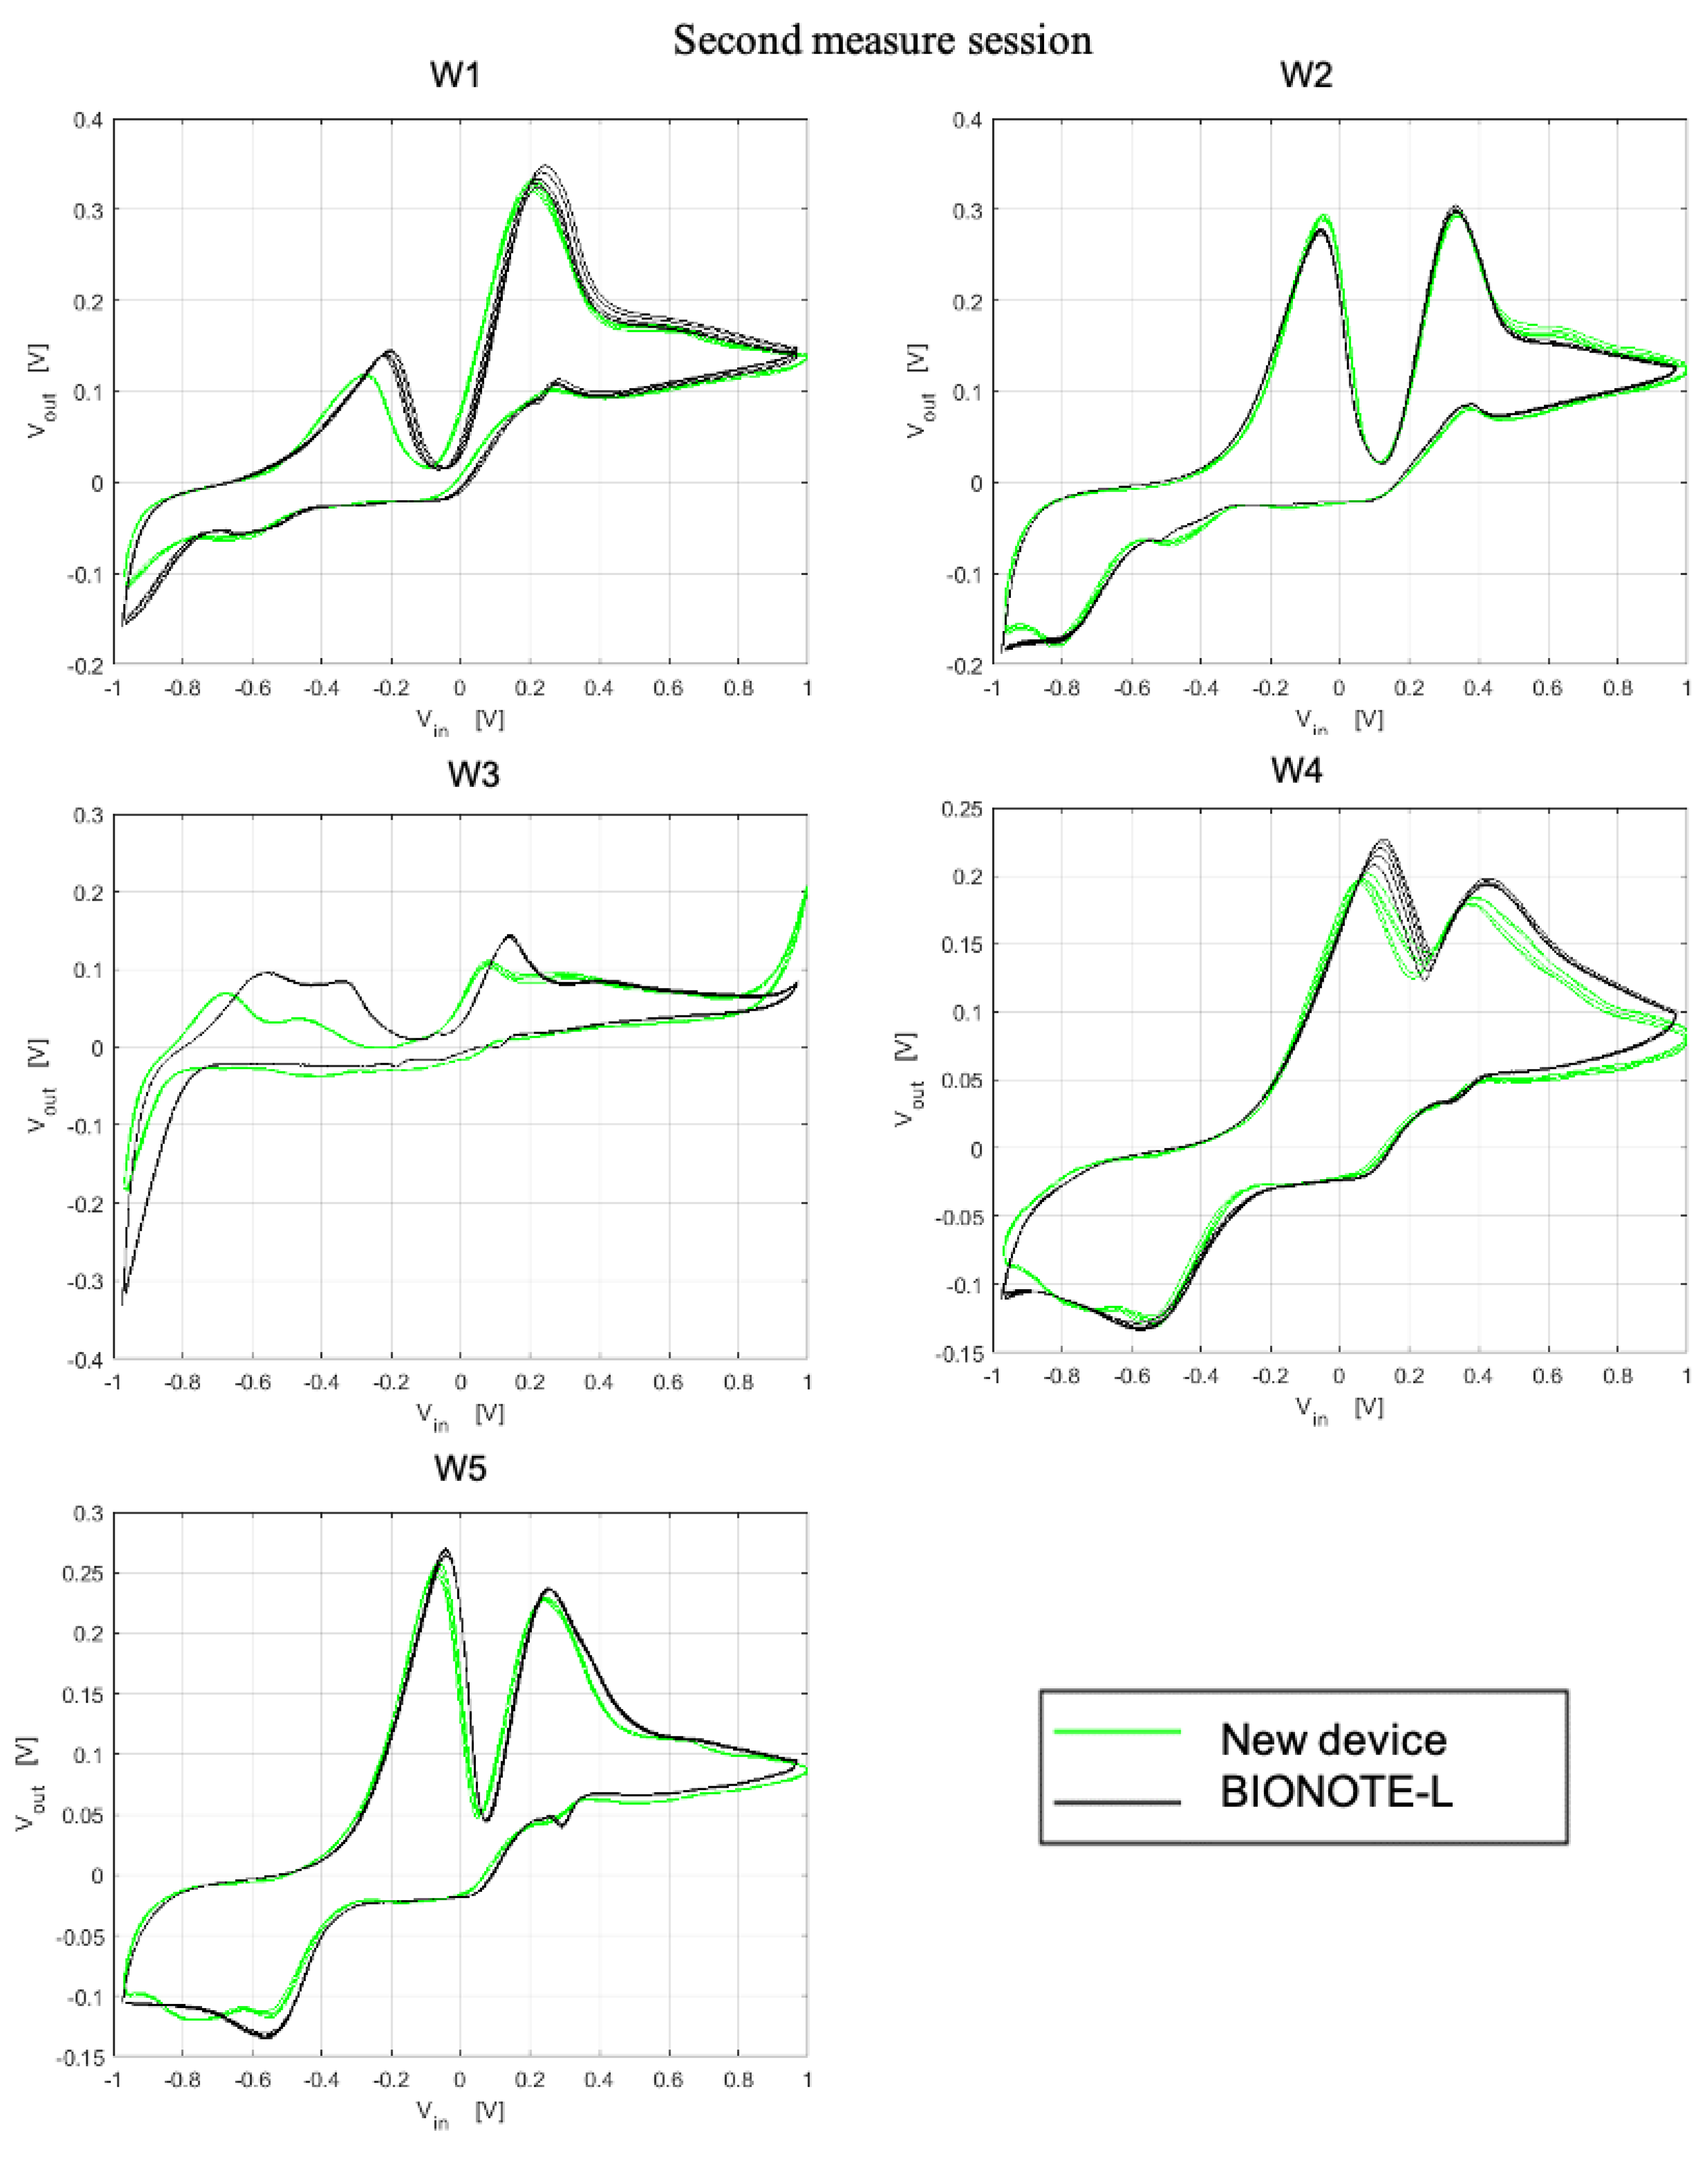
3.2. Comparison between BIONOTE-L and the New Device

A series of comparative tests were carried out between the new device and the BIONOTE-L in order to validate the new instrument as optimal for its use in a network for large area monitoring. Five different liquid reference samples were selected. The content of the electrochemically active compounds of these samples was known.
Specifically, five bottled mineral waters [18] have been selected. To avoid misunderstandings and conflicts of interest with commercial products of trademarks, these samples are here indicated as: W1, W2, W3, W4 and W5. In Table 2, three key parameters are reported.
The same protocol has been followed for each sample. A measurement of ten cycles has been performed on 3.5 mL of liquid inside a cuvette with the BIONOTE-L device. The same measurement of ten cycles has been performed with the same sample and the same electrode with the new device. The voltammograms belonging to the last five measurement cycles of both devices have been compared.
Two measurement sessions have been carried out with the same samples but on different days. The following graphs (Figure 6 and Figure 7) show the last five cycles of the voltammograms belonging to the two devices (red in Figure 6 and black in Figure 7 for BIONOTE-L, respectively; blue in Figure 6 and green in Figure 7, respectively, for the portable device).
All the samples under examination contain the same electrochemically active components even if in different concentrations. It is therefore natural to expect that voltammograms have a similar profile. The expected similarity is confirmed.
The same test on reproducibility has been performed with respect to bacteria detection. Figure 8 reports the responses of the two instruments to the selected bacteria.
The BIONOTE-L and the new device have been tested with Pseudomonas aeruginosa aeruginosa and E. coli at the following concentration levels: 10, 100, 200 and 300 CFU (Colony-forming Unit). The ability of the BIONOTE-L in the discrimination of the typology and concentration levels has been confirmed by the new device. The radar plots of the output currents reported in Figure 8 are relative to the highest concentration tested, of 300 CFU. The blue pattern is relative to the BIONOTE-L; the red pattern is relative to the new device. Panel a reports the outputs for the Pseudomonas aeruginosa aeruginosa and panel b reports the outputs for the E. coli. The red and blue patterns are almost overlapped, accounting for a good reproducibility.
Regarding connectivity of this device, with a transmission speed between 980 bps and 12,500 bps, a LoRa connectivity would allow the transfer of a complete voltammogram (500 points at 12 bit resolution) in a time ranging, omitting protocol overheads, between 6 seconds and half a second, whereas the acquisition time of a voltammogram is 5 seconds. This makes it possible, in case of measurement events of interest, to remotely send without delays not only the outcome of the edge analysis, but the entire voltammogram under investigation. The hypothesis of transferring the entire voltammogram was tested through the use of a gateway and for a class A device configuration. Using Scale Factor (SF) values of 7 and 8, as verified and in a configuration similar to the one presented in [22], an entire voltammogram could be transferred in less than 10 s.

3.3. Advantages in Remote Sensing: The Installation/Maintenance Cost Trade-Off

The model introduced in Section 2.5 has been tested in the scenario depicted in Figure 9, where sensors are placed randomly with uniform probability within a 1 km × 1 km area to be monitored. Correspondent results are reported in Figure 10.
Analyzing the results of Figure 10, where we refer to a configuration of parameters d = 35 km 2 and p l = 0.9 , and where different values of μ   are considered, it is evident how leveraging redundancy can significantly increase the time to system failure and therefore delay the need of maintenance interventions.

4. Discussion

The BIONOTE-L is a sensor system based on cyclic voltammetry, which has demonstrated to be relevant in the monitoring of inland water. In a previous work, it was tested in the identification of different kind of water samples, for which it was able to describe water composition in terms of salts and of the main chemical and physical parameters [18]. BIONOTE-L was also tested as system for bacteria detection, obtaining optimal results down to concentration levels of 10 CFU for E. coli and Pseudomonas aeruginosa [20]. Here, it has been calibrated with three pollutants, giving promising results in the range of interest. Moreover, a new version of the sensor has been developed, with reduced size and power consumption. The novelty of this work could be summarized by the following points: (1) multipurpose approach (bacteria, water characterization, pollutants); (2) in a wide scenario (low power, low size, connectivity). Considering that the experiments for water characterization and bacteria detection had been performed with BIONOTE-L, the new device developed here has also been tested with water samples and bacteria in order to verify the reproducibility of the previous results in the newest configuration. The results of this test gave a positive response. The supply voltage and size features developed in the new release of the instrument make the device suitable for its application as a node of a sensor network to be implemented as strategy for the monitoring of a large area, such as the scenario designed in the simulation reported in Figure 11.
The results obtained and here presented are promising, and it is useful to discuss the pros and cons of this solution in order to demonstrate the point and define future developments. A sensor network, such as the one realizable with the devices here proposed, can be implemented with a processing unit on board, but this solution is a trade off with power consumption, which must be lowered in order to grant high durability of the sensors. An accurate design of the network should establish the system requirements on the basis of a series of thresholds: the extension of the area to be monitored, and the number of sensors to be used; time interval for active monitoring, and the frequency of the measurements.
When the abilities of the sensor are considered all together:
-
Detecting three key pollutants in a relevant range of interest;
-
Detecting two common bacteria at low concentration level (from 10 to 200 CFU);
-
Characterize the water sample in terms of composition and chemical/physical parameters.
It is clear that the system here presented has a real potentiality of becoming the key element for a sensor network to be used in the monitoring of inland water. In addition, this study is a proof of concept, thus it presents some critical points that should be solved in the future steps of this research. Of course, many more water samples with different salt compositions should be tested. Additionally, considering that the sensor mechanism is based on electro-oxidation, many other hazardous compounds present in water should be taken into consideration. The same procedure should be followed for bacteria and pollutants detection: the sensor should be calibrated to many more different typologies. A dedicated library of voltammograms could be with a specific calibration campaign oriented to any specific application in a specific scenario.

5. Conclusions

To conclude, it is useful here to fix the goals achieved by this work and to list the steps to follow in order to continue the project.
BIONOTE-L, the electrochemical sensor designed and tested, is relevant in inland water monitoring, because it is able to detect bacteria and pollutant and to characterize the water sample under test in terms of salt composition and of chemical/physical parameters.
The new release of the sensor is a release of BIONOTE-L with a reduced size and power consumption, which make it more suitable for the utilization as node of a sensor network.
This new device has demonstrated to be equivalent to the previous release with regard to the objectives of the present study.
Further experiments should be performed in order to test more bacteria typologies and pollutants. It is also important to set up a preliminary test on field.

Author Contributions

Conceptualization, G.P. and M.S.; methodology, S.G., A.S., A.Z.; software, A.S. and L.V.; validation, A.Z., A.S. and S.G.; formal analysis, G.P. and L.V.; investigation, M.S. and A.Z.; data curation, A.Z. and S.G.; writing—original draft preparation, G.P.; writing—review and editing, M.S. All authors have read and agreed to the published version of the manuscript.

Funding

This research received no external funding.

Data Availability Statement

The data presented in this study are available on request from the corresponding author.

Conflicts of Interest

The authors declare no conflict of interest.

References

  1. Tsani, S.; Koundouri, P.; Akinsete, E. Resource management and sustainable development: A review of the European water policies in accordance with the United Nations’ Sustainable Development Goals. Environ. Sci. Policy 2020, 114, 570–579. [Google Scholar] [CrossRef]
  2. Connor, R.; UNESCO World Water Assessment Programme. The United Nations World Water Development Report 2021: Valuing Water; Executive Summary; UNESCO: Paris, France, 2021. [Google Scholar]
  3. Sagan, V.; Peterson, K.T.; Maimaitijiang, M.; Sidike, P.; Sloan, J.; Greeling, B.A.; Maalouf, S.; Adams, C. Monitoring inland water quality using remote sensing: Potential and limitations of spectral indices, bio-optical simulations, machine learning, and cloud computing. Earth-Sci. Rev. 2020, 205, 103187. [Google Scholar] [CrossRef]
  4. Topp, S.N.; Pavelsky, T.M.; Jensen, D.; Simard, M.; Ross, M.R.V. Research Trends in the Use of Remote Sensing for Inland Water Quality Science: Moving Towards Multidisciplinary Applications. Water 2020, 12, 169. [Google Scholar] [CrossRef] [Green Version]
  5. Tsai, Y.-L.; Klein, I.; Dietz, A.; Oppelt, N. Monitoring Large-Scale Inland Water Dynamics by Fusing Sentinel-1 SAR and Sentinel-3 Altimetry Data and by Analyzing Causal Effects of Snowmelt. Remote Sens. 2020, 12, 3896. [Google Scholar] [CrossRef]
  6. Ross, M.R.V.; Topp, S.N.; Appling, A.P.; Yang, X.; Kuhn, C.; Butman, D.; Simard, M.; Pavelsky, T.M. AquaSat: A Data Set to Enable Remote Sensing of Water Quality for Inland Waters. Water Resour. Res. 2019, 55, 10012–10025. [Google Scholar] [CrossRef]
  7. Ogashawara, I.; Mishra, D.R.; Gitelson, A.A. Remote sensing of inland waters: Background and current state-of-the-art. In Bio-Optical Modeling and Remote Sensing of Inland waters; Elsevier: Amsterdam, The Netherlands, 2017; pp. 1–24. [Google Scholar]
  8. Hanrahan, G.; Patil, D.G.; Wang, J. Electrochemical sensors for environmental monitoring: Design, development and applications. J. Environ. Monit. 2004, 6, 657–664. [Google Scholar] [CrossRef] [PubMed]
  9. Pu, H.; Liu, D.; Qu, J.-H.; Sun, D.-W. Applications of Imaging Spectrometry in Inland Water Quality Monitoring—A Review of Recent Developments. Water Air Soil Pollut. 2017, 228, 131. [Google Scholar] [CrossRef]
  10. Malthus, T.J.; Ohmsen, R.; Woerd, H.J. An evaluation of citizen science smartphone apps for inland water quality assessment. Remote Sens. 2020, 12, 1578. [Google Scholar] [CrossRef]
  11. Su, S.; Chen, S.; Fan, C. Recent advances in two-dimensional nanomaterials-based electrochemical sensors for environmental analysis. Green Energy Environ. 2018, 3, 97–106. [Google Scholar] [CrossRef]
  12. Hayat, A.; Marty, J.L. Disposable Screen Printed Electrochemical Sensors: Tools for Environmental Monitoring. Sensors 2014, 14, 10432–10453. [Google Scholar] [CrossRef] [PubMed] [Green Version]
  13. Zhang, X.; Zhang, M.; Meng, F.; Qiao, Y.; Xu, S.; Hour, S. A low-power wide-area network information monitoring system by combining NB-IoT and LoRa. IEEE Internet Things J. 2018, 6, 590–598. [Google Scholar] [CrossRef]
  14. Chaplin, B.P. The Prospect of Electrochemical Technologies Advancing Worldwide Water Treatment. Acc. Chem. Res. 2019, 52, 596–604. [Google Scholar] [CrossRef] [PubMed]
  15. Pennazza, G.; Santonico, M.; Vollero, L.; Zompanti, A.; Sabatini, A.; Kumar, N. Advances in the electronics for cyclic volt-ammetry: The case of gas detection by using microfabricated electrodes. Front. Chem. 2018, 6, 327. [Google Scholar] [CrossRef] [PubMed] [Green Version]
  16. Pennazza, G.; Santonico, M.; Zompanti, A.; Parente, F.R.; Ferri, G.; D’Amico, A. Design and Development of an Electronic Interface for Gas Detection and Exhaled Breath Analysis in Liquids. IEEE Sens. J. 2017, 18, 31–36. [Google Scholar] [CrossRef]
  17. Santonico, M.; Grasso, S.; Pennazza, G.; Vollero, L.; Campoli, F.; Zompanti, A.; Ferri, G.; Piretta, L. A Sensor System for the Monitoring of Production Processes of Low FODMAP Food. Proceedings 2018, 2, 761. [Google Scholar] [CrossRef] [Green Version]
  18. Santonico, M.; Parente, F.R.; Grasso, S.; Zompanti, A.; Ferri, G.; D’Amico, A.; Pennazza, G. Investigating a single sensor ability in the characterisation of drinkable water: A pilot study. Water Environ. J. 2016, 30, 253–260. [Google Scholar] [CrossRef]
  19. Santonico, M.; Pennazza, G.; Grasso, S.; D’Amico, A.; Bizzarri, M. Design and Test of a Biosensor-Based Multisensorial System: A Proof of Concept Study. Sensors 2013, 13, 16625–16640. [Google Scholar] [CrossRef] [PubMed]
  20. Santonico, M.; Punzo, G.; Amadei, F.; De Pastena, G.; Grasso, S.; Zompanti, A.; Pennazza, G.; Amadei, S. Chemical Sensor for Haemodialysis Application. Procedia Eng. 2016, 168, 590–593. [Google Scholar] [CrossRef]
  21. Cordelli, E.; Pennazza, G.; Sabatini, M.; Santonico, M.; Vollero, L. An Open-Source Smart Sensor Architecture for Edge Computing in IoT Applications. Proceedings 2018, 2, 955. [Google Scholar] [CrossRef] [Green Version]
  22. Buyukakkaslar, M.T.; Erturk, M.A.; Aydin, M.A.; Vollero, L. LoRaWAN as an e-health communication technology. In Proceedings of the IEEE 41st Annual Computer Software and Applications Conference (COMPSAC 2017), Turin, Italy, 4–8 July 2017; Volume 2, pp. 310–313. [Google Scholar]
Figure 1. The BIONOTE-L (on the left) and the new device for the sensor network (on the right). The new device size is about the 6% of the BIONOTE-L. Moreover, the electrode can be directly connected onto the new device, while the BIONOTE-L is connected to the electrode via cable.
Remotesensing 13 04026 g001
Figure 2. Experimental set-up of the calibration to the pollutants. Some technical details are reported: the concentration values tested for each pollutant; the electronic interfaces of the input and output blocks with the input and the output paradigmatic signals.
Remotesensing 13 04026 g002
Figure 3. Voltammograms registered by the BIONOTE-L for tetrachloroethene (@40 μg/L), dichloromethane (@80 μg/L), atrazine (@2.4 μg/L).
Remotesensing 13 04026 g003
Figure 4. Voltammograms registered by the BIONOTE-L for different concentration of tetrachloroethene (panel a) @ 2.5, 5, 10, 20 and 40 µg/L, dichloromethane (panel b) @ 5, 10, 20, 40 and 80 µg/L, atrazine (panel c) @ 0.15, 0.3, 0.6, 1.2 and 2.4 µg/L.
Remotesensing 13 04026 g004
Figure 5. Measured vs. Predicted concentration values of (from top to down) tetrachloroethene, dichloromethane, atrazine. Calculating the percentage error by normalizing the RMSECV (Root Mean Square Error in Cross Validation) against the investigated concentration range, the relative values are of about 9% for the tetrachloroethene; of about 6% for dichloromethane; of about 11% for atrazine.
Remotesensing 13 04026 g005
Figure 6. Comparison of the voltammograms obtained measuring five different water samples with the BIONOTE-L and with the new device developed for BIONOTE-L utilization in a network arrangement. First session of measurement.
Remotesensing 13 04026 g006
Figure 7. Comparison of the voltammograms obtained measuring five different water samples with the BIONOTE-L and with the new device developed for BIONOTE-L utilization in a network arrangement. Second session of measurement.
Remotesensing 13 04026 g007
Figure 8. Comparison of the patterns obtained measuring five different water samples contaminated with Pseudomonas aeruginosa aeruginosa (panel a) and E. coli (panel b), with the BIONOTE-L and with the new device developed for BIONOTE-L utilization in a network arrangement.
Remotesensing 13 04026 g008
Figure 9. Scenario of interest. A 1 km × 1 km area is randomly populated with sensors.
Remotesensing 13 04026 g009
Figure 10. Global time-to-failure trend as a function of the number of installed sensors ( n ), rate of failure ( μ , expressed in years 1 ), for a 1 km × 1 km square area. It is assumed that d = 35 km 2 , p l = 0.9 .
Remotesensing 13 04026 g010
Figure 11. A possible sensor network for inland water monitoring based on buoys embedded with the reduced release of the BIONOTE-L. The considered connectivity model assumes the presence of pre-installed LoRa gateways covering the area of inland water to be monitored. Within the area, smart sensors equipped with transducers, computing power and, of course, antennas for wireless connectivity are scattered at strategic points.
Remotesensing 13 04026 g011
Table 1. Comparison between the performances of the BIONOTE-L and the new device for the sensor network based on their main features.
FeaturesBIONOTE-LNew Device
Size14 × 12.5 × 6 cm33.5 × 7.5 × 2.5 cm3
Voltage supply 12   V 3.7 V
Current153 mA70 mA
Power consumption856 mW259 mW
BatteryNoYes (rechargeable)
BluetoothNoYes (BLE)
Table 2. Key parameters of the five water samples used for the comparison test.
ParameterW1W2W3W4W5
Dry residue @180 °C [mg/L]22745313174.180
Electrical
conductivity @20 °C [μS/cm]
25.21104493276.3119
pH6.95.87.27.57.8
Publisher’s Note: MDPI stays neutral with regard to jurisdictional claims in published maps and institutional affiliations.

