Article

Urban Water Quality Assessment Based on Remote Sensing Reflectance Optical Classification

1
Key Laboratory of Virtual Geographic Environment of Education Ministry, Nanjing Normal University, Nanjing 210023, China
2
Jiangsu Center for Collaboration Invocation in Geographical Information Resource Development and Application, Nanjing 210023, China
3
State Key Laboratory of Hydrology-Water Resources and Hydraulic Engineering, Nanjing Hydraulic Research Institute, Nanjing 210029, China
4
Yangtze River Basin Ecological Environment Monitoring and Scientific Research Center, Yangtze River Basin Ecological Environment Supervision and Administration Bureau, Ministry of Ecological Environment, Wuhan 430010, China
*
Author to whom correspondence should be addressed.
Remote Sens. 2021, 13(20), 4047; https://doi.org/10.3390/rs13204047
Submission received: 20 August 2021 / Revised: 22 September 2021 / Accepted: 5 October 2021 / Published: 10 October 2021

Abstract

:
With the acceleration of urbanization, increasing water pollution means that monitoring and evaluating urban water quality are of great importance. Although highly accurate, traditional evaluation methods are time consuming, laborious, and vastly insufficient in terms of the continuity of spatiotemporal coverage. In this study, a water quality assessment method based on remote sensing reflectance optical classification and the traditional grading principle is proposed. In this method, an optical water type (OWT) library was first constructed using the measured in situ remote sensing reflectance dataset based on fuzzy clustering technology. Then, comprehensive scoring rules were established by combining OWTs and 12 water quality parameters, and water quality was graded into different urban water quality levels (UWQLs) based on the scoring results. Using the proposed method, the relative water quality of urban waterbodies was qualitatively evaluated at the macro level based on images from the multispectral imager of Sentinel-2. In addition, there was a significant positive correlation between the UWQLs and the water quality index (WQI). These results indicate the potential of this method for quantitative assessment of urban water quality, providing a new way to evaluate water quality using remote sensing algorithms in the future.

1. Introduction

Urban waterbodies include rivers, ponds, lakes, and reservoirs, which have important functions in society, such as drinking water supply, flood control and drainage, tourist landscapes, and ecological corridors [1]. With the acceleration of urbanization, pollutants such as nitrogen, phosphorus, harmful organic substances, heavy metals, and microorganisms produced by urban activities are discharged into the water environment and can exceed water quality standards. In this case, such pollutants cause the deterioration of water quality, ultimately seriously damaging waterbody functioning [2,3]. Water quality evaluation is the premise for environmental supervision departments to control water pollution [4,5]. Therefore, it is critical to obtain exhaustive water quality evaluation information efficiently and accurately.
In urban water quality assessment research, there are two main types of traditional evaluation methods: (1) On the premise of continuously collecting water quality parameters, single or multiple parameters of an urban water area are directly or indirectly analyzed and evaluated. For example, by appraising the trend of variation in total suspended matter (TSM) [5], dissolved oxygen (DO) [2,6], pH [6,7], and so on, the water quality status of some urban rivers/lakes affected by urbanization in some developing countries have been studied [8,9]. (2) Water quality grade indices are constructed using the single-factor assessment method and water quality index (WQI) [10,11]. For example, [12] studied the variation tendency of surface water quality in China from 2003 to 2017 by referring to the National Surface Water Environmental Quality Standards (GB 2002-3838). These standards divide surface water quality into classes I, II, III, IV, and V (good to bad) based on 24 water quality parameters and the single-factor assessment method [13,14]. In addition, based on water quality monitoring data (2014–2016) from the Huangbaihe River basin, [13] classified the water quality of urban rivers by combining GB 2002-3838 and the WQI, which is a dimensionless number calculated by combining multiple water quality parameters. Although these traditional methods are simple and authentic, they rely on a large number of onsite samples and are time consuming and labor intensive [15]. Moreover, the spatial scale of the evaluation results is relatively small and the spatial–temporal continuity is low; thus, it is difficult to fully meet the needs of environmental supervision departments.
Remote sensing is an emerging technology that was developed in the early 1960s, and has the advantages of a wide range, long timeseries, and low cost [16]. Owing to these advantages, remote sensing has been widely applied to urban water quality assessment. Water quality parameters such as chlorophyll-a (Chla) [17,18], total suspended matter [19], colored dissolved organic matter (CDOM) [19], and transparency (SD) [18] have been retrieved from the remote sensing images of water areas significantly affected by urban activities, and the mapping results have been used in dynamic monitoring and the evaluation of water quality [15,20]. It is worth noting that only the water quality parameters with optical signals can be precisely retrieved by remote sensing. However, water pollution is often the consequence of comprehensive changes in multiple water quality indicators, and it is impossible to fully reflect the water quality status based on one indicator or several indicators. Fortunately, changes in water quality eventually cause changes in the water color indicators of remote sensing images. Therefore, some scholars have conducted research on using water optical classification to retrieve water quality parameters and perform water quality assessments [21,22,23,24,25,26,27].
Water optical classification aims to classify natural waters according to their optical properties, and the most common classification method is clustering technology [23]. The optical water types (OWTs) obtained by remote sensing reflectance clustering can not only represent the optical diversity of water [28], but also reflect the variation in underwater biogeochemistry [29]. In addition, OWTs are also directly used for the interpretation and analysis of ecological diversity and patterns in the study of ocean and inland lake water [30]. This shows the potential of OWTs to distinguish water quality differences in wide-ranging water areas. In urban water quality research, OWTs have been used to identify and classify black-odorous water in urban areas. For instance, [26] applied a CIE (Commission Internationale de L’Eclairage) color purity algorithm to identify black-odorous water in urban rivers using multispectral remote sensing images. However, it is insufficient to divide urban water into ordinary water and black-odorous water. Further subdivision and comparative evaluation of urban water quality is important for urban water management and protection. Therefore, the purpose of this study is to: (1) construct a comprehensive assessment method for urban water quality based on remote sensing reflectance optical classification and the traditional water quality grading principle; and (2) apply this method to satellite images acquired by the multispectral imager (MSI) sensor on the Sentinel-2 platform of the European Space Agency to explore its capability.

2. Materials and Methods

2.1. Study Area

Nanjing, Yangzhou, Changzhou, Changsha, and Wuxi in China were selected as the study areas (Figure 1). These cities are all located in the Yangtze River basin, covering abundant waterbody types. Among them, Nanjing (118°22′–119°14′E, 31°14′–32°37′N) is an important gateway city with a population density of 1290 per km2 in the Yangtze River Delta Economic Belt of China and covers an area of 971.62 km2. There are hundreds of waterbodies of different sizes in Nanjing, including the Yangtze River, Qinhuai River, Chu River, and Gucheng Lake [31]. The main city zone is traversed by the main stream of the Yangtze River, and some river reaches in the built-up area are relatively turbid because of large sediment inputs. Yangzhou (119°01′–119°54′E, 32°15′–33°25′N) covers an area of 148.96 km2 at the intersection of the Yangtze River and the Beijing–Hangzhou Grand Canal with a population density of 694 per km2, and is characterized by a dense water network. Changzhou (119°08′–120°12′E, 31°09′–32°04′N) and Wuxi (119°31′–120°36′E, 31°07′–32°02′N) are central cities in the Yangtze River Delta region of China. Changzhou has a relatively high population density (881 per km2) and an urban development area of 261.2 km2. It is a typical water-scarce city characterized by extensive water pollution despite its abundant water resources (total surface water volume of 6.062 × 10⁹ m3) [32]. Wuxi is located at the northeastern corner of Taihu Lake with a population density of 1671 per km2, which is an industrial hub that accommodates thousands of factories. Rivers in Wuxi mainly flow into Lake Taihu, thus directly affecting the water quality of the lake [33]. Changsha (111°53′–114°5′E, 27°51′–28°40′N) is located in the northeastern part of Hunan Province, and is an important central city in the middle reaches of the Yangtze River, with an urbanized area of 374.64 km2 and a population density of 617 per km2. Changsha is also known as the “Xiangliu Basin,” and the Liuyang, Laodao, and Meixi rivers from different origins are injected into the Xiangjiang River in the urban area, which flows through the middle of the city into Dongting Lake [34]. In summary, these cities have various types of water types that exhibit different water quality characteristics corresponding to their geographical environments and urban industrial structures. In addition, changes in terrain characteristics (such as the degree of flatness in each urban surface), climatic conditions (e.g., precipitation, sunshine and so on), and human activities of each city have also led to variations in the density of the water network and water volume. Therefore, the water quality assessment method based on the observation data of these cities has wide applicability.

2.2. In Situ Data Collection

From 2014 to 2019, 463 water samples were collected from the study area, and the remote sensing reflection (Rrs) and water quality parameters were measured simultaneously.

2.2.1. Determination of Remote Sensing Reflection

An ASD FieldSpec spectroradiometer (ASD Inc., Boulder, CO, USA) was used to measure the in situ Rrs. The sensor had 512 channels over a spectral range of 350–1050 nm. The collected spectra with a spectral resolution of 1.5 nm were interpolated into a 1 nm scale. In accordance with the Ocean Optics Protocols [35], the above-water measurement method was used to measure the radiance spectra of the reference panel, water, and sky, respectively. Ten spectra were collected at each site. The abnormal spectra were eliminated, while the valid spectra were retained and averaged. Finally, Rrs(λ) was derived using Equation (1) [36]:
R rs λ = ( L t - r   ×   L sky ) / ( L p   ×   π / ϱ p )
where Lt is the measured total radiance of the water surface; r denotes skylight reflectance at the air–water surface, and its value is affected by water surface roughness caused by wind speed (2.2% for calm weather; 2.5% for a wind speed of <5 m/s; 2.6–2.8% for a wind speed of ~10 m/s); Lsky is the measured radiance from the sky; LP is the measured radiance of the gray reference panel (SG-3183, SphereOptics GmbH of Germany); and ϱ p is the reflectance of the gray diffuse panel (30%).

2.2.2. Measurement of Water Quality Parameters

Water quality parameters were measured at the sampling site and in the laboratory. Some water quality parameters such as the DO concentration (DO meter, YSI-550A-12), oxidation–reduction potential (ORP, ORP meter, CT8022), and SD (Secchi disk, SD20), pH (PH meter, SX-620) were measured at the sampling site [9,37]. At the same time, water samples were collected using Niskin bottles from a 10 cm water depth at each sampling site. Samples were then frozen at −20 °C and transported to the laboratory [38]. Then, the water quality parameters, including the Chla concentration, TSM concentration, total nitrogen (TN) concentration, ammonia nitrogen (NH4-N) concentration, total phosphorus (TP) concentration, sulfide concentration, dissolved organic carbon (DOC) concentration, and absorption coefficient of CDOM (aCDOM(λ)), were measured in the laboratory. Among them, Chla, TN, NH4-N, TP, and aCDOM(λ), were analyzed by SHIMADZU UV spectrophotometer (UV-3600Plus), and the analysis methods were hot ethanol extraction [39], digital titrimetric, nesslerization [40], molybdenum blue [41], and the filtration twice method [42], respectively. TSM and DOC were analyzed through gravimetric and combust method [43,44], and the equipment used was a temperature-controlled oven (SXL-1016) and SHIMADZU TOC-L analyzer, respectively. Sulfide was acquired through a sulfide tester (LHW-1A) [9]. Before the measured water quality data were included in the dataset, their quality was checked, and finally a total of 463 sets of water quality parameter data were used in this study (Table 1).

2.3. Sentinel-2 MSI Data Acquisition and Preprocessing

Level-1C (L1C) MSI data from the Nanjing built-up area on 19 July 2017, were downloaded from the Copernicus Open Access Hub (https://scihub.copernicus.eu/) to apply the water quality assessment method [45]. Considering the spectral and spatial resolutions for urban water monitoring, bands with spatial resolutions of 10 m and 20 m were used in this study [46]. To maintain the resolution consistency, images with a spatial resolution of 20 m were resampled to 10 m.
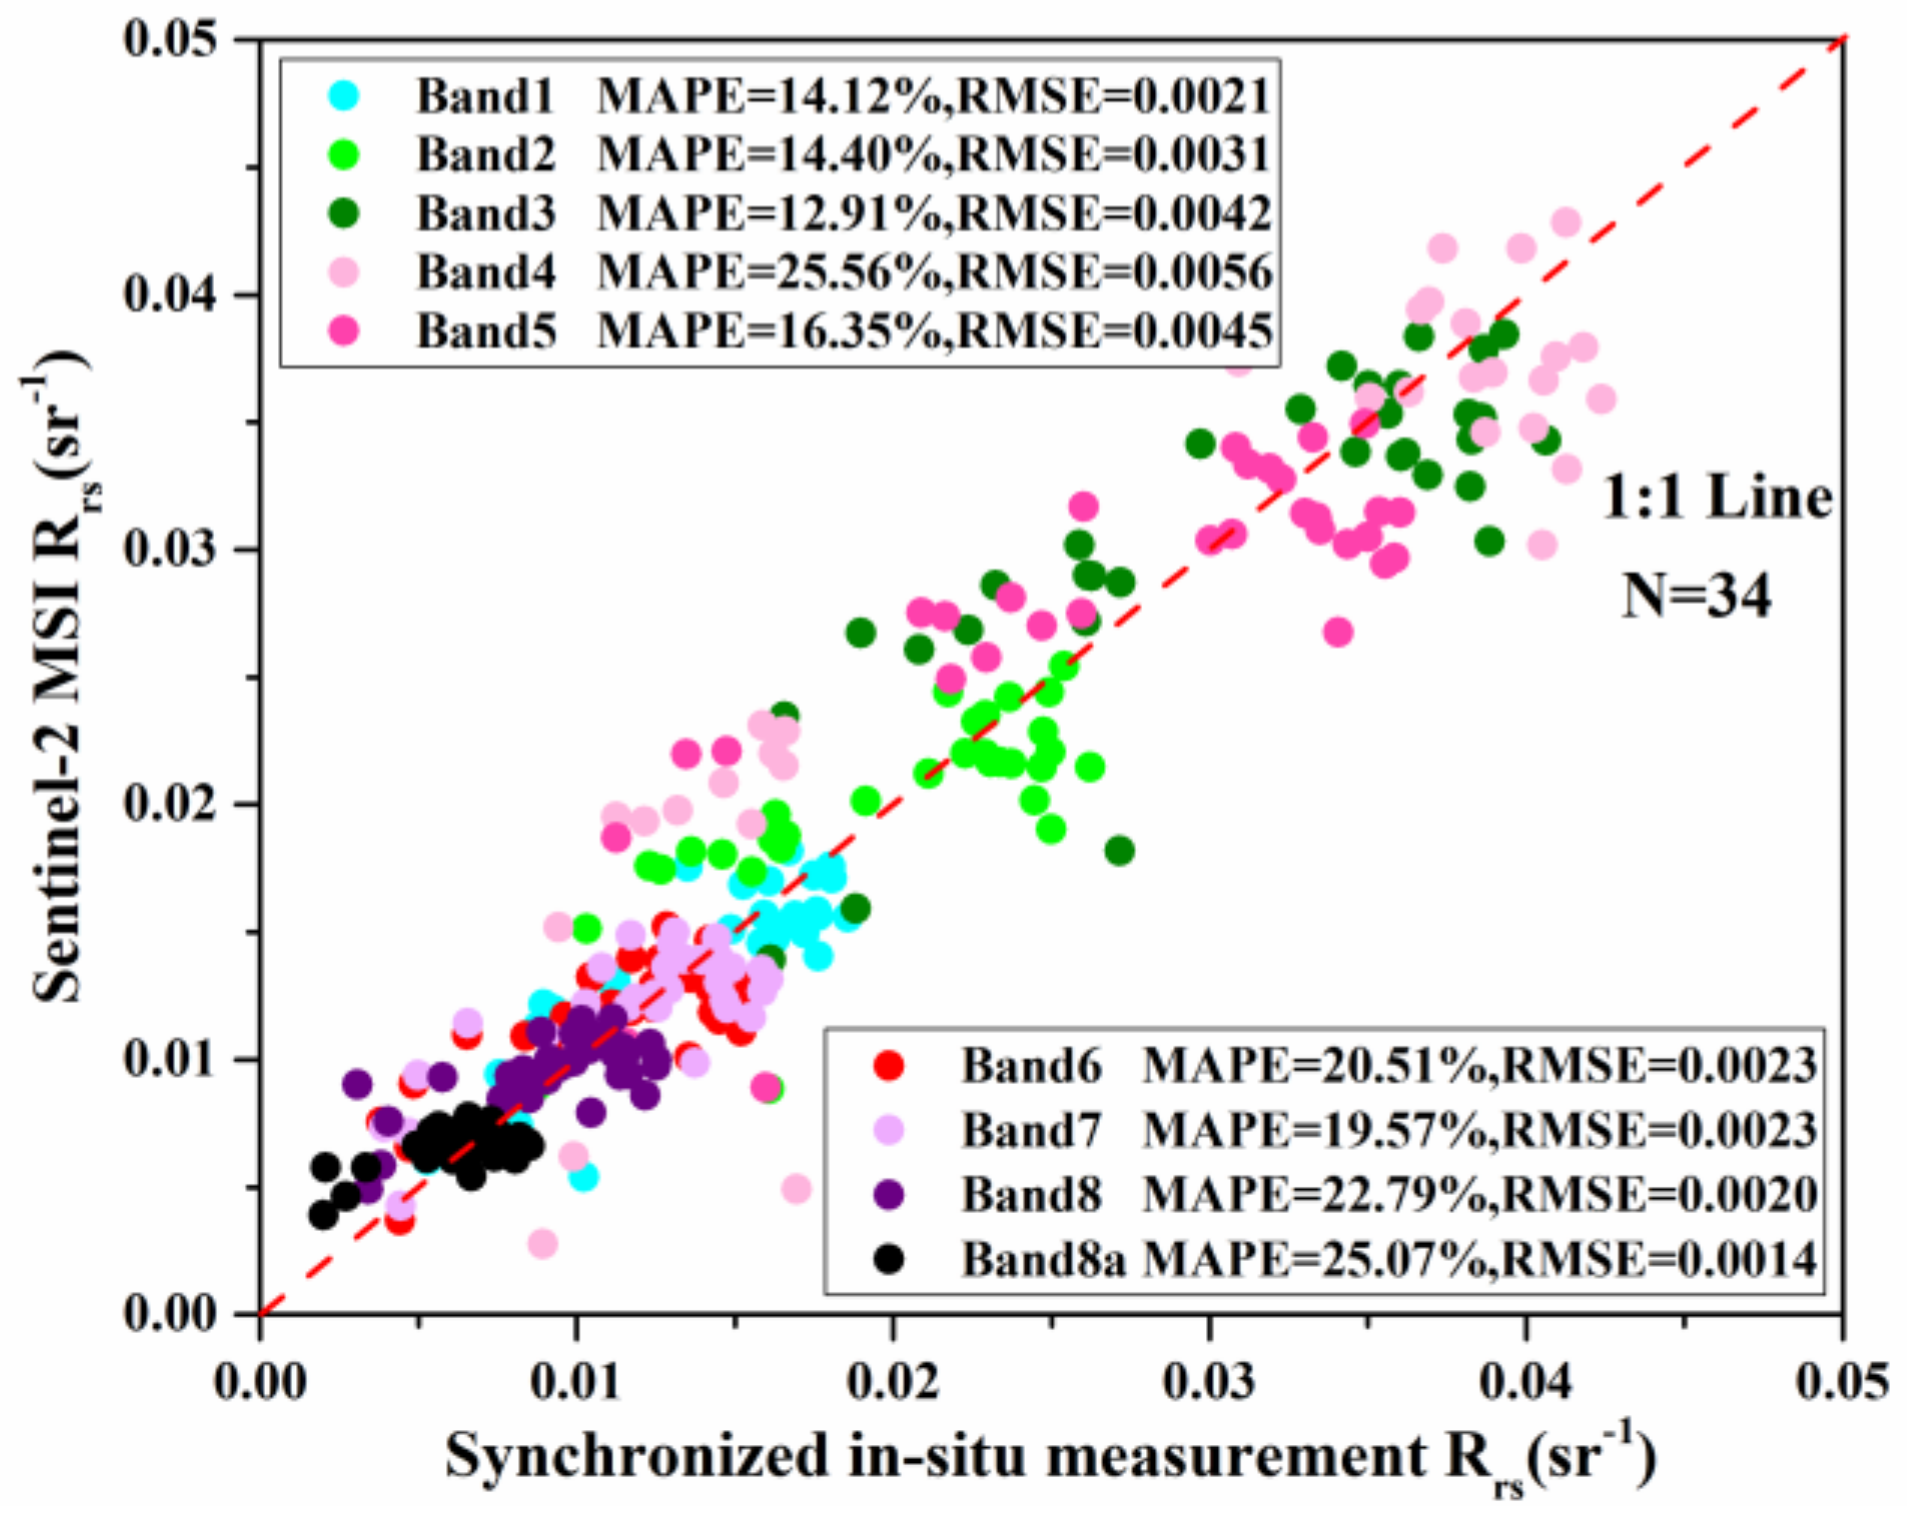
The Sen2Cor processor was used to perform atmospheric correction on the images to obtain the Level-2A Bottom of Atmosphere reflectance product (derived from the associated L1C data). The performance of Sen2Cor was evaluated by comparing the Sentinel-2 MSI and synchronized field-measured Rrs values. Figure 2 shows the Rrs distribution of the in situ observations and atmospheric correction values of 34 synchronized samples. The scattered points were fitted with a 1:1 line. The mean absolute percentage error (MAPE) was <26% and the root mean square error (RMSE) was <0.0056 sr−1, suggesting that the Sen2Cor processor can be used in the study region [23].

2.4. Urban Water Quality Assessment Method Based on Optical Classification

This study proposes an urban water quality assessment method based on combining optical classification and water quality scoring rules. Using this method, the water quality assessment procedure can be divided into three parts: first, an OWT library was constructed using the Rrs dataset measured in situ; second, comprehensive scoring rules were established by combining OWTs and water quality parameters; and finally, the water quality was graded into urban water quality levels (UWQLs) based on the comprehensive scores.

2.4.1. Construction of the OWT Library

Clustering analysis can classify objects with similar attributes into the same type and has been successfully used in case I or II water classification studies. In [47] was proposed a fuzzy clustering algorithm (FCMm) by improving the fuzzy c-means algorithm. Using this method, the fuzzy parameters can be adaptively calculated in accordance with the output dataset to further improve the clustering effect. Therefore, the urban OWT library was constructed using the FCMm algorithm based on the Rrs measured in situ.
To highlight the spectral shape characteristics and eliminate the differences caused by the different observation times and locations [48], the measured Rrs was first normalized (Equation (2)).
NR rs ( λ ) = R rs ( λ ) 400 900 R rs ( λ ) d λ
where λ is the wavelength and NRrs(λ) is the integral-normalized Rrs(λ) (dimensionless).
The integral-normalized Rrs of the original spectra were used as the input of the FCMm algorithm to obtain the OWTs. Additionally, the trial and error method was used to determine the appropriate clustering number K [49], and K was finally determined by a comprehensive analysis of the indicators of training effectiveness (partition entropy, partition coefficient, modified partition coefficient, and fuzzy silhouette index).

2.4.2. Establishment of the Comprehensive Scoring Rules of Urban Water Quality

In general, OWTs, which were generated according to the spectral characteristics of Rrs, could reflect the water quality information. However, it is not clear which type of OWT represents better water quality and which type represents worse water quality. To use OWTs to evaluate water quality directly, we tried to establish the relationship between OWTs and water quality indicators monitored by conventional methods [9]. Therefore, 12 water quality parameters were selected to verify the effect of OWTs on water quality. The selection of parameters was based on the following aspects: nutritional status (Chla, TN, TP, and pH), turbidity (as TSM), black-odorous degree (DOC, NH4-N, SD, ORP, and Sulfide), and others (DOC and aCDOM(440)).
To evaluate the water quality of the different OWTs, a grading scheme was developed based on the above 12 water quality parameters. The specific steps were as follows: (1) The 25% trimmed mean (hereafter trimmed mean) of each water quality variable of each OWT was calculated to represent the content of the water quality parameters in each OWT. (2) The trimmed means of different OWTs were sorted, in which the values of nine parameters (Chla, TN, TP, pH, TSM, NH4-N, sulfide, aCDOM(440), and DOC) were sorted from large to small, while the values of CDO, SD, and ORP were sorted from small to large. Then, the series of 12 sorted values were scored in ascending order from 1 to n, where n is the number of OWT types. Therefore, 12 series of sub-scores of 12 water quality parameters were obtained. (3) The total scores of each OWT were calculated by summing the scores of all parameters in the specific OWT type. (4) The total scores of each OWT were then sorted in descending order. The higher the score, the better the water quality. For the convenience of expression, the water quality was named UWQL*. For example, if a certain OWT had the highest score, its water quality level was expressed as UQWL1.

3. Results and Analysis

3.1. Optical Water Types of Urban Waterbodies

3.1.1. OWTs Classified by Rrs Measured In Situ

The results show that eight OWTs could be obtained by FCMm clustering technology combined with the evaluation of trial and error. That is, the OWT library included eight types of OWTs, namely OWT1–OWT8. Among them, OWT4 contained the most samples, followed by OWT2 and OWT6, collectively accounting for 58% of the total samples. OWT1, OWT3, and OWT5 contained almost the same number of samples, while OWT7 and OWT8 had the least number of samples and collectively accounted for just 6% of the total samples. Figure 3 shows the Rrs spectra of the OWTs. The mean Rrs values of the OWTs showed different magnitudes and spectral characteristics. Although all Rrs values had reflection peaks around 550 nm, 650 nm, 700 nm, and 800 nm, the degrees of steepness were quite different for each OWT. The common feature of OWT1, OWT2, and OWT4 in the visible band was that their reflection peaks at 550 nm were higher than those at 650 nm, 700 nm, and 800 nm, and that the spectral magnitudes in the near-infrared band were relatively small. The peak at 550 nm could be attributed to the weak absorption of Chla and carotene, and the enhancement of particle scattering caused by biological sources (e.g., phytoplankton) and non-biological sources (e.g., sediments) [50,51]. The mean Rrs spectra of OWT3 in the visible band were smooth and the magnitude was approximately twice that of other OWTs. This was because the scattering associated with sediment is very strong and masks the spectral fluctuations caused by the absorption of water components [47]. In contrast, the reflection peak of OWT5 was obvious in the visible band. Its reflection peak near 700 nm was the steepest among all OWTs, which was caused by the combined effect of fluorescence from algae and high backscattering in the red and near-infrared regions of the spectrum associated with high algal particle concentrations [52,53,54]. OWT6 and OWT7 fluctuated relatively smoothly in the range of 400–900 nm, although the peak–trough characteristics in the spectrum of OWT7 were somewhat similar to those of OWT5. OWT8 had similar characteristics to all OWTs in the visible light band, but maintained an upward trend in the near-infrared range, which differed to the normal Rrs spectrum of water. Combined with information from the sampling site photographs, it was found that the surface conditions of OWT8 were vastly complex, with duckweed coverage or aquatic vegetation growth on the water surface. Therefore, the near-infrared spectral uplift reflects the spectral characteristics of green plants.

3.1.2. OWTs in the Urban Built-Up Area of Nanjing Based on Sentinel-2 MSI Images

Compared with the traditional multispectral images, MSI added a blue light band and several red edge bands, making the spectral curve closer to the spectral characteristics of the ground observation results. However, the above classification method is still applicable to MSI data. To explore this, the field-measured integral-normalized Rrs values were simulated to MSI-based derived Rrs using the spectral response function (SRF), according to Equation (3) [43]:
R rs b i = λ m λ n SRF ( λ )   ×   R rs _ meas ( λ ) d λ λ m λ n SRF ( λ ) d λ
where R rs ( b i ) denotes the simulated R rs ( sr 1 ) for the i -th band of MSI, with integration from λ m to λ n for the i -th band.
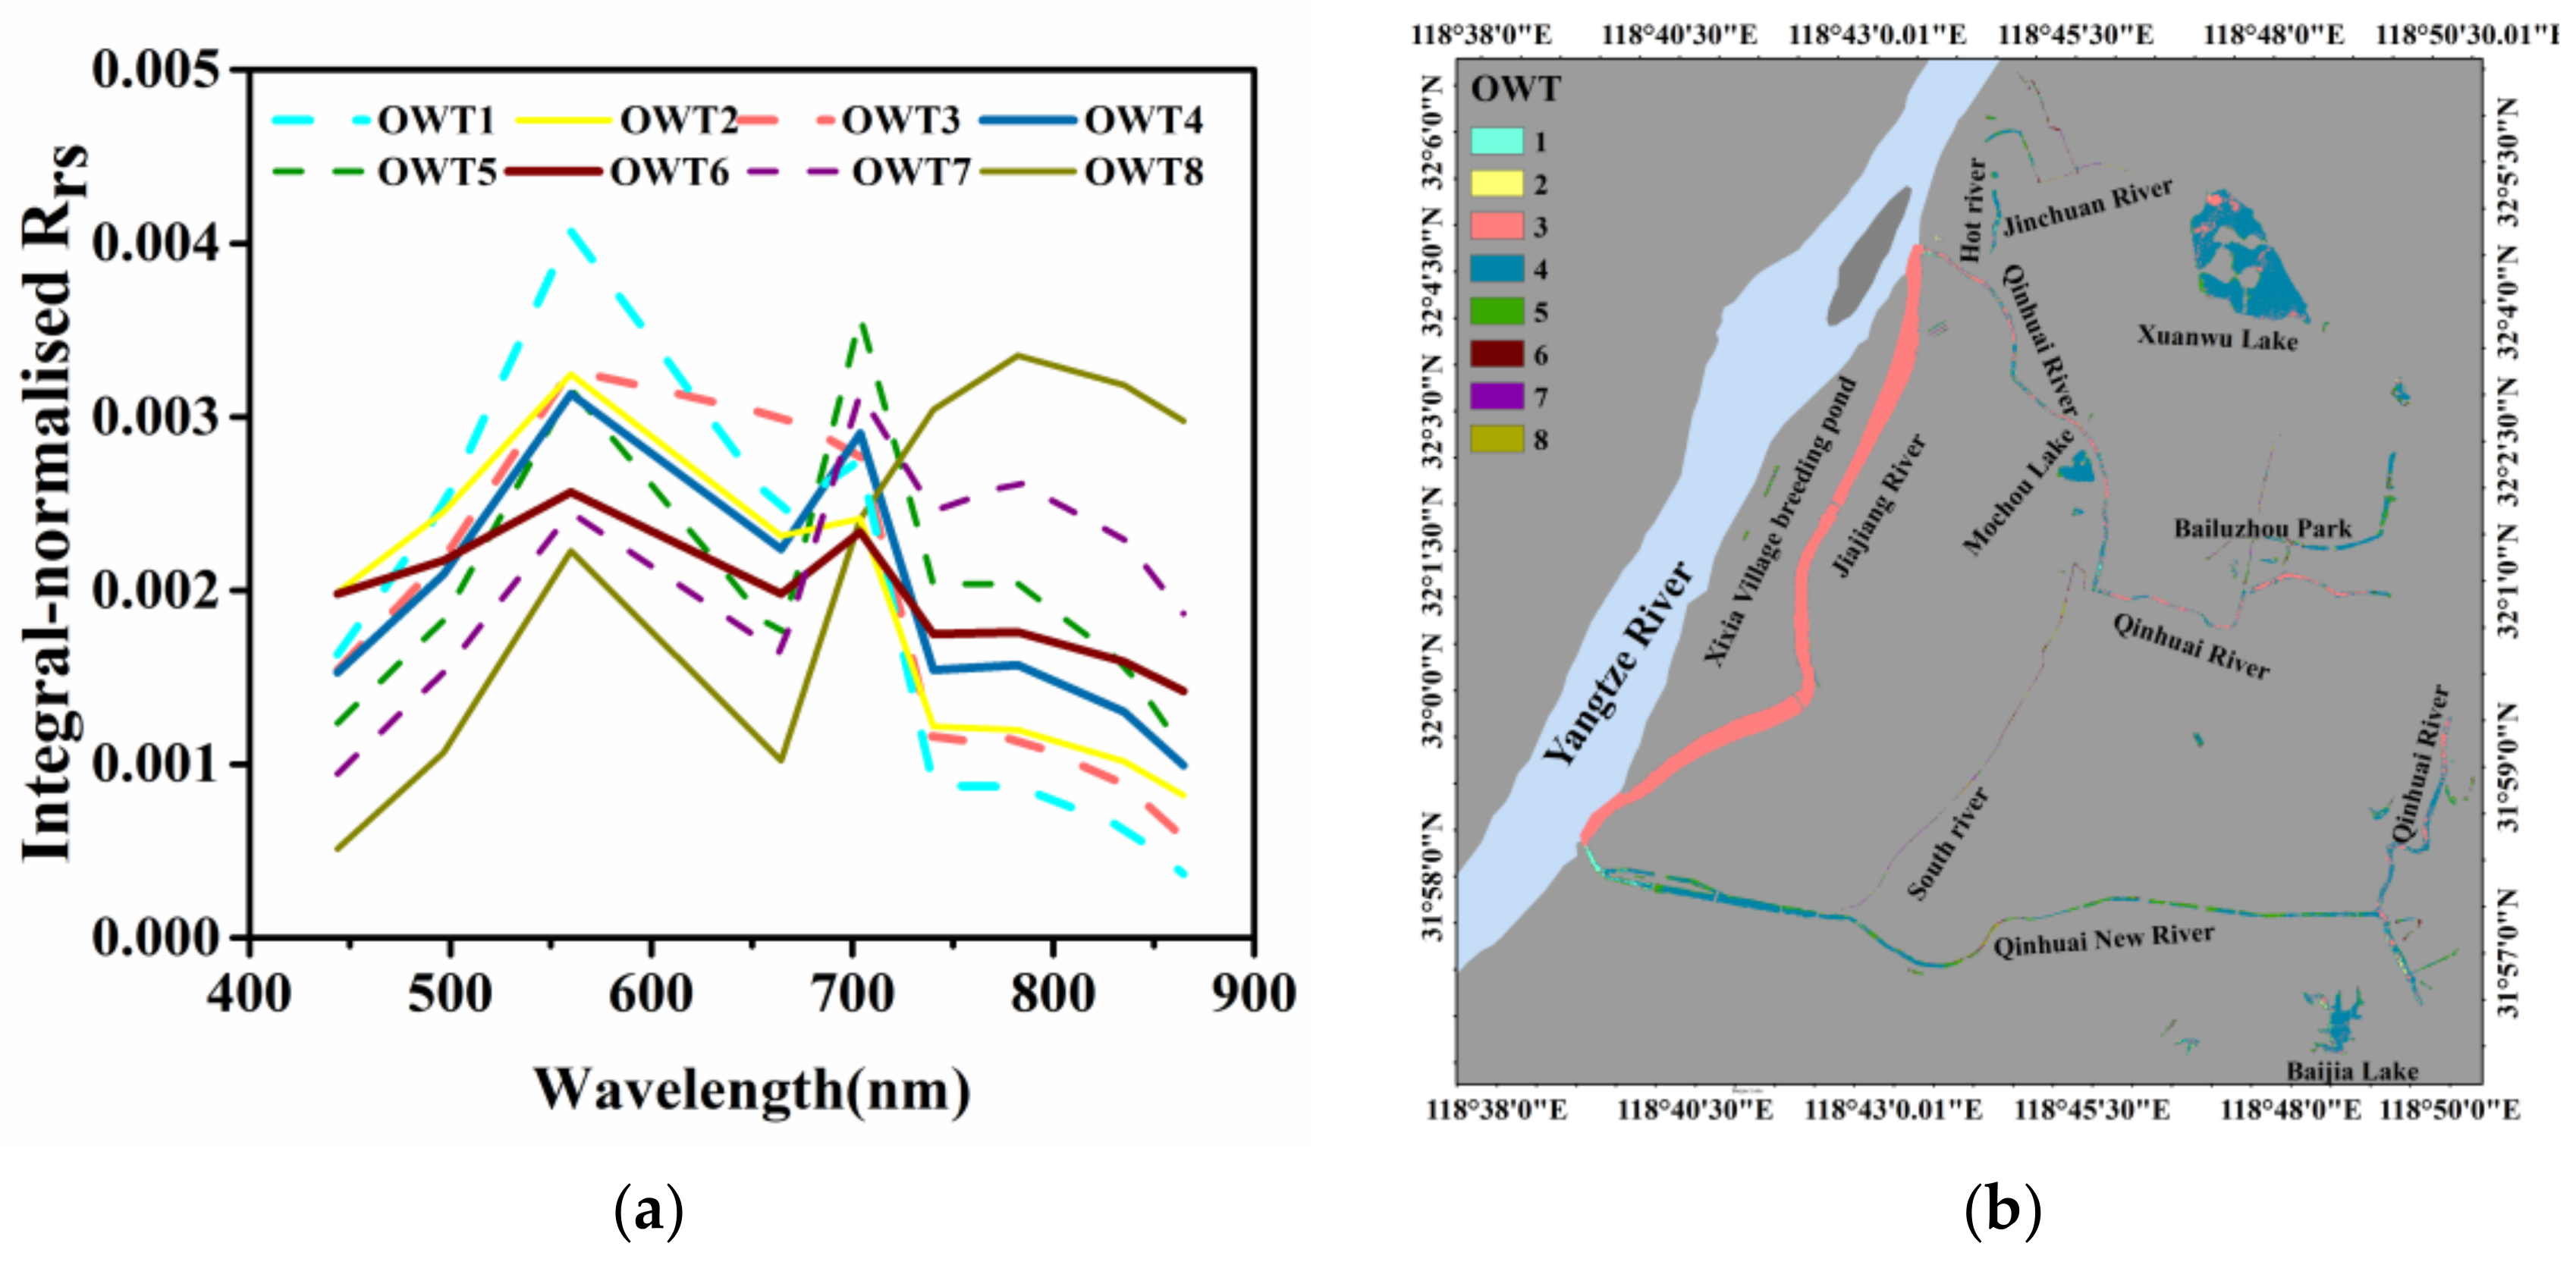
Then, the standard spectra curves of the cluster centers of each OWT were calculated (Figure 4a). The results show that the simulated MSI spectrum not only retained the optical shape features of each OWT, but also retained the amplitude characteristics; therefore, MSI data can be used for OWT classification [55].
Taking Nanjing as a case study area, the FCMm method was applied to the MSI image on 19 July 2017, to obtain the OWTs of Nanjing. To gauge the precision of the classification results of the Sentinel-2 MSI image, 34 synchronized samples were used to calculate the recognition accuracy (RA), using Equation (4) [26]:
RA = Ncorrect   identification Nsum
where Ncorrect identification represents the number of samples that are consistent with the ground truth classification results, and Nsum is the total number.
The results show that the RA reached 85%. In addition, all eight OWTs were obtained for the built-up area of Nanjing (Figure 4b). Among them, OWT3 and OWT4 were the most widely distributed waterbodies and were mainly associated with lakes of different sizes or river reaches adjacent to the Yangtze River. OWT1, OWT2, OWT5, OWT6, OWT7, and OWT8 were scattered in some small waterbodies, such as narrow rivers. The spatial differences in the OWTs in the built-up area of Nanjing indicate that the water in this area has extremely complex optical characteristics.

3.2. Urban Water Quality Grading Evaluation Based on OWTs

3.2.1. Grading Evaluation of OWTs Using the Comprehensive Scoring Rules Based on In Situ Data

To compare and evaluate the water quality difference of the eight OWTs, the scoring rules suggested in Section 2.4.2 were used to grade the OWTs. Because OWT8 was covered by duckweed or vegetation, it was excluded from the scoring sequence and renamed as an UWQL mask (UWQLM). The scoring results show that the total scores ranged from 66 to 27 (Table 2). The scores of OWT1 and OWT2 were the same; hence, these two OWTs were combined into one UWQL. Finally, the water quality (from better to worse) of the OWTs was UWQL1 > UWQL2 > UWQL3 > UWQL4 > UWQL5 > UWQL6, according to the score values. The large score gap of each UWQL indicates strong separability between the OWTs.
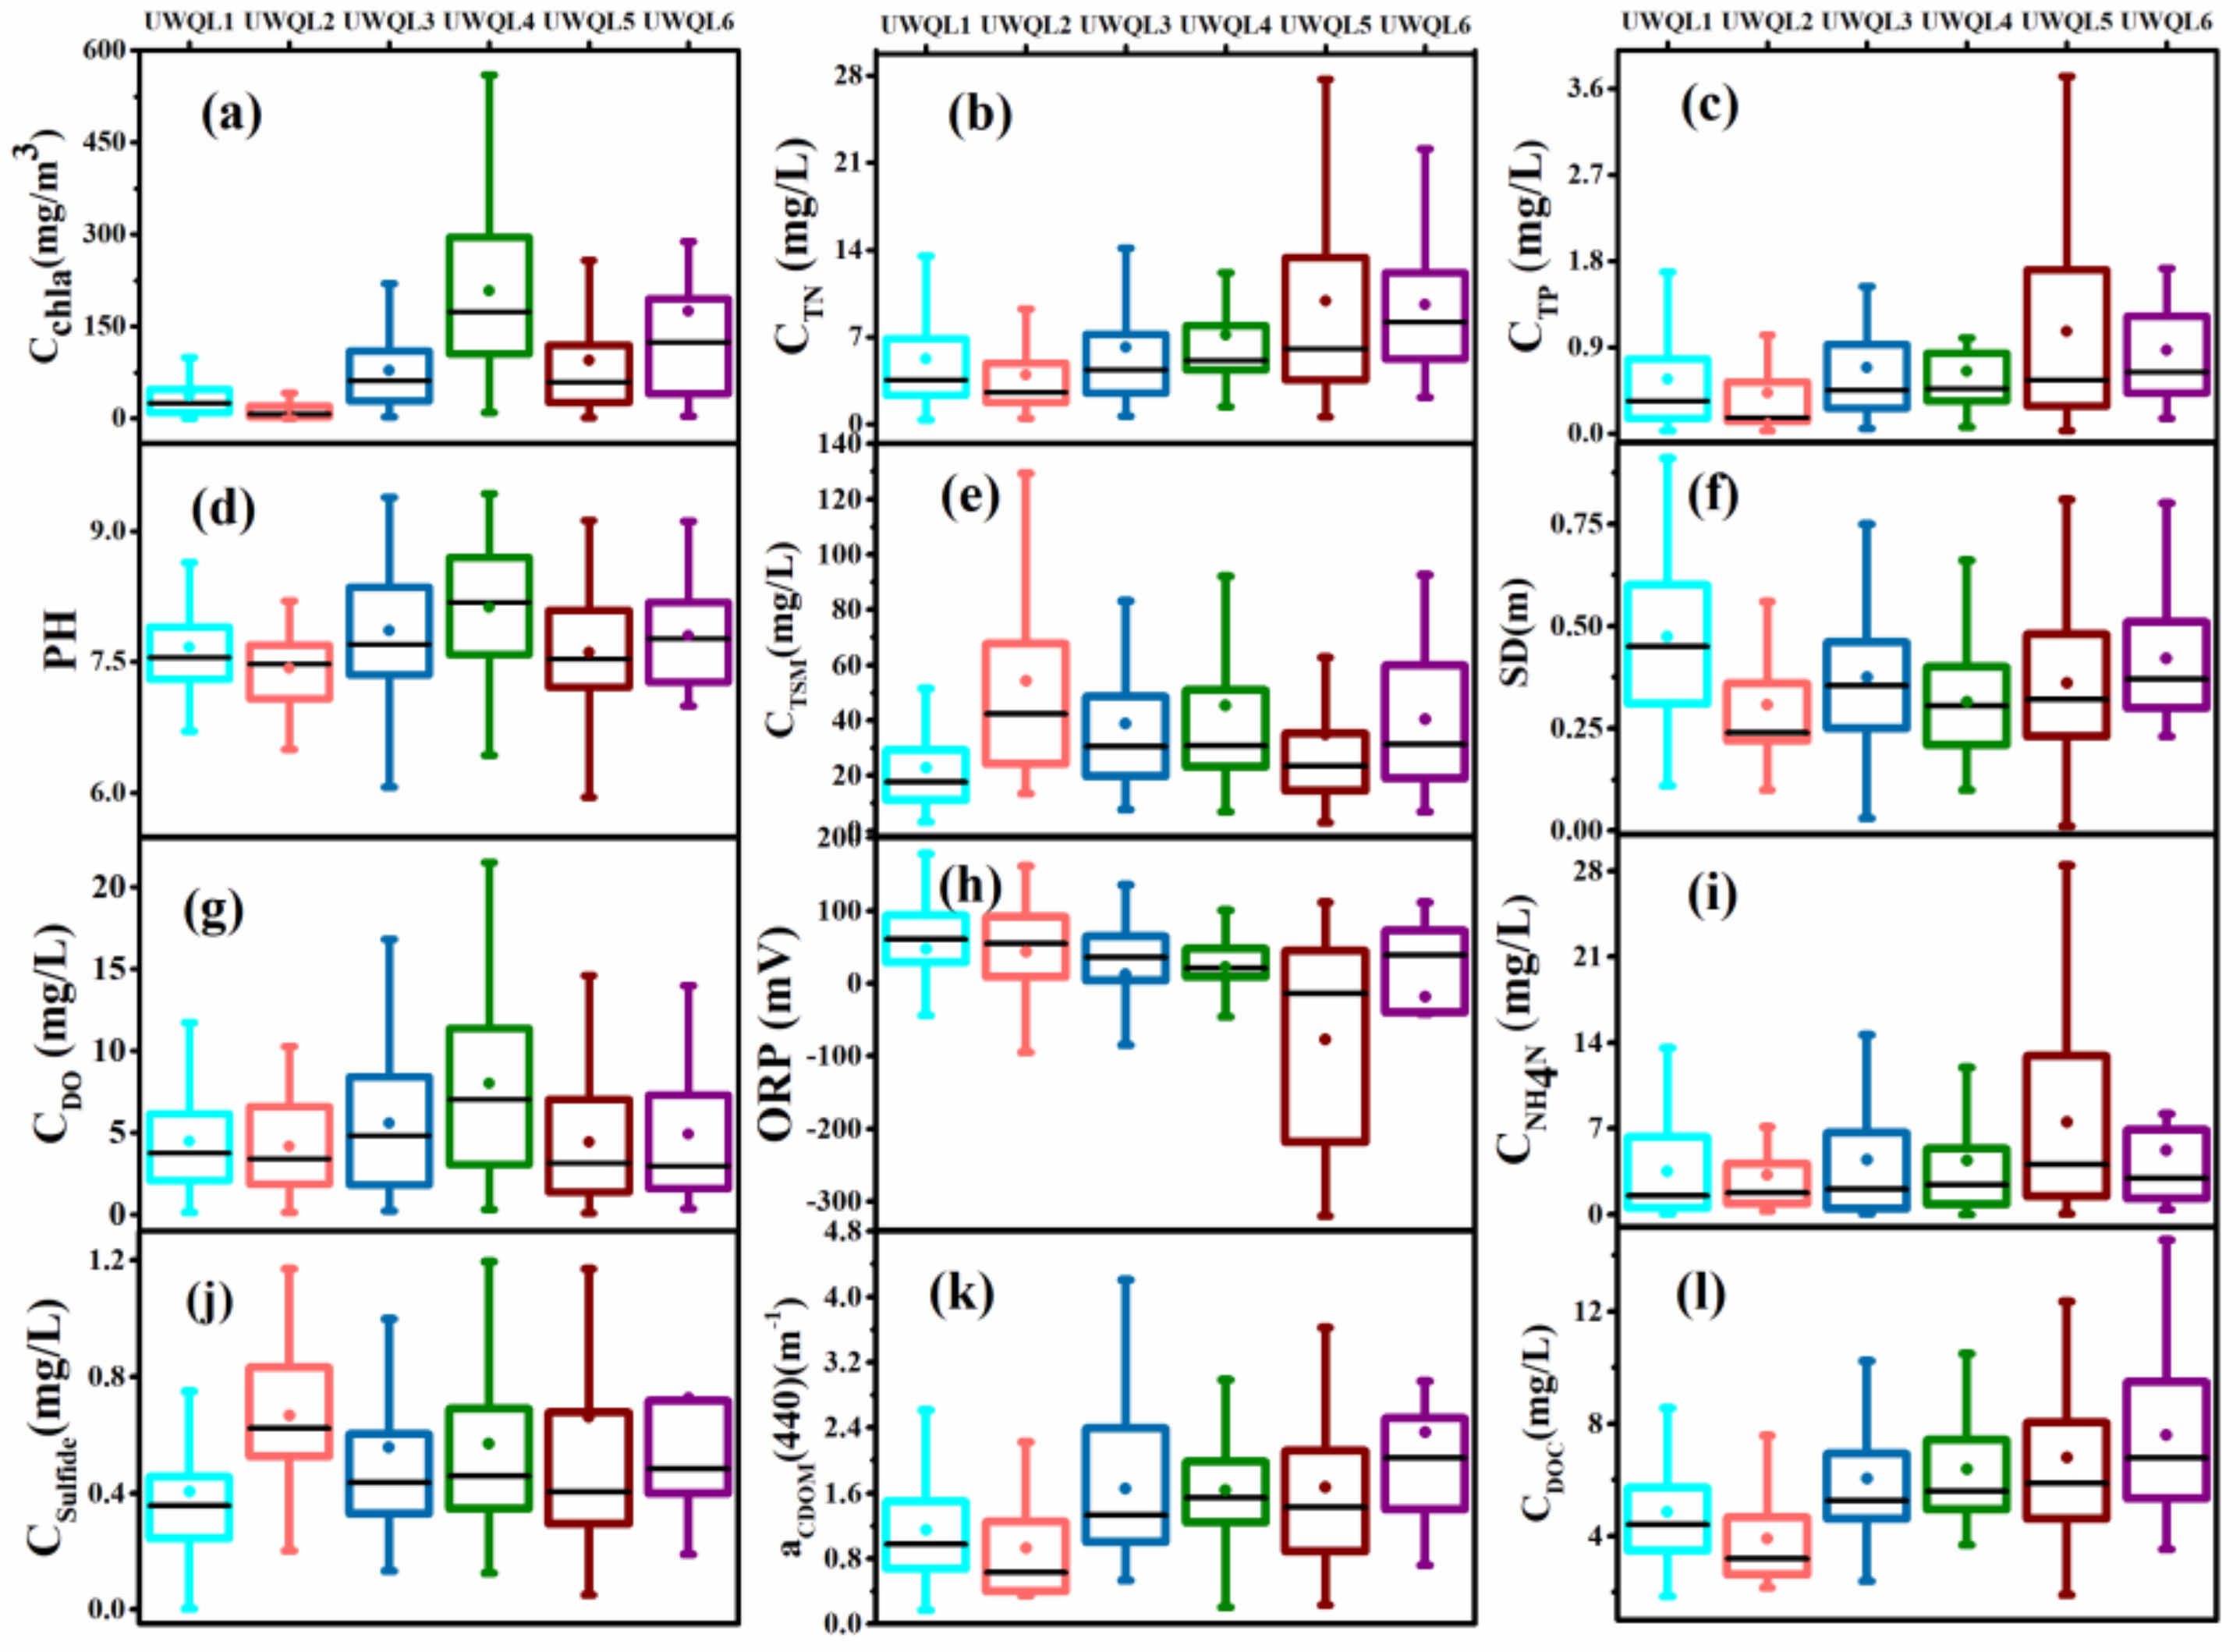
In addition, the boxplots of water quality indicators were analyzed to further understand the water quality characteristics of the UWQLs (Figure 5). The mean Chla (37.55 mg/m3) and TSM concentrations (22.71 mg/L) of UWQL1 were relatively low, and the mean SD value was the highest (0.47 m) of all UWQLs. The Chla concentration (17.71 mg/m3) of UWQL2 was generally very low, while the mean of the TSM concentration (54.14 mg/L) was the highest with low mean water transparency (0.31m). Hence, this water contained a large amount of sediment and was quite turbid. In addition, the mean sulfide concentration reached the level IV class according to environmental quality standards for surface water in China (GB 3838-2002) [14], which may have been due to the contribution of sulfate minerals in the sediment [56]. UWQL4 had relatively high mean Chla (207.8 mg/m3) and DO concentrations (7.98 mg/L), which reached the levels of class I (GB 3838-2002). The strong photosynthesis caused by abundant phytoplankton increased the oxygen content in this type of waterbody [57]. Additionally, the nutrients were extremely high in UWQL5 and UWQL6 waters, while the DO content and ORP were both low. The mean TN and TP concentrations reached the standards of class V, and the mean DO concentration reached class IV. Therefore, these two types of water may be accompanied by black-odorous phenomena, which could be due to the serious impact of urban activities [9]. Overall, the variations in the water quality indicators revealed different features of each UWQL.

3.2.2. Spatial Distribution of Water Quality Types in the Built-Up Area of Nanjing Using MSI Images

By classifying each of the OWT acquired from the MSI image into UWQLs according to Table 2, the spatial distribution of UWQLs in Nanjing on 19 July 2017, was obtained. As shown in Figure 6, UWQL2 and UWQL3 collectively covered an area of 11.27 km2, accounting for 88.07% of the total area. These were the most widely distributed waterbodies among all water quality types. In contrast, UWQL1, UWQL5, and UWQLM collectively covered just 0.35 km2, accounting for the smallest proportions of the total area (1.41%, 0.65%, 0.69%, respectively). UWQL1 was distributed in ornamental ponds, lakes, and some wide rivers in residential areas. UWQL2 was mainly distributed in the Jiajiang and Qinhuai river sections that are connected to the Yangtze River. UWQL3 was widely distributed in rivers, lakes, and ponds in built-up areas. UWQL4 was distributed in some sections of the Qinhuai New River, artificial breeding ponds, and the sections of some lakes. The common feature of UWQL5 and UWQL6 was that they mainly corresponded small rivers and ponds. Better water quality was mainly associated with waterbodies that are managed regularly; for example, those adjacent to the Yangtze River with strong flow conditions, or some large ornamental lakes. In addition, high-nutrient water containing a large amount of algae was mainly distributed in rivers with weak flow conditions and some artificial breeding ponds. Poor water quality, which may be accompanied by black-odorous phenomena, was mainly associated with small waterbodies near dense residential areas or polluting factories.
To explore the rationality of the evaluation results, six typical water areas (Figure 6) were selected to analyze the formation causes of their water qualities based on the surrounding environmental factors and site photographs (Figure 7).
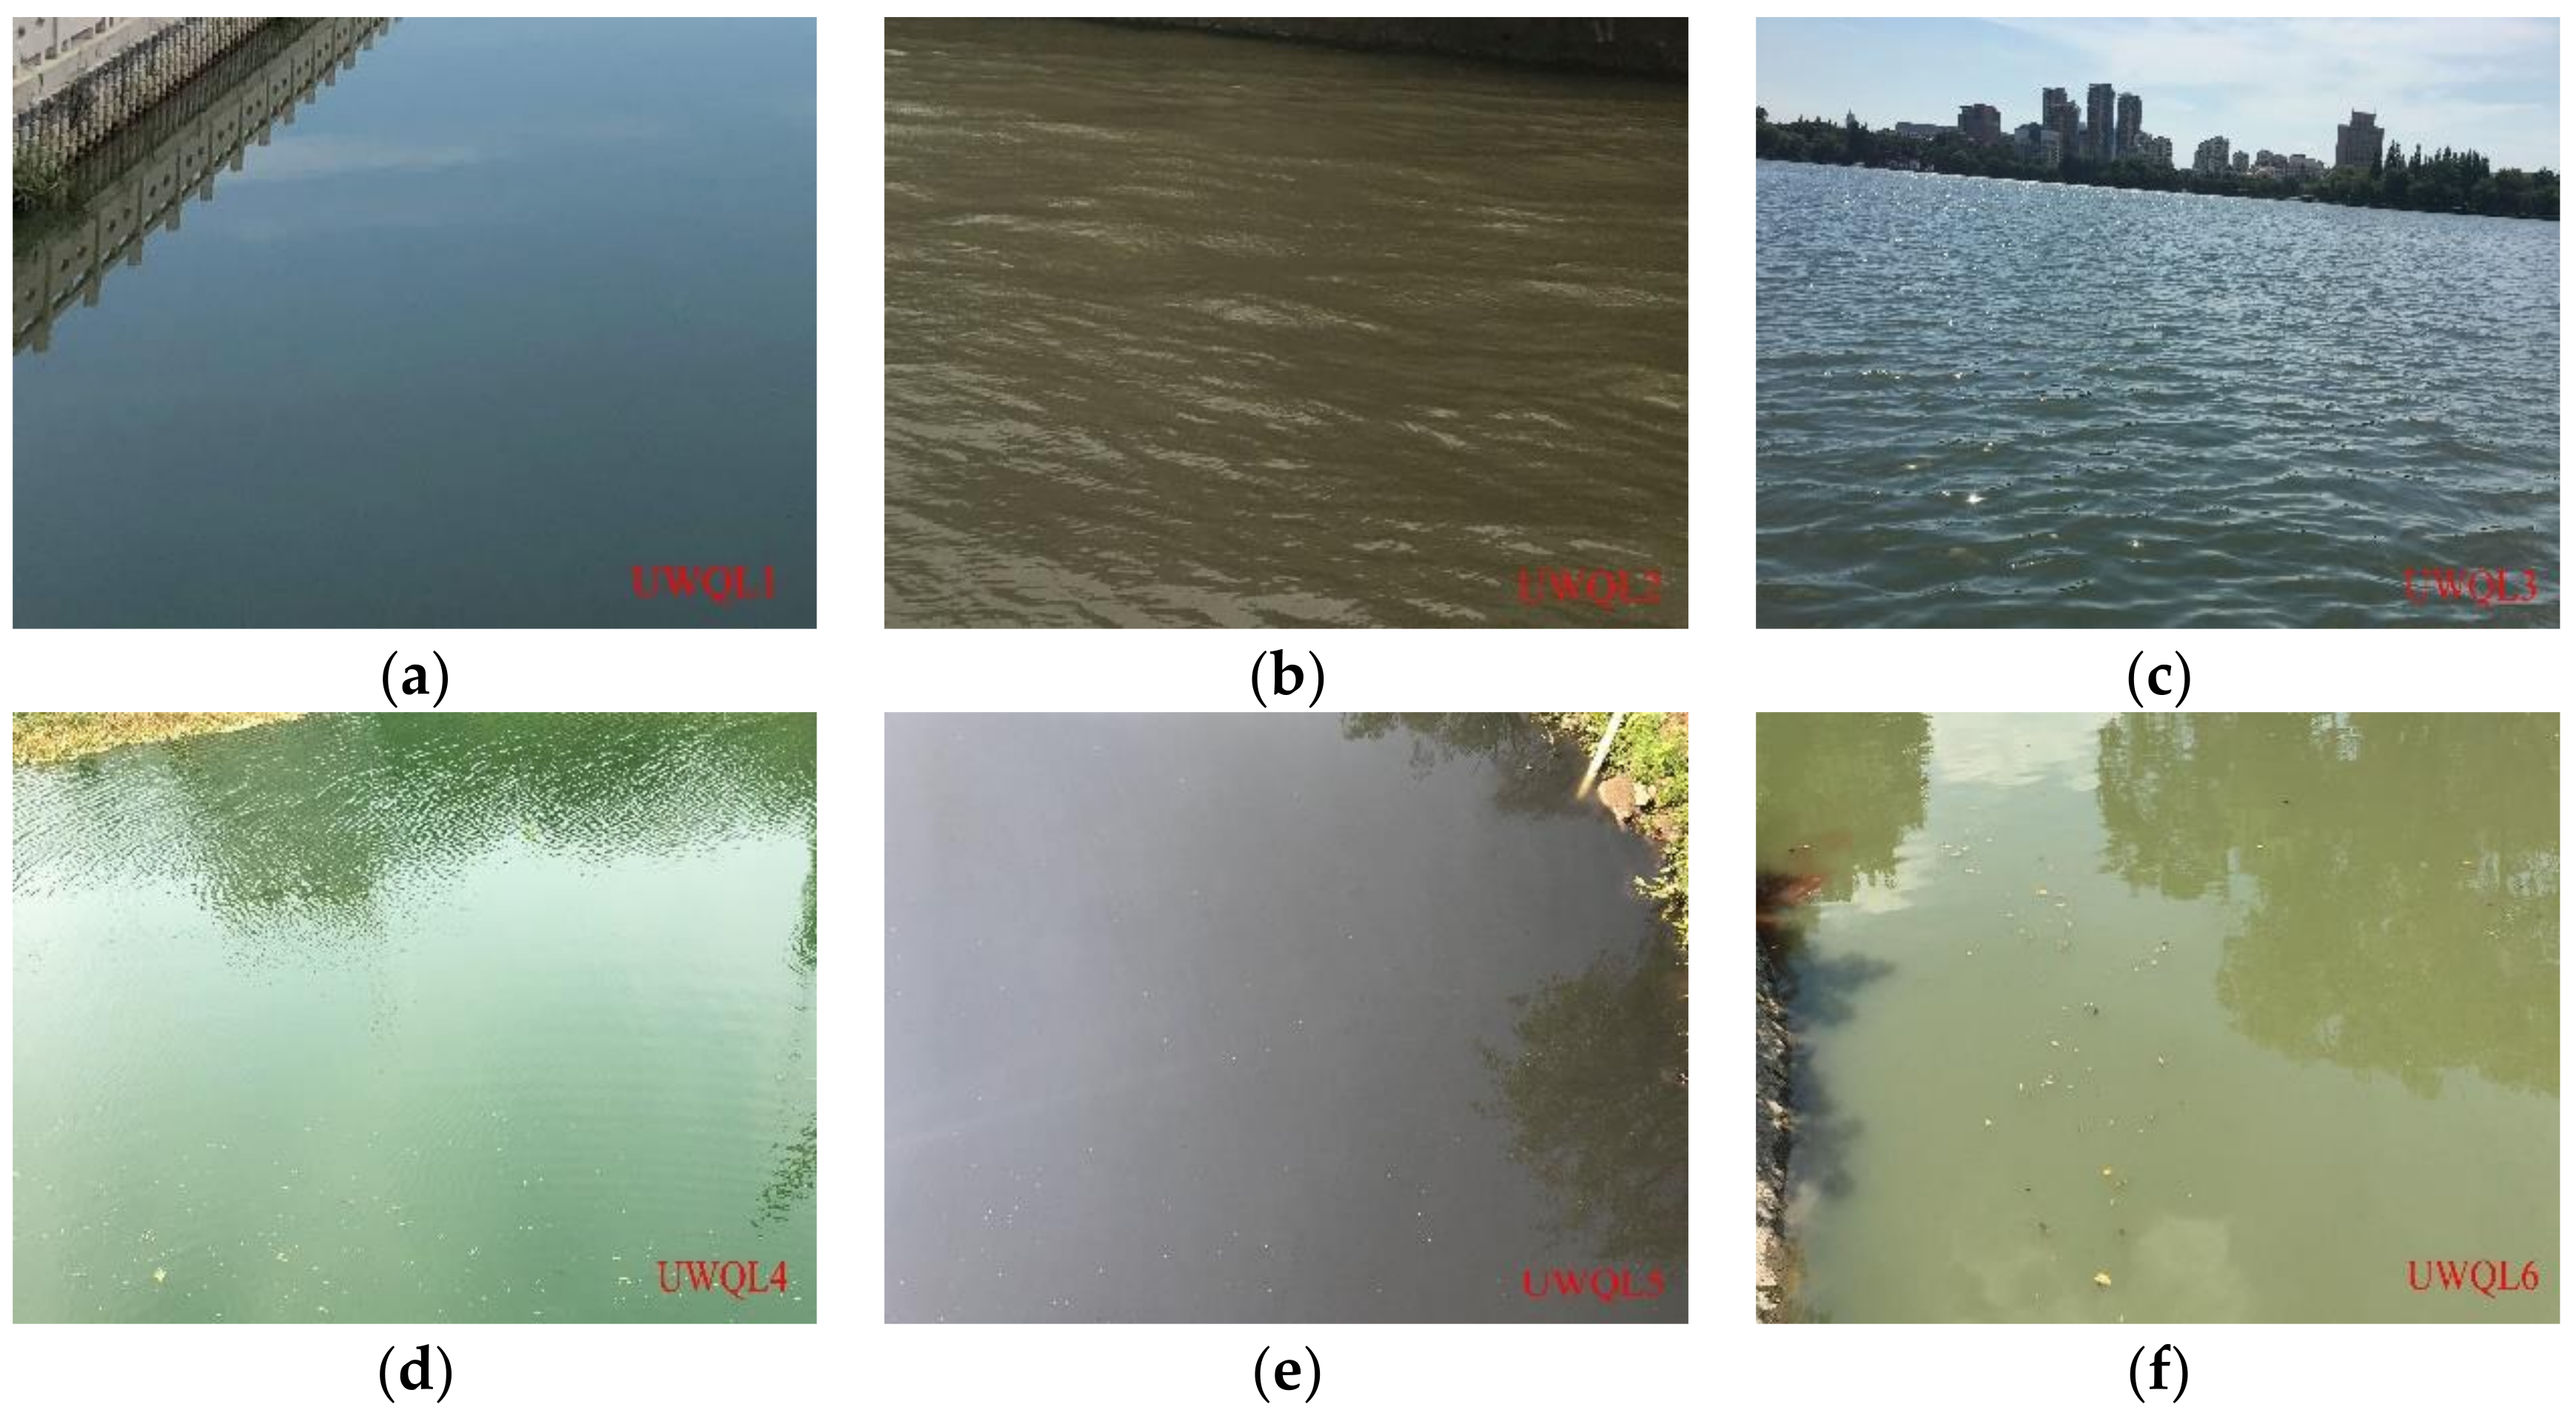
Figure 7 displays photographs of typical water areas of the UWQLs. An ornamental pond in the Yangtze River community was a typical water area of UWQL1 (Figure 7a). Because this waterbody is managed all year round and is unaffected by external pollution, the water is relatively clean and clear with a sky-blue color. A typical water area of UWQL2 (Figure 7b) was located in a section of the Jiajiang River. As a tributary of the Yangtze River, this water type often appears turbid yellow because it receives a large amount of sediment from the Yangtze River [58]. A typical water area of UWQL3 (Figure 7c) was Xuanwu Lake, which is located in the center of the urban built-up area. Compared with UWQL2, the water quality of UWQL3 was worse and the color was dark blue). A typical water area of UWQL4 (Figure 7d) was a breeding pond in Xixia Village. Due to the need for aquaculture, a large amount of feed is added to the pond, and the excess nutrients promote algal growth, causing water quality deterioration and an emerald-green color. A typical water area of UWQL5 (Figure 7e) was a large pond at the junction of the Qinhuai River and Qinhuai New River, which is surrounded by a large number of residential and commercial areas. Due to the discharge of domestic sewage, a large amount of organic pollutants flow into the pond and consume DO, causing water hypoxia. Anaerobic microorganisms multiply and decompose organic matter, producing black and odor-causing substances [27] and a gray color. A typical water area of UWQL6 (Figure 7f) was the middle section of the South River, where there are many factories (e.g., textile, lathe, and cigarette factories) and dense residential areas on both sides of the river bank. Affected by the discharge of industrial wastewater and residential sewage, the water contains a lot of pollutants and the aquatic environment is seriously damaged, resulting in a yellow-green color [57].
In summary, the water quality assessment results of the built-up area in Nanjing agreed with the ground investigations, indicating that the proposed method can effectively reflect the difference in urban water quality.

4. Discussion

4.1. Influence of the Concerned Water Quality Parameters on Rrs

In this study, 12 water quality parameters were used in the grading evaluation method because they directly or indirectly affected the absolute value and morphological characteristics of Rrs. Therefore, the influence mechanism of the water quality parameters on Rrs is the basis of using OWTs to evaluate urban water quality, and their influence on Rrs is analyzed as follows.
Chla, TSM, and CDOM are the most typical optically active substances in waterbodies. They absorb photons and cause light energy to be attenuated in water. Their upward scattering to the photons forms an upward radiance, which passes through the water surface to produce remote sensing optical signals [59]. However, in extremely complex urban water, they also have a significant impact on Rrs. As shown in Figure 8, when the Chla concentration increased significantly, the peak value of Rrs around 550 nm and 720 nm increased significantly because of the scattering effect of algae cells and the enhancement of their fluorescence effect (Figure 8a). In addition, the backscattering effect of suspended matter increased with the increase in the TSM concentration, leading to a gradual increase in Rrs at 400–900 nm (Figure 8b). With an increase in aCDOM(440), the Rrs value of the short-wavelength band exhibited a gradual downward trend because of the extremely pronounced absorption of CDOM (Figure 8c). Therefore, the obvious difference in all target components led to a significant change in Rrs, indicating that all target components markedly affected the spectral characteristics of the urban waterbodies in this study.
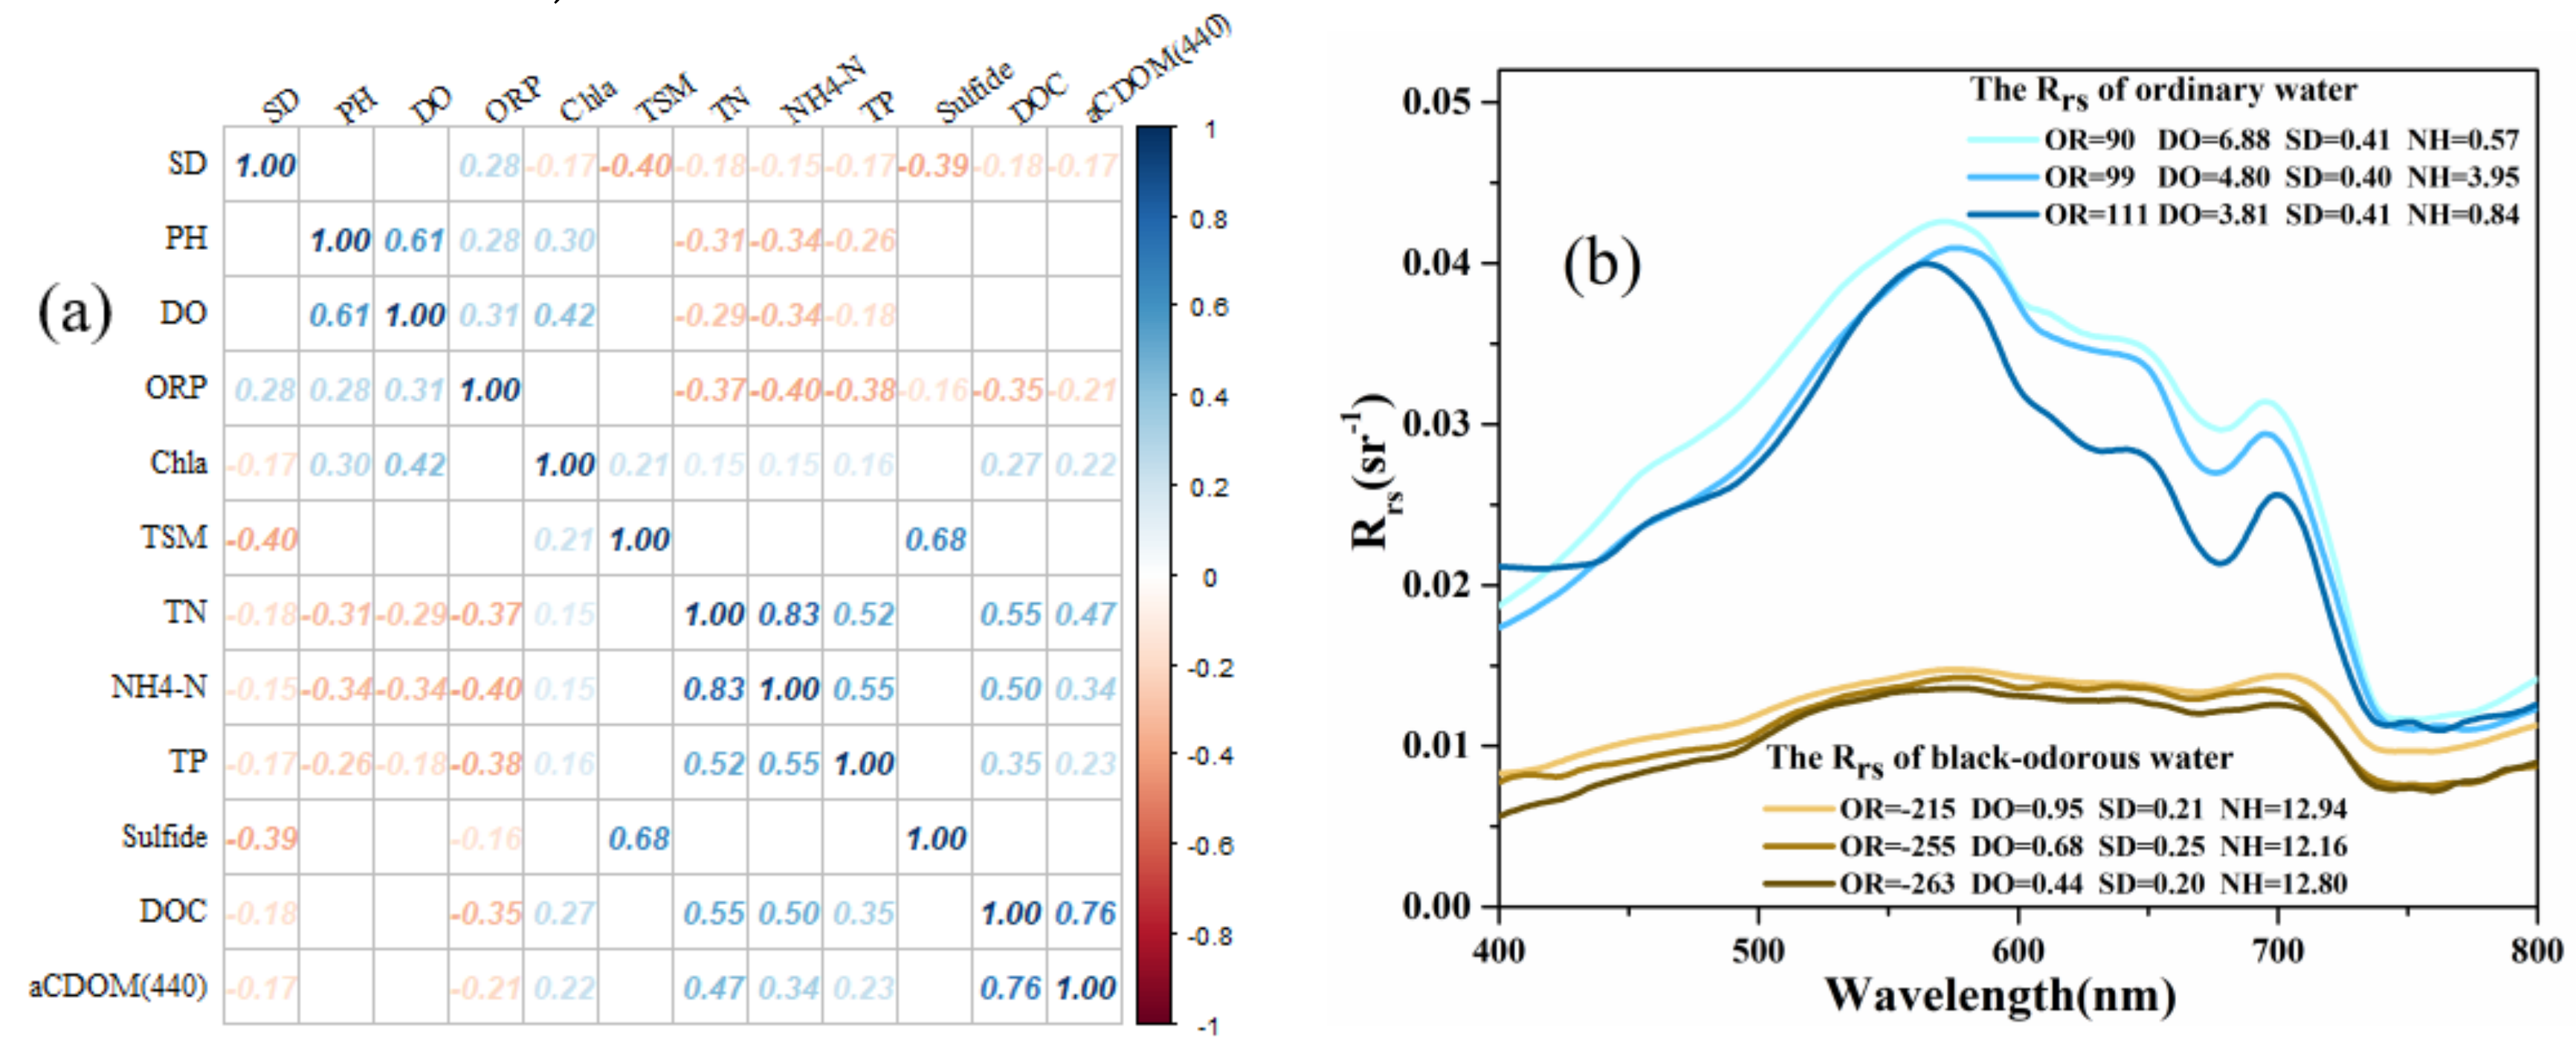
Next, the Pearson correlation coefficient matrix (Figure 9a) between water quality parameters (Pearson correlation coefficient is abbreviated as r) further elaborates the influence mechanism of TN, TP, PH, and DOC on Rrs. Nitrogen and phosphorus are the two basic elements that support the survival of aquatic organisms [60]. Hence, although TN and TP have weak optical characteristics, they affect the composition and concentration of pigment and CDOM of water by affecting the growth of phytoplankton or aquatic plants, and then affect the Rrs of the water surface [61,62]. In the dataset of this study, the r of TN versus aCDOM (440) reached 0.47 (p < 0.001), which partially verified the above view. In addition, pH is the main factor affecting the sediment release of phosphorus. A pH that is too high or too low can promote the release of different forms of phosphorus [63]. Furthermore, DOC not only affects multiple processes such as the aquatic system metabolism, nutrient absorption, and activities of phytoplankton [64], but is also one of the main sources of CDOM. The DOC concentration exhibited a strong linear correlation with aCDOM (440), with a r of 0.76 (p < 0.001), indicating the important connection between them (Figure 9a).
Previous studies have indicated that DO, NH4-N, SD, ORP, and sulfide are the main substances that make water black and odorous [26,65]. When the ORP and DO concentration are too low, severe hypoxia can occur, indicating that the organic matter content is too high. A high NH4-N concentration implies the overnutrition of a waterbody and gives off a peculiar smell. In addition, due to the negative charge of the colloidal particles in water, FeS and MnS are adsorbed onto suspended particles, resulting in a black water color [26]. The black-odorous phenomenon reduces the clarity of water, resulting in a decrease in SD. Thus, SD is often lower in black-odorous water, which makes the Rrs of the water surface lower than that of ordinary water [20,66]. Studies have found a distinctive difference between the Rrs values of urban black-odorous water and ordinary water [26]. Figure 9b shows the typical Rrs values of black-odorous water and ordinary water in urban areas. Here, the black-odorous phenomenon was determined using the concentration of DO, NH4-N, SD, and ORP according to the guidelines issued by the Ministry of Housing and Urban–Rural Development of China [67]. As expected, the three typical Rrs spectra of black-odorous water were significantly lower and smoother than those of ordinary water.
In summary, among all the water quality parameters selected in this study, Chla, TSM, CDOM, and SD directly affected the optical characteristics of the studied waterbodies, whereas TN, TP, pH, DOC, ORP, DO, sulfide, and NH4-N indirectly influenced the optical characteristics by affecting optically sensitive substances. These results provide good theoretical support for the comprehensive assessment of urban water quality based on optical classification.

4.2. Relationship between UWQLs and the WQI

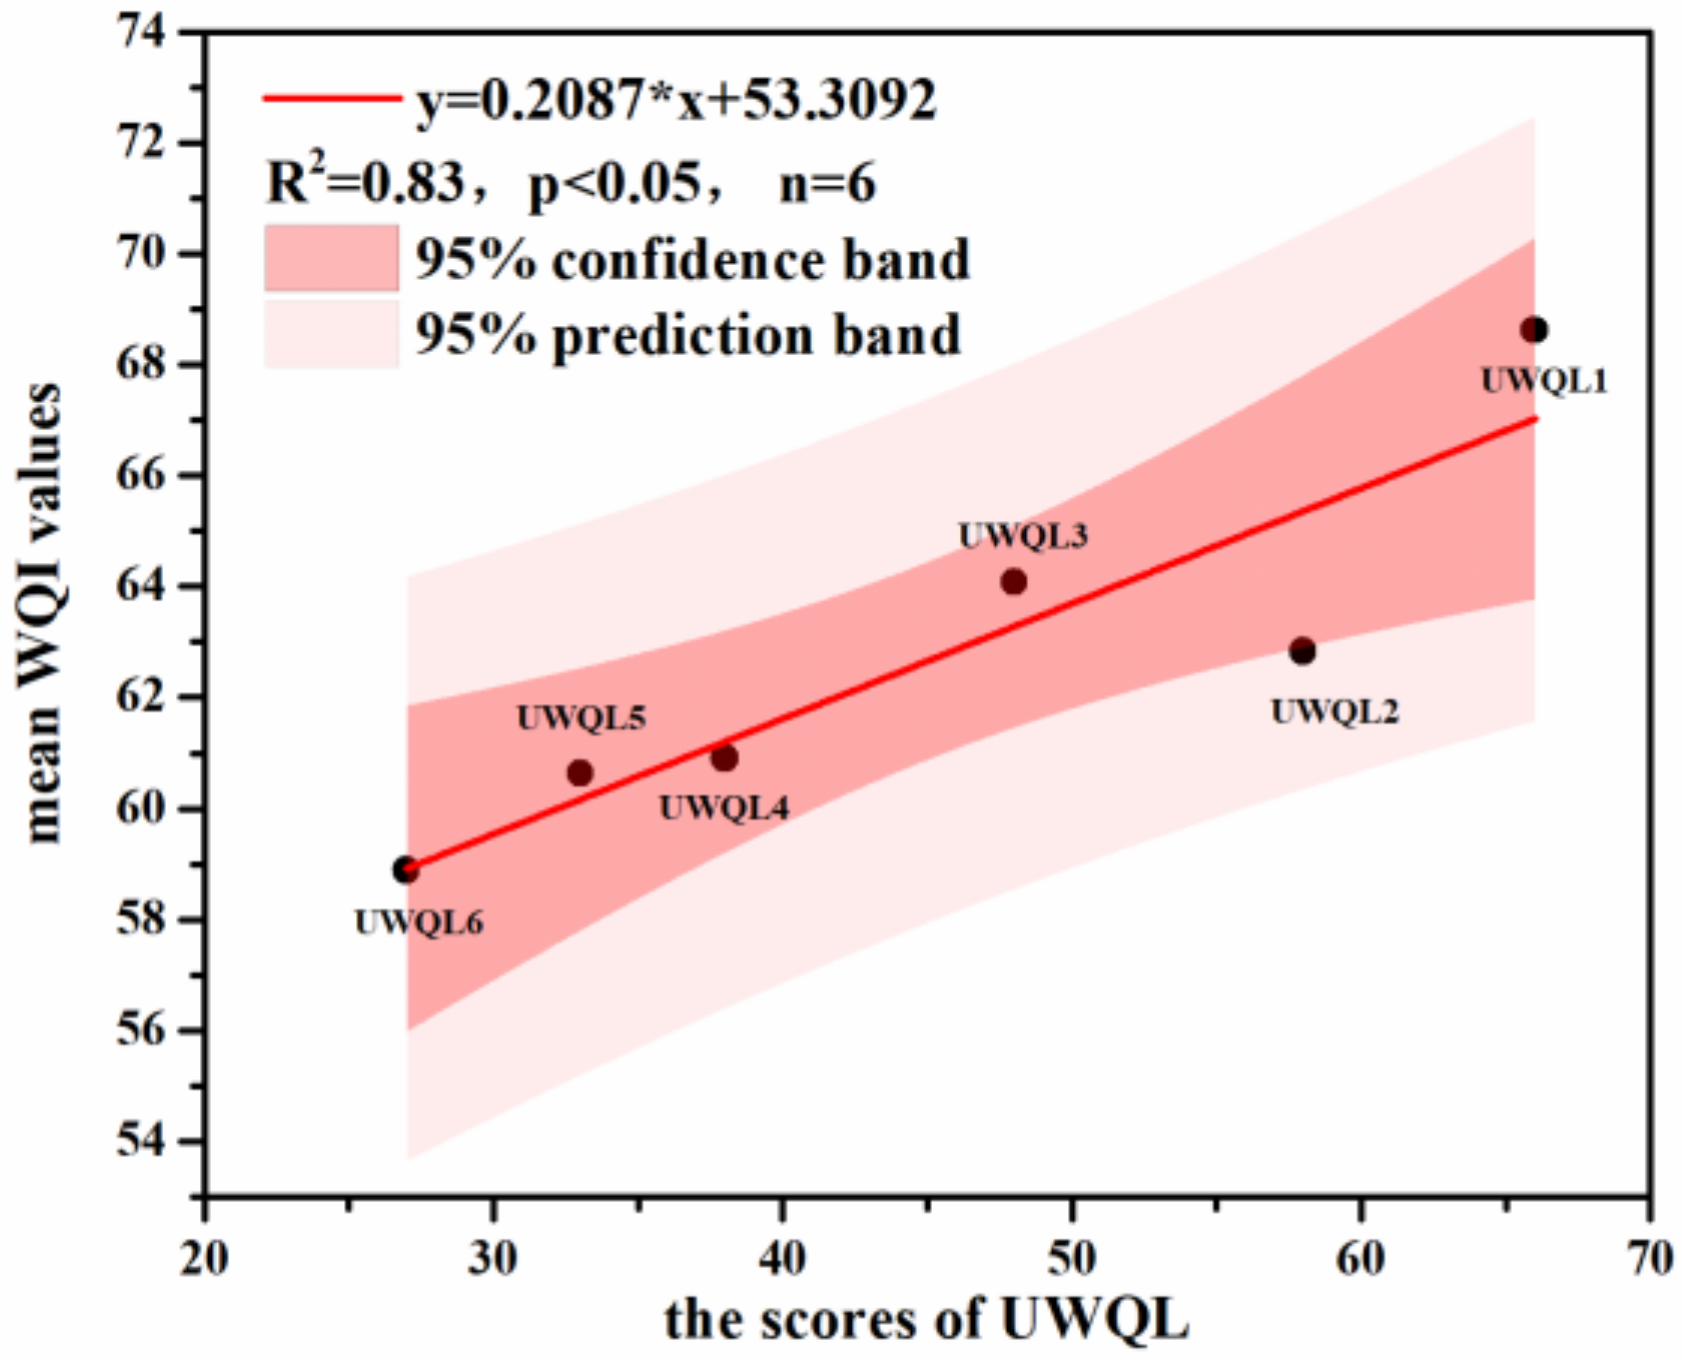
Previous studies have proposed methods to quantitatively evaluate water quality, of which, the most widely used is the WQI. The WQI is a dimensionless value (0–100) according to a weighted sum calculation based on multiple water quality parameters and pre-designed weightings of an in situ water sample [68,69], whereby better water quality is indicated by a higher WQI value. This study examined the relationship between the UWQL and WQI to explore the rationality of the UWQL and its potential to quantitatively assess urban water quality. The mean WQI values of different UWQLs were analyzed. The results shown in Figure 10 indicate that the scores of the UWQLs and mean WQI values displayed an increasing linear trend, indicating that the corresponding water quality evaluation results are consistent and that the qualitative evaluation results of the UWQLs are reliable. Second, the scores of the UWQLs and mean WQI values exhibited a strong functional relationship (R2 = 0.83; p < 0.05), which implies that there is a certain conversion relationship between the UWQL and WQI. This indicates that the UWQL method is likely to provide a quantitative assessment of urban water quality through further research.

4.3. Effectiveness of the Data Processing Methods

In this study, to improve the availability and stability of the water quality evaluation method, two data processing techniques were used.
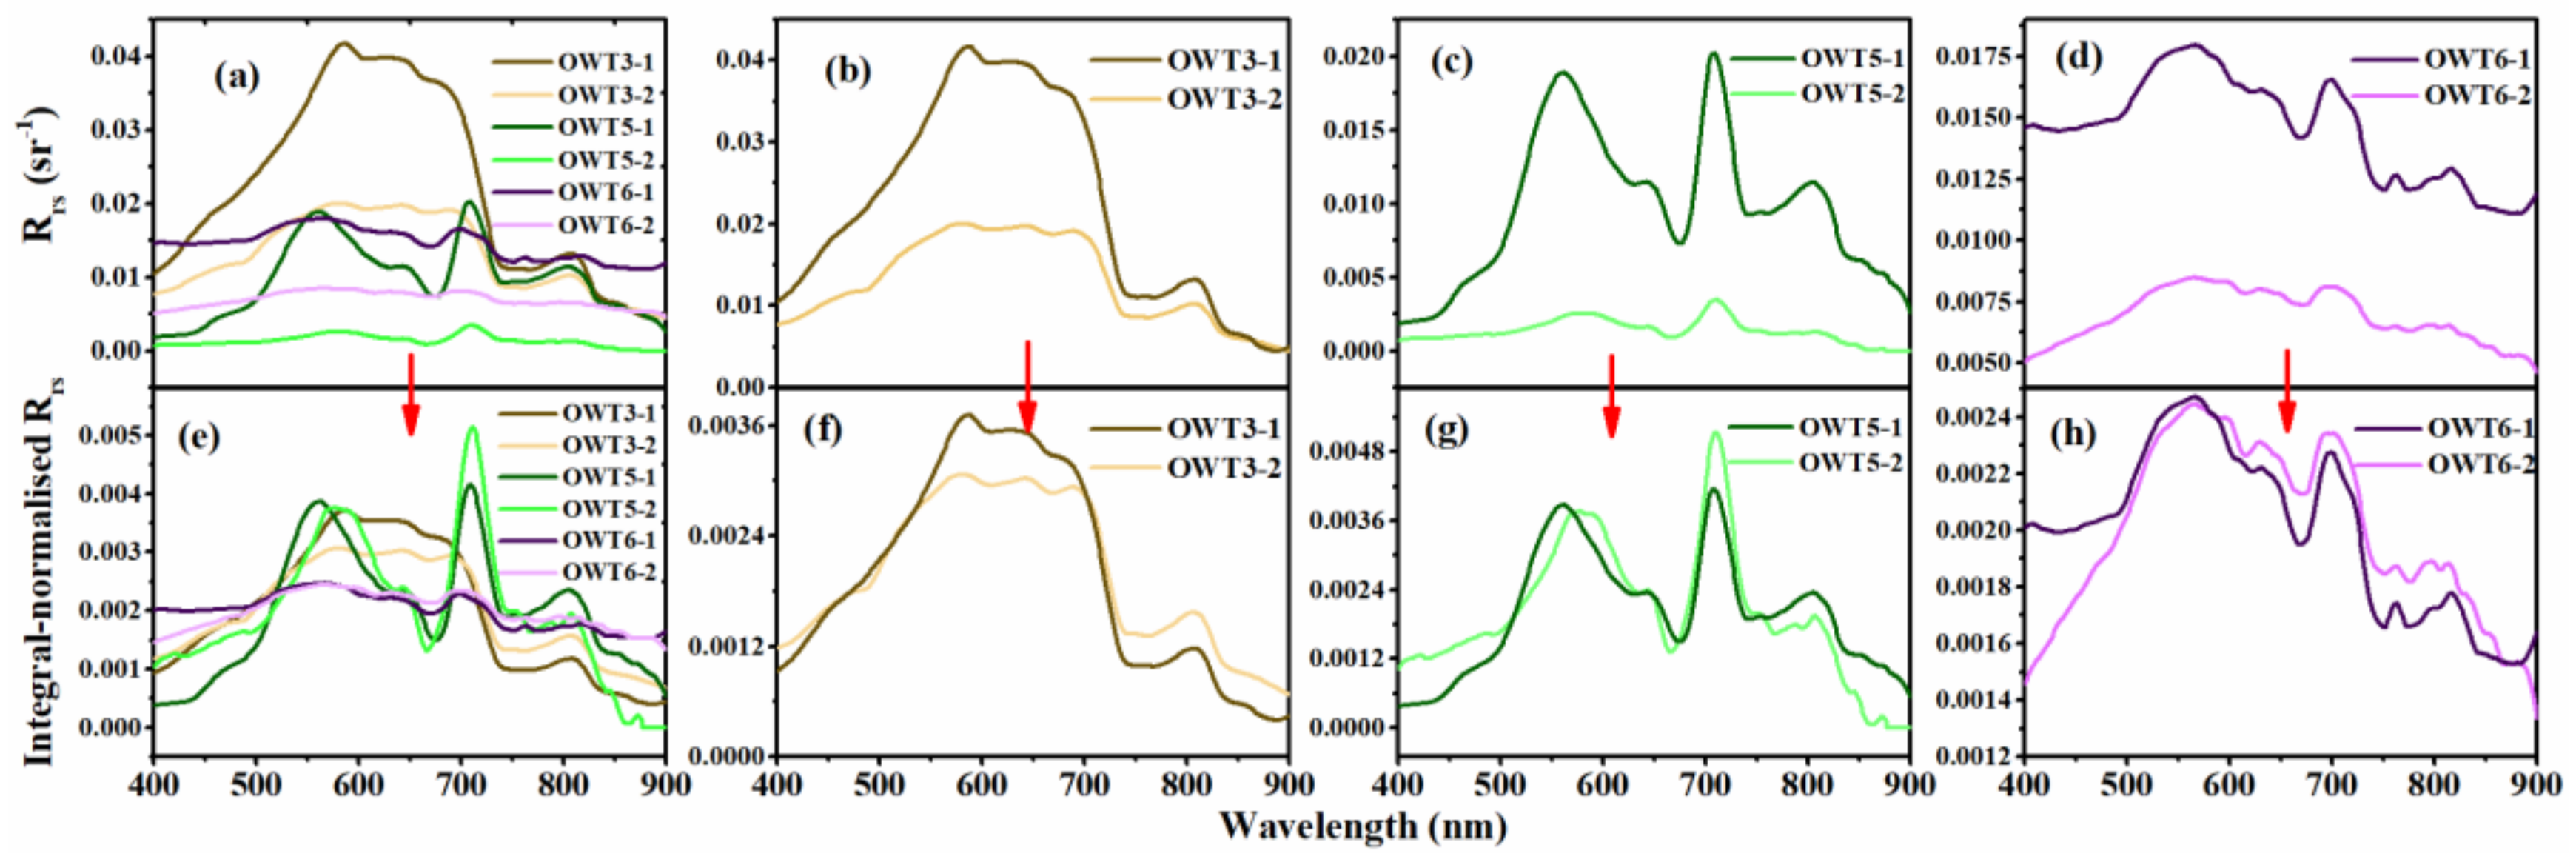
(1) The normalization method is used to reduce the uncertainty of clustering from two aspects. On the one hand, owing to differences in sampling times and locations, solar radiation varies in angular position [70]. The normalization method can eliminate this part of the spectral difference to a certain extent, thereby reducing the error introduced in the clustering process and increasing the stability of the clustering results. On the other hand, the normalization method can highlight the spectral shape differences between sample points. Figure 11a presents two curves for OWT3, OWT5, and OWT6, in which the original spectral shape features were not obvious. That will lead to a poor classification effect. From the original spectra, most Rrs characteristics were not obvious, except for OWT3-1 and OWT5-1. However, after normalization, the shape characteristics were highlighted, and the spectra from the same OWT showed similar shape characteristics, as shown in Figure 11a versus e, b versus f, c versus g, and d versus h [71,72]. In general, normalization can not only reduce the system error, but can also improve the clustering effect by improving the separability of each Rrs. Therefore, it could effectively improve the stability of the results.
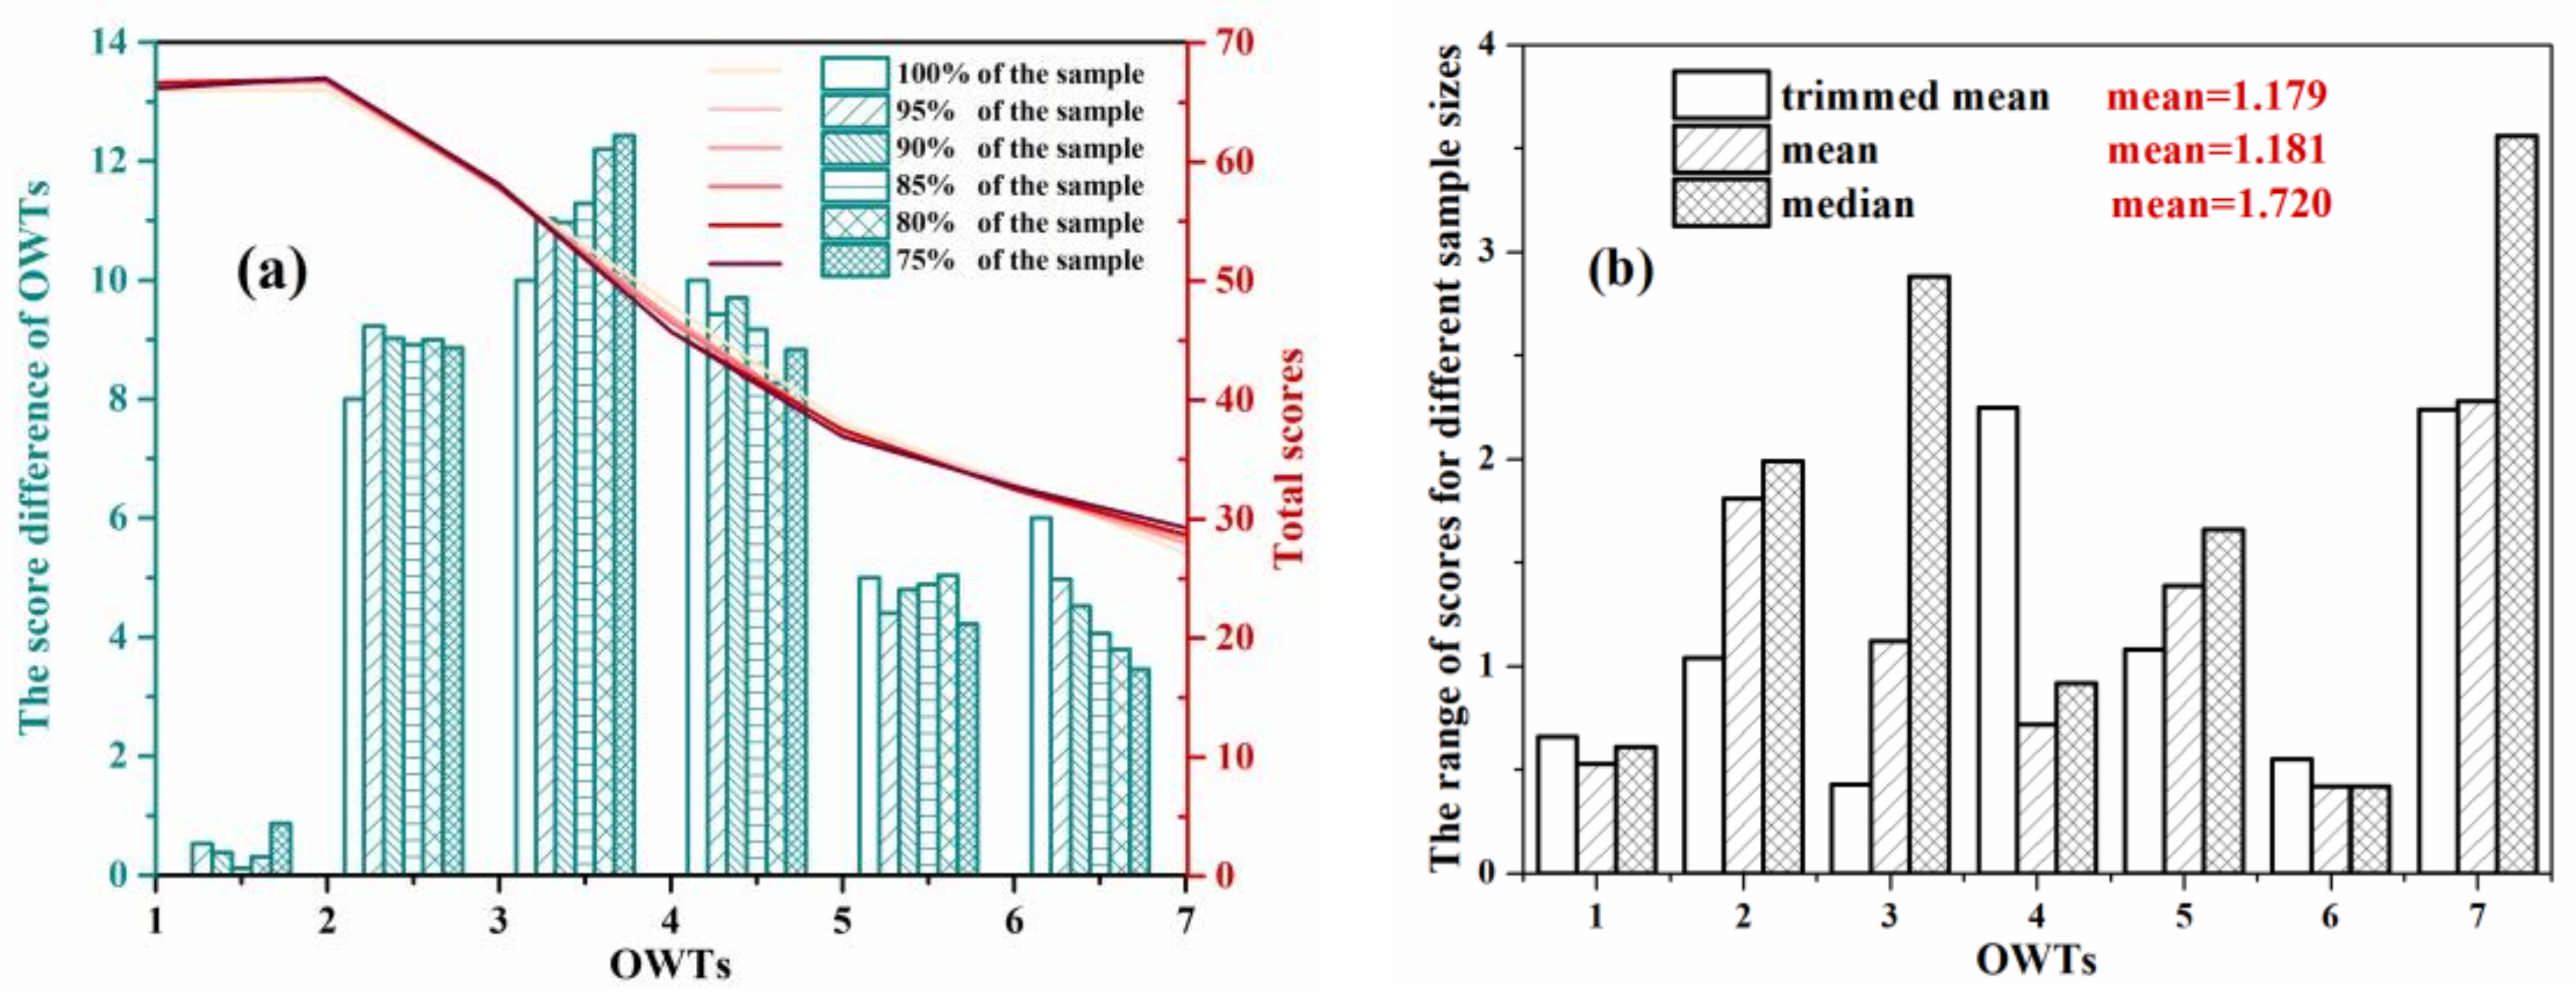
(2) The trimmed means of water quality variables in each OWT were applied to ensure the stability of the scoring method. To compare the scoring effect of various statistics, 100%, 95%, 90%, 85%, 80%, and 75% of the total samples were randomly selected 100 times without replacement, and then the mean scores of each OWT were calculated based on the trimmed mean, mean, and median. Using the trimmed mean method, the water quality scores calculated under different sample numbers were highly similar (Figure 12a), indicating that the method is less affected by the sample size. In addition, the score differences between adjacent OWTs were >3 except for OWT1 and OWT2, which indicates that the trimmed mean method is robust for different sample sizes. The difference between the maximum and the minimum scores calculated by different sample sizes and statistical methods are shown in Figure 12b. Compared with the mean and median, the score range of the trimmed mean for each OWT was the smallest (except for OWT1, OWT4, and OWT6), and the mean range under different sample sizes was the lowest (1.179). This indicates that trimmed mean had better stability because it overcame the disturbance of outliers to a certain extent and weakened the influence of sample changes on the scoring results. It is worth noting that under different sample sizes, the score difference between OWT1 and OWT2 of the trimmed mean was smaller than the mean range of their scores, which further explains the rationality of dividing them into one UWQL.

4.4. Advantages, Limitations, and Prospects of the Proposed Method

4.4.1. Advantages

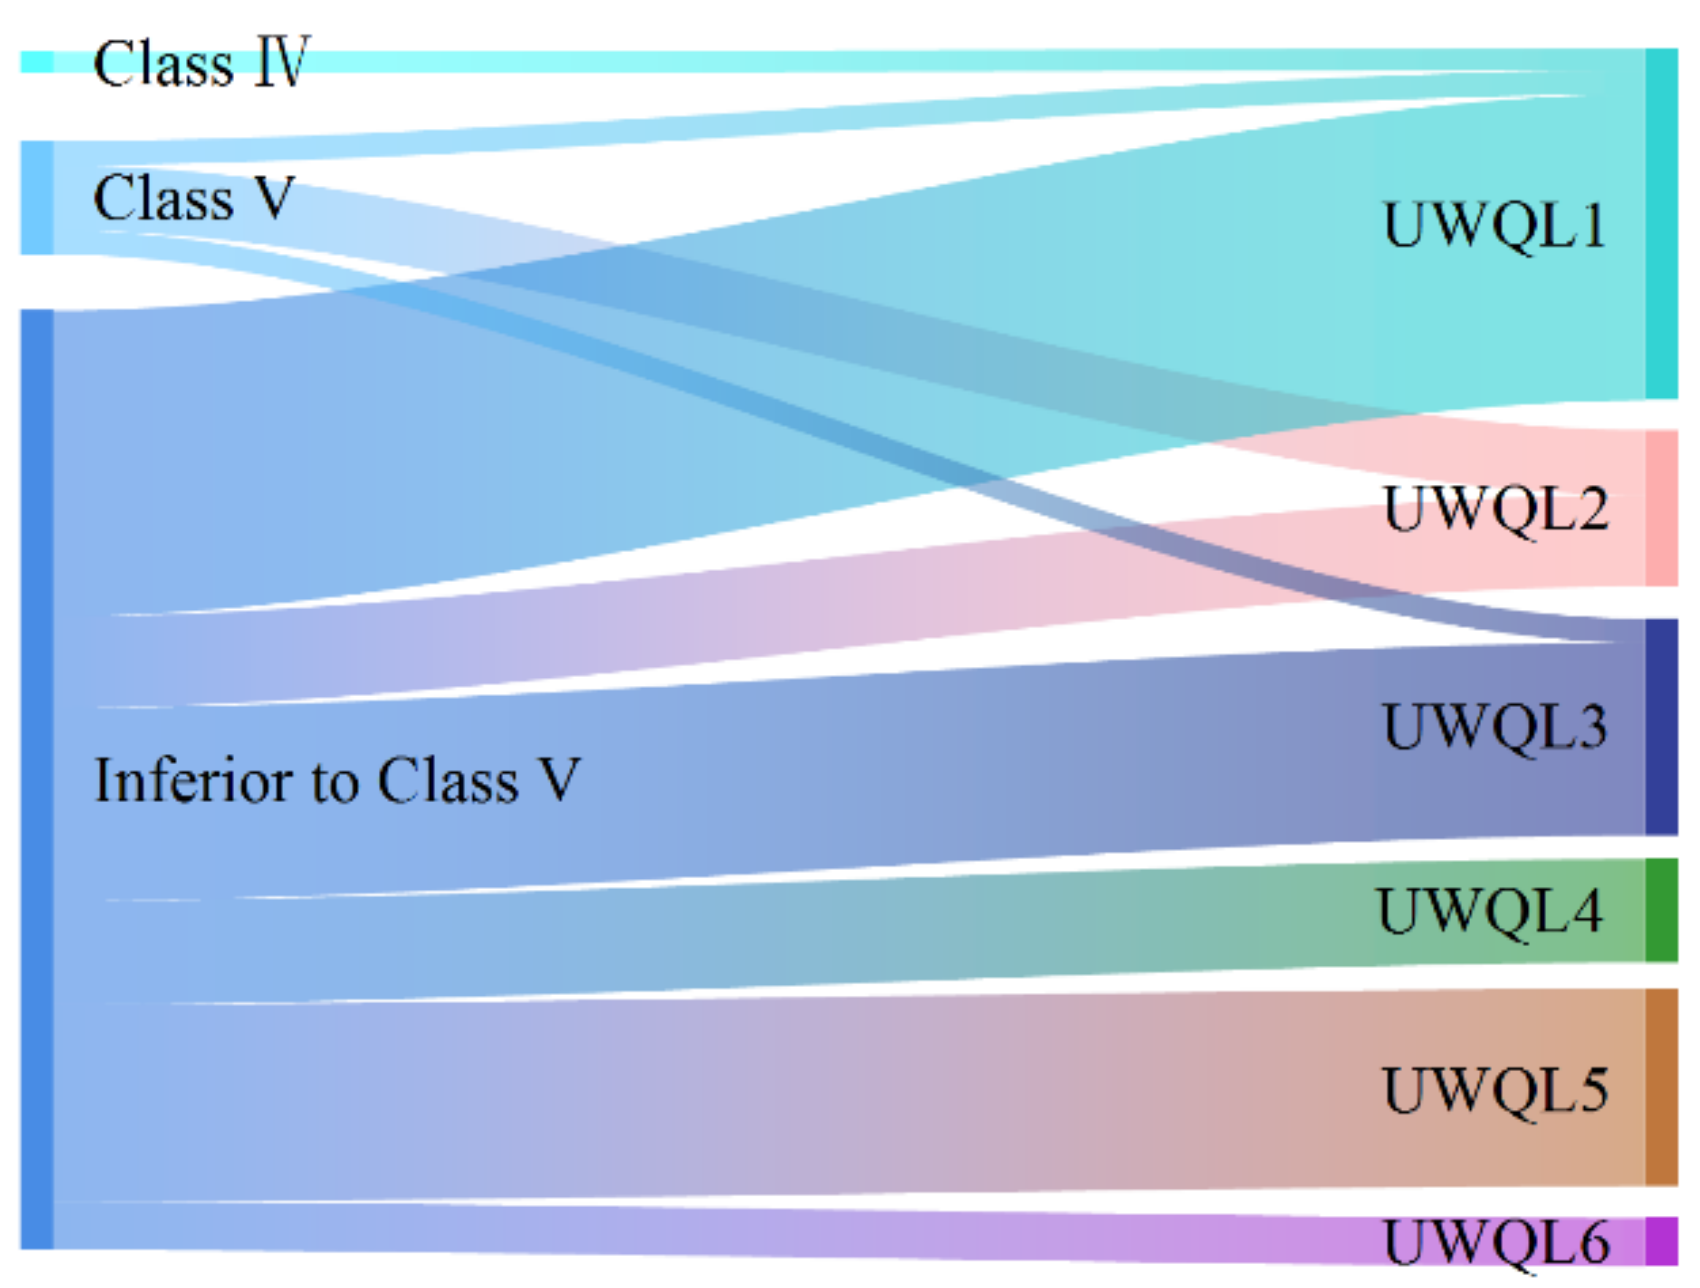
The water quality grading evaluation results were compared with routine water quality monitoring using the single-factor assessment method of the GB 2002-3838 standards (Figure 13). According to the GB 2002-3838 standards, all the samples were classified as classes IV and V or below. However, they were distributed across all UWQL types. Among them, the class IV samples all belonged to UWQL1; the class V samples were mainly associated with UWQL1, UWQL2, and UWQL3, and samples below class V, which accounted for > 85% of samples in the dataset, belonged to all six UWQLs. According to the GB 3838-2002 standards, classes I, II, and III refer to “good” water quality, while classes IV and V refer to “bad” water quality. Therefore, the overall water quality of the investigated urban area was “bad” at the time of this study according to the standards, and further evaluation is difficult. Hence, the work efficiency of the GB 3838-2002 standards is reduced in urban water systems compared with the proposed grading evaluation methods developed based on the urban water dataset. In addition, the presentation of the spatial distribution information of water quality using remote sensing images is helpful for the environmental supervision department to grasp the water quality situation of a city from a macro perspective.

4.4.2. Limitations and Prospects

The relative water quality evaluation results of urban water obtained using the proposed method strongly depend on the OWTs of the Rrs spectral library. To improve the method, it is necessary to continuously increase the amount of Rrs data containing multiple OWTs. For example, increasing the sampling spectrum of cities in northern China could improve the water quality evaluation ability of regions with a long history of heavy industry development [73], and increasing the sampling spectrum in mining areas could enhance the assessment ability of water polluted by the mining industry [74,75]. Therefore, with the improvement in the spectra database, the proposed method will be continuously developed and promoted in more regions in the future.
Considering the spectral and spatial resolutions, Sentinel-2 MSI images with a spatial resolution of 10 m were used in this study. To evaluate the water quality of some small waterbodies, especially narrow rivers, images with higher spatial resolution are required. However, sensors that integrate high-resolution spectra and spatial data are still lacking. Fortunately, in recent years, images collected using unmanned aerial vehicles (UAVs) have become prevalent [76,77]. Such satisfactory images can be obtained by loading multispectral or hyperspectral cameras and adjusting the flying height of the drone [78], and continuous images can be obtained through regular flight. Therefore, the development of UAV images will provide greater impetus for the promotion and application of this water quality evaluation method in the future.

5. Conclusion

With the current rapid urbanization, real-time monitoring and evaluation of water quality are prerequisites for the effective management and protection of urban water systems. This study proposed a simple, fast, and effective urban water quality assessment method based on remote sensing reflectance optical classification. The method was applied to the Sentinel-2 MSI images to explore the spatial distribution of water quality in built-up urban areas. Our findings regarding the urban OWTs, UWQLs, and water quality distribution characteristics of the built-up area in Nanjing are as follows.
First, eight OWTs (OWT1–OWT8) were obtained based on the FCMm clustering method. In particular, the spectra of OWT8 increased abnormally in the near-infrared band, which was caused by the influence of duckweed and/or surrounding vegetation.
Second, according to the water quality scoring rules, six UWQLs (UWQL1–UWQL6) were obtained. UWQL1 corresponded to relatively clear waterbodies, while UWQL2 corresponded to turbid waters that contained large amounts of suspended sediments. The water quality of UWQL3 was common, with no outstanding features. Waterbodies associated with UWQL4 had a high algae content, while those of UWQL5 and UWQL6 had the features of eutrophication and were accompanied by the black-odorous phenomenon in some cases.
Finally, the water quality levels retrieved from the MSI images displayed the spatial distribution situation in the built-up area of Nanjing on 19 July 2017. UWQL1 was distributed in ornamental ponds cleaned regularly by workers, and in some clean lakes and rivers. Tributaries connected to the Yangtze River mainly belonged to UWQL2. A large number of lakes and wide river reaches in built-up areas corresponded to UWQL3. Open ponds in agricultural districts and some river sections belonged to UWQL4. Narrow or slow-flowing waterbodies distributed near polluting factories and dense residential areas generally corresponded to UWQL5 or UWQL6.
Based on the comprehensive influence of various water quality parameters on the remote sensing information of the water surface, a grading evaluation method was proposed. Compared with the single-factor method of the GB 2002-3838 standards, the proposed method can further finely classify water quality levels. This method can be applied to satellite images to evaluate the relative quality of urban water at the macro level, thus providing an efficient reference for urban ecological environment management and urban planning. Moreover, by further expanding the spectral database, the proposed method could be applied to more urban water environment scenarios.

Author Contributions

Conceptualization, X.C.; methodology, X.C. and Y.L.; software, S.B.; validation, X.C., S.L. and J.X.; formal analysis, H.W.; investigation, X.D.; resources, J.L.; data curation, S.Z.; writing—original draft preparation, X.C.; writing—review and editing, X.C., Y.L., S.L., S.B. and J.X.; visualization, H.W.; supervision, Y.L. and H.L.; project administration, Y.L. and H.L.; funding acquisition, Y.L. and H.L. All authors have read and agreed to the published version of the manuscript.

Funding

This research was funded by National Natural Science Foundation of China (42071299), the Major Projects of High Resolution Earth Observation Systems of National Science and Technology (05-Y30B01-9001-19/20-2), National Natural Science Foundation of China (42101384), Natural Science Foundation of Jiangsu Province (BK20210043), Water Conservancy Science and Technology Project of Jiangxi Province (202124ZDKT29), the Research Foundation of Nanjing Hydraulic Research Institute (Y921002 and Y921008).

Data Availability Statement

The data are not publicly available due to privacy.

Acknowledgments

The authors would like to thank the European Space Agency for providing the Sentinel-2 MSI data and the Sen2Cor processor, and the members who participated in the water sampling experiment in Nanjing, Yangzhou, Changzhou, Changsha, Wuxi for their hard work.

Conflicts of Interest

The authors declare no conflict of interest.

References

  1. Jacobs, C.; Klok, L.; Bruse, M.; Cortesão, J.; Lenzholzer, S.; Kluck, J. Are urban water bodies really cooling? Urban Clim. 2020, 32. [Google Scholar] [CrossRef]
  2. Karn, S.K.; Harada, H. Surface water pollution in three urban territories of Nepal, India, and Bangladesh. Environ. Manag. 2001, 28, 483–496. [Google Scholar] [CrossRef]
  3. Wang, Z.; Zhang, S.; Peng, Y.; Wu, C.; Lv, Y.; Xiao, K.; Zhao, J.; Qian, G. Impact of rapid urbanization on the threshold effect in the relationship between impervious surfaces and water quality in shanghai, China. Environ. Pollut. 2020, 267. [Google Scholar] [CrossRef] [PubMed]
  4. Gatica, E.A.; Almeida, C.A.; Mallea, M.A.; Del Corigliano, M.C.; Gonzalez, P. Water quality assessment, by statistical analysis, on rural and urban areas of Chocancharava River (Rio Cuarto), Cordoba, Argentina. Environ. Monit. Assess. 2012, 184, 7257–7274. [Google Scholar] [CrossRef] [PubMed]
  5. Ruley, J.E. An assessment of long-term post-restoration water quality trends in a shallow, subtropical, urban hypereutrophic lake. Ecol. Eng. 2002, 19, 265–280. [Google Scholar] [CrossRef]
  6. Girija, T.R.; Mahanta, C.; Chandramouli, V. Water quality assessment of an untreated effluent impacted urban stream: The Bharalu tributary of the Brahmaputra River, India. Environ. Monit. Assess. 2007, 130, 221–236. [Google Scholar] [CrossRef] [PubMed]
  7. Praus, P. Urban water quality evaluation using multivariate analysis. Acta Montan. Slovaca 2007, 12, 150–158. [Google Scholar]
  8. Sekabira, K.; Origa, H.O.; Basamba, T.A.; Mutumba, G.; Kakudidi, E. Heavy metal assessment and water quality values in urban stream and rain water. Int. J. Environ. Sci. Technol. 2010, 7, 759–770. [Google Scholar] [CrossRef] [Green Version]
  9. Phiri, O.; Mumba, P.; Moyo, B.H.Z.; Kadewa, W. Assessment of the impact of industrial effluents on water quality of receiving rivers in urban areas of Malawi. Int. J. Environ. Sci. Technol. 2005, 2, 237–244. [Google Scholar] [CrossRef] [Green Version]
  10. Akoteyon, I.S. Determination of Water Quality Index and Suitability of Urban River for Municipal Water Supply in Lagos-Nigeria. Eur. J. Sci. Res. 2011, 54, 263–271. [Google Scholar]
  11. Chang, N.; Luo, L.; Wang, X.C.; Song, J.; Han, J.; Ao, D. A novel index for assessing the water quality of urban landscape lakes based on water transparency. Sci. Total Environ. 2020, 735, 139351. [Google Scholar] [CrossRef] [PubMed]
  12. Ma, T.; Zhao, N.; Ni, Y.; Yi, J.; Wilson, J.P.; He, L.; Du, Y.; Pei, T.; Zhou, C.; Song, C.; et al. China’s improving inland surface water quality since 2003. Sci. Adv. 2020, 6, eaau3798. [Google Scholar] [CrossRef] [PubMed] [Green Version]
  13. Gebrehiwet Reta, X.D.; Li, Z.; Bo, H.; Yu, D.; Wan, H.; Su, B. Application of Single Factor and Multi-Factor Pollution Indices Assessment for Human-Impacted River Basins Water Quality Classification and Pollution Indicators. Nat. Environ. Pollut. Technol. 2019, 18, 1063–1072. [Google Scholar]
  14. The Ministry of Environmental Protection of the People’s Republic of China. Environmental Quality Standards for Surface Water (GB 3838–2002); The Ministry of Environmental Protection of the People’s Republic of China: Beijing, China, 2002.
  15. Zhang, Y.; Wu, L.; Ren, H.; Liu, Y.; Zheng, Y.; Liu, Y.; Dong, J. Mapping Water Quality Parameters in Urban Rivers from Hyperspectral Images Using a New Self-Adapting Selection of Multiple Artificial Neural Networks. Remote Sens. 2020, 12, 336. [Google Scholar] [CrossRef] [Green Version]
  16. Yang, X.; Jiang, Y.; Deng, X.; Zheng, Y.; Yue, Z. Temporal and Spatial Variations of Chlorophyll a Concentration and Eutrophication Assessment (1987–2018) of Donghu Lake in Wuhan Using Landsat Images. Water 2020, 12, 2192. [Google Scholar] [CrossRef]
  17. Markogianni, V.; Dimitriou, E.; Karaouzas, I. Water quality monitoring and assessment of an urban Mediterranean lake facilitated by remote sensing applications. Environ. Monit. Assess. 2014, 186, 5009–5026. [Google Scholar] [CrossRef]
  18. Lavery, P. Water Quality Monitoring in Estuarine Waters Using the Landsat Thematic Mapper. Remote Sens. Environ. 1993, 46, 268–280. [Google Scholar] [CrossRef]
  19. Zhu, W.; Huang, L.; Sun, N.; Chen, J.; Pang, S. Landsat 8-observed water quality and its coupled environmental factors for urban scenery lakes: A case study of West Lake. Water Environ. Res. 2020, 92, 255–265. [Google Scholar] [CrossRef]
  20. Zhang, X.; Wang, J.; Xie, J.; Li, C.; Qiao, C.; Zhang, J.; Huo, A. Multispectral remote sensing inversion for city landscape water eutrophication based on Genetic Algorithm-Support Vector Machine. Water Qual. Res. J. 2014, 49, 285–293. [Google Scholar] [CrossRef]
  21. Neil, C.; Spyrakos, E.; Hunter, P.D.; Tyler, A.N. A global approach for chlorophyll-a retrieval across optically complex inland waters based on optical water types. Remote Sens. Environ. 2019, 229, 159–178. [Google Scholar] [CrossRef]
  22. Nazeer, M.; Nichol, J.E. Improved water quality retrieval by identifying optically unique water classes. J. Hydrol. 2016, 541, 1119–1132. [Google Scholar] [CrossRef]
  23. Xue, K.; Ma, R.; Wang, D.; Shen, M. Optical Classification of the Remote Sensing Reflectance and Its Application in Deriving the Specific Phytoplankton Absorption in Optically Complex Lakes. Remote Sens. 2019, 11, 184. [Google Scholar] [CrossRef] [Green Version]
  24. Jiang, D.; Matsushita, B.; Pahlevan, N.; Gurlin, D.; Lehmann, M.K.; Fichot, C.G.; Schalles, J.; Loisel, H.; Binding, C.; Zhang, Y.; et al. Remotely estimating total suspended solids concentration in clear to extremely turbid waters using a novel semi-analytical method. Remote Sens. Environ. 2021, 258, 112386. [Google Scholar] [CrossRef]
  25. Yang, Z.Q.; Liu, H.Q.; Lü, H.; Li, Y.M.; Zhu, L.; Zhou, Y.M.; Li, L.L.; Bi, S. Comprehensive Classification Method of Urban Water by Remote Sensing Based on High-Resolution Images. Environ. Sci. 2021, 42, 2213–2222. [Google Scholar] [CrossRef]
  26. Shen, Q.; Yao, Y.; Li, J.; Zhang, F.; Wang, S.; Wu, Y.; Ye, H.; Zhang, B. A CIE Color Purity Algorithm to Detect Black and Odorous Water in Urban Rivers Using High-Resolution Multispectral Remote Sensing Images. IEEE Trans. Geosci. Remote Sens. 2019, 57, 6577–6590. [Google Scholar] [CrossRef]
  27. Li, L.L.; Li, Y.M.; Xu, J.; Yang, Z.Q.; Bi, S.; Xu, J.F. Remote Sensing Classification of Urban Black-odor Water Based on Decision Tree. Environ. Sci. 2020. [Google Scholar] [CrossRef]
  28. Mélin, F.; Vantrepotte, V. How optically diverse is the coastal ocean? Remote Sens. Environ. 2015, 160, 235–251. [Google Scholar] [CrossRef]
  29. Trochta, J.T.; Mouw, C.B.; Moore, T.S. Remote sensing of physical cycles in Lake Superior using a spatio-temporal analysis of optical water typologies. Remote Sens. Environ. 2015, 171, 149–161. [Google Scholar] [CrossRef]
  30. Eleveld, M.; Ruescas, A.; Hommersom, A.; Moore, T.; Peters, S.; Brockmann, C. An Optical Classification Tool for Global Lake Waters. Remote Sens. 2017, 9, 420. [Google Scholar] [CrossRef] [Green Version]
  31. Jia, Y.; Shen, J.; Wang, H. Calculation of Water Resource Value in Nanjing Based on a Fuzzy Mathematical Model. Water 2018, 10, 920. [Google Scholar] [CrossRef] [Green Version]
  32. Bu, J.; Li, C.; Wang, X.; Zhang, Y.; Yang, Z. Assessment and prediction of the water ecological carrying capacity in Changzhou city, China. J. Clean. Prod. 2020, 277. [Google Scholar] [CrossRef]
  33. Miao, S.; Lyu, H.; Xu, J.; Bi, S.; Guo, H.; Mu, M.; Lei, S.; Zeng, S.; Liu, H. Characteristics of the chromophoric dissolved organic matter of urban black-odor rivers using fluorescence and UV-visible spectroscopy. Environ. Pollut. 2021, 268, 115763. [Google Scholar] [CrossRef] [PubMed]
  34. Wen, X.; Du, C.; Xu, P.; Zeng, G.; Huang, D.; Yin, L.; Yin, Q.; Hu, L.; Wan, J.; Zhang, J.; et al. Microplastic pollution in surface sediments of urban water areas in Changsha, China: Abundance, composition, surface textures. Mar. Pollut. Bull. 2018, 136, 414–423. [Google Scholar] [CrossRef] [PubMed]
  35. Morel, A.; Mueller, J.L. Normalized water-leaving radiance and remote sensing reflectance: Bidirectional reflectance and other factors. Ocean Opt. Protoc. Satell. Ocean Color Sens. Valid. Revis. 2002, 3, 183–210. [Google Scholar]
  36. Tang, J.W.; Tian, G.L.; Wang, X.Y.; Wang, X.M.; Song, Q.J. The methods of water spectra measurement and analysis I: Above-water method. J. Remote Sens. 2004, 8, 37–44. [Google Scholar]
  37. Tyler, J.E. The secchi disc. Limnol. Oceanogr. 1968, 13, 1–6. [Google Scholar] [CrossRef]
  38. Liu, D.; Pan, D.; Bai, Y.; He, X.; Wang, D.; Wei, J.-A.; Zhang, L. Remote Sensing Observation of Particulate Organic Carbon in the Pearl River Estuary. Remote Sens. 2015, 7, 8683–8704. [Google Scholar] [CrossRef] [Green Version]
  39. Jespersen, A.M.; Christoffersen, K. Mearsurements of chlorphyll-a from phytoplankton using ethanol as extraction solvent. Arch. Hydrobiol. 1987, 109, 445–454. [Google Scholar]
  40. Zhao, Y.; Xia, X.H.; Yang, Z.F.; Wang, F. Assessment of water quality in Baiyangdian Lake using multivariate statistical techniques. Procedia Environ. Sci. 2012, 13, 1213–1226. [Google Scholar] [CrossRef] [Green Version]
  41. Lim, J.H.; Lee, C.W.; Bong, C.W.; Affendi, Y.A.; Hii, Y.S.; Kudo, I. Distributions of particulate and dissolved phosphorus in aquatic habitats of Peninsular Malaysia. Mar. Pollut. Bull. 2018, 128, 415–427. [Google Scholar] [CrossRef]
  42. Bricaud, A. Absorption by dissolved organic matter of the sea (yellow substance) in the UV and visible domains. Limnol. Oceanogr 1981, 26, 43–53. [Google Scholar] [CrossRef]
  43. Zheng, Z.; Li, Y.; Guo, Y.; Xu, Y.; Liu, G.; Du, C. Landsat-Based Long-Term Monitoring of Total Suspended Matter Concentration Pattern Change in the Wet Season for Dongting Lake, China. Remote Sens. 2015, 7, 13975–13999. [Google Scholar] [CrossRef] [Green Version]
  44. Chen, J.; Zhu, W.; Tian, Y.Q.; Yu, Q. Monitoring dissolved organic carbon by combining Landsat-8 and Sentinel-2 satellites: Case study in Saginaw River estuary, Lake Huron. Sci. Total Environ. 2020, 718, 137374. [Google Scholar] [CrossRef]
  45. Lim, J.; Choi, M. Assessment of water quality based on Landsat 8 operational land imager associated with human activities in Korea. Environ. Monit. Assess. 2015, 187, 384. [Google Scholar] [CrossRef]
  46. Toming, K.; Kutser, T.; Laas, A.; Sepp, M.; Paavel, B.; Nõges, T. First Experiences in Mapping Lake Water Quality Parameters with Sentinel-2 MSI Imagery. Remote Sens. 2016, 8, 640. [Google Scholar] [CrossRef] [Green Version]
  47. Bi, S.; Li, Y.; Xu, J.; Liu, G.; Song, K.; Mu, M.; Lyu, H.; Miao, S.; Xu, J. Optical classification of inland waters based on an improved Fuzzy C-Means method. Opt. Express 2019, 27, 34838–34856. [Google Scholar] [CrossRef] [PubMed]
  48. Craig, S.E.; Jones, C.T.; Li, W.K.W.; Lazin, G.; Horne, E.; Caverhill, C.; Cullen, J.J. Deriving optical metrics of coastal phytoplankton biomass from ocean colour. Remote Sens. Environ. 2012, 119, 72–83. [Google Scholar] [CrossRef]
  49. Jackson, T.; Sathyendranath, S.; Mélin, F. An improved optical classification scheme for the Ocean Colour Essential Climate Variable and its applications. Remote Sens. Environ. 2017, 203, 152–161. [Google Scholar] [CrossRef]
  50. Ahn, Y.-H.; Bricaud, A.; Morel, A. Light backscattering efficiency and related properties of some phytoplankters. Deep Sea Res. Part A Oceanogr. Res. Pap. 1992, 39, 1835–1855. [Google Scholar] [CrossRef]
  51. Kutser, T. Quantitative detection of chlorophyll in cyanobacterial blooms by satellite remote sensing. Limnol. Oceanogr 2004, 49, 2179–2189. [Google Scholar] [CrossRef]
  52. Gower, J.; King, S.; Borstad, G.; Brown, L. Detection of intense plankton blooms using the 709 nm band of the MERIS imaging spectrometer. Int. J. Remote. Sens. 2007, 26, 2005–2012. [Google Scholar] [CrossRef]
  53. Gilerson, A.; Zhou, J.; Hlaing, S.; Ioannou, I.; Schalles, J.; Gross, B.; Moshary, F.; Ahmed, S. Fluorescence component in the reflectance spectra from coastal waters. Dependence on water composition. Opt. Express 2007, 15, 15702–15721. [Google Scholar] [CrossRef] [PubMed]
  54. Zimba, P.; Gitelson, A. Remote estimation of chlorophyll concentration in hyper-eutrophic aquatic systems: Model tuning and accuracy optimization. Aquaculture 2006, 256, 272–286. [Google Scholar] [CrossRef]
  55. Lei, S.; Wu, D.; Li, Y.; Wang, Q.; Huang, C.; Liu, G.; Zheng, Z.; Du, C.; Mu, M.; Xu, J.; et al. Remote sensing monitoring of the suspended particle size in Hongze Lake based on GF-1 data. Int. J. Remote Sens. 2018, 40, 3179–3203. [Google Scholar] [CrossRef]
  56. Qu, B.; Sillanpää, M.; Zhang, Y.; Guo, J.; Wahed, M.S.M.A.; Kang, S. Water chemistry of the headwaters of the Yangtze River. Environ. Earth Sci. 2015, 74, 6443–6458. [Google Scholar] [CrossRef]
  57. Olguin, E.J.; Sanchez-Galvan, G.; Melo, F.J.; Hernandez, V.J.; Gonzalez-Portela, R.E. Long-term assessment at field scale of Floating Treatment Wetlands for improvement of water quality and provision of ecosystem services in a eutrophic urban pond. Sci. Total Environ. 2017, 584–585, 561–571. [Google Scholar] [CrossRef] [PubMed]
  58. Lei, S.; Lyu, H.; Xu, J.; Li, Y.; Du, C.; Mu, M.; Zeng, S.; Miao, S.; Bi, S.; Wang, Q. Remote Monitoring of PSD Slope Under the Influence of Sand Dredging Activities in Lake Hongze Based on Landsat-8/OLI Data and VIIRS/DNB Night-Time Light Composite Data. IEEE J. Sel. Top. Appl. Earth Obs. Remote Sens. 2019, 12, 4198–4212. [Google Scholar] [CrossRef]
  59. Morel, A.; Sournia, A. Light and photosynthesis in aquatic ecosystems (J. T. O. Kirk). Limnol. Oceanogr. 1987. [Google Scholar] [CrossRef]
  60. Ding, Y.; Wang, S.; Zhang, W.; Feng, M.; Yu, R. A rule of hydrological regulating on nutritional status of Poyang Lake, since the operation of the Three Gorges Dam. Ecol. Indic. 2019, 104, 535–542. [Google Scholar] [CrossRef]
  61. Xiong, J.; Lin, C.; Ma, R.; Cao, Z. Remote Sensing Estimation of Lake Total Phosphorus Concentration Based on MODIS: A Case Study of Lake Hongze. Remote Sens. 2019, 11, 2068. [Google Scholar] [CrossRef] [Green Version]
  62. Zhang, Y.; Zhou, L.; Zhou, Y.; Zhang, L.; Yao, X.; Shi, K.; Jeppesen, E.; Yu, Q.; Zhu, W. Chromophoric dissolved organic matter in inland waters: Present knowledge and future challenges. Sci. Total Environ. 2021, 759, 143550. [Google Scholar] [CrossRef]
  63. Jin, X.; Wang, S.; Pang, Y.; Chang Wu, F. Phosphorus fractions and the effect of pH on the phosphorus release of the sediments from different trophic areas in Taihu Lake, China. Environ. Pollut. 2006, 139, 288–295. [Google Scholar] [CrossRef]
  64. Cao, F.; Tzortziou, M.; Hu, C.; Mannino, A.; Fichot, C.G.; Del Vecchio, R.; Najjar, R.G.; Novak, M. Remote sensing retrievals of colored dissolved organic matter and dissolved organic carbon dynamics in North American estuaries and their margins. Remote Sens. Environ. 2018, 205, 151–165. [Google Scholar] [CrossRef]
  65. Cao, J.; Sun, Q.; Zhao, D.; Xu, M.; Shen, Q.; Wang, D.; Wang, Y.; Ding, S. A critical review of the appearance of black-odorous waterbodies in China and treatment methods. J. Hazard. Mater. 2020, 385, 121511. [Google Scholar] [CrossRef]
  66. Ren, J.; Zheng, Z.; Li, Y.; Lv, G.; Wang, Q.; Lyu, H.; Huang, C.; Liu, G.; Du, C.; Mu, M.; et al. Remote observation of water clarity patterns in Three Gorges Reservoir and Dongting Lake of China and their probable linkage to the Three Gorges Dam based on Landsat 8 imagery. Sci. Total Environ. 2018, 625, 1554–1566. [Google Scholar] [CrossRef] [PubMed]
  67. Chinese Ministry of Housing and Urban-Rural Development. Working Guidelines for the Treatment of Urban Black-odorous Water; Chinese Ministry of Housing and Urban-rural Development: Beijing, China, 2015.
  68. Kannel, P.R.; Lee, S.; Lee, Y.S.; Kanel, S.R.; Khan, S.P. Application of water quality indices and dissolved oxygen as indicators for river water classification and urban impact assessment. Environ. Monit. Assess. 2007, 132, 93–110. [Google Scholar] [CrossRef] [PubMed]
  69. Pesce, S.F.; Wunderlin, D.A. Use of water quality indices to verify the impact of Córdoba City (Argentina) on Suquıía River. Water Res. 2000, 34, 2915–2926. [Google Scholar] [CrossRef]
  70. Yulong, G.; Yunmei, L.; Heng, L.; Shanshan, W.; Yongbo, W. Applicability analysis of the model for remotely estimating total suspended matter concentration based on principal component dimension reduction. J. Lake Sci. 2013, 25, 892–899. [Google Scholar] [CrossRef] [Green Version]
  71. Spyrakos, E.; O’Donnell, R.; Hunter, P.D.; Miller, C.; Scott, M.; Simis, S.G.H.; Neil, C.; Barbosa, C.C.F.; Binding, C.E.; Bradt, S.; et al. Optical types of inland and coastal waters. Limnol. Oceanogr. 2018, 63, 846–870. [Google Scholar] [CrossRef] [Green Version]
  72. Vantrepotte, V.; Loisel, H.; Dessailly, D.; Mériaux, X. Optical classification of contrasted coastal waters. Remote Sens. Environ. 2012, 123, 306–323. [Google Scholar] [CrossRef]
  73. Li, X.; Liu, L.; Wang, Y.; Luo, G.; Chen, X.; Yang, X.; Hall, M.H.; Guo, R.; Wang, H.; Cui, J.; et al. Heavy metal contamination of urban soil in an old industrial city (Shenyang) in Northeast China. Geoderma 2013. [Google Scholar] [CrossRef]
  74. Tong, R.; Cheng, M.; Yang, X.; Yang, Y.; Shi, M. Exposure levels and health damage assessment of dust in a coal mine of Shanxi Province, China. Process Saf. Environ. Prot. 2019, 128, 184–192. [Google Scholar] [CrossRef]
  75. Maksimovich, N.; Pyankov, S.; Khayrulina, E. Environmental assessment of closeded coal mine territory using GIS analysis. Mine Water Circ. Econ. 2017, 2017, 212–217. [Google Scholar]
  76. Colomina, I.; Molina, P. Unmanned aerial systems for photogrammetry and remote sensing: A review. ISPRS J. Photogramm. Remote Sens. 2014, 92, 79–97. [Google Scholar] [CrossRef] [Green Version]
  77. Guimarães, T.T.; Veronez, M.R.; Koste, E.C.; Souza, E.M.; Brum, D.; Gonzaga, L.; Mauad, F.F. Evaluation of Regression Analysis and Neural Networks to Predict Total Suspended Solids in Water Bodies from Unmanned Aerial Vehicle Images. Sustainability 2019, 11, 2580. [Google Scholar] [CrossRef] [Green Version]
  78. Wei, L.; Huang, C.; Wang, Z.; Wang, Z.; Zhou, X.; Cao, L. Monitoring of Urban Black-Odor Water Based on Nemerow Index and Gradient Boosting Decision Tree Regression Using UAV-Borne Hyperspectral Imagery. Remote Sens. 2019, 11, 2402. [Google Scholar] [CrossRef] [Green Version]
Figure 1. Locations and distributions of sampling points in (a) Nanjing, (b) Yangzhou, (c) Changzhou, (d) Changsha, and (e) Wuxi.
Remotesensing 13 04047 g001
Figure 2. Performance of the Sen2Cor processor based on Sentinel-2 MSI.
Remotesensing 13 04047 g002
Figure 3. Spectral curves of each OWT (ah). The thin blue curves are Rrs measured in situ and the red bold curves are the mean Rrs of each OWT.
Remotesensing 13 04047 g003
Figure 4. Standardized spectral curves of OWTs based on the Sentinel-2 MSI spectral channel (a). The distribution of OWTs in the built-up area of Nanjing on 19 July 2017, based on a Sentinel-2 MSI image (b).
Remotesensing 13 04047 g004
Figure 5. Boxplots for Chla, TN, TP, TSM, NH4-N, sulfide, DOC concentration, pH, SD, DO concentration, ORP, and aCDOM(440) across six UWQLs (al).
Remotesensing 13 04047 g005
Figure 6. Results of urban water quality levels based on Sentinel-2 MSI of the built-up area of Nanjing on 19 July 2017. UWQL1–UWQL6: the six typical water areas of UWQLs.
Remotesensing 13 04047 g006
Figure 7. Field photographs of six typical water areas for (a) UWQL1; (b) UWQL2; (c) UWQL3; (d) UWQL4; (e) UWQL5; (f) UWQL6.
Remotesensing 13 04047 g007
Figure 8. Rrs values of the Chla concentration (CH, mg/m3), TSM concentration (TS, mg/L), and aCDOM(440) (CD, m−1) in different ranges. The typical Rrs spectra of OWT5: a1 (OWT5, Wuxi), a2 (OWT5, Wuxi), and a3 (OWT5, Wuxi) (a). The typical Rrs spectra of OWT2: b1 (OWT3, Wuxi), b2 (OWT2, Nanjing), and b3 (OWT3, Changzhou) (b). The typical Rrs spectra of OWT6: c1 (OWT6, Wuxi), c2 (OWT6, Wuxi), and c3 (OWT6, Wuxi) (c).
Remotesensing 13 04047 g008
Figure 9. Pearson correlation coefficient matrix between 12 water quality parameters, only showing the Pearson correlation coefficient when p < 0.05 (a), and typical Rrs values of black-odorous water and ordinary water (b). OR: ORP (mV); DO: DO concentration (mg/L); SD: SD (m); NH: NH4-N (mg/L).
Remotesensing 13 04047 g009
Figure 10. Scatter plot of the mean WQI values versus the scores of the UWQLs.
Remotesensing 13 04047 g010
Figure 11. Six original spectra and their corresponding normalized Rrs spectra from OWT3, OWT5, and OWT6. The original and normalized pairs are (ae), (bf), (cg), and (dh), respectively.
Remotesensing 13 04047 g011
Figure 12. Score differences between adjacent OWTs (bar chart) and the total scores (line chart) obtained by taking the trimmed mean as a statistic under different sample sizes (100%, 95%, 90%, 85%, 80%, and 75%) (a). The score ranges of the trimmed mean, mean, and median used as statistics under different sample sizes (100%, 95%, 90%, 85%, 80%, and 75%) (b).
Remotesensing 13 04047 g012
Figure 13. Sankey diagram of the water quality assessment results obtained based on the GB 2002-3838 standard versus the UWQLs obtained in this research, which were all based on in situ measurements of water quality parameters and Rrs data.
Remotesensing 13 04047 g013
Table 1. Values of 12 water quality parameters in the in-suit dataset.
ParametersSDPHDOORPChlaTSMTNNH4-NTPSulfideDOCaCDOM(440)
MEAN ± S.D.0.39 ± 0.197.72 ± 0.705.06 ± 4.1715.34 ± 105.5477.02 ± 101.2735.61 ± 35.686.56 ± 6.394.70 ± 5.850.68 ± 0.740.54 ± 0.545.61 ± 2.811.43 ± 0.93
MIN0.015.500.09−320.000.023.000.370.020.030.0031.850.17
MAX1.2110.1023.89235.00660.09337.0037.2148.55.536.2723.988.00
Table 2. Water quality grading results of the OWTs.
OWTsOWT1OWT2OWT3OWT4OWT5OWT6OWT7OWT8
SCORE66665848383327-
UWQLsUWQL1UWQL1UWQL2UWQL3UWQL4UWQL5UWQL6UWQLM
Publisher’s Note: MDPI stays neutral with regard to jurisdictional claims in published maps and institutional affiliations.