Article

Spatial Analysis of Urban Residential Sensitivity to Heatwave Events: Case Studies in Five Megacities in China

1
College of Applied Arts and Sciences, Beijing Union University, No.197 Beitucheng West Road, Beijing 100191, China
2
Laboratory of Urban Cultural Sensing & Computing, Beijing Union University, No.197 Beitucheng West Road, Beijing 100191, China
3
College of Resource Environment and Tourism, Capital Normal University, No.105 West 3rd Ring Road North, Beijing 100048, China
*
Author to whom correspondence should be addressed.
Remote Sens. 2021, 13(20), 4086; https://doi.org/10.3390/rs13204086
Submission received: 30 August 2021 / Revised: 3 October 2021 / Accepted: 5 October 2021 / Published: 13 October 2021
(This article belongs to the Special Issue Advances to GIS for Sensing of Earth and Human Interaction)

Abstract

:
Urban heatwaves increase residential health risks. Identifying urban residential sensitivity to heatwave risks is an important prerequisite for mitigating the risks through urban planning practices. This research proposes a new paradigm for urban residential sensitivity to heatwave risks based on social media Big Data, and describes empirical research in five megacities in China, namely, Beijing, Nanjing, Wuhan, Xi’an and Guangzhou, which explores the application of this paradigm to real-world environments. Specifically, a method to identify urban residential sensitive to heatwave risks was developed by using natural language processing (NLP) technology. Then, based on remote sensing images and Weibo data, from the perspective of the relationship between people (group perception) and the ground (meteorological temperature), the relationship between high temperature and crowd sensitivity in geographic space was studied. Spatial patterns of the residential sensitivity to heatwaves over the study area were characterized at fine scales, using the information extracted from remote sensing information, spatial analysis, and time series analysis. The results showed that the observed residential sensitivity to urban heatwave events (HWEs), extracted from Weibo data (Chinese Twitter), best matched the temporal trends of HWEs in geographic space. At the same time, the spatial distribution of observed residential sensitivity to HWEs in the cities had similar characteristics, with low sensitivity in the urban center but higher sensitivity in the countryside. This research illustrates the benefits of applying multi-source Big Data and intelligent analysis technologies to the understand of impacts of heatwave events on residential life, and provide decision-making data for urban planning and management.

1. Introduction

The Fifth Report of the Intergovernmental Panel on Climate Change (IPCC) confirmed that human activities, especially greenhouse gases emitted by fossil fuels, have made climate warming an irreversible fact. Urban heatwave events (HWEs) have become increasingly frequent, and are thus listed as extreme weather events [1]. Following the current emissions scenario, the frequency of population exposure to HWEs in the Northern Hemisphere will be 4–8 times higher than in 2010 by the end of the century [2]. HWEs not only lead to urban resource shortage and ecological environment deterioration, but also directly affect residential work and life, and even threaten human health [3,4,5,6,7,8]. The Lancet Countdown China Report, released in December 2020, introduced indicators such as heat-related premature death due to extreme heat for the first time. It was noted that heat-related deaths in China have increased fourfold since 1990, and reached 26,800 by 2019. Economic losses caused by HWEs were equivalent to the combined average annual income of 1.4 million Chinese people. Rapid urbanization will further aggravate the risk of HWEs [9]. Therefore, it has become an important topic for scholars and government decisionmakers to pay attention to the risk of heatwaves in rapidly urbanizing regions. Thus, the harmful effects of urban heatwaves on residential health is an area of concern. For example, heatstroke is a condition associated with long-term exposure to extreme weather [10]. Many people do not pay much attention when the temperature increases above their tolerance range; some symptoms such as coma and functional impairment occur, and the heat may have cause damage to health [11]. Therefore, increasing the residential sensitivity to HWEs is of great significance for reducing heatwave hazards.
At present, research on the spatial identification of heatwave risks is mainly carried out under the theoretical framework of stress–fragility–exposure risk assessments proposed by the IPCC [12]. The basic idea can be summarized as follows. Firstly, according to the perspective of people’s sensitivity to the environment, environmental factors related to HWEs are selected, and evaluation factors are obtained by subjective weighting, objective weighting or comprehensive weighting, according to the intensity and frequency of the impact of these factors on people’s production and life [13,14]. Additionally, multiple types of data are combined, especially integrating demographic datasets, health datasets and socio-economic datasets in spatial statistical units [15,16,17,18]. Finally, population sensitivity models are established in order to use GIS technology and other methods of performing spatial analyses, and to present the results [19,20,21]. In this framework, the evaluation indicators derived by remote sensing and socio-economic datasets acted as determinants. Generally, research based on remote sensing is usually focused on natural factors related to heatwave risks. Temperature is an important index to characterize the residential sensitivity in terms of heatwaves. The temperature that had a direct impact on human health and sensitivity referred to the air temperature observed by meteorological stations. However, the sparsity and scale effects of meteorological stations limited the application of meteorological data in the spatial identification of heatwave risks [22]. It has been documented that there is a linear correlation between air temperature and land surface temperature (LST) assessed by remote sensing [23,24]. Therefore, LST is often used as a quantitative index to indicate the exposure to heatwaves [25,26]. In addition, considering the significant correlation between LST and the urban underlying surface, the spatial patterns of heatwave risk are quantitatively characterized by the land use/cover types, vegetation index, water body index, building density, and impervious surface index extracted based on remote sensing imagery [27,28,29]. The above indexes emphasize more in terms of the natural influence of HWEs on the space. The urban heatwave risk was affected by the comprehensive effects of the natural environment, social and economic conditions, population characteristics, and other factors [26,27,28,29,30,31,32]. Traditionally, indicators representing socio-economic conditions and population characteristics were generally obtained through the spatialization of socio-economic statistical data [33,34]. However, it was often difficult to obtain some social factors closely associated with residential sensitivity to heatwave, such as the size of the elderly population, air conditioning, and the ownership of public spending on the property. In addition, the spatialization process also made the data inaccurate. Scholars have also attempted to introduce night-time light images to indicate the population, social economy, etc. [35,36]. This approach also is faced with problems, such as time mismatch.
In recent years, social sensing Big Data based on location services has been successfully applied to accurately measure the spatiotemporal behavior and emotional cognition of groups in large areas [37]. Research on the identification of heatwave risk from the sensitivity of group perception by integrating remote sensing data and social sensing data is also at the exploratory stage. Remote sensing images with medium and high spatial resolution can accurately depict the spatiotemporal evolution characteristics of high temperature in geographical space [38]. Data from the social media platform Weibo, including spatiotemporal markers in geographic space, contain rich information on the geographical environment expressed in real time [39]. In the spatiotemporal development process of heatwaves in geospatial space, there are also spatiotemporal differences in the perception of residential sensitivity to heatwaves in the Weibo environment. The sensitivity can be spatially identified by coupling the two spatiotemporal processes. Cecinati et al. [40] and Wang Juan et al. [41] documented obvious correlations between heatwave events in geospatial space and public opinions related to high temperatures on Twitter or Weibo (Chinese Twitter). This provided a theoretical basis to identify heatwave risks from the perspective of group sensitivity.
Different exposures, sensitivities and adaptabilities to HWEs in urban residents are influenced by the spatial heterogeneity of the geographical environment, population structure, and socio-economic conditions. Under the combined action of these three factors, the heatwave risks also have obvious spatial heterogeneities. At the regional scale, many scholars have conducted comparative studies on heatwave risks in large cities in Europe and the United States by taking cities as research units [42,43,44]. The comparison of heatwave risks in large cities and urban agglomerations in China has also attracted widespread attention [29,45,46,47,48]. It has been shown that the heatwave risks are mainly affected by climatic and environmental conditions in urban areas at the regional scale [49]. Generally, urban residents in colder climate areas are more sensitive to high temperatures, and the risk from heatwaves is also greater [50]. Such research at the regional scale can help decisionmakers to clarify the overall degree of harm presented by heatwaves to cities; however, it is difficult to further guide the spatial allocation of disaster prevention and mitigation resources. Therefore, attention has increasingly focused on the inner-city scale. Such studies usually take kilometer-level grids or districts and counties as research units to map the spatial patterns of heatwave risks [27,29,51,52]. It has been shown that urban internal greening rates, building densities, spatial structures and urban forms are closely related to risks posed by high temperatures [33]. Some scholars have also discussed the matching between heatwave risk zoning and the spatial distribution of public service facilities. Meteorological data and socio-economic and demographic data have been analyzed as contemporary research methodologies to identify the main influencing factors on the health risks posed by urban heatwaves [53,54]. It has been documented that a reasonable distribution of public service facilities can enhance a city’s ability to cope with heatwaves [55]. This also indicated that in order to achieve the fine-grained spatial control of heatwave risk group sensitivity, it is necessary to deeply explore the spatial patterns of heatwave risks and their differences at fine spatial scales.
Above all, there have been rich research achievements on the risks of heatwave in recent years. However, the spatial identification of residential sensitivity on heatwave risks from the perspective of various social groups through the integration of remote sensing data and social media data is still at the exploratory stage. This approach fails to address the following questions: Can social media Big Data be used to identify high temperature sensitivity in addition to public health data such as hospital cases? What are the spatial differences in residential sensitivity to the risks of urban heatwaves in cities? Can urban heatwave risk zones be identified in time to provide technical support for the government and public health departments to issue early warnings? This study builds a research framework on the identification of residential sensitivity to heatwave risk, driven by social media Big Data: empirical research on five megacities in China was carried out. Specifically, by taking Beijing, Nanjing, Wuhan, Xi’an and Guangzhou in China as the study areas, this research aimed to conduct spatial mapping and develop multi-perspective understanding of the residential sensitivity to urban heatwave risks in cities, and then address the following questions: (1) Is it feasible to reflect residential sensitivity to geographic HWEs through social media data? (2) Are there any regularities or differences in the spatial patterns of residential sensitivity to heatwave risks in cities?
The remainder of this paper is structured as follows. The study area and methods are introduced in Section 2. The spatiotemporal variations of urban heatwaves in geographical space and the information on high temperatures expressed in real time on Weibo are presented in Section 3. The spatial patterns of urban residential sensitivity to heatwave indexes in the study areas are recognized and visualized in Section 4. Finally, the discussions and conclusions are presented in Section 4 and Section 5.

2. Materials and Methods

2.1. Study Area

Five megacities in China were selected as the study areas in this research, namely, Beijing, Guangzhou, Nanjing, Wuhan and Xi’an. All of these cities have experienced rapid urbanization in recent years, and play important roles in China’s considerable economic and urban development. By the end of 2017, the population of each of these cities reached more than 8.3 million. In addition, these cities are frequently listed as the China’s “oven cities”, with maximum temperatures in summer frequently higher than 35 °C. Additionally, these cities are located in different climatic zones in China, and are thus representative for the study of HWEs.
Urban heatwaves have seriously impacted people’s physical and mental health. People in these areas frequently complain about high temperatures on Weibo, which reflects the sensitivity of residents to the risks of heatwaves. The locations of the selected cities and the related Weibo items are shown in Figure 1.

2.2. Data

2.2.1. Meteorological Datasets

The daily maximum surface air temperature datasets from 1 June to 31 August 2017, were collected from the China Meteorological Data Service Center (CMDC). These were used to extract the number of urban heatwave events across the study areas. All datasets were quality-controlled by manual examination and correction. The accuracy was close to 100% (http://data.cma.cn/en, accessed on 1 September 2020). For each city, the meteorological station selected for this study was that closest to the urban center.

2.2.2. Remote Sensing Data

Version 6.1 of MYD11A1 was obtained to derive the time series of daytime LST from the National Aeronautics and Space Administration (NASA) EarthData Search (https://search.earthdata.nasa.gov/search, accessed on 1 September 2020). This dataset has a spatial resolution of 1 km and a temporal resolution of 1-day intervals. It has been improved by correcting noise due to cloud contamination, topographic differences, and zenith angle changes, and has a high accuracy with low root-mean-square differences based on the surface emissivity evaluations [56]. Invalid data were eliminated using the quality assurance (QA) flags included in the product. In this study, LST products from 1 June to 31 August 2017, were selected to quantify the spatial characteristics of HWEs. There were missing values due to frequent cloud obscuration in the study area; therefore, a time-series-averaged method was employed to account for the noise effects. Finally, the averaged LST datasets for the urban heatwaves in 2017 were derived.

2.2.3. Social Media Weibo Data

Weibo is a Chinese microblogging website (similar to Twitter). Launched by Sina Corporation on 14 August 2009, it is one of the largest social media platforms in China [2]. In this study, all the Weibo data from 2017 in the study area were obtained from the social media platform using web crawler technology. According to the Weibo User Trends Report in 2017, produced by the Weibo Data Center (https://socialone.com.cn/weibo-user-trends-report-2017/, accessed on 1 September 2020), there were 376 million monthly active users on the Weibo social media platform up to September 2017. Although the users of social media may vary in age, gender, occupation and individual behavior differenced [57], Weibo data still played important role in detecting the time and space of heat events, with the advantage of rich contextual content and geographical location information [58]. The attributes collected included the Weibo_ID, Content, Pubtime, Latitude, and Longitude and other information. In total, 3.6 million individual data points were obtained as the data source for this study. First, the Weibo data were filtered based on keywords, such as “summer”, “high temperature”, “weather”, “ovens”, etc. Then, we selected the data during the heatwave events from 1 June to 31 August in 5 cities as the sample: the total number of Weibo information points was 91,495 (dots in Figure 1). Many Weibo data points filtered by the keywords had nothing to do with HWEs; therefore, the last step was to use NLP technology (methodology described in Section 2.3.2) to extract Weibo data related to HWEs, obtaining a total of 41,154 data points (red dots in Figure 1).

2.2.4. Other Auxiliary Datasets
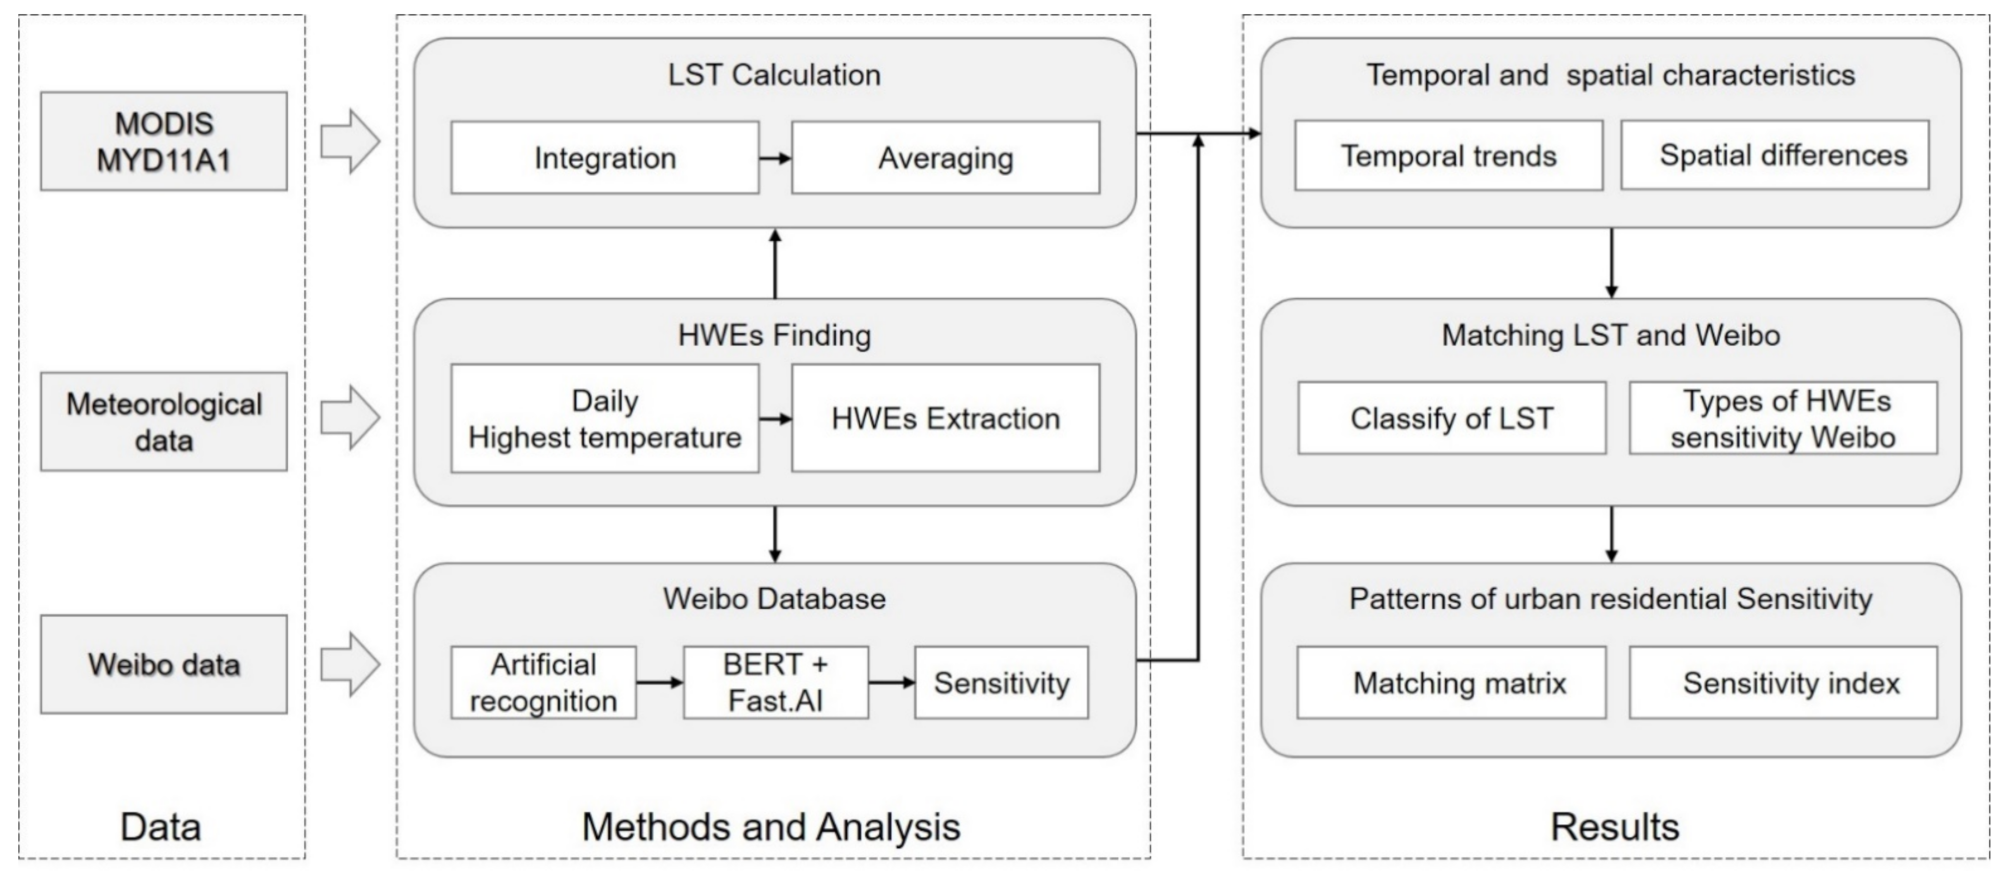
All administrative boundaries at the scale of 1:4,000,000 maps were obtained from the National Earth System Science Data Center (http://www.geodata.cn/, accessed on 1 September 2020). These boundaries were used to separate cities and extract the Weibo items for the study area.

2.3. Methods

The spatial patterns of residential sensitivity to heatwaves were quantified by comparing HWEs in the geographical space and on social media. Firstly, HWEs in the geographical space were extracted; then, their spatial patterns were qualitatively described. Secondly, we extracted the sensitivity to HWE on social media based on complaints about high temperature on Weibo. Here, the Bidirectional Encoder Representations from Transformers (BERT) technique [59] was employed. BERT is a language encoder tool released by Google in 2018, and is able to translate input sentences or paragraphs into corresponding semantic features. It uses a special pretraining task to build a bi-directional language model based on transformers. Due to the complexity of the BERT model framework itself, this study used the Simple Transformers library based on HuggingFace’s open-source Transformer2.0 to utilize the BERT model and build a text-based multi-classification model, which greatly simplified the process.
Then, spatial patterns from the two perspectives were comparatively examined by both qualitative and quantitative methods. The flowchart of this research is shown in Figure 2. The LST datasets were firstly batch pre-processed in MRT software. Then, spatial analysis in ArcGIS software was employed to quantify the spatial patterns of HWEs combined with the geographical databases.
The BERT model, was programmed in Python programming language. Finally, the spatial patterns of HWE risks were visualized in ArcGIS software.

2.3.1. Quantifying HWEs in Geographical Space

Firstly, urban heatwave events were determined based on the standards of heat-warning alerts designed by the China Meteorological Administration (CMA). If the daily maximum surface air temperature was over 35 °C and the temperature exceeded this threshold for at least 3 days, an urban heatwave event was defined. All the urban heatwave events in the study area are listed in Table 1.
Secondly, according to the extracted periods when the HWEs occurred, all the images in the study area were selected and land surface temperature values were averaged [60]; the formula is as follows:
L S T a v g = i = 1 n T i n
where L S T a v g is the LST after mean processing, and T i is the LST in the ist image. When two raster datasets are tessellated, the average of the two overlay values becomes the output pixel value. If multiple raster datasets overlap, only two raster datasets are processed at a time. Due to the natural geographical environment, urban land use and other factors, the number and intensity of high-temperature days in these five cities were different.

2.3.2. Extracting the Sensitivity to the HWEs in the Social Media

In this study, we preprocessed 376 million Weibo data points, deleting emoticons, garbled codes and null values; then, the keywords and stop words related to UHWEs were imputed to the text extraction model for filtering. The results were used as training data and prediction data in machine learning and semantic analysis.
After preprocessing, the pretrained Chinese BERT-based model was initialized to perform binary classification. We randomly selected 6000 Weibo items as the training samples. For each item, if it was related to heatwave events, it was labeled as 1; otherwise, it was labeled as 0. For example, the following typical Weibo items expressed real-time sentiments about the hot weather, “it’s too hot outside, back home now” and “a happy day, only too hot”. Then, these items were divided into training datasets and test datasets, and imputed into the BERT model. After continuously adjusting the parameters and iterations, a trained text binary classification model was obtained (the model accuracy reached 95.31%). Then, all 91,415 Weibo data points were imputed into BERT for classification. After classification and extraction, 41,154 Weibo data points remained which were related to HWEs.
Next, the selected Weibo items were geocoded based on their latitude–longitude information and spatialized using a 1 km × 1 km evenly spaced rectangular spatial sampling pattern (fishnet) for each city. The real situation of residential sensitivity to HWEs could not accurately be expressed by only using the number of Weibo items. For example, due to the large populations in the city downtowns, there are considerable Weibo data generated every day, and the number of Weibo comments about HWEs will also increase. However, their proportion in the total Weibo dataset may be small; in contrast, if the population in a certain area is relatively small, the total amount of Weibo data generated will also be small, although there may be more comments about HWEs, making it a relatively large proportion of the total Weibo dataset. Considering the influence of population distribution on the distribution of Weibo data, this study took the ratio of the number of Weibo data points related to HWEs to the total number of HWEs as the reference value of spatial distribution. The formula is as follows:
R = i = 1 n l i L i
where n is the number of days of HWEs,   i is the day of the HWE, l is the number of Weibo data points related to HWEs, and L is the total amount of Weibo data. The ratio, R , is the specific proportion value is displayed in each fishnet to study the spatial distribution characteristics of the sensitivity to HWEs. All corresponding Weibo data in the study area are listed in Table 2.

2.3.3. Matching of LST and Sensitivity to HWEs

In order to compare LST and residential sensitivity to HWEs more clearly, we divided the fishnets of LST and residential sensitivity to HWEs into two modes, high and low, and paired them through a matching matrix. We use different standards in defining the “High” and “Low” HWEs in geographical and Weibo space. We did not have access to daily weather data for all pixels in these cities; therefore, we defined the pixel as “High” if the temperature of the merged LST dataset in this pixel was greater than or equal to 37 °C (we integrated the air–ground temperature differences caused by various urban environmental factors, and finally determined a value of 2 °C as the most reasonable [61]; as we described above, 35 °C is the temperature of HWEs defined by the National Meteorological Information Centre (CMA)). In Weibo, we define the fishnet as “High” if the R (Equation (2)) in this fishnet was higher than 0.5 standard deviations; otherwise, it was categorized as “Low” (Table 3).

3. Results

3.1. Temporal Correlation of HWEs and the Residential Sensitivity to HWEs

Figure 3 shows the daily maximum temperature and temporal changes in the number of HWE-related Weibo data points in five cities from June to August 2017.
The red lines indicate the hot weather temperature threshold defined by the National Meteorological Administration, representing 35 °C; the blue lines indicate the daily maximum temperature change; the orange bars indicate the number of Weibo posts complaining about high temperature posted by urban residents on heatwave days; and the gray bars represent the number of Weibo comments complaining about high temperature posted by urban residents on common days.
From the temporal correlation between HWEs and Weibo data complaining about high temperature, we can determine that the two trends show the same characteristics, but when a hot weather process ends, urban residential sensitivity to HWEs will continue. When a hot weather event lasts for a long time, complaints about HWEs come earlier, which may be due to the weather forecast that encourages people voice their concerns earlier.

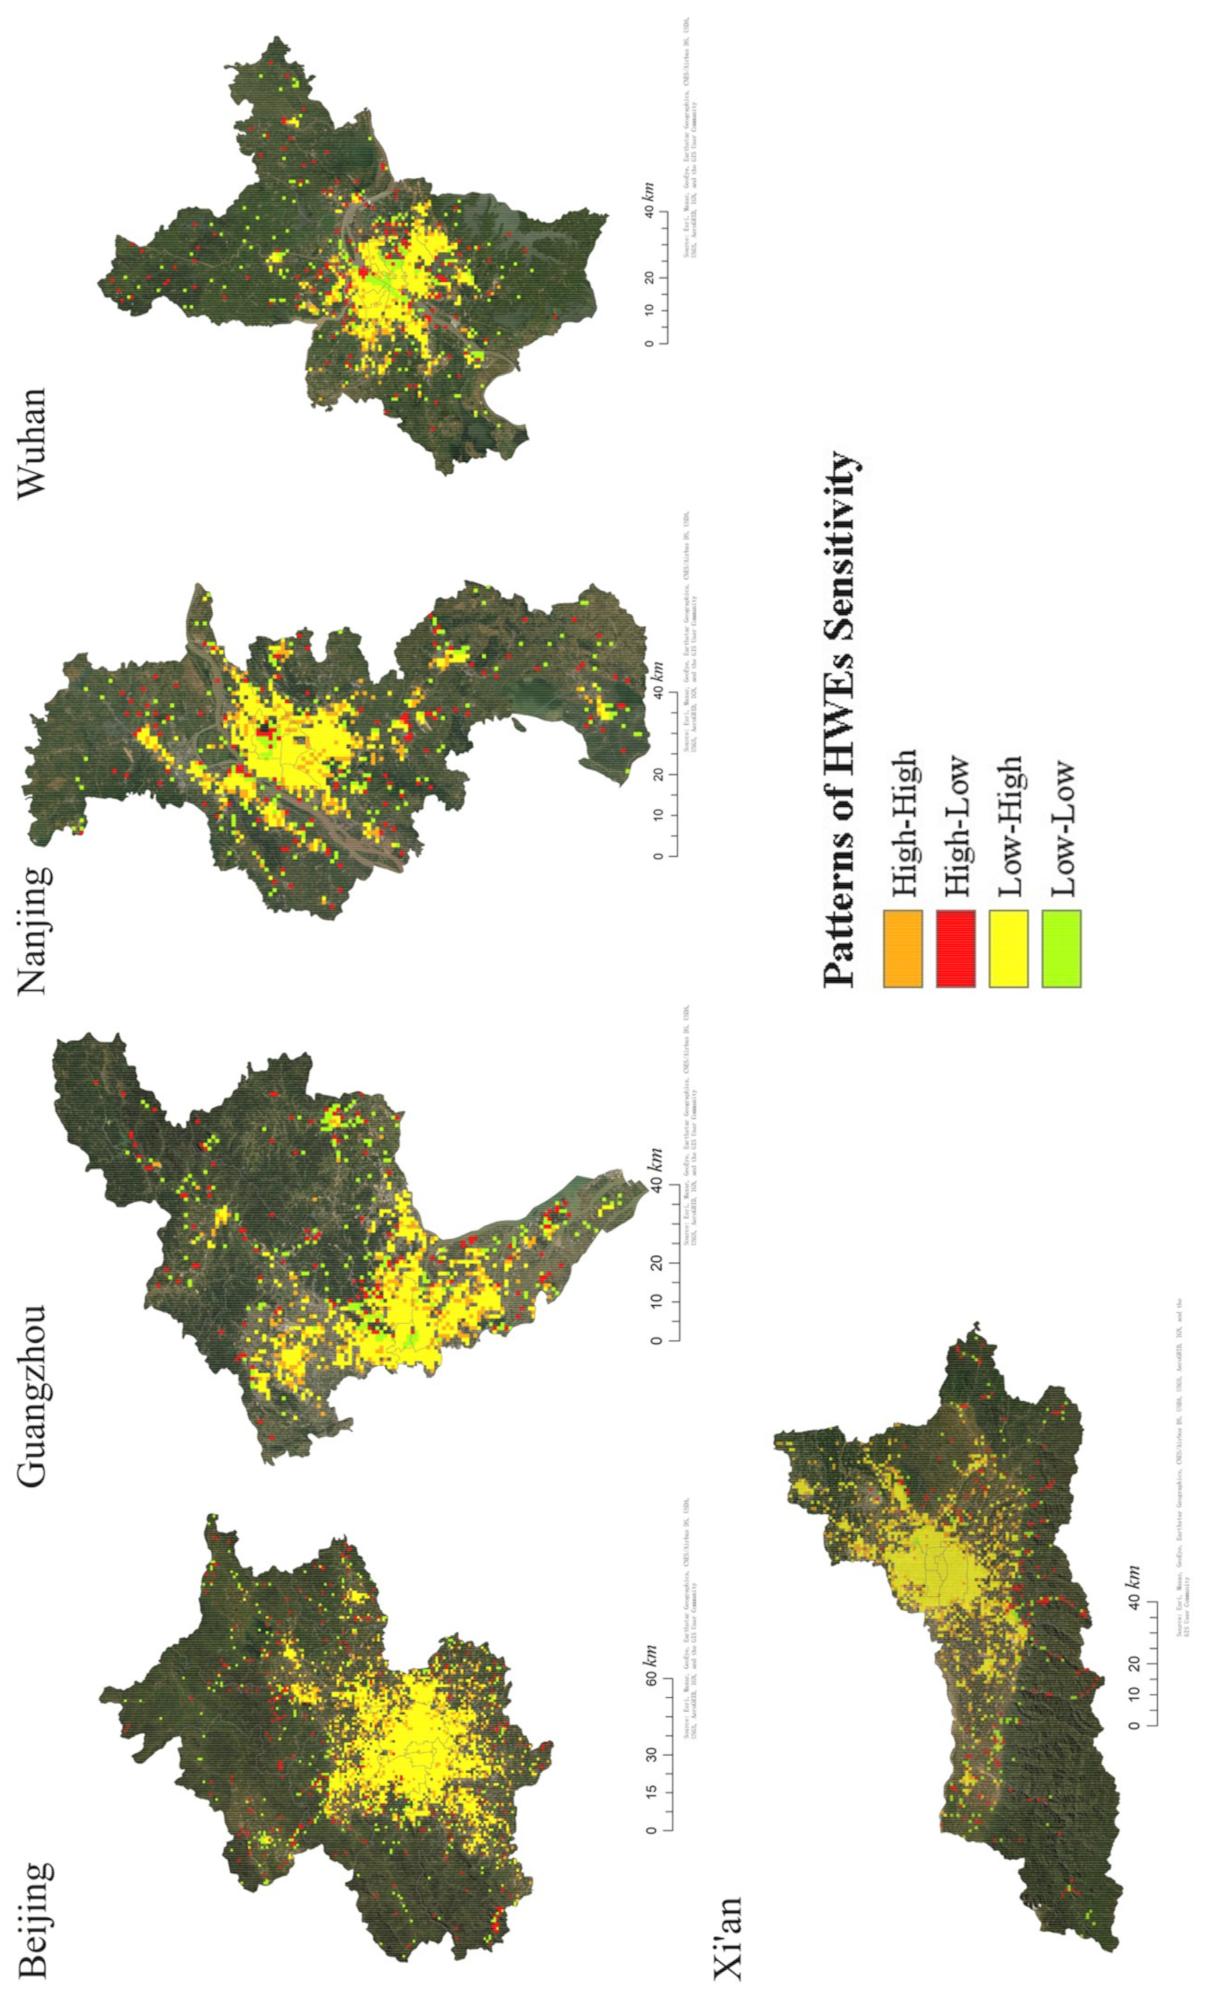
3.2. Spatial Patterns of the LST and Residential Sensitivity to HWEs

Based on Equations (1) and (2), the spatial distribution of LST and the residential sensitivity to HWEs of five cities were calculated (Figure 4).
It can be seen from the surface temperature reflected by MODIS LST products that the high-temperature areas are mainly concentrated in centrally, forming a clear heat island. In these areas, there are a large number of buildings and hardened pavements, resulting in a very high surface temperature of above 46 °C in some areas. On the periphery of the city center, there are also some small heat islands distributed in all directions. All of these hot areas accommodate a large number of urban residents, and are also the main places for people to carry out economic and daily activities.
Combining the urban temperature distribution reflected by the MODIS LST product with the spatial features reflected by the Weibo HWE data, we can determine that the temperature in the center of the cities is higher than the surrounding areas; at the same time, in cities, the temperature in the plains is generally higher than the temperature in the mountains (Figure 4, left). However, the spatial pattern of residential sensitivity to HWEs on Weibo are very different from LST. In the city centers, where urban heatwaves are more intense than other areas, the ratio, R, of posting on Weibo about heatwaves is not higher than 1.5 standard deviations; thus, people are not obviously sensitive to HWEs in these areas. However, in the suburbs, mountainous areas, and near-water areas, where urban heatwaves do not occur strongly, the ratio, R, of posting about heatwaves on Weibo is higher than 1.5 standard deviations, which shows that people are more sensitive to HWES in these areas (Figure 4, right).
The sensitivity reflections expressed by urban residents on Weibo under the occurrence of HWEs of different intensities also have a distinct pattern (Figure 5).
Figure 5 shows the relationship between urban residential sensitivity and temperature. The bar indicates the number of HWEs on Weibo for the five cities as a function of temperature, and the line indicates the ratio of Weibo points for each of the cities with respect to temperature. The horizontal axis is the temperature (°C), the left vertical axis is the ratio of HWEs with a value range from 0 to 1 (refer to Equation (2)), and the right vertical axis is the number of HWEs on Weibo. In general, the number of discussions on HWEs among residents of the five cities in Weibo space decreases with increasing temperature.
Overall, the residents of the five cities showed a positive correlation between discussing HWEs on Weibo and the change in temperature. Specifically, when the temperature was below 30 °C, although the number of people discussing HWEs on Weibo increased, its proportion did not exhibit an increasing trend; therefore, in this temperature range, people’s sensitivity to HWEs did not show an obvious positive relationship with the increase in temperature. When the temperature was greater than or equal to 30 °C, the number of HWE-related Weibo posts increased with the increasing temperature. Particularly, the highest rate of increase was observed at 36 °C to 37 °C. Notably, the change in the number of Weibo accounts where people discussed HWEs did not increase significantly; after reaching a peak at 35 °C, the rate decreased significantly. In summary, when the temperature gradually increased, people’s discussions about the weather focuses more on the content of HWEs, whereas the content of discussions about other weather information decreased in both quantity and proportion.
Generally, the proportion of HWE-related Weibo posts was more consistent with the trend in temperature change, although a similar trend existed in the number of HWE-related Weibo posts, but its correlation as a little weaker than the ratio of HWEs to Weibo posts.

3.3. Spatial Patterns of the LST and Residential Sensitivity to HWEs

According to the HWEs determined from geographical space reflected by MODIS LST and the residential sensitivity to HWEs, each fishnet was classified into two levels: high and low. By using the matching matrix introduced in Section 2.3.3, the differences can be observed in Table 4 and Figure 6.
The matching of LST and the sensitivity to HWEs of the cities have common spatial distribution characteristics: generally, in the urban center, the residential sensitivity to HWEs is less than to high temperatures in geographic space (Low–High pattern), and the distribution is more concentrated; however, towards the edges of urban areas, the temperature in geographic space is not as high as in the center of urban areas, but on social media, these places are associated with a higher sensitivity (High–Low pattern), and this pattern is more scattered across urban space. In addition to the edges of urban space, the High–Low pattern in Beijing, Guangzhou, and Xi’an is also distributed in mountainous areas with lower temperatures; the High–Low pattern in Nanjing and Wuhan is also distributed near rivers with lower temperatures.
Spatial differences in urban residential sensitivity to HWEs may also be reflected in the differences in land use types, leading to different exposures of people to HWEs. For example, the southwestern and northwestern mountainous areas of Beijing are not very hot in geographic terms; however, they are more correlated with High–Low patterns, and residents show increased sensitivity. In the downtown areas, where the intensity of HWEs is strongest, there are almost no High–Low patterns; thus, the residents do not exhibit high sensitivity. The land use types in these two regions are very different. The central areas of Beijing are mainly office buildings, residences, and transportation facilities, and residents are not exposed to hot weather for a long time as they move inside these facilities; some buildings even have sufficient air conditioning, where people enjoy a comfortable environment. If temperature exceeds the human tolerance range, it poses a great threat to people’s bodies and minds. A similar spatial distribution pattern appears in Xi’an, where the southern part of the city is dominated by high mountains (Qinling) and the built-up urban area is small; therefore, when HWEs occur, people are more exposed to hazards when they move around in the mountains, and thus there is a greater risk and prominent High–Low patterns. The northern part is the center of Xi’an, and the built-up urban area means that people are more often in buildings, vehicles and other indoor environments, so they are not seriously threatened even in HWEs.
The city centers of Nanjing and Wuhan are crossed by rivers (Yangtze River) and are also dotted with numerous lakes. Many riverbanks, and islands are also tourist attractions, and the exposure of urban residents in these areas is much higher than in other parts of the city center; thus, there is also a distribution of High–Low patterns, and HWEs will increase the risk to residents in these areas, and the intensity of residential sensitivity will increase accordingly.

4. Discussion

By extracting complaints about high-temperature weather from massive Weibo data, this article proposes a method to reflect the risks of high temperature in addition to hospital medical records, which is called residential sensitivity to heatwave events. By comparing the temporal trends of residential sensitivity to heatwaves and the actual high temperature events, it was found that there is a good relationship between them. In addition, residential sensitivity to heatwaves is enduring, and the intensity of sensitivity has a positive relationship with the frequency and intensity of heatwaves in geographic space. It was also found that residential responses to heatwave events in geographic space arise in a certain time window, indicating that the use of social media data for high-temperature sensitivity analysis is of great significance for improving the response to such risks.
The geographical distribution of heatwaves in these cities shows a common feature, i.e., more prosperous city centers experience the most significant heat island effects, due to urban surface hardening and the intensity of daily activities. Central urban areas experience the most intense urban heatwave events in the physical world, posing a great threat to people’s physical and mental health. However, in living spaces, people’s sensitivity to urban heatwaves is very different from the geospatial distribution characteristics of heatwaves. In urban areas where the intensity of urban heatwaves is the greatest, the ratio of discussions about urban heatwaves on Weibo was not the most intense. On the periphery of the city center, people’s discussions of urban heatwaves reached the highest level of enthusiasm, which is very different from the geospatial distribution of LST. This shows studies of high temperature risks should not only consider high temperatures in the physical world, but also consider the sensitivity of residents to high-temperature events.
The matching of LST and sensitivity to HWEs of the cities is a very important inspiration for studying high-temperature risks. Comparing the four patterns in Figure 6, we found that resident’s sensitivity to HWEs is not synergistic with real LST data, but is related to their location and activities. For example, high temperatures in the city center have little effect on resident’s sensitivity to HWEs (Low–High in Figure 6). One reason could be that these people are usually accustomed to high temperatures in these urban heat island areas. On the other hand, in these areas, most people work, study and live in air-conditioned buildings such as offices, in a relatively comfortable indoor environment. In contrast, in places such as mountainous areas and the edges of lakes, there are a lot of outdoor tourist attractions; people spend longer outdoors doing various different activities. Even if the temperature is not as high as those in the downtown and plain areas, people’s activities are greatly affected by the weather; therefore, residents’ reactions to temperature are more intense than those in urban areas who show more sensitivity to HWEs (High–Low in Figure 6). Therefore, the residential sensitivity to UHWs is not only affected by the spatial distribution of temperature, but may also be closely related to people’s outdoor exposure and behavior.

5. Conclusions

The risk of HWEs is not only the high temperature itself, but also in the harm to the people. This study used NLP technology to extract the residential sensitivity to HWEs from Weibo data. The most obvious advantage of Weibo data is that it comprises text information, in which people can express their emotions immediately, and reflect users’ perception of the surrounding environment to a certain extent. This research provides a new understanding of the sensitivity to HWE risks and LST in the city.
We have analyzed the temporal and spatial changes in HWEs in geographic space and the residential sensitivity to HWEs in five Chinese megacities: Beijing, Guangzhou, Nanjing, Wuhan and Xi’an. The results in Figure 3 showed that the residential sensitivity to urban HWEs extracted from Weibo data was consistent with the geospatial and temporal trend in HWEs. We also found that residential sensitivity to heatwave events on Weibo was expressed in a certain time window, which may be useful for the government to reduce the risks of HWEs in advance.
At the same time, the spatial distribution of residential sensitivity to HWEs in the cities exhibited similar characteristics, with low sensitivity in the urban center and higher sensitivity in the countryside (Figure 6). This study will promote the research of people’s sensitivity to heatwaves with the support of multisource Big Data and intelligent analysis technology. The results can also provide a decision-making basis for urban planning and management departments.

Author Contributions

Conceptualization, G.Z., B.M. and J.W.; methodology, G.Z.; software, S.C.; validation, B.T. and J.L.; formal analysis, B.M.; investigation, J.W.; resources, H.J.; data curation, T.Y.; writing—original draft preparation, G.Z.; writing—review and editing, G.Z. and B.W.; visualization, H.J.; supervision, J.L.; project administration, B.M. and J.W.; All authors have read and agreed to the published version of the manuscript.

Funding

This research was funded by National Key Research and Development Program of China, grant number 2017YFB0503605; National Natural Science Foundation of China, grant number 41671165; Funding Project for Academic Human Resources Development in Institutions of Higher Learning Under the Jurisdiction of Beijing Municipality, grant number CIT&TCD201904070 and this research was funded by Beijing Union University, grant number ZK40202001, RB202101 and YZ2020K001.

Acknowledgments

The authors would like to grateful to the editor and anonymous reviewers for their positive comments on the manuscript.

Conflicts of Interest

The authors declare no conflict of interest.

References

  1. Murray, V.; Ebi, K.L. IPCC special report on managing the risks of extreme events and disasters to advance climate change adaptation (SREX). J. Epidemiol. Community Health 2012, 66, 759–760. [Google Scholar] [CrossRef] [PubMed]
  2. Wang, J.; Yang, C.; Tett, F.B.S.; Yan, Z.; Zhai, P.; Feng, J.; Xia, J. Anthropogenically-driven increases in the risks of summertime compound hot extremes. Nat. Commun. 2020, 11, 1–11. [Google Scholar] [CrossRef] [PubMed] [Green Version]
  3. Tan, J.; Lu, C.; Chen, Z. High Temperature Heat Waves and Human Health; China Meteorological Press: Beijing, China, 2009. [Google Scholar]
  4. Thirumalai, K.; DiNezio, P.N.; Okumura, Y.; Deser, C. Extreme temperatures in Southeast Asia caused by El Niño and worsened by global warming. Nat. Commun. 2017, 8, 15531. [Google Scholar] [CrossRef] [PubMed]
  5. Phung, D.; Chu, C.; Tran, D.N.; Huang, C. Spatial variation of heat-related morbidity: A hierarchical Bayesian analysis in multiple districts of the Mekong Delta Region. Sci. Total Environ. 2018, 637, 1559–1565. [Google Scholar] [CrossRef] [PubMed]
  6. Huang, W.; Kan, H.; Kovats, S. The impact of the 2003 heat wave on mortality in Shanghai, China. Sci. Total Environ. 2010, 408, 2418–2420. [Google Scholar] [CrossRef]
  7. Zhang, W.; Zheng, C.; Chen, F. Mapping heat-related health risks of elderly citizens in mountainous area: A case study of Chongqing, China. Sci. Total Environ. 2019, 663, 852–866. [Google Scholar] [CrossRef]
  8. Ma, W.; Zeng, W.; Zhou, M.; Wang, L.; Rutherford, S.; Lin, H.; Liu, T.; Zhang, Y.; Xiao, J.; Zhang, Y.; et al. The short-term effect of heat waves on mortality and its modifiers in China: An analysis from 66 communities. Environ. Int. 2015, 75, 103–109. [Google Scholar] [CrossRef]
  9. Cai, W.; Zhang, C.; Suen, H.P.; Ai, S.; Bai, Y.; Bao, Y.; Bao, J.; Chen, B.; Cheng, L.; Cui, X.; et al. The 2020 China report of the Lancet Countdown on health and climate change. Lancet Public Health 2021, 6, e64–e81. [Google Scholar] [CrossRef]
  10. O’Malley, C.; Kikumoto, H. An investigation into the relationship between remotely sensed land surface temperatures and heat stroke incident rates in the Tokyo Prefecture 2010–2019. Sustain. Cities Soc. 2021, 71, 102988. [Google Scholar] [CrossRef]
  11. Yan, Y.-E.; Zhao, Y.-Q.; Wang, H.; Fan, M. Pathophysiological factors underlying heatstroke. Med. Hypotheses 2006, 67, 609–617. [Google Scholar] [CrossRef] [PubMed]
  12. IPCC. Climate change 2014: Impacts, adaptation, and vulnerability. In Part A: Global and Sectoral Aspects. Contribution of Working Group II to the Fifth Assessment Report of the Intergovernmental Panel on Climate Change Cambridge; Cambridge University Press: Cambridge, UK; New York, NY, USA, 2014. [Google Scholar]
  13. Xiao, Z.; Wang, Z.; Pan, W.; Wang, Y.; Yang, S. Sensitivity of extreme temperature events to urbanization in the Pearl River Delta Region. Asia-Pac. J. Atmos. Sci. 2019, 55, 373–386. [Google Scholar] [CrossRef]
  14. Zeng, X.-M.; Wu, Z.; Xiong, S.; Song, S.; Zheng, Y.; Liu, H. Sensitivity of simulated short-range high-temperature weather to land surface schemes by WRF. Sci. China Earth Sci. 2011, 54, 581–590. [Google Scholar] [CrossRef]
  15. Spangler, K.R.; Wellenius, G.A. Spatial patterns of recent US summertime heat trends: Implications for heat sensitivity and health adaptations. Environ. Res. Commun. 2020, 2, 035002. [Google Scholar] [CrossRef] [PubMed]
  16. Reddy, P.J.; Perkins-Kirkpatrick, S.E.; Sharples, J.J. Intensifying Australian heatwave trends and their sensitivity to observational data. Earth’s Futur. 2021, 9, e2020EF001924. [Google Scholar] [CrossRef]
  17. Yang, J.; Liu, H.Z.; Ou, C.Q.; Lin, G.Z.; Ding, Y.; Zhou, Q.; Shen, J.C.; Chen, P.Y. Impact of heat wave in 2005 on mortality in Guangzhou, China. Biomed. Environ. Sci. 2013, 26, 647–654. [Google Scholar] [CrossRef]
  18. Knowlton, K.; Rotkin-Ellman, M.; King, G.; Margolis, H.G.; Smith, D.; Solomon, G.; Trent, R.; English, P. The 2006 California heat wave: Impacts on hospitalizations and emergency department visits. Environ. Health Perspect. 2009, 117, 61–67. [Google Scholar] [CrossRef]
  19. Åström, C.; Ebi, K.L.; Langner, J.; Forsberg, B. Developing a heatwave early warning system for Sweden: Evaluating sensitivity of different epidemiological modelling approaches to forecast temperatures. Int. J. Environ. Res. Public Health 2015, 12, 254–267. [Google Scholar] [CrossRef] [PubMed] [Green Version]
  20. Gao, Z.; Hou, Y.; Chen, W. Enhanced sensitivity of the urban heat island effect to summer temperatures induced by urban expansion. Environ. Res. Lett. 2019, 14, 094005. [Google Scholar] [CrossRef] [Green Version]
  21. Kotroni, V.; Lagouvardos, K.; Retalis, A. The heat wave of June 2007 in Athens, Greece—Part 2: Modeling study and sensitivity experiments. Atmos. Res. 2011, 100, 1–11. [Google Scholar] [CrossRef]
  22. Xue, Q.; Xie, M.; Guo, Q.; Wang, Y.; Wu, R.; Liu, Q. Research progress on urban heat wave vulnerability assessment: A geographical perspective. Prog. Geogr. 2020, 39, 157–166. (In Chinese) [Google Scholar]
  23. Weng, Q. Thermal infrared remote sensing for urban climate and environmental studies: Methods, applications, and trends. ISPRS J. Photogramm. Remote Sens. 2009, 64, 335–344. [Google Scholar] [CrossRef]
  24. Nichol, J.E.; Fung, W.Y.; Lam, K.S.; Wong, M.S. Urban heat island diagnosis using ASTER satellite images and ‘in situ’ air temperature. Atmos. Res. 2009, 94, 276–284. [Google Scholar] [CrossRef]
  25. Tong, L.; Li, X.; Si, Q.; Zhang, J. Risk assessment of population exposure to heat wave: A case of Baotou City, Inner Mongolia, China. Arid. Land Geogr. 2017, 40, 284–292. (In Chinese) [Google Scholar]
  26. He, C.; Ma, L.; Zhou, L.; Kan, H.; Zhang, Y.; Ma, W.; Chen, B. Exploring the mechanisms of heat wave vulnerability at the urban scale based on the application of big data and artificial societies. Environ. Int. 2019, 127, 573–583. [Google Scholar] [CrossRef]
  27. Dai, X.; Liu, Q.; Wu, X.; Huang, C. The Risk of heat wave along the jakarta-bandung high speed railway in Indonesia. Trop. Geogr. 2021, 41, 147–158. (In Chinese) [Google Scholar]
  28. Miao, H.; Yongming, X.; Ning, L.; Lin, B. Assessing Heat Wave Risk in Beijing by Multi-Source Remote Sensing; Nangjing University of Information Science & Technology: Nanjing, China, 2019. (In Chinese) [Google Scholar]
  29. Fu, H.; Deng, F.; Yang, F. Assessing heat wave risk of urban agglomeration in the middle–lower Yangtze river based on remote sensing. Resour. Environ. Yangtze Basin 2020, 29, 1174–1182. (In Chinese) [Google Scholar]
  30. Thompson, R.; Hornigold, R.; Page, L.; Waite, T. Associations between high ambient temperatures and heat waves with mental health outcomes: A systematic review. Public Health 2018, 161, 171–191. [Google Scholar] [CrossRef]
  31. Hu, J.; Wen, Y.; Duan, Y.; Yan, S.; Liao, Y.; Pan, H.; Zhu, J.; Yin, P.; Cheng, J.; Jiang, H. The impact of extreme heat and heat waves on emergency ambulance dispatches due to external cause in Shenzhen, China. Environ. Pollut. 2020, 261, 114156. [Google Scholar] [CrossRef] [PubMed]
  32. Song, J.; Huang, B.; Kim, J.S.; Wen, J.; Li, R. Fine-scale mapping of an evidence-based heat health risk index for high-density cities: Hong Kong as a case study. Sci. Total Environ. 2020, 718, 137226. [Google Scholar] [CrossRef] [PubMed]
  33. Zhao, J. Countermeasures of a Heat Wave Based on Its Correlation with Urban Form; Dalian University of Technology: Dalian, China, 2020. (In Chinese) [Google Scholar]
  34. Li, H.; Zhang, M. Framework and application of health risk assessment for heat wave in Beijing. J. Environ. Health 2020, 37, 58–65. (In Chinese) [Google Scholar]
  35. Li, X.; Chen, Z.; Wu, J.; Wang, W.; Qu, L.; Zhou, S.; Han, X. Gridding methods of city permanent population based on night light data and spatial regression models. J. Geo-Inf. Sci. 2017, 19, 1298–1305. (In Chinese) [Google Scholar]
  36. Jin, P.; Xu, P. A study of urbanization progress and spatial pattern using DMSP/OLS nighttime light data: A case study of Hangzhou City. Remote Sens. Land Resour. 2017, 29, 205–213. (In Chinese) [Google Scholar]
  37. Liu, Y. Revisiting several basic geographical concepts: A social sensing perspective. Acta Geogr. Sin. 2016, 4, 564–575. (In Chinese) [Google Scholar]
  38. Sobrino, J.; Oltra-Carrió, R.; Sòria, G.; Bianchi, R.; Paganini, M. Impact of spatial resolution and satellite overpass time on evaluation of the surface urban heat island effects. Remote Sens. Environ. 2012, 117, 50–56. [Google Scholar] [CrossRef]
  39. Zheng, S.; Wang, J.; Sun, C.; Zhang, X.; Kahn, M.E. Air pollution lowers Chinese urbanites’ expressed happiness on social media. Nat. Hum. Behav. 2019, 3, 237–243. [Google Scholar] [CrossRef] [PubMed]
  40. Cecinati, F.; Matthews, T.; Natarajan, S.; McCullen, N.; Coley, D. Mining social media to identify heat waves. Int. J. Environ. Res. Public Health 2019, 16, 762. [Google Scholar] [CrossRef] [PubMed] [Green Version]
  41. Wang, J.; Meng, B.; Pei, T.; Du, Y.; Zhang, J.; Chen, S.; Tian, B.; Zhi, G. Mapping the exposure and sensitivity to heat wave events in China’s megacities. Sci. Total Environ. 2021, 755, 142734. [Google Scholar] [CrossRef]
  42. Smid, M.; Russo, S.; Costa, A.C.; Granell, C.; Pebesma, E. Ranking European capitals by exposure to heat waves and cold waves. Urban. Clim. 2019, 27, 388–402. [Google Scholar] [CrossRef]
  43. Guerreiro, S.B.; Dawson, R.J.; Kilsby, C.; Lewis, E.; Ford, A. Future heat-waves, droughts and floods in 571 European cities. Environ. Res. Lett. 2018, 13, 034009. [Google Scholar] [CrossRef]
  44. Hondula, D.M.; Davis, R.E.; Saha, M.V.; Wegner, C.R.; Veasey, L.M. Geographic dimensions of heat-related mortality in seven U.S. cities. Environ. Res. 2015, 138, 439–452. [Google Scholar] [CrossRef]
  45. Jin, X.; Qi, X.; Lu, Y.; Ye, H.; Wang, Y. Evaluation and spatial differentiation of heat waves risk of Fujian Province. J. Geo-Inf. Sci. 2018, 20, 136–145. (In Chinese) [Google Scholar]
  46. Chen, Q.; Ding, M.; Yang, X.; Hu, K.; Qi, J. Spatially explicit assessment of heat health risks using multi-source data: A case study of the Yangtze River Delta region, China. J. Geo-Inf. Sci. 2017, 11, 1475–1484. (In Chinese) [Google Scholar]
  47. Zheng, X.; Wang, Y.; Wu, X.; Qi, X.; Qi, X. Comparison of heat wave vulnerability between coastal and inland cities of Fujian Province in the past 20 years. Prog. Geogr. 2016, 35, 1197–1205. (In Chinese) [Google Scholar]
  48. Wang, J.; Meng, B.; Fu, D.; Pei, T.; Xu, C. Mapping Spatiotemporal Patterns and Multi-Perspective Analysis of the Surface Urban Heat Islands across 32 Major Cities in China. ISPRS Int. J. Geo-Inf. 2018, 7, 207. [Google Scholar] [CrossRef] [Green Version]
  49. Wu, Y.; Wang, X.; Wu, J.; Wang, R.; Yang, S. Performance of heat-health warning systems in Shanghai evaluated by using local heat-related illness data. Sci. Total Environ. 2020, 715, 136883. [Google Scholar] [CrossRef] [PubMed]
  50. Ward, K.; Lauf, S.; Kleinschmit, B.; Endlicher, W. Heat waves and urban heat islands in Europe: A review of relevant drivers. Sci. Total Environ. 2016, 569–570, 527–539. [Google Scholar] [CrossRef] [PubMed]
  51. Zeng, W.; Lao, X.Q.; Rutherford, S.; Xu, Y.; Xu, X.; Lin, H.; Liu, T.; Luo, Y.; Xiao, J.; Hu, M.; et al. The effect of heat waves on mortality and effect modifiers in four communities of Guangdong Province, China. Sci. Total Environ. 2014, 482–483, 214–221. [Google Scholar] [CrossRef] [PubMed]
  52. Chen, K.; Tang, Y. Identification of urban areas vulnerable to heat waves and coping strategies: A case study of Beijing central city. City Plan. Rev. 2019, 43, 37–44+77. (In Chinese) [Google Scholar]
  53. McMichael, A.J.; Wilkinson, P.; Kovats, R.S.; Pattenden, S.; Hajat, S.; Armstrong, B.; Vajanapoom, N.; Niciu, E.M.; Mahomed, H.; Kingkeow, C.; et al. International study of temperature, heat and urban mortality: The ‘ISOTHURM’ project. Int. J. Epidemiol. 2008, 37, 1121–1131. [Google Scholar] [CrossRef] [PubMed] [Green Version]
  54. Curriero, F.C.; Heiner, K.S.; Samet, J.M.; Zeger, S.L.; Strug, L.; Patz, J.A. Temperature and mortality in 11 cities of the Eastern United States. Am. J. Epidemiol. 2002, 155, 80–87. [Google Scholar] [CrossRef]
  55. Jin, X. The Risk Evaluation and Regionalization of Heat Wave in Fujian Province within the Background of Risk Society; Fujian Normal University: Fuzhou, China, 2017. (In Chinese) [Google Scholar]
  56. Öke, K. The Armenian Question; Turkish Historical Society Printing House: Ankara, Turkey, 2001; p. 297. [Google Scholar]
  57. Cai, J.; Huang, B.; Song, Y. Using multi-source geospatial big data to identify the structure of polycentric cities. Remote Sens. Environ. 2017, 202, 210–221. [Google Scholar] [CrossRef]
  58. Ning, P.F.; Wan, Y.C.; Ren, F. Sina Weibo for the data of time and space hot event detection method. Geomat. Spat. Inf. Technol. 2017, 40, 33–43. (In Chinese) [Google Scholar]
  59. Devlin, J.; Chang, M.W.; Lee, K.; Toutanova, K. BERT: Pre-training of deep bidirectional transformers for language understanding. In Proceedings of the 2019 Conference of the North American Chapter of the Association for Computational Linguistics, Minneapolis, MN, USA, 2–7 June 2019; pp. 4171–4186. [Google Scholar]
  60. Deilami, K.; Kamruzzaman, M.; Hayes, J.F. Correlation or causality between land cover patterns and the urban heat island effect? Evidence from Brisbane, Australia. Remote Sens. 2016, 8, 716. [Google Scholar] [CrossRef] [Green Version]
  61. Mu, H.; Xue, Z.; Li, J. Variation characteristics of Shanghai ground-air temperature difference and its influence factors. Acta Agric. Shanghai 2018, 34, 55–62. (In Chinese) [Google Scholar]
Figure 1. Study area and Weibo data used in this study.
Remotesensing 13 04086 g001
Figure 2. The research framework of this paper.
Remotesensing 13 04086 g002
Figure 3. Temporal trend correlation of HWEs and the residential sensitivity to HWEs (orange: the number of HWE-related Weibo data points on heatwave days; gray: The number of HWE-related Weibo data points on other days). The red line shows the temperature of 35 °C.
Remotesensing 13 04086 g003
Figure 4. Spatial patterns of residential sensitivity to HWEs between geographic space with LST (left) and on Weibo (right).
Remotesensing 13 04086 g004
Figure 5. Trend in urban residential sensitivity in Weibo space with temperature.
Remotesensing 13 04086 g005
Figure 6. Different types of urban residential sensitivity to heatwaves in the study area.
Remotesensing 13 04086 g006
Table 1. Sample of the main Weibo data.
_idContentPubTimeLatitudeLongitude
6202527610-M_F72PRtRlOIt’s extra hot in Beijing today, and the hot wind is blowing in the face. #Beijing#2017/6/9 18:1239.90554116.45202
5045403075-M_F71Edysm4On the way to work, hot,hot,hot.2017/6/9 15:1139.90844116.6659
5381580106-M_FfOPwAaCaToo hot to breathe.2017/8/6 11:0639.913162116.397163
Table 2. Number of HWE days and corresponding Weibo data points in five cities.
CityNumber of HWE DaysWeibo Data Points Related to HWEsNumber of Weibo Data Points
Beijing1914,56334,419
Guangzhou1937539390
Nanjing2343128801
Wuhan21508011,340
Xi’an4213,44627,545
Table 3. Matching matrix of LST and sensitivity to HWEs.
RLow (<0.5 std. Dev)High (≥0.5 std. Dev)
LST
Low (<37 °C)Low–LowHigh–Low
High (≥37 °C)Low–HighHigh–High
Notes: Low–Low and High–High mean that the urban residential sensitivity in Weibo is matched to the HWEs in geographic space; High–Low and Low–High mean the urban residential sensitivity in Weibo is mismatched to the HWEs in geographic space.
Table 4. Matching matrix of urban residential sensitivity to heatwave events.
CityClassify of LST Patterns and Sensitivities on Weibo
Beijing RLowHigh
LST
Low94428
High228964
Guangzhou RLowHigh
LST
Low288171
High475354
Nanjing RLowHigh
LST
Low245102
High430301
Wuhan RLowHigh
LST
Low227126
High469325
Xi’an RLowHigh
LST
Low389133
High769504
Publisher’s Note: MDPI stays neutral with regard to jurisdictional claims in published maps and institutional affiliations.

