Abstract
A series of small-magnitude earthquakes (Mw 2.9~Mw 4.9) occurred in Rong County, Sichuan Province, China between 30 March 2018 and December 2020, which threatened the safety of local residents. Determining the surface displacement and estimating the damage caused by these earthquakes are significant for earthquake relief, post-earthquake disaster assessment and hazard elimination. This paper integrates the Generic Atmospheric Correction Online Service (GACOS) with interferometry synthetic aperture radar (InSAR) to accurately detect the displacement of the series of small-magnitude earthquakes in Rong County based on 45 Sentinel-1 ascending/descending images acquired from January 2018 to December 2020. We analyze the influence of some factors involved in surface displacement, including earthquake magnitude, focal depth and the distance from the epicenter to the fault. The above measurement for small-magnitude earthquakes and statistics analysis for the displacement have not been performed before, so this can help better understand the displacement features of small-magnitude earthquakes, which are important for post-earthquake hazard assessment and disaster prevention.
1. Introduction
Between March 2018 and October 2020, 31 Mw < 5 earthquakes occurred in Rong County, Sichuan Province, China. The earthquake sources were distributed within an area of . These small-magnitude earthquakes have caused two deaths and 13 injuries, and a direct economic loss of about 177 million RMB [1]. Extracting the surface displacement information caused by these earthquakes is useful for the risk assessment of seismic hazards, emergency relief and seismic hazard research.
Interferometric Synthetic Aperture Radar (InSAR) is an effective ground monitoring method, providing all-day, all-weather, and high accuracy measurements [2], and is immune to cloud contamination. It can effectively detect small surface displacements of several millimeters to centimeters in a wide area, and has been often used to monitor earthquakes, landslides, and urban displacements [3,4,5,6,7,8,9,10]. In recent years, the differential InSAR (D-InSAR) technology has been used in surface displacement monitoring and seismic source parameter inversion of many earthquakes, such as the Albania earthquake [11], Kanallaki earthquake [12], Wenchuan earthquake [13], and Yushu earthquake [14,15,16,17,18,19,20]. However, most research has focused on Mw ≥ 5 earthquakes that caused displacements at the centimeter level and are easily detected by D-InSAR. The Mw < 5 earthquakes usually cause small surface displacements that are not easy be detected by InSAR, resulting in little attention and research.
This paper uses Sentinel-1 images and employs the D-InSAR method and GACOS atmospheric correction to detect the displacement of the small-magnitude earthquake cluster in Rong County. We analyze the influence of some factors involved in surface displacement, including earthquake magnitude, focal depth and the distance from the epicenters to the fault.
2. Study Area and Data
The earthquake information of the study area was obtained from the China Seismological Station (Table 1). Between March 2018 and December 2020, 31 earthquakes occurred in Rong County. There are 6 Mw ≤ 3 earthquakes, 18 3 < Mw < 4 earthquakes, and 7 Mw > 4 earthquakes. Currently, the study area is still seismically active, so many small-magnitude earthquakes will occur in the following years.

Table 1.
Information on the small-magnitude earthquakes in the study area.
The study area includes Rong County, Weiyuan County and Gongjing District in Zigong. This area is located in the southeast of Sichuan Province. The terrain is high in the northwest and low in the southeast. It has many flat dams and hills, with an average elevation of 500 m (Figure 1). Geologically, the strata are mainly purplish-red glutenite and flesh red sandstone. Rong County and Weiyuan County are located at the junction of T1 strata and T1+2 strata.
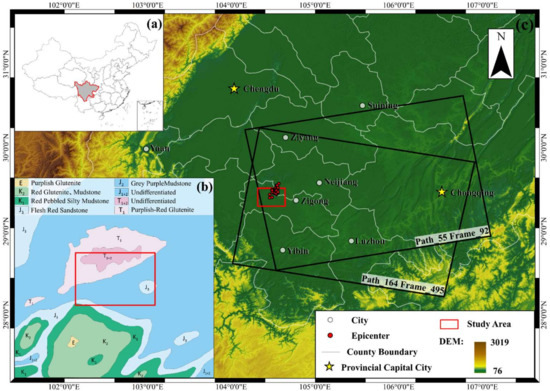
Figure 1.
(a) Location of the study area in China; (b) Geological map of the study area (Modified from [21]); (c) map of the study area and the image coverage, superposed on the ALOS DEM.
We used Sentinel-1 images for this study. The Sentinel-1 satellite was launched by the European Space Agency, and is a constellation consisting of Sentinel-1A and Sentinel-1B. The shortest revisit period is 6 days, and each scene covers an area of about 250 km × 170 km. The related parameters are shown in Table 2. The Precise Orbit Ephemerides (POD) are also introduced to correct the interferogram residual fringes and remove the systematic errors caused by orbital errors. We collected 45 ascending/descending Sentinel-1A images, spanning from March 2018 to December 2020. The ALOS digital elevation model (DEM) (30 m resolution) was also used to calculate the topographic and geomorphological feature parameters.
Table 2.
Basic information of the Sentinel-1 images.
3. Methodology
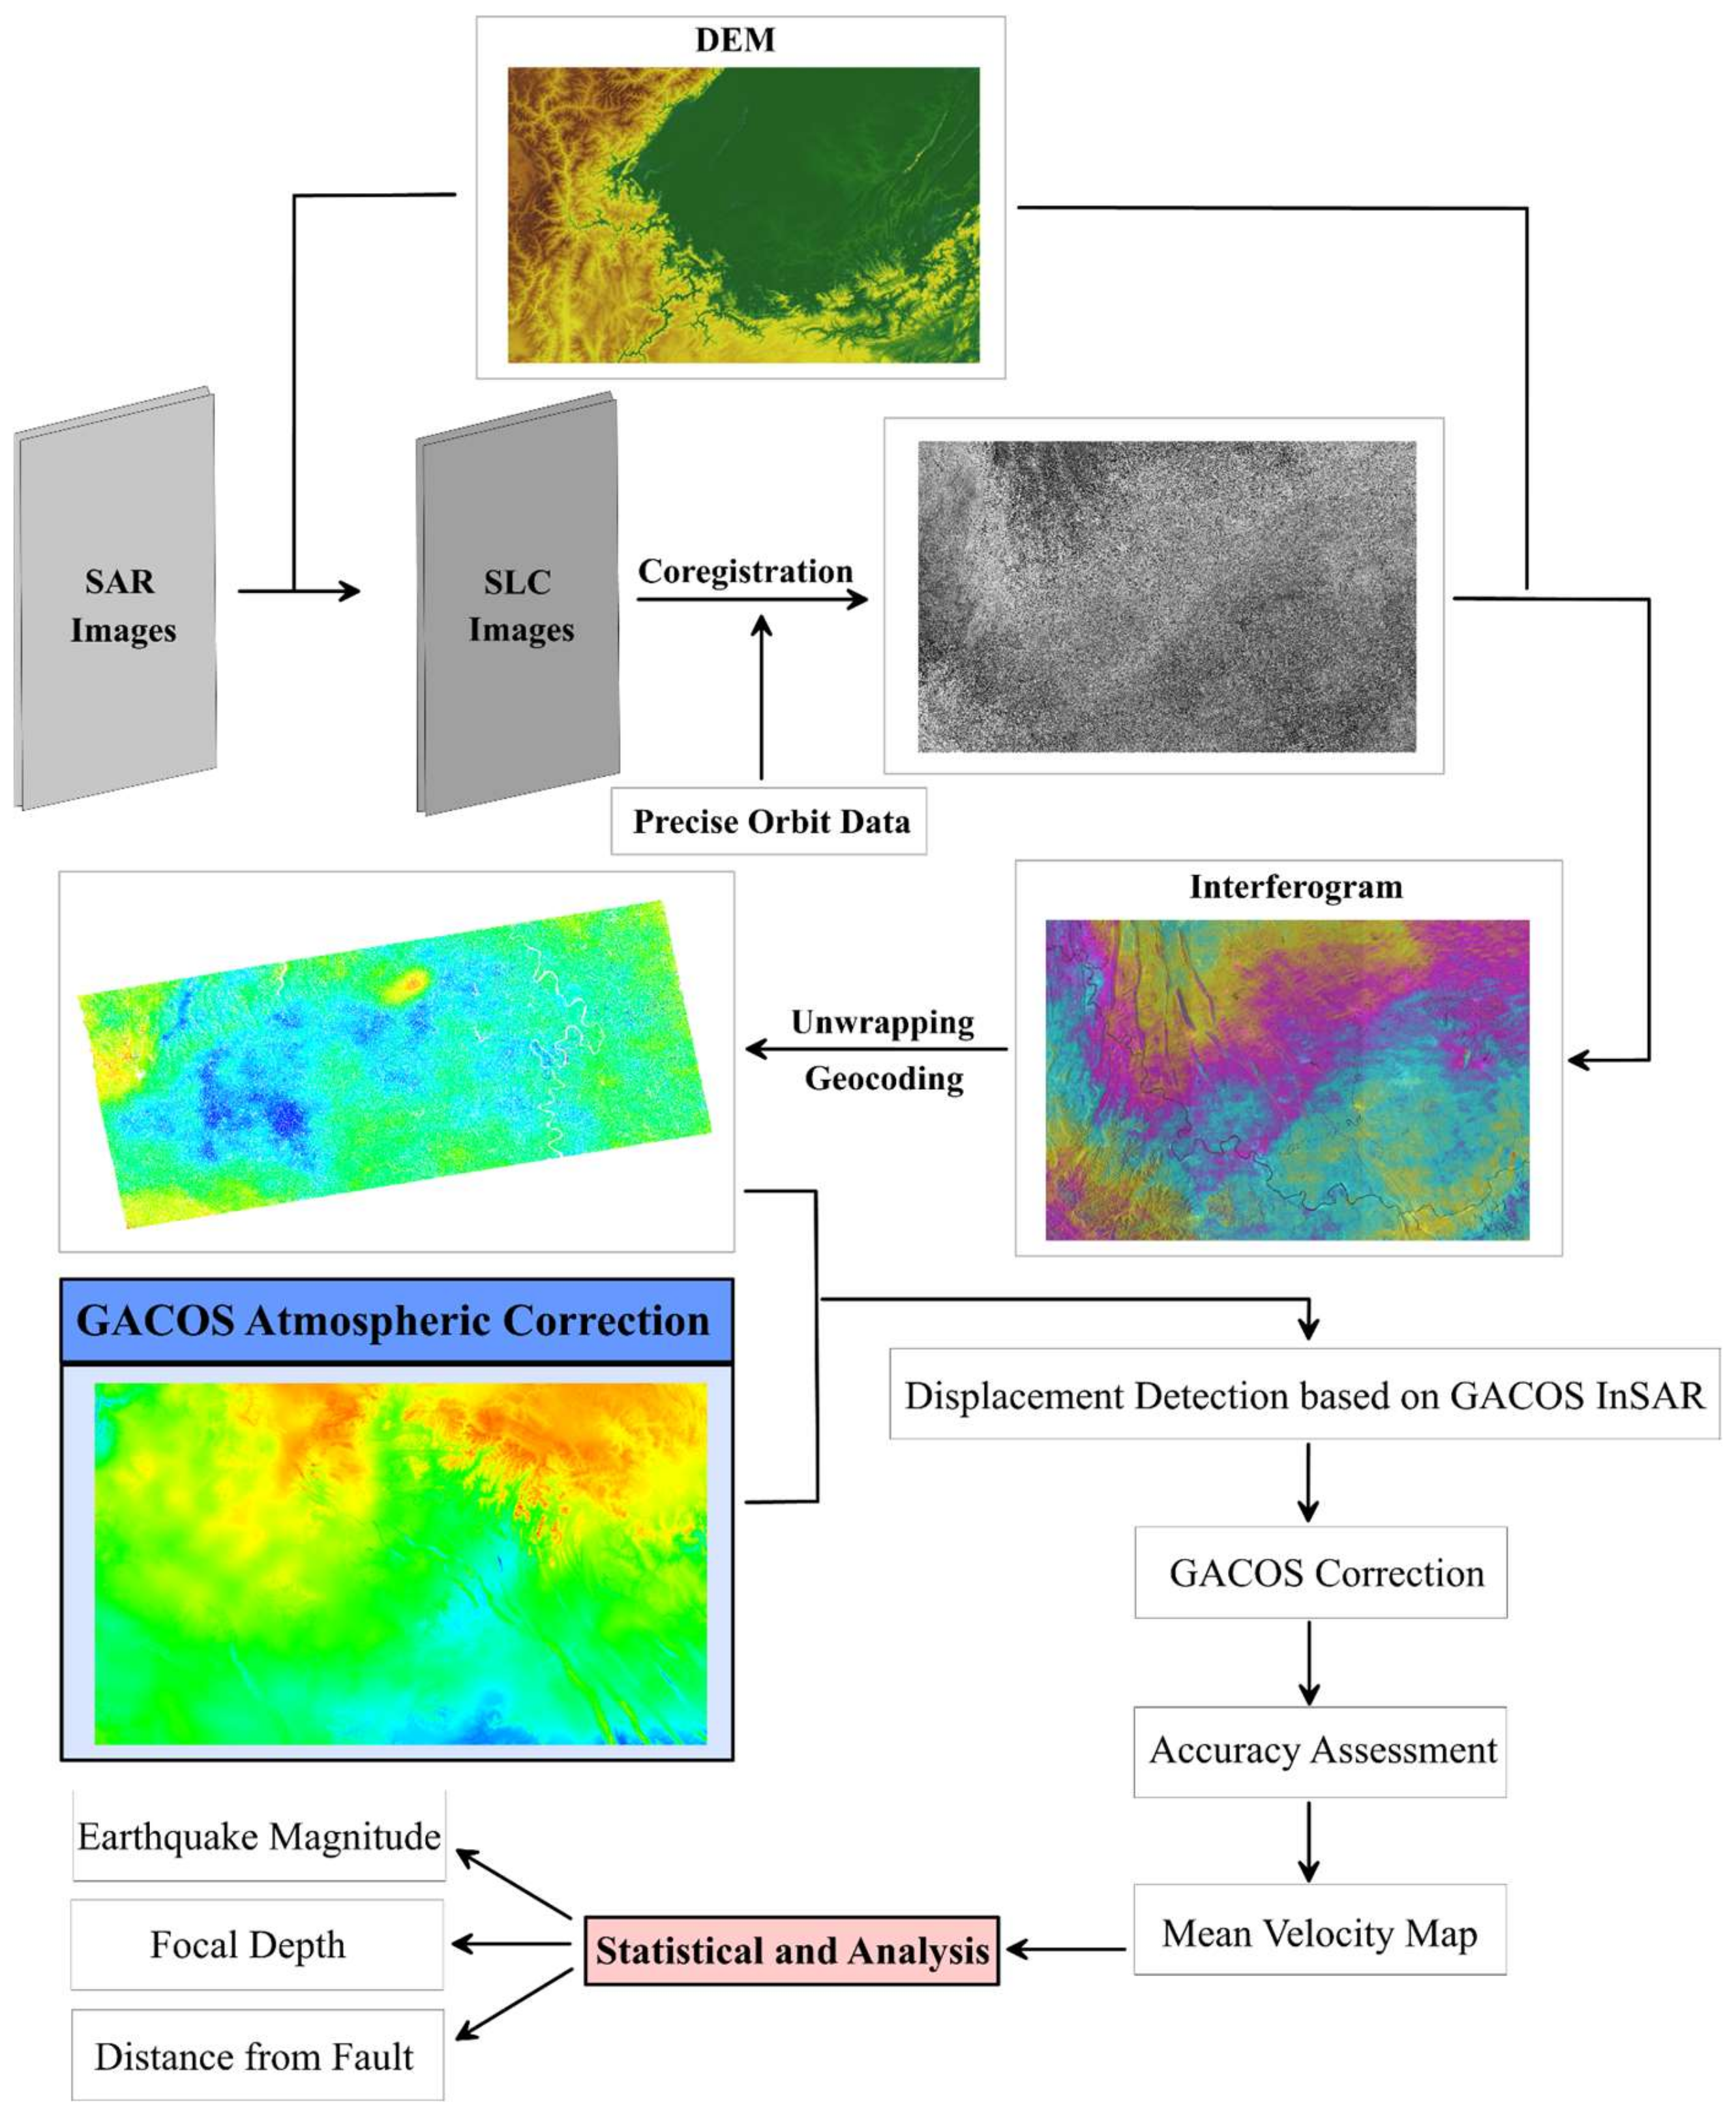
In this study, we propose a D-InSAR method integrated with GACOS atmospheric correction (referred to as the GACOS InSAR) to detect the surface displacement caused by small-magnitude earthquakes. The whole flowchart is shown in Figure 2. Firstly, we obtain the differential interferograms by processing the pre- and post-earthquake images. D-InSAR obtains a single look complex (SLC) by imaging the same area twice at different times. Then it co-registers and re-samples the images before generating an interferogram by multiplying them. The interferometric phase of each image element contains the displacement of each point relative to the reference position. Finally, the accurate displacement caused by the earthquakes can be obtained [22,23]. The arbitrary interference phase in the interferogram can be expressed as:
where is the wrapping operation. The interference phase mainly includes orbital differences , terrain undulation , surface displacement , atmospheric phase delay and noise components .

Figure 2.
Flowchart of the methodology.
Unwrapping in the two-dimensional space, we can obtain the surface displacement caused by the earthquake, but the accuracy of this information is affected by various factors such as atmospheric delay, spatio-temporal decoherence, and DEM errors. and can be accurately simulated and removed using the sensor’s precision orbital information and DEM. and can be suppressed or eliminated by a filtering and multi-looking operation. In mountainous areas with complex climate changes, dominates. The displacement of small-magnititude earthquakes may be completely masked if the interference phase is not corrected [24,25].
In this study, the high-resolution tropospheric delay products provided by GACOS are used for atmospheric phase correction [26,27,28]. The GACOS system started global service in June 2017. Based on the high resolution atmospheric products from the European Center for Medium-Range Weather Forecasts (ECMWF), the GACOS system uses the iterative tropospheric decomposition (ITD) model to separate the stratified and turbulent signals from the tropospheric delay. Then the stratified and turbulent signals are spatially interpolated separately to obtain a high-resolution zenith tropospheric delay (ZTD) corrected image and generate the high spatial resolution ZTD map that can be used to calibrate the InSAR measurements and other applications [29,30]. The temporal resolution of the ZTD corrected image is in minutes and the spatial resolution is 90 m. ZTD is defined as:
where T denotes the turbulent component; is the site coordinate of location K in the local geocentric coordinate system; is the stratified component, with denoting the coefficient and denoting the height scale; is the component delay at the sea level; represents the remaining residuals, including stratification and turbulence signals. Using the ZTD data acquired on different dates, this study extracts the atmospheric delay data, which are then removed from the differential interferograms to increase the accuracy of surface displacement. In order to assess the effect of GACOS correction, standard deviation (STD) is introduced [28].
On the basis of the obtained high-precision surface displacement, we analyze the influence of some factors on surface displacement, including earthquake magnitude, focal depth and the distance from the epicenter to the fault. The results will help to understand small-magnitude earthquake displacement hazards and in post-earthquake hazard assessment.
4. Displacement Detection Based on GACOS InSAR
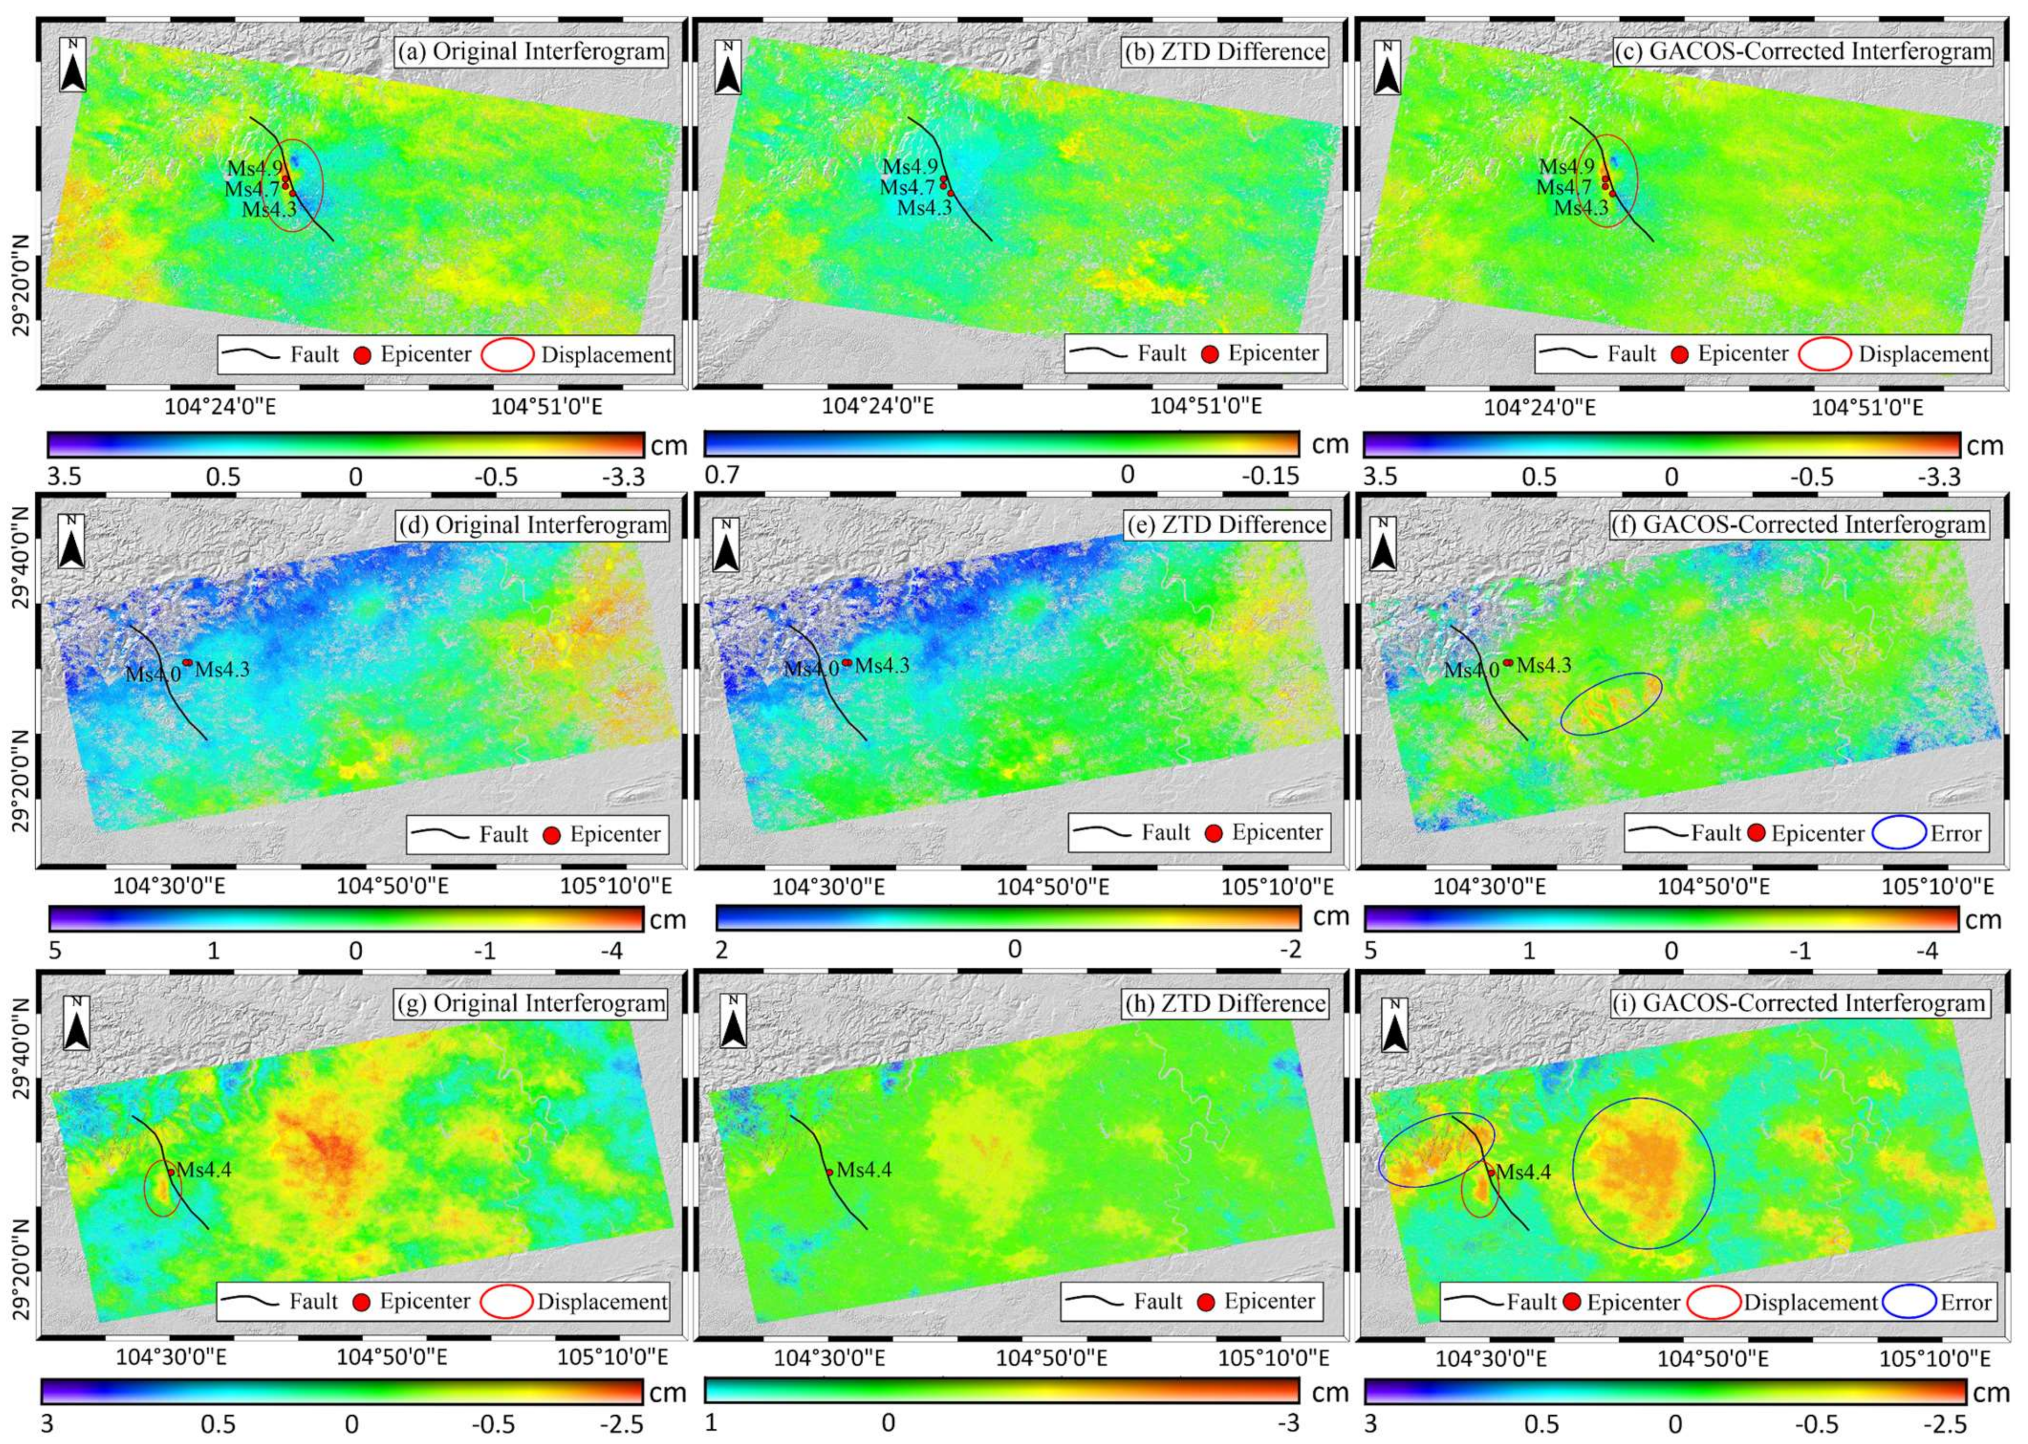
The displacement of the 31 small-magnitude earthquakes in the study area was measured by GACOS InSAR. Information on epicenters and faults [31,32] are introduced to further analyze the GACOS correction results. This paper generates the interferogram pairs 20190216–20190228, 20190901–20190913 and 20200204–20200216 to assess the correction effect of GACOS to the D-InSAR results.
As Figure 3a–c show, the noise in the study area is small and the coherence is good. During this period, an Mw 4.7 earthquake, an Mw 4.3 earthquake and an Mw 4.9 earthquake occurred, which caused obvious displacement. In the original interferogram (Figure 3a), the displacement signals are blurred, due to the serious atmospheric delay (Figure 3b), similar to that in the original interferogram, which is used to correct the original interferogram. After the correction, the displacement boundary (Figure 3c) is much clearer. The STD of the original interferogram is 0.61 cm, whereas it decreases to 0.40 cm after GACOS correction. The maximum displacement of this region is about 3.3 cm. The focal depths of the three earthquakes are all 5 km, and the epicenters are less than 1 km to the west of the fault. It should be noted that the surface displacement during this time span is the cumulative displacement of the three seismic activities, which is highly obvious.
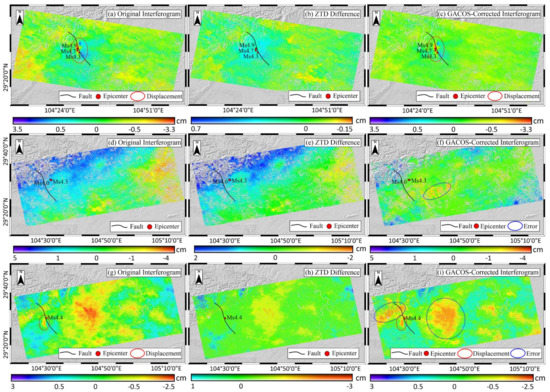
Figure 3.
The original, ZTD difference and GACOS corrected images of interferograms pair (a–c) 20190216–20190228 (d–f) 20190901–20190913 (g–i) 20200204–20200216.
In Figure 3d–f, the image of the study area is affected by vegetation, resulting in poor coherence. During the image time span, an Mw 4.3 and an Mw 4.0 earthquake occurred in the area. In the original interferogram, the displacement caused by these earthquakes is blurred. The STD of the original interferogram is 1.54 cm, and decreases to 0.63 cm after GACOS correction. The maximum displacement is about 4 cm, which obviously is caused by artifacts (circled in Figure 3f), as the area with maximum displacement is far away from the fault and epicenter. The focal depths of the Mw 4.3 and Mw 4 earthquakes are 7 km and 11 km, respectively, and epicenters are about 1 km to the east of the fault.
In Figure 3g–i, the images of the study area have good coherence. During the image time span, an Mw 4.4 earthquake occurred on 16 February 2020 in this area and caused obvious subsidence. The STD of the original interferogram is 0.45 cm, decreasing to 0.26 cm after GACOS correction, and the maximum displacement is about 2.5 cm. The focal depth is 10 km, and the epicenter is less than 1 km east of the fault. It should be noted that there are several areas with visible displacement marked with blue circle in Figure 3. Judging from the location and the displacement pattern, these are some residual errors (circled in the Figure 3f,i) in the D-InSAR processing, which are not counted as displacement for the earthquake.
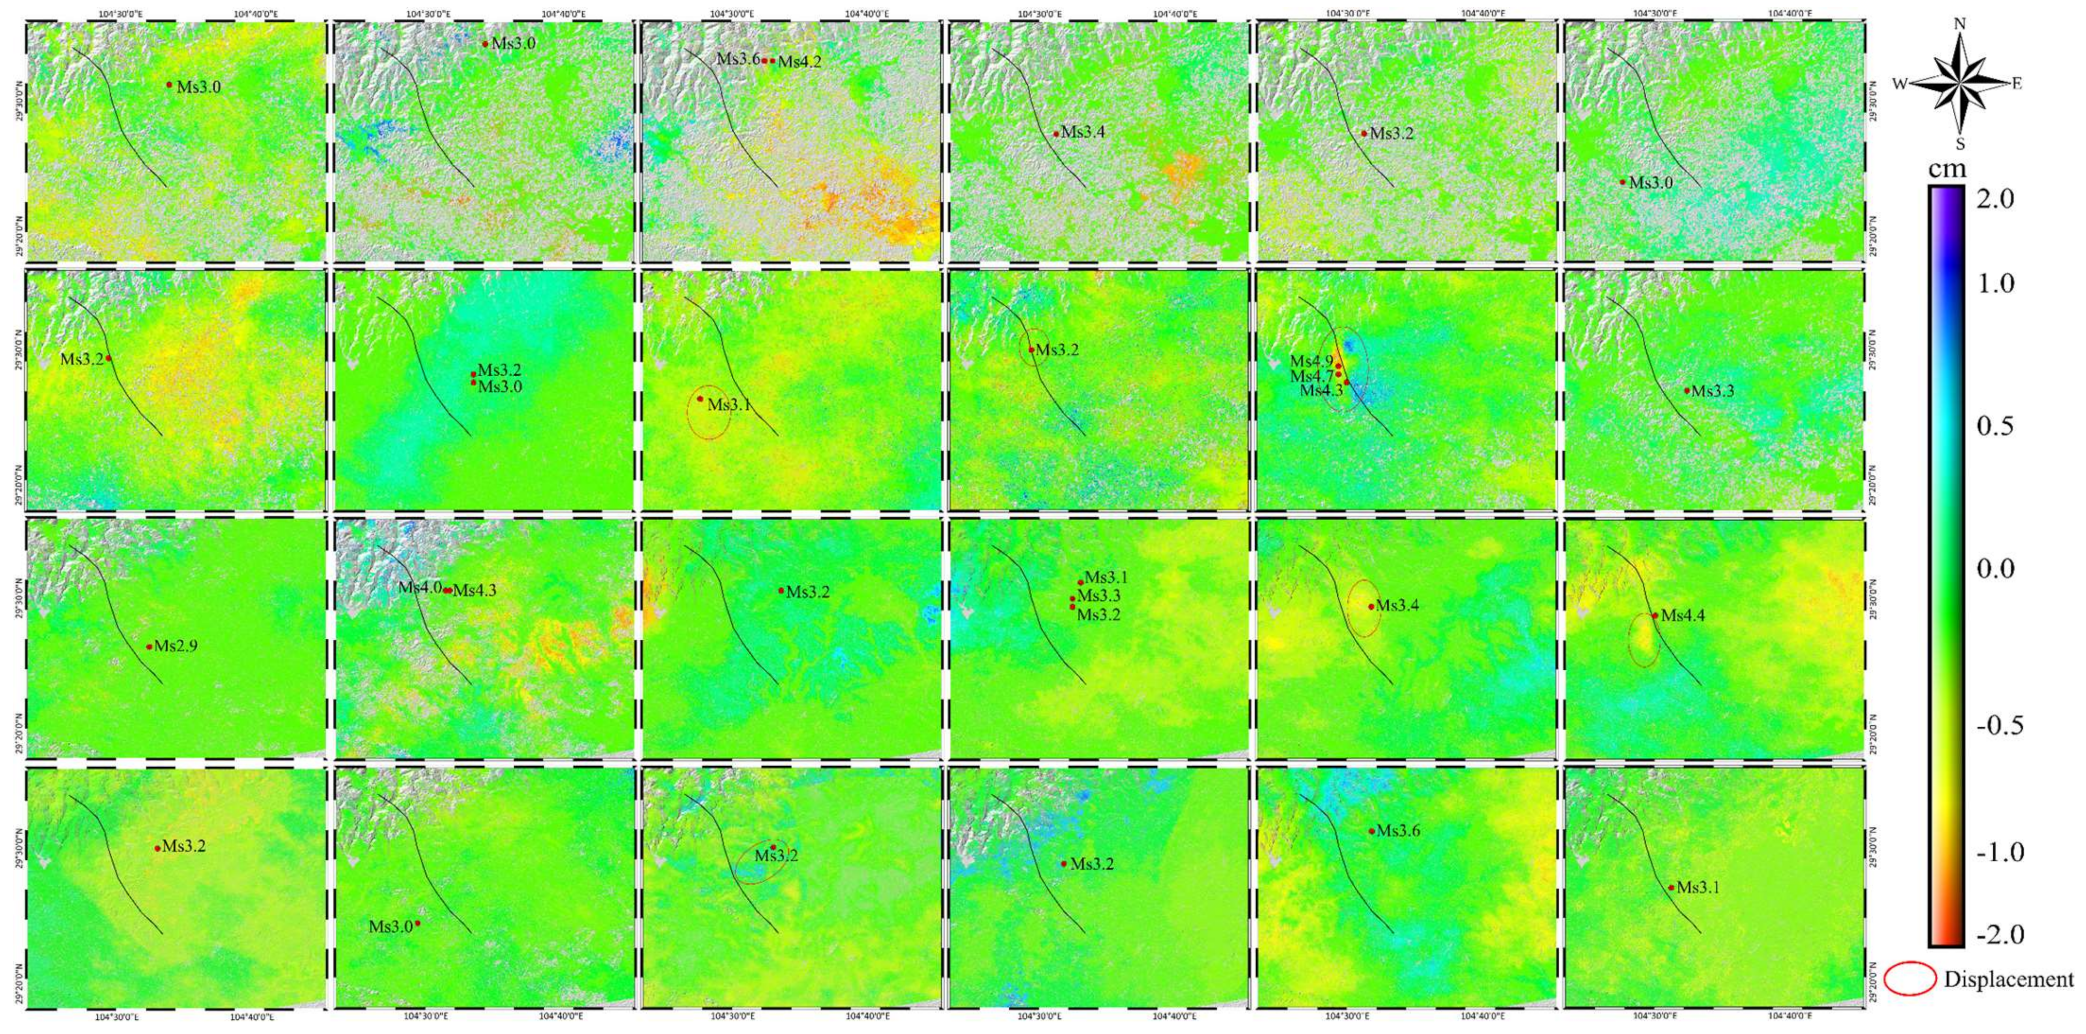
The analysis on the GACOS corrected displacements caused by all 31 earthquakes is as shown in Figure 4. After the GACOS atmospheric correction, most results have no obvious atmospheric delay. The coherence of the results in summer is significantly lower than that in autumn and winter, and there are some missing coherence points near the epicenters. The results for eight earthquakes show that obvious displacements of about 2 cm can be detected in and near the epicenters. This indicates that GACOS atmospheric correction can improve the accuracy of identifying and detecting the displacements caused by small-magnitude earthquakes.
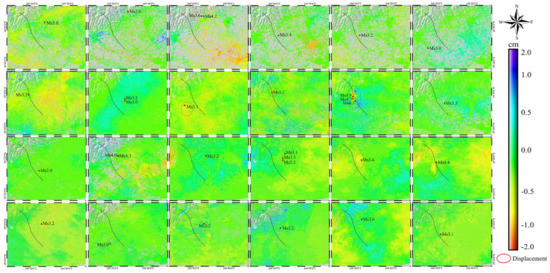
Figure 4.
Earthquake displacement results after GACOS correction. The black line denotes the location of the fault, and the red dots are the epicenters.
Figure 5 shows that the phase standard deviation after correction is significantly reduced compared with that before correction, indicating that GACOS has a significant effect in correcting the atmospheric delay in the area.
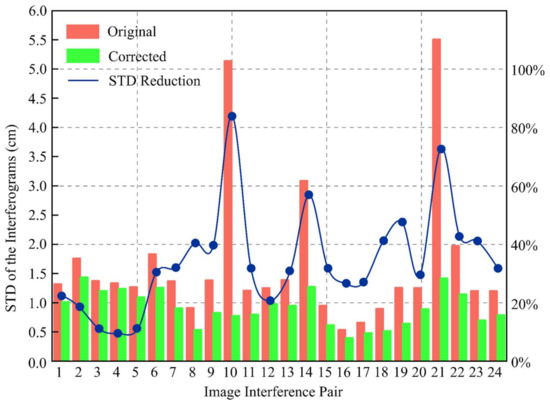
Figure 5.
Comparison of the standard deviation of the unwrapping phases before and after GACOS correction.
5. Discussion
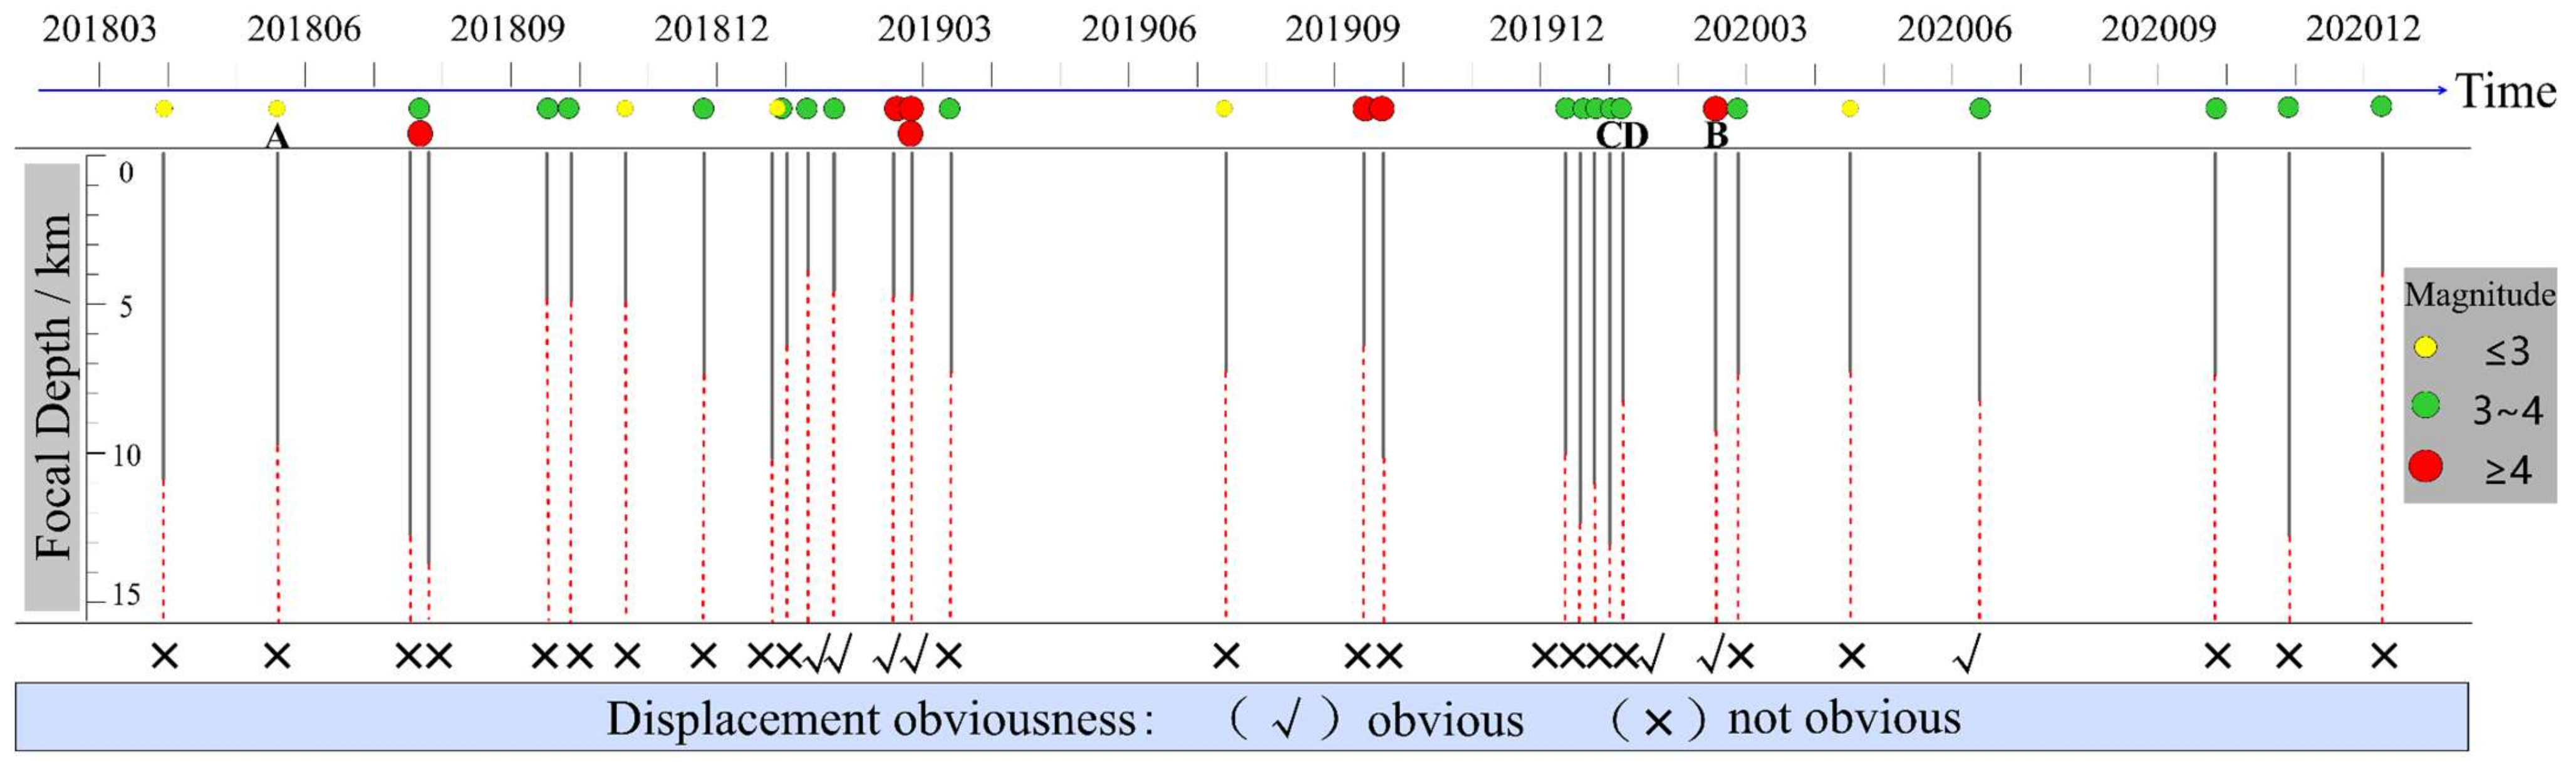
The earthquake magnitude, focal depth and earthquake occurrence time are shown in Figure 6. The focal depths of these earthquakes are all less than 15 km, and 7 of the 31 earthquakes have magnitudes larger than 4. The Mw > 4 earthquakes show obvious displacement in the results. It should be noted that earthquakes in 24 February 2019 (Mw 4.7), 25 February 2019 (Mw 4.3) and 25 February 2019 (Mw 4.9) are in an interferogram, therefore the results are displayed on one image; not all Mw < 4 events have visible displacements on InSAR data. There may be various reasons for this, not only depth, but also focal mechanism. In Figure 6, A and B are two earthquakes with the same focal depth but the magnitude of A is smaller than that of B. Thus, B has some deformation but A has no deformation. The comparative analysis shows that, when the focal depths are the same, the larger the magnitude, the more obvious the earthquake displacement. Besides, Earthquake C and D have the same magnitude, but the focal depth of C is larger than that of D. Thus, D has some deformation, but C has no deformation. So we conclude that when the magnitudes are the same, the shallower the focal depths the more obvious the earthquake displacement. The influence of distance from fault on deformation is not considered here.
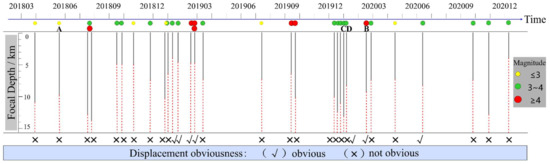
Figure 6.
Timeline of all earthquakes with information on surface displacements, earthquake magnitude, and focal depth.
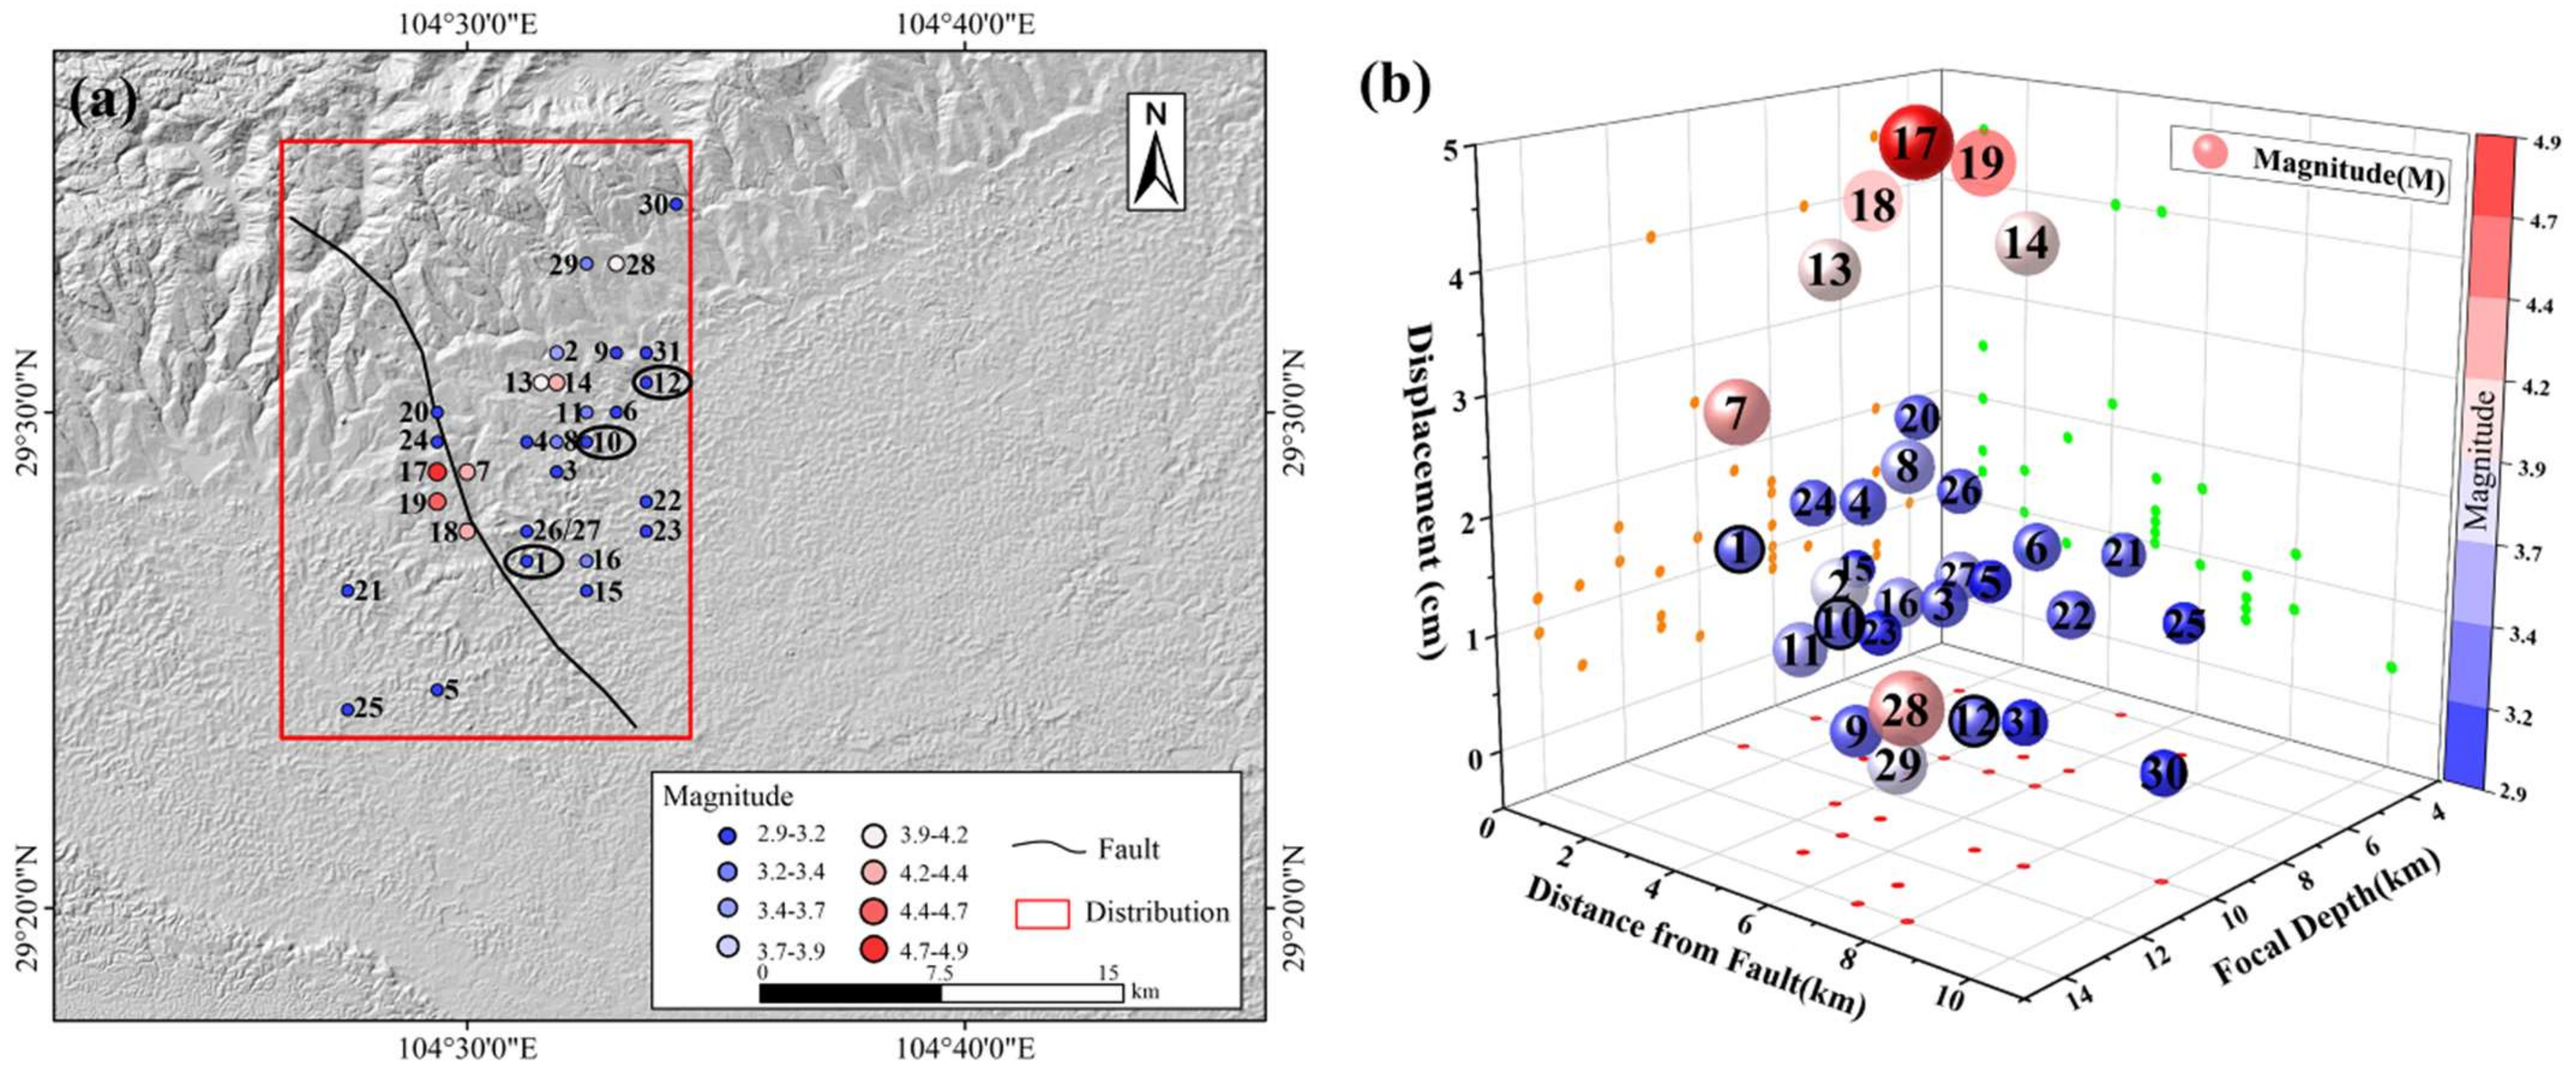
The displacement area and magnitude of the 20190216-20190228 image pairs are the biggest, because this was the largest earthquake (Mw 4.9) with a focal depth of 5 km. In addition, the displacement is scaled with the distance from the epicenter to the fault. In Figure 7, the magnitudes of earthquakes 1, 10 and 12 are all between 3.2 and 3.4, and the focal depths are 12 km, while their displacements are around 1.8 cm, 1.2 cm and 0.6 cm, respectively. Such difference is likely to result from the different distances from the epicenters to the fault. As earthquake 1 has minimum distance to fault, so the displacement is the largest. Therefore, the closer the epicenters to the fault, the larger the displacement.
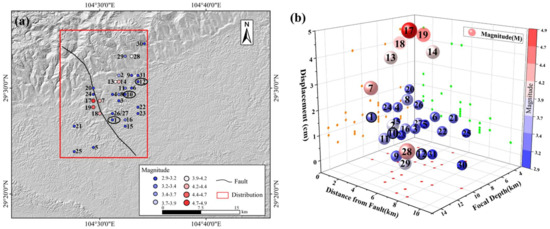
Figure 7.
(a) Earthquake spatial distribution; (b) the correlation between surface displacements, earthquake magnitude, focal depth and distance from fault.
There are some defects which need to be mentioned regarding this paper. As we excluded the obvious displacements from DInSAR artifacts in Figure 3, perhaps some of the displacements are disputable. This is because, in this case, the measurement accuracy of DInSAR is about 1 cm, even though we performed GACOS to help improve this, while the displacements caused by Mw < 4 earthquake are around 1–2 cm. It should be noted that in our study sometimes it is difficult to define the displacements clearly and definitely from earthquake or artifacts during processing. In the future, we need to continually improve the accuracy of DInSAR to acquire precise information in order to perform deep analysis and improve our understanding of small-magnitude earthquakes.
6. Conclusions
This paper uses the D-InSAR method integrated with GACOS atmospheric correction to extract the displacement of the small-magnitude earthquake cluster in Rong County between March 2018 and December 2020 from Sentinel-1 images. GACOS can correct the atmospheric delay, which improves the monitoring accuracy of surface displacement. The GACOS atmospheric correction method can mask atmospheric delays to improve the accuracy of the seismic displacement monitoring results.
Using the corrected results, and considering the focal depth and epicenter location, we analyze the surface displacement caused by small-magnitude earthquakes and fully explored the relationship among earthquake magnitude, displacement, focal depth and distance from fault. It was found that not all Mw < 4 events have visible displacements on InSAR data, while some displacement of the Mw > 4.0 earthquake can be clearly measured. Based on the measurement in this study, we found that distance of the epicenter from the known main active fault plays a role in observed displacement. The surface displacements are related to the earthquake magnitude, focal depth and the distance from the epicenters to the fault. The shallower the focal depth, the greater the earthquake magnitude; and the closer the fault to the epicenters, the more obvious the displacement. This information helps to understand the displacement hazard caused by small-magnitude earthquakes, in order to assist in post-earthquake disaster assessment and post-disaster rescue.
Author Contributions
Conceptualization, X.S. and K.D.; methodology, R.L., J.C. (Jianhua Cheng) and L.Z.; investigation, L.Z.; resources, L.Z. and X.S.; writing—original draft preparation, R.L.; writing—review and editing, L.Z., K.D. and X.S.; funding acquisition, L.Z. and J.C. (Junxing Cao). All authors have read and agreed to the published version of the manuscript.
Funding
This work was funded by the National Natural Science Foundation of China (41774192, 41801391), the State Key Laboratory of Geohazard Prevention and Geoenvironment Protection Independent Research Project (SKLGP2020Z012), and the Everest Scientific Project at Chengdu University of Technology (2020ZF114103).
Data Availability Statement
The Sentinel-1 SAR data can be found through Europe Space Agency (https://scihub.copernicus.eu/dhus/#/home). The ALOS digital elevation model (DEM) can be found in https://www.eorc.jaxa.jp/ALOS/en/aw3d30/data/index.htm.
Conflicts of Interest
The authors declare no conflict of interest.
References
- Yan, J.; Ye, Z.; Zheng, Y.; Shi, B. Investigation of Building Damage Characteristics and Human Casualties in Relation to the Ms4.7, Ms4.3, and Ms4.9 Earthquake Occurring in Rong County, Sichuan Province. China Earthq. Eng. J. 2020, 42, 1019–1023. [Google Scholar] [CrossRef]
- Moreira, A.; Prats-Iraola, P.; Younis, M.; Krieger, G.; Hajnsek, I.; Papathanassiou, K.P. A tutorial on synthetic aperture radar. IEEE Geosci. Remote Sens. Mag. 2013, 1, 6–43. [Google Scholar] [CrossRef] [Green Version]
- Moro, M.; Saroli, M.; Stramondo, S.; Bignami, C.; Albano, M.; Falcucci, E.; Gori, S.; Doglioni, C.; Polcari, M.; Tallini, M.; et al. New insights into earthquake precursors from InSAR. Sci. Rep. 2017, 7, 12035. [Google Scholar] [CrossRef] [PubMed] [Green Version]
- Béjar-Pizarro, M.; Álvarez Gómez, J.; Staller, A.; Luna, M.; Pérez-López, R.; Monserrat, O.; Chunga, K.; Lima, A.; Galve, J.; Martínez Díaz, J.; et al. InSAR-Based Mapping to Support Decision-Making after an Earthquake. Remote Sens. 2018, 10, 899. [Google Scholar] [CrossRef] [Green Version]
- Pritchard, M.E.; Biggs, J.; Wauthier, C.; Sansosti, E.; Arnold, D.W.D.; Delgado, F.; Ebmeier, S.K.; Henderson, S.T.; Stephens, K.; Cooper, C.; et al. Towards coordinated regional multi-satellite InSAR volcano observations: Results from the Latin America pilot project. J. Appl. Volcanol. 2018, 7, 5. [Google Scholar] [CrossRef]
- Garthwaite, M.C.; Miller, V.L.; Saunders, S.; Parks, M.M.; Hu, G.; Parker, A.L. A Simplified Approach to Operational InSAR Monitoring of Volcano Deformation in Low- and Middle-Income Countries: Case Study of Rabaul Caldera, Papua New Guinea. Front. Earth Sci. 2019, 6, 240. [Google Scholar] [CrossRef]
- Dai, K.; Li, Z.; Xu, Q.; Bürgmann, R.; Milledge, D.G.; Tomas, R.; Fan, X.; Zhao, C.; Liu, X.; Peng, J.; et al. Entering the era of Earth-Observation based landslide warning system. IEEE Geosci. Remote Sens. Mag. 2020, 8, 136–153. [Google Scholar] [CrossRef] [Green Version]
- Dai, K.; Li, Z.; Tomás, R.; Liu, G.; Yu, B.; Wang, X.; Cheng, H.; Chen, J.; Stockamp, J. Monitoring activity at the Daguangbao mega-landslide (China) using Sentinel-1 TOPS time series interferometry. Remote Sens. Environ. 2016, 186, 501–513. [Google Scholar] [CrossRef] [Green Version]
- Gao, M.; Gong, H.; Chen, B.; Li, X.; Zhou, C.; Shi, M.; Si, Y.; Chen, Z.; Duan, G. Regional Land Subsidence Analysis in Eastern Beijing Plain by InSAR Time Series and Wavelet Transforms. Remote Sens. 2018, 10, 365. [Google Scholar] [CrossRef] [Green Version]
- Zhang, Y.; Liu, Y.; Jin, M.; Jing, Y.; Liu, Y.; Liu, Y.; Sun, W.; Wei, J.; Chen, Y. Monitoring Land Subsidence in Wuhan City (China) using the SBAS-InSAR Method with Radarsat-2 Imagery Data. Sensors 2019, 19, 743. [Google Scholar] [CrossRef] [Green Version]
- Ganas, A.; Elias, P.; Briole, P.; Cannavo, F.; Valkaniotis, S.; Tsironi, V.; Partheniou, E.I. Ground Deformation and Seismic Fault Model of the M6.4 Durres (Albania) Nov. 26, 2019 Earthquake, Based on GNSS/INSAR Observations. Geosciences 2020, 10, 210. [Google Scholar] [CrossRef]
- Valkaniotis, S.; Briole, P.; Ganas, A.; Elias, P.; Kapetanidis, V.; Tsironi, V.; Fokaefs, A.; Partheniou, H.; Paschos, P. The Mw = 5.6 Kanallaki Earthquake of 21 March 2020 in West Epirus, Greece: Reverse Fault Model from InSAR Data and Seismotectonic Implications for Apulia-Eurasia Collision. Geosciences 2020, 10, 454. [Google Scholar] [CrossRef]
- Shen, Z.-K.; Sun, J.; Zhang, P.; Wan, Y.; Wang, M.; Bürgmann, R.; Zeng, Y.; Gan, W.; Liao, H.; Wang, Q. Slip maxima at fault junctions and rupturing of barriers during the 2008 Wenchuan earthquake. Nat. Geosci. 2009, 2, 718–724. [Google Scholar] [CrossRef]
- Qu, C.; Shan, X.; Zuo, R.; Zhang, G.; Liu, Y. An integrated study on the coseismic and post-seismic deformation of the 2010 Yushu earthquake based on InSAR analysis. J. Earth Syst. Sci. 2019, 128, 46. [Google Scholar] [CrossRef] [Green Version]
- Magen, Y.; Ziv, A.; Inbal, A.; Baer, G.; Hollingsworth, J. Fault Rerupture during the July 2019 Ridgecrest Earthquake Pair from Joint Slip Inversion of InSAR, Optical Imagery, and GPS. Bull. Seismol. Soc. Am. 2020, 110, 1627–1643. [Google Scholar] [CrossRef]
- Yang, C.; Han, B.; Zhao, C.; Du, J.; Zhang, D.; Zhu, S. Co- and post-seismic Deformation Mechanisms of the MW 7.3 Iran Earthquake (2017) Revealed by Sentinel-1 InSAR Observations. Remote Sens. 2019, 11, 418. [Google Scholar] [CrossRef] [Green Version]
- Albano, M.; Saroli, M.; Montuori, A.; Bignami, C.; Tolomei, C.; Polcari, M.; Pezzo, G.; Moro, M.; Atzori, S.; Stramondo, S.; et al. The Relationship between InSAR Coseismic Deformation and Earthquake-Induced Landslides Associated with the 2017 Mw 3.9 Ischia (Italy) Earthquake. Geosciences 2018, 8, 303. [Google Scholar] [CrossRef] [Green Version]
- Wang, S.; Zhang, Y.; Wang, Y.; Jiao, J.; Ji, Z.; Han, M. Post-seismic deformation mechanism of the July 2015 MW 6.5 Pishan earthquake revealed by Sentinel-1A InSAR observation. Sci. Rep. 2020, 10, 18536. [Google Scholar] [CrossRef]
- Vajedian, S.; Motagh, M.; Mousavi, Z.; Motaghi, K.; Fielding, E.; Akbari, B.; Wetzel, H.-U.; Darabi, A. Coseismic Deformation Field of the Mw 7.3 12 November 2017 Sarpol-e Zahab (Iran) Earthquake: A Decoupling Horizon in the Northern Zagros Mountains Inferred from InSAR Observations. Remote Sens. 2018, 10, 1589. [Google Scholar] [CrossRef] [Green Version]
- Wen, Y.; Xiao, Z.; He, P.; Zang, J.; Liu, Y.; Xu, C. Source Characteristics of the 2020 Mw 7.4 Oaxaca, Mexico, Earthquake Estimated from GPS, InSAR, and Teleseismic Waveforms. Seismol. Res. Lett. 2021, 92, 1900–1912. [Google Scholar] [CrossRef]
- Sichuan Geological Bureau. Regional Survey Report (Suining, Zigong, Neijiang, Yibin, Luzhou); Sichuan Geological Bureau: Chengdu, China, 1980. [Google Scholar]
- Fan, H.; Cheng, D.; Deng, K.; Chen, B.; Zhu, C. Subsidence monitoring using D-InSAR and probability integral prediction modelling in deep mining areas. Surv. Rev. 2015, 47, 438–445. [Google Scholar] [CrossRef]
- Suganthi, S.; Elango, L.; Subramanian, S.K. Microwave D-InSAR technique for assessment of land subsidence in Kolkata city, India. Arab. J. Geosci. 2017, 10, 458. [Google Scholar] [CrossRef]
- Wei, J.; Li, Z.; Hu, J.; Feng, G.; Duan, M. Anisotropy of atmospheric delay in InSAR and its effect on InSAR atmospheric correction. J. Geod. 2018, 93, 241–265. [Google Scholar] [CrossRef]
- Penney, C.; Tavakoli, F.; Saadat, A.; Nankali, H.R.; Sedighi, M.; Khorrami, F.; Sobouti, F.; Rafi, Z.; Copley, A.; Jackson, J.; et al. Megathrust and accretionary wedge properties and behaviour in the Makran subduction zone. Geophys. J. Int. 2017, 209, 1800–1830. [Google Scholar] [CrossRef]
- Zebker, H.A.; Rosen, P.A.; Hensley, S. Atmospheric effects in interferometric synthetic aperture radar surface deformation and topographic maps. J. Geophys. Res. Solid Earth 1997, 102, 7547–7563. [Google Scholar] [CrossRef]
- Xiao, R.; Yu, C.; Li, Z.; Song, C.; He, X. General Survey of Large-scale Land Subsidence by GACOS-Corrected InSAR Stacking: Case Study in North China Plain. Proc. Int. Assoc. Hydrol. Sci. 2020, 382, 213–218. [Google Scholar] [CrossRef] [Green Version]
- Xiao, R.; Yu, C.; Li, Z.; He, X. Statistical assessment metrics for InSAR atmospheric correction: Applications to generic atmospheric correction online service for InSAR (GACOS) in Eastern China. Int. J. Appl. Earth Obs. Geoinf. 2021, 96, 102289. [Google Scholar] [CrossRef]
- Yu, C.; Li, Z.; Chen, J.; Hu, J.-C. Small Magnitude Co-Seismic Deformation of the 2017 Mw 6.4 Nyingchi Earthquake Revealed by InSAR Measurements with Atmospheric Correction. Remote Sens. 2018, 10, 684. [Google Scholar] [CrossRef] [Green Version]
- Shen, L.; Hooper, A.; Elliott, J. A Spatially Varying Scaling Method for InSAR Tropospheric Corrections Using a High-Resolution Weather Model. J. Geophys. Res. Solid Earth 2019, 124, 4051–4068. [Google Scholar] [CrossRef] [Green Version]
- Yi, G.; Long, F.; Liang, M.; Zhao, M.; Wang, S. Geometry and tectonic deformation of seismogenic structures in the Rongxian-Weiyuan-Zizhong region, Sichuan Basin: Insights from focal mechanism solution. Chin. J. Geophys. 2020, 63, 3275–3291. [Google Scholar] [CrossRef]
- China Earthquake Network Center. Rongxian Earthquake. Available online: http://www.scdzj.gov.cn/xwzx/qqzx/20200-2/t2020021644270.html (accessed on 8 December 2020).


Publisher’s Note: MDPI stays neutral with regard to jurisdictional claims in published maps and institutional affiliations. |
© 2021 by the authors. Licensee MDPI, Basel, Switzerland. This article is an open access article distributed under the terms and conditions of the Creative Commons Attribution (CC BY) license (https://creativecommons.org/licenses/by/4.0/).