Article

Evaluation of Reanalysis Datasets for Solar Radiation with In Situ Observations at a Location over the Gobi Region of Xinjiang, China

1
Institute of Desert Meteorology, China Meteorological Administration, Urumqi 830002, China
2
Taklimakan Desert Meteorology Field Experiment Station of CMA, Urumqi 830002, China
3
National Observation and Research Station of Desert Meteorology, Taklimakan Desert of Xinjiang/Xinjiang Key Laboratory of Desert Meteorology and Sandstorm, Urumqi 830002, China
4
Key Laboratory of Tree-Ring Physical and Chemical Research, China Meteorological Administration, Urumqi 830002, China
5
Newsroom of Xinjiang Meteorological Bureau, Urumqi 830002, China
6
Meteorological Service Center of Hami Meteorological Bureau, Hami 839000, China
7
Minfeng County Meteorological Bureau, Minfeng 838500, China
*
Author to whom correspondence should be addressed.
Remote Sens. 2021, 13(21), 4191; https://doi.org/10.3390/rs13214191
Submission received: 13 September 2021 / Revised: 13 October 2021 / Accepted: 14 October 2021 / Published: 20 October 2021

Abstract

:
Solar radiation is the most important source of energy on the Earth. The Gobi area in the eastern Xinjiang region, due to its geographic location and climate characteristics, has abundant solar energy resources. In order to provide detailed scientific data supporting solar energy development in this area, we used ground-based data to evaluate the applicability of the five reanalysis data sources: the Clouds and the Earth’s Radiant Energy System (CERES), the European Center for Medium-Range Weather Forecasts Reanalysis version 5 (ERA5), the Modern-Era Retrospective Analysis for Research and Applications version 2 (MERRA2), and the Japanese 55-year Reanalysis (JRA-55). Our results indicated that the CERES data show underestimated short-wave radiation and overestimated long-wave radiation. The correlation coefficients (r) between the ERA5 dataset and the net long-wave and short-wave radiation in observation were 0.92 and 0.91, respectively, and the r between the MERRA2 dataset and the net long-wave and short-wave radiation in observation were both 0.88. The JRA-55 dataset overestimated the long-wave radiation flux and underestimated the short-wave radiation flux. The clearness index (kt) of all datasets was poor during autumn and winter, the ERA5 estimates were cloudy when the actual condition was sunny, while the JRA-55 estimates were sunny when the actual condition was cloudy. Overall, the radiation flux in the ERA5 dataset had the highest applicability in the Gobi region.

1. Introduction

Solar radiation is the main energy source for all atmospheric physical processes on Earth and it influences the climate and weather [1]. Accurate estimation of surface solar radiation is essential for studying solar energy resources, hydrological processes, and climate change [2]. In early studies, scholars used solar radiation data directly from surface observation stations to conduct experiments and studies. Zha et al. [3] analyzed the spatial -temporal variations in surface solar radiation in China from 1957 to 1992 by using the solar radiation data from 58 surface stations. The results showed that since 1972, the total amount of surface solar radiation in China has decreased due to an increase in aerosol concentration. Zhou et al. [4] analyzed the abundance, utilization value, and stability of solar energy in the five provinces in Northwest China based on the total solar radiation and sunshine hours from the surface weather stations and provided a theoretical reference for the full utilization of solar resources in Northwest China. The specific geographical location and climatic conditions make the Northwest Gobi region abundant in solar energy resources. The annual sunshine hours in this region are from 2550 to 3500 h and the sunshine percentage is 60–80%, ranking second in the country [5,6].
However, traditional ground-based observation stations are rare and unevenly distributed. Thus, traditional methods have a limited ability to obtain spatially continuous and long-term surface solar radiation observation data [7]. The development of remote sensing satellite technology has well addressed this problem. Jia et al. [8] evaluated satellite and reanalysis products of downward surface solar radiation over East Asia and found that the representation of clouds and aerosols in the FY-2C retrieval algorithm need to be improved. Pang et al. [9] used the CERES Single Scanner Footprint (SSF) Aqua Moderate-resolution Imaging Spectral Pyranometer Edition 3A data to obtain the spatial-temporal distribution characteristics of surface downward short-wave radiation in Xinjiang over the past 13 years. Yan et al. [10] verified the applicability of Terra/Aqua FLASH Flux SSF flux products in the Loess Plateau by using surface observation data. To meet the needs of modern climate change research, relevant institutions in the United States, the European Union, Japan, and other countries and regions have successively released several reanalysis datasets [11]. These datasets have worldwide spatial coverage, long time series, and low costs, making them popular with many users [12]. Zhao et al. [13] used a series of early reanalysis data to compare and evaluate the data application in China and verified different reanalysis data in different regions of China. With the continuous updates to reanalysis data, the accuracy of the new generation of reanalysis datasets has improved. Zhang et al. [14] evaluated the wind speed data of the National Centers for Environmental Prediction and the National Center for Atmospheric Research Reanalysis (NCEP/NCAR), the Japanese 55-year Reanalysis (JRA-55), and the European Center for Medium-Range Weather Forecasts (ECMWF) Reanalysis Interim (ERA-Interim) in China. After comparison, it was found that JRA-55 exhibited the best applicability. Sianturi et al. [15] quantified the deviation of irradiance in Indonesia using the ECMWF Reanalysis version 5 (ERA5) and the Modern-Era Retrospective Analysis for Research and Applications version 2 (MERRA2) based on the observed solar irradiance and concluded that the accuracy of ERA5 in the area is higher.
The Gobi region accounts for about 6.9% of the total land area in China, covering approximately 661,000 km2 [16]. The desert and Gobi areas are extensive in the arid zone of Northwest China. In a large land surface unit, like the Gobi and its surrounding oasis, the water vapor and energy exchange have an important impact on the local atmospheric circulation and microclimate [17,18]. The Gobi area, especially the Black Gobi area, is a geographical unit rich in solar and wind energy resources. To provide detailed scientific data supporting solar energy development in this area, we used ground-based data to evaluate the applicability of the five reanalysis data sources. Therefore, taking one station in the eastern Gobi region as a typical example, we investigated the radiation characteristics of the Gobi region by using in situ observation data and reanalysis data. We attempted to find the optimal reanalysis data set most suited for application in the Gobi area, which could be utilized for the development and utilization of solar resources in the region.

2. Data and Method

2.1. The Study Area

The Gobi area (Figure 1) is located to the east of Hami, Xinjiang, and is a geographical unit rich in solar energy resources [19]. The soil of this region is underdeveloped, with a vegetation coverage rate of only 10% [20]. The annual average temperature of Black Gobi is 6.1 °C, the extreme maximum temperature is 40.6 °C, the minimum temperature is −35.1 °C, and the annual average precipitation is 50.9 mm [21].

2.2. Surface Observation Data

To study the land–atmosphere interaction in the Black Gobi area, the Institute of Desert Meteorology, China Meteorological Administration had established a land–atmospheric interaction observation station in Hongliuhe Gobi in May 2016 (hereafter HLH). The HLH station (41°32′ N, 94°43.8′ E, at 1579 m above sea level) includes a 35 m gradient tower observation system, eddy covariance system, and solar radiation observation system. The solar radiation observation system includes a pyranometer (SR20, Hukseflux, The Netherlands) for measuring downward short-wave solar radiation, upward short-wave solar radiation, and scatter solar radiation, pyrgeometers (IR20, Hukseflux, The Netherlands) for measuring downward and upward infrared radiation, and pyrheliometers (DR02, Hukseflux, The Netherlands) for measuring direct solar radiation. In addition, it is also equipped with sun trackers (STR-22G, EKO, Japan), UV radiometer (UVS-AB-T, Kipp&Zonen, The Netherlands), net radiometer (NR01, Hukseflux, The Netherlands), and sunshine duration sensors (CSD3, Kipp&Zonen, The Netherlands). The data from these sensors are recorded continuously by a data logger (CR6, Campbell, CA, USA) at 1 Hz intervals and averaged at 10 s, 1 min, 20 min, 1 h, and 1 d intervals. Excluding the evident outliers in the measured data, the total solar radiation was less than 20 W·m−2 and the corresponding reflected short-wave radiation. In the calculation of the average value, short-wave radiation is the daytime average, while long-wave radiation and net radiation are the whole day averages. The observation data used in this study is for the year 2018, but more than 2/3 of the long-wave radiation data from 19 May to 22 June 2018 were missing; hence it was excluded.

2.3. Satellite Data

The CERES satellite data were obtained from the Atmospheric Science Data Center of the National Aeronautics and Space Administration Langley Research Center (http://ceres.larc.nasa.gov/ (accessed on 12 September 2021)) with a temporal resolution of 1 h and a spatial resolution of 1°. This dataset provided the monthly, 3 h, and 1 h averaged direct and scattered radiation, ultraviolet, short-wave and long-wave fluxes, albedo products, aerosol optical thickness, cloud optical thickness, ozone, and other auxiliary parameters. The detailed instructions can be found on the official website.

2.4. Reanalysis Dataset

The ERA5 is a fifth-generation atmospheric reanalysis of the global climate from the ECMWF (https://cds.climate.copernicus.eu/cdsapp#!/dataset/reanalysis-era5 (accessed on 12 September 2021)), covering the hourly meteorological data of the atmosphere, land, and ocean around the world from 1979 to the present day, with a spatial resolution of 0.25° * 0.25°. It uses a more advanced four-dimensional vibrational (4D-Var) assimilation method to provide higher-resolution data [22]. In this study, the net long-wave and short-wave radiation flux data of the ERA5 in 2018 were used.
The MERRA2 provides the global atmospheric reanalysis data from 1980, with a temporal resolution of 1 h and spatial resolution of 0.625° * 0.5° (https://gmao.gsfc.nasa.gov/reanalysis/MERRA-2/ (accessed on 12 September 2021)). It uses an upgraded version of the fifth edition of the Goddard Earth Observation System Model data assimilation system to replace the original MERRA reanalysis data and uses bilinear interpolation to spatially interpolate abundant global meteorological variables [23].
The JRA-55 is a new-generation reanalysis dataset provided by the Japan Meteorological Agency based on the JRA-25 (https://jra.kishou.go.jp/JRA-55/index_en.html (accessed on 12 September 2021)). It is the first comprehensive reanalysis dataset to apply the 4D-Var assimilation method since the ECMWF 45-year reanalysis. The JRA-55 includes the global reanalysis data for half a century since 1958 with a spatial resolution of 1.25°. The temporal resolution of the prediction dataset and the observation dataset are 3 h and 6 h, respectively. The detection data used include conventional data and remote sensing data. The upward and downward long and short radiation flux data used in this study were the prediction datasets with a temporal resolution of 3 h. The detailed information can be found in the user manual of the JRA-55 product.

2.5. Data Processing

Before the calculation, the evident outliers such as the short-wave radiation at night, albedo higher than 0.85, garbled or missing data, and decimal point drift were removed. Then the net radiometer was used to interpolate and complete the long-term continuous missing data to ensure data continuity. The daily average observation data was calculated by using the surface observation radiation data with an interval of 30 min at the HLH station in 2018. The daily average data of the CERES, ERA5, and MERRA2 were calculated from the hourly data, and the zero values were removed in the short-wave radiation. When evaluating the accuracy of the JRA-55 radiation data, the 3 h average of surface data was calculated because of its temporal resolution (3 h). Due to instrument malfunction, the long-wave radiation data for a total of 35 d from 19 May to 22 June were garbled, and thus, they were excluded. To test the reliability of the satellite and reanalysis data, we evaluated the correlation between the two different data and observations by calculating their correlation coefficients (r) with the observation data. We also conducted a significance test at a significance level of 0.01. The mean bias (MB) was used to measure the difference between the estimated and observed data and the root mean square error (RMSE) represented the degree of dispersion between estimation and observation. The relative mean bias (rMB) was used to quantify the difference between estimation and observation, and to reflect the credibility of the estimated data with better accuracy [24].
To match the data under different cloud conditions and cloud coverage, we used the cloud area fraction (CAF) parameter in the CERES product to classify the satellite data. CAF < 20% was set as sunny days, 30% < CAF < 50% was partly cloudy, 60% < CAF < 80% was cloudy, and CAF > 80% was overcast [25].
r = i = 1 n ( F e i F e i ¯ ) ( F O i F O i ¯ ) i = 1 n ( F e i F e i ¯ ) 2 i = 1 n ( F O i F O i ¯ ) 2
M B = 1 n i = 1 n ( F O i F e i )
R M S E = 1 n i = 1 n ( F O i F e i ) 2
r M B = M B F O ¯
a l b e d o = U S W D S W
where FO is the surface observed data, Fe is the estimated data set, USW is the surface upward short-wave radiation, and DSW is the surface downward short-wave radiation. Similarly, the surface upward long-wave radiation and downward long-wave radiation are abbreviated as ULW and DLW, respectively.
The clearness index (kt) is an important parameter used to evaluate the accuracy of datasets to predict the cloud fraction of solar radiation. The kt is the ratio of the total solar radiation S (W·m−2) received by the Earth’s surface at a certain solar altitude angle to the total solar radiation Se (W·m−2) received above the atmosphere parallel to the Earth’s surface [26]. The clearness index can be used to measure cloud attenuation and the effects of surface albedo [27]. Cloud fraction and aerosol are important factors in predicting solar radiation, and thus, kt is often used to assess the performance of the model [28]. Based on the values of kt, we defined clear sky days (kt > 0.7) and cloudy days (0.7 < kt < 0.3).
k t = S S e
S e = S s c [ 1 + 0.033 c o s ( 360 t d / 365 ) ] s i n β
where Ssc is the solar constant (1370 W·m−2), td is the day number, and β is the solar altitude angle. This index reflects the impact of cloudiness variation on solar radiation: values close to zero indicate cloudy conditions and little solar radiation, while values close to one indicate clear sky conditions with no clouds and strong solar radiation.
Because of their simplicity and low computational cost, bias correction methods are often used in climate research as global climate model simulation datasets increase [29,30]. With the deepening of research [31,32,33], different methods are widely being used in post-processing climate predictions [34,35]. Among them, linear adaptive bias correction is a well-known method that can adjust the model to obtain radiation data according to the measured data of stations. The method eliminates bias by using the slope (c) and gradient (m) of the best-fitting equation ( y d = m x g + c ) between the measured radiation and radiation from the reanalysis datasets. The zero-bias correction time series was calculated using Equation (8), where, ycd, yd, and xg represent the corrected radiation of the reanalysis datasets, radiation of datasets, and observed radiation, respectively.
  y c d = y d [ ( m 1 ) x g + c ]

3. Results

3.1. Conventional Analysis of Radiation

The annual variations in monthly average data for each radiation component in 2018 are shown in Figure 2. The annual variations are distributed in an inverted “U” shape. The ranking of the overall radiation intensities was DSW > ULW > DLW > USW. The DSW was the largest in May and the smallest in December, with a peak value of 1104.30 W·m−2. The distribution range of USW was relatively small, and it was the highest in December, with the maximum value occurring on 9 February (484.96 W·m−2). This is because the surface is covered with snow during winter, during which the surface albedo is high. The annual variation in the monthly averaged ULW was similar to that of DSW. According to the existing data, they were the highest in July and the lowest in December as both are closely related to the surface temperature. DLW is mainly related to the atmospheric state. According to the weather phenomenon records at the HLH station, the sky cloud cover is relatively large in summer (June, July, and August) in this area, s; therefore, in summer, the DLW is high and the DSW is low.

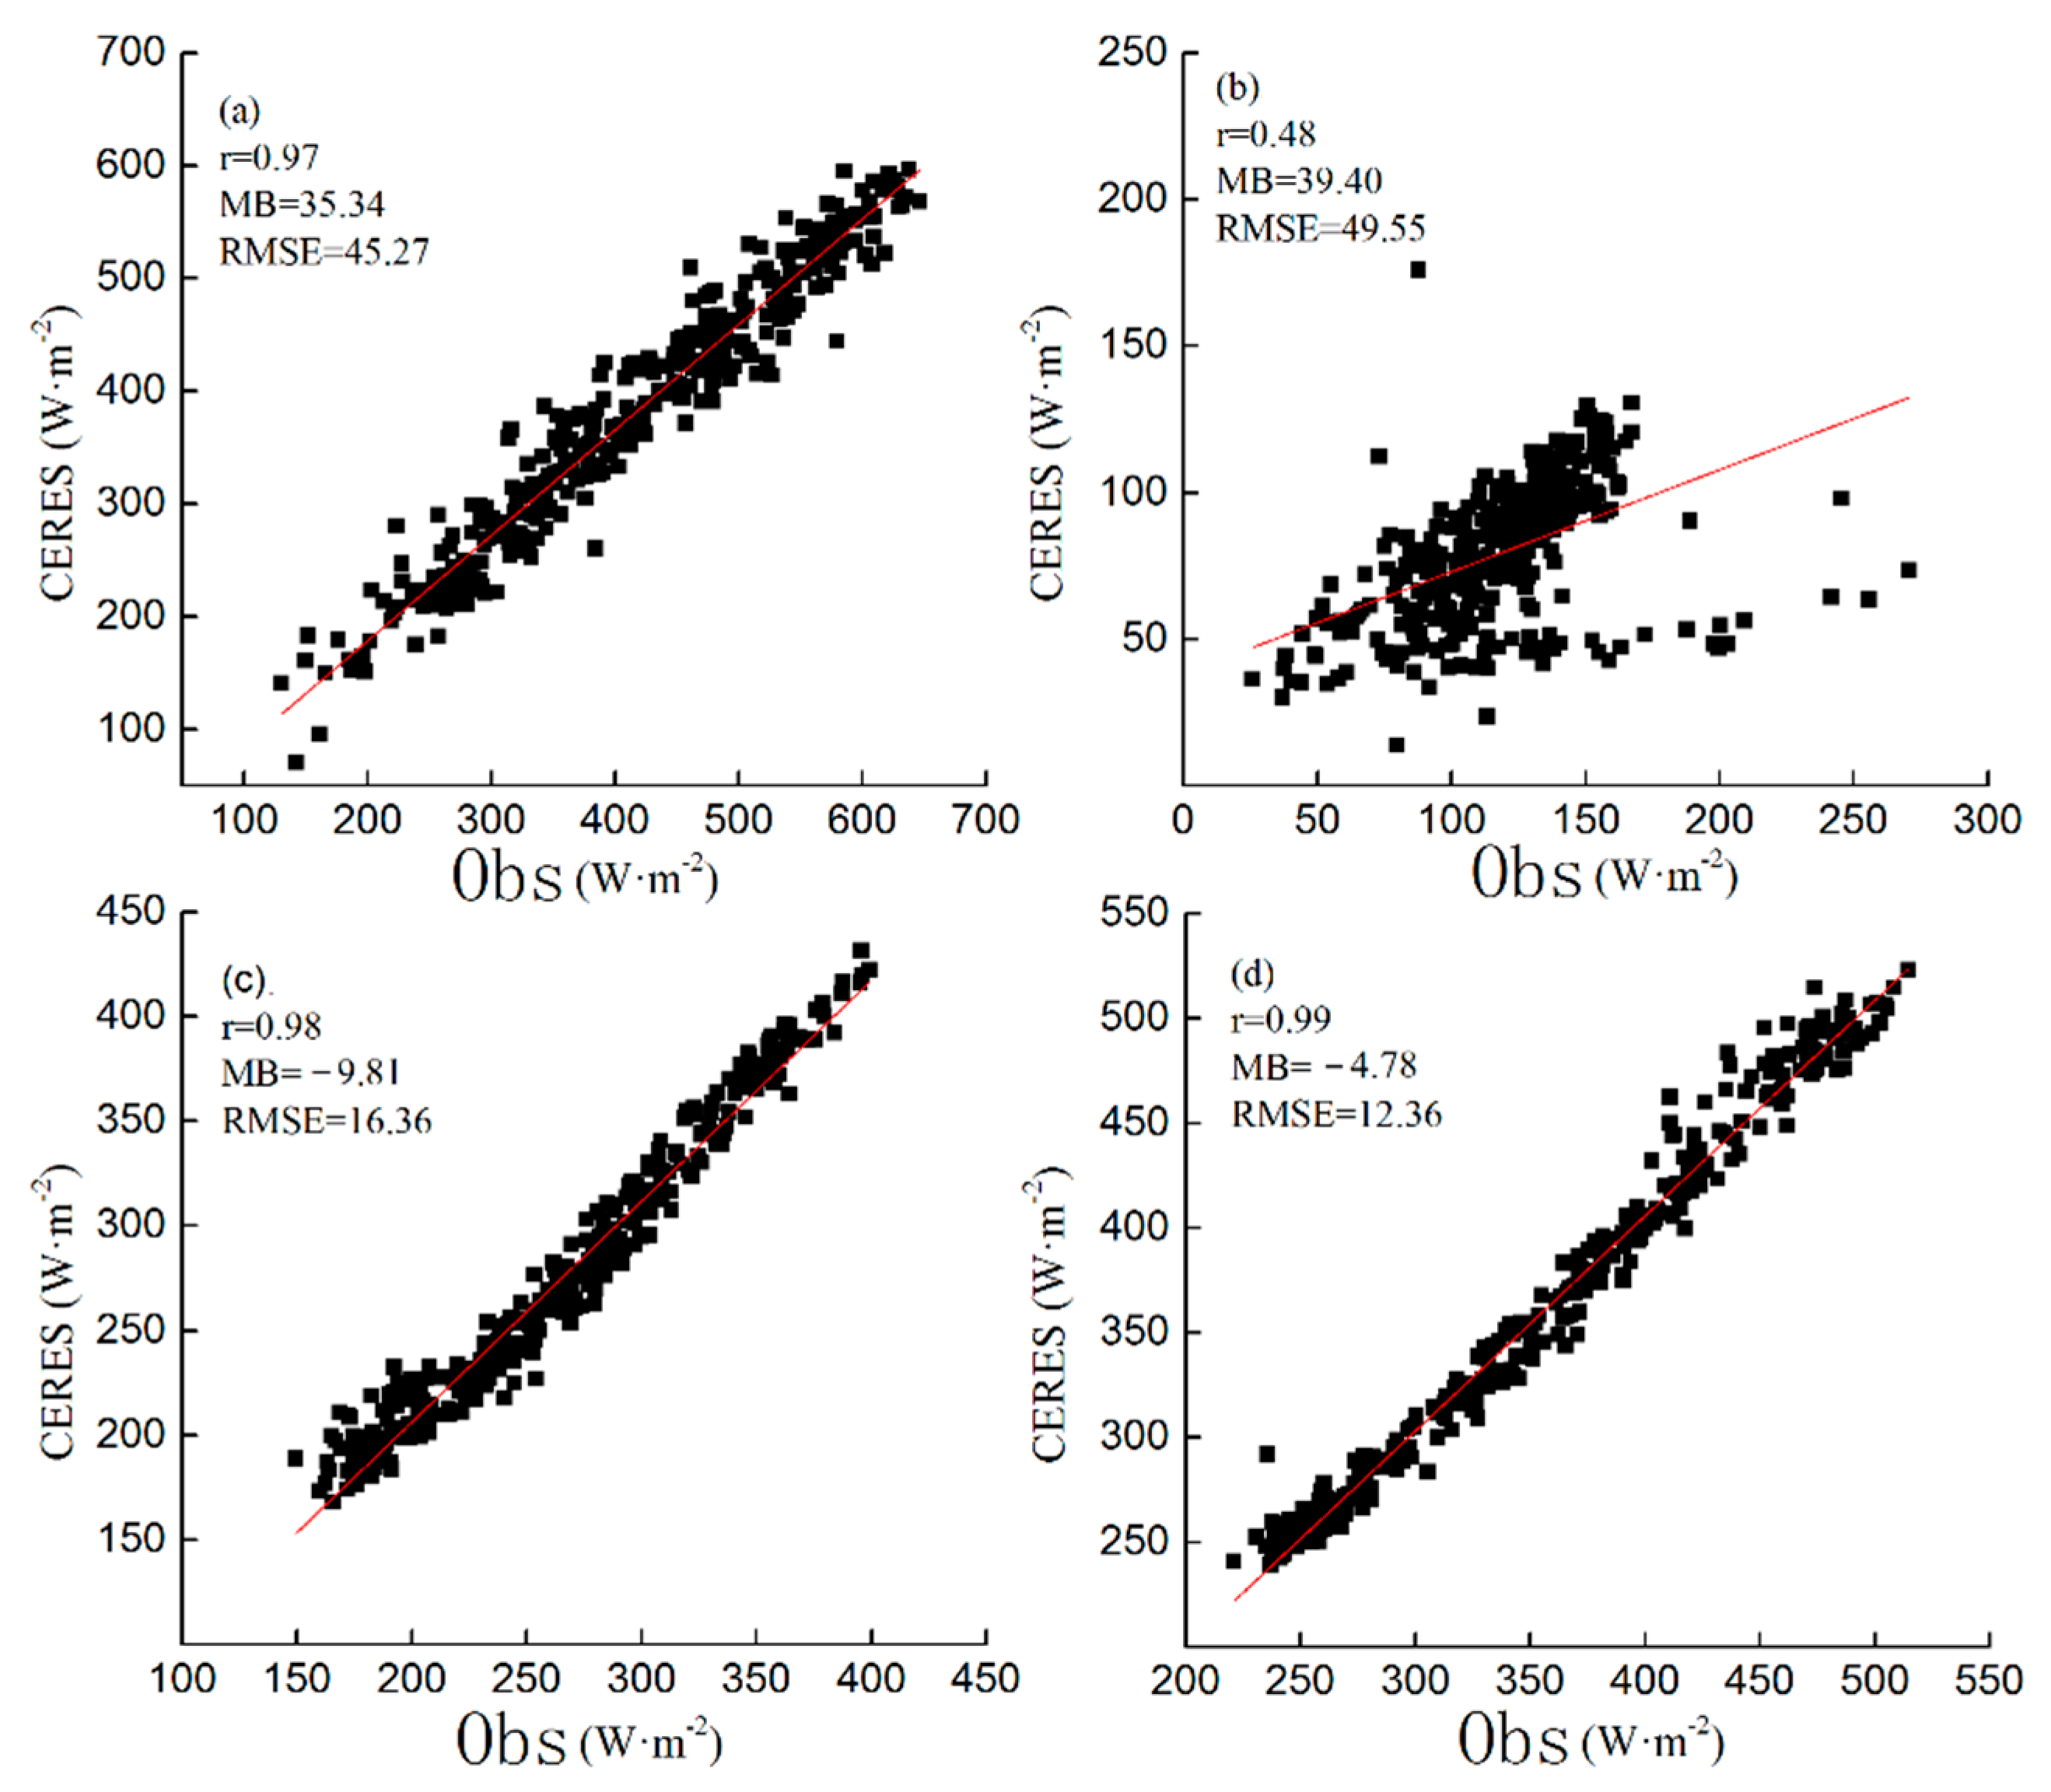
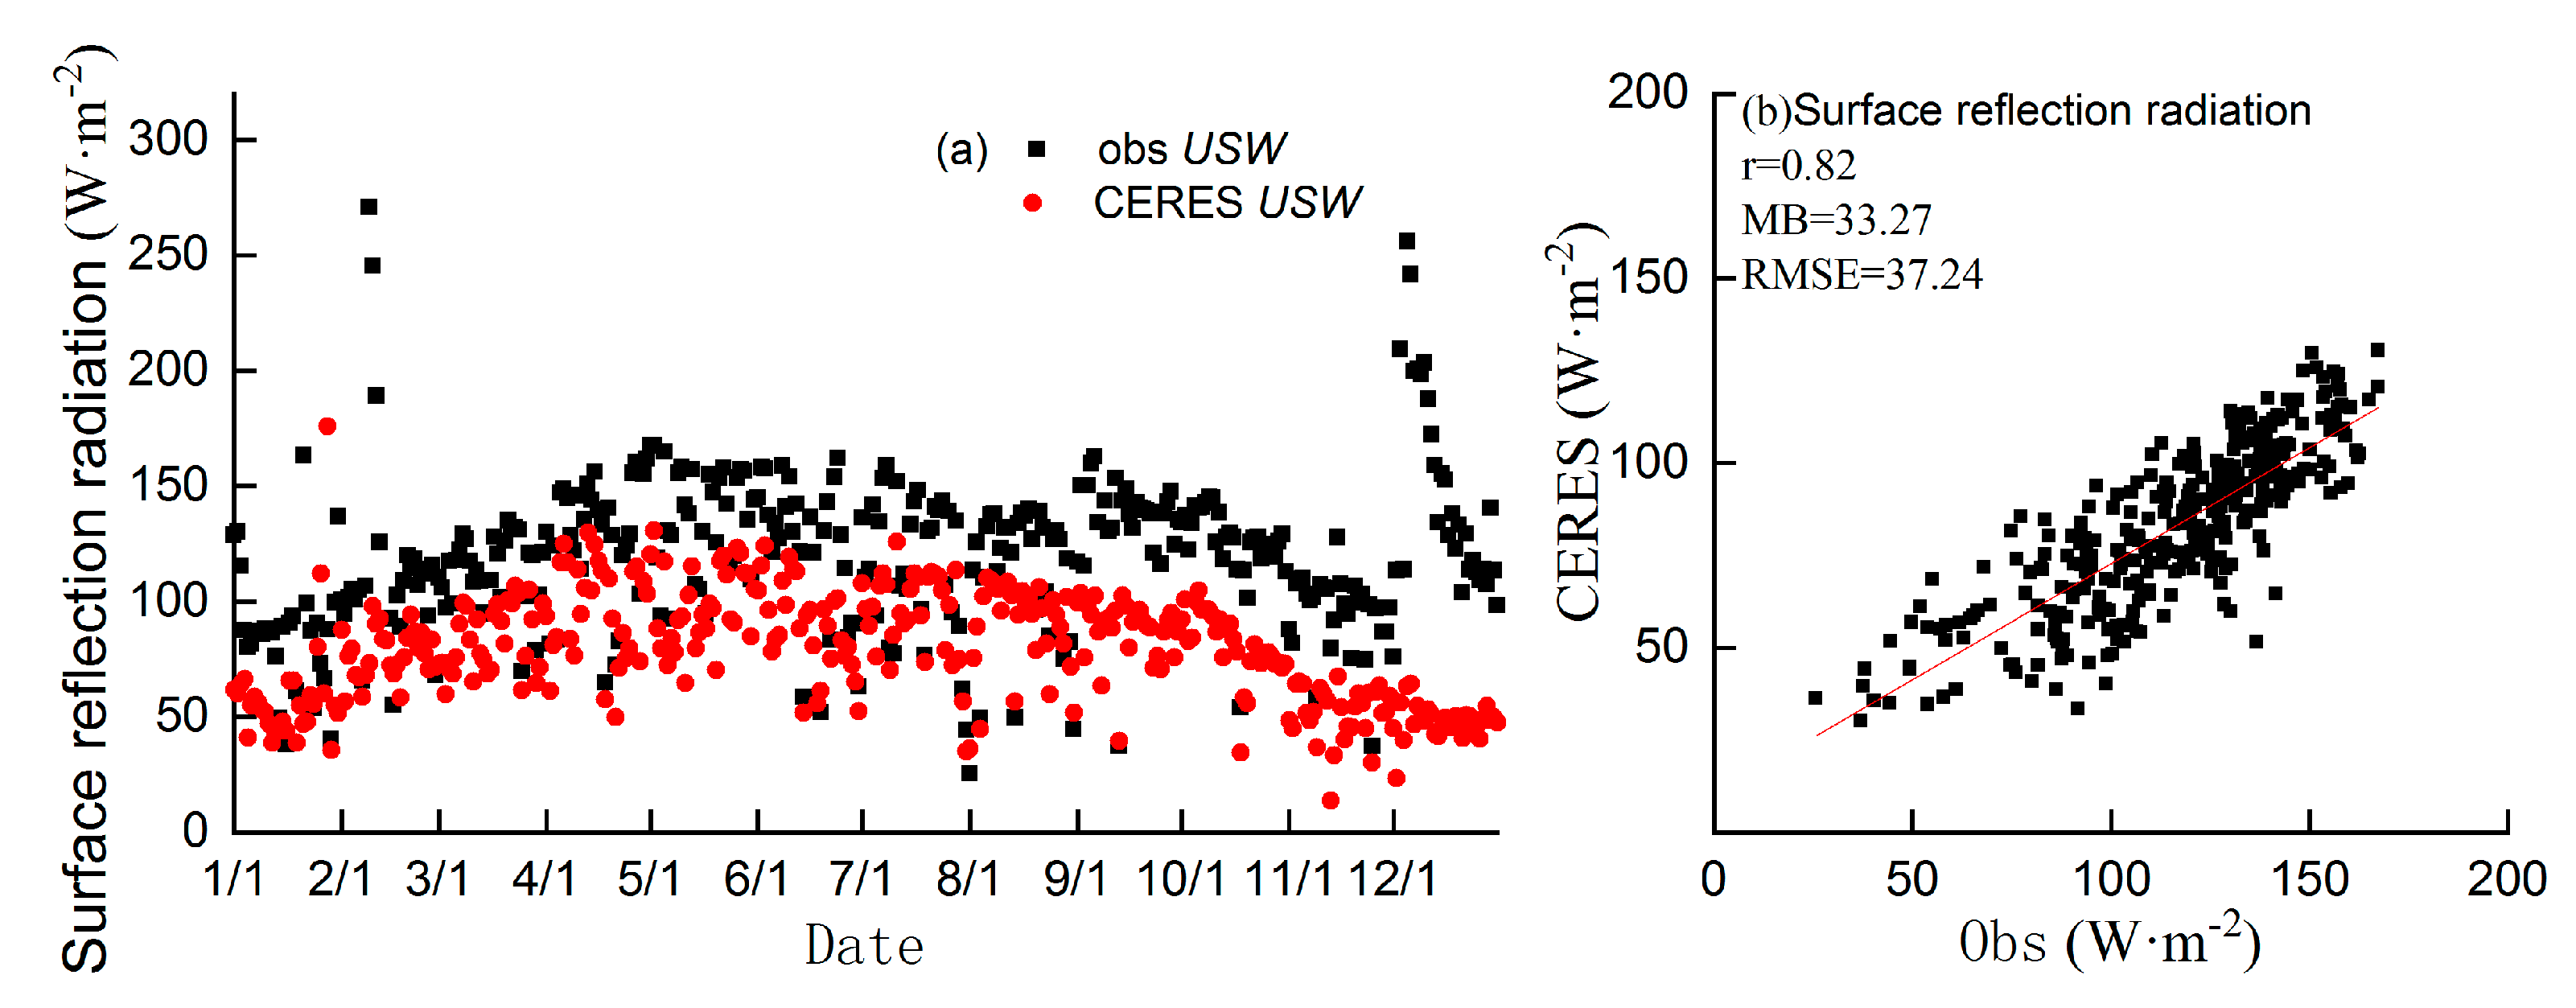
3.2. Applicability Evaluation of the CERES Satellite Data

In this study, we calculated the daily average values of the CERES satellite data and ground-based observed radiation component data and quantitatively analyzed the accuracy of the satellite data at the HLH. The results are shown in Figure 3 and Table 1. The correlation coefficient of the ULW between satellite data and observation was only 0.48, and the correlation coefficients of the other radiation components were all above 0.97. The MBs of the ULW and DLW were −4.78 W·m−2 and −9.81 W·m−2, respectively, and the rMBs were −1.32% and −3.71%, respectively. According to Equation (2), this result shows an overestimation of long-wave radiation from the satellite data. The MB and rMB of the DSW were 35.34 W·m−2 and 8.51%, respectively, which shows an underestimation in satellite data. The estimation accuracy of satellite data for long-wave radiation is greater than that for short-wave radiation.
The estimation accuracy of the satellite data for the USW was inferior to that of the other radiation components. To determine the reason for this, the surface-reflected radiation is separately presented in Figure 4a. The ground-based observed surface-reflected radiation was generally greater than the CERES satellite-estimated data. After cross-checking the data, we found that there was snow cover on the surface. Therefore, the surface snow cover data were excluded and then linearly fitted. The results are shown in Figure 3b. The correlation coefficient between the surface observed and satellite-retrieved surface-reflected radiation increased to 0.82 and the deviation and RMSE were reduced.

3.3. Applicability Evaluation of Reanalysis Datasets

3.3.1. Applicability Evaluation of ERA5 and MERRA2 Reanalysis Datasets

In radiation balance, DSW is the main source of surface energy. The net short-wave radiation (NSW) is defined as the difference between DSW and USW [36]. Similarly, the difference between ULW and DLW is the effective radiation (net long-wave radiation—NLW), which is an important form of energy exchange between the Earth and the atmosphere and an important part of the surface radiation balance [37,38]. To evaluate the accuracy of the reanalysis data, we used observed radiation components to calculate the daily average values of NSW and NLW and evaluated the applicability of the ERA5 and MERRA2 data at the HLH.
Figure 5 shows that the two reanalysis datasets are both closed to the ground-based observation data. Overall, the observation data represented by the black curve is larger than the two datasets, showing the underestimation of NLW and NSW in the reanalysis data. However, the estimated NSW in December was notably higher than the observation. This was because of snow cover (similar as in the case for the CERES algorithm) and the snow cover of the underlying surface in this area was not considered enough. The comparison and analysis of the correlation and deviation between the ground-based observations and the daily average values of NLW and NSW of ERA5 and MERRA2 are shown in Figure 6. Compared with the MERRA2, the ERA-5 has a better correlation with the observation. The correlation coefficients of NLW and NSW between the ERA-5 and the observations were 0.92 and 0.91, respectively. The correlation coefficients for MERRA2 were both 0.88. According to Table 2, the MBs of the two reanalysis datasets and the observation datasets are equivalent. The rMB of NSW is within 5%, and the rMB of NLW is less than 10%. In the figure, the dispersion of the ERA5 data to the fitted line is lower. Therefore, compared with the MERRA2, the applicability of the ERA-5 NLW and NSW is better at HLH.

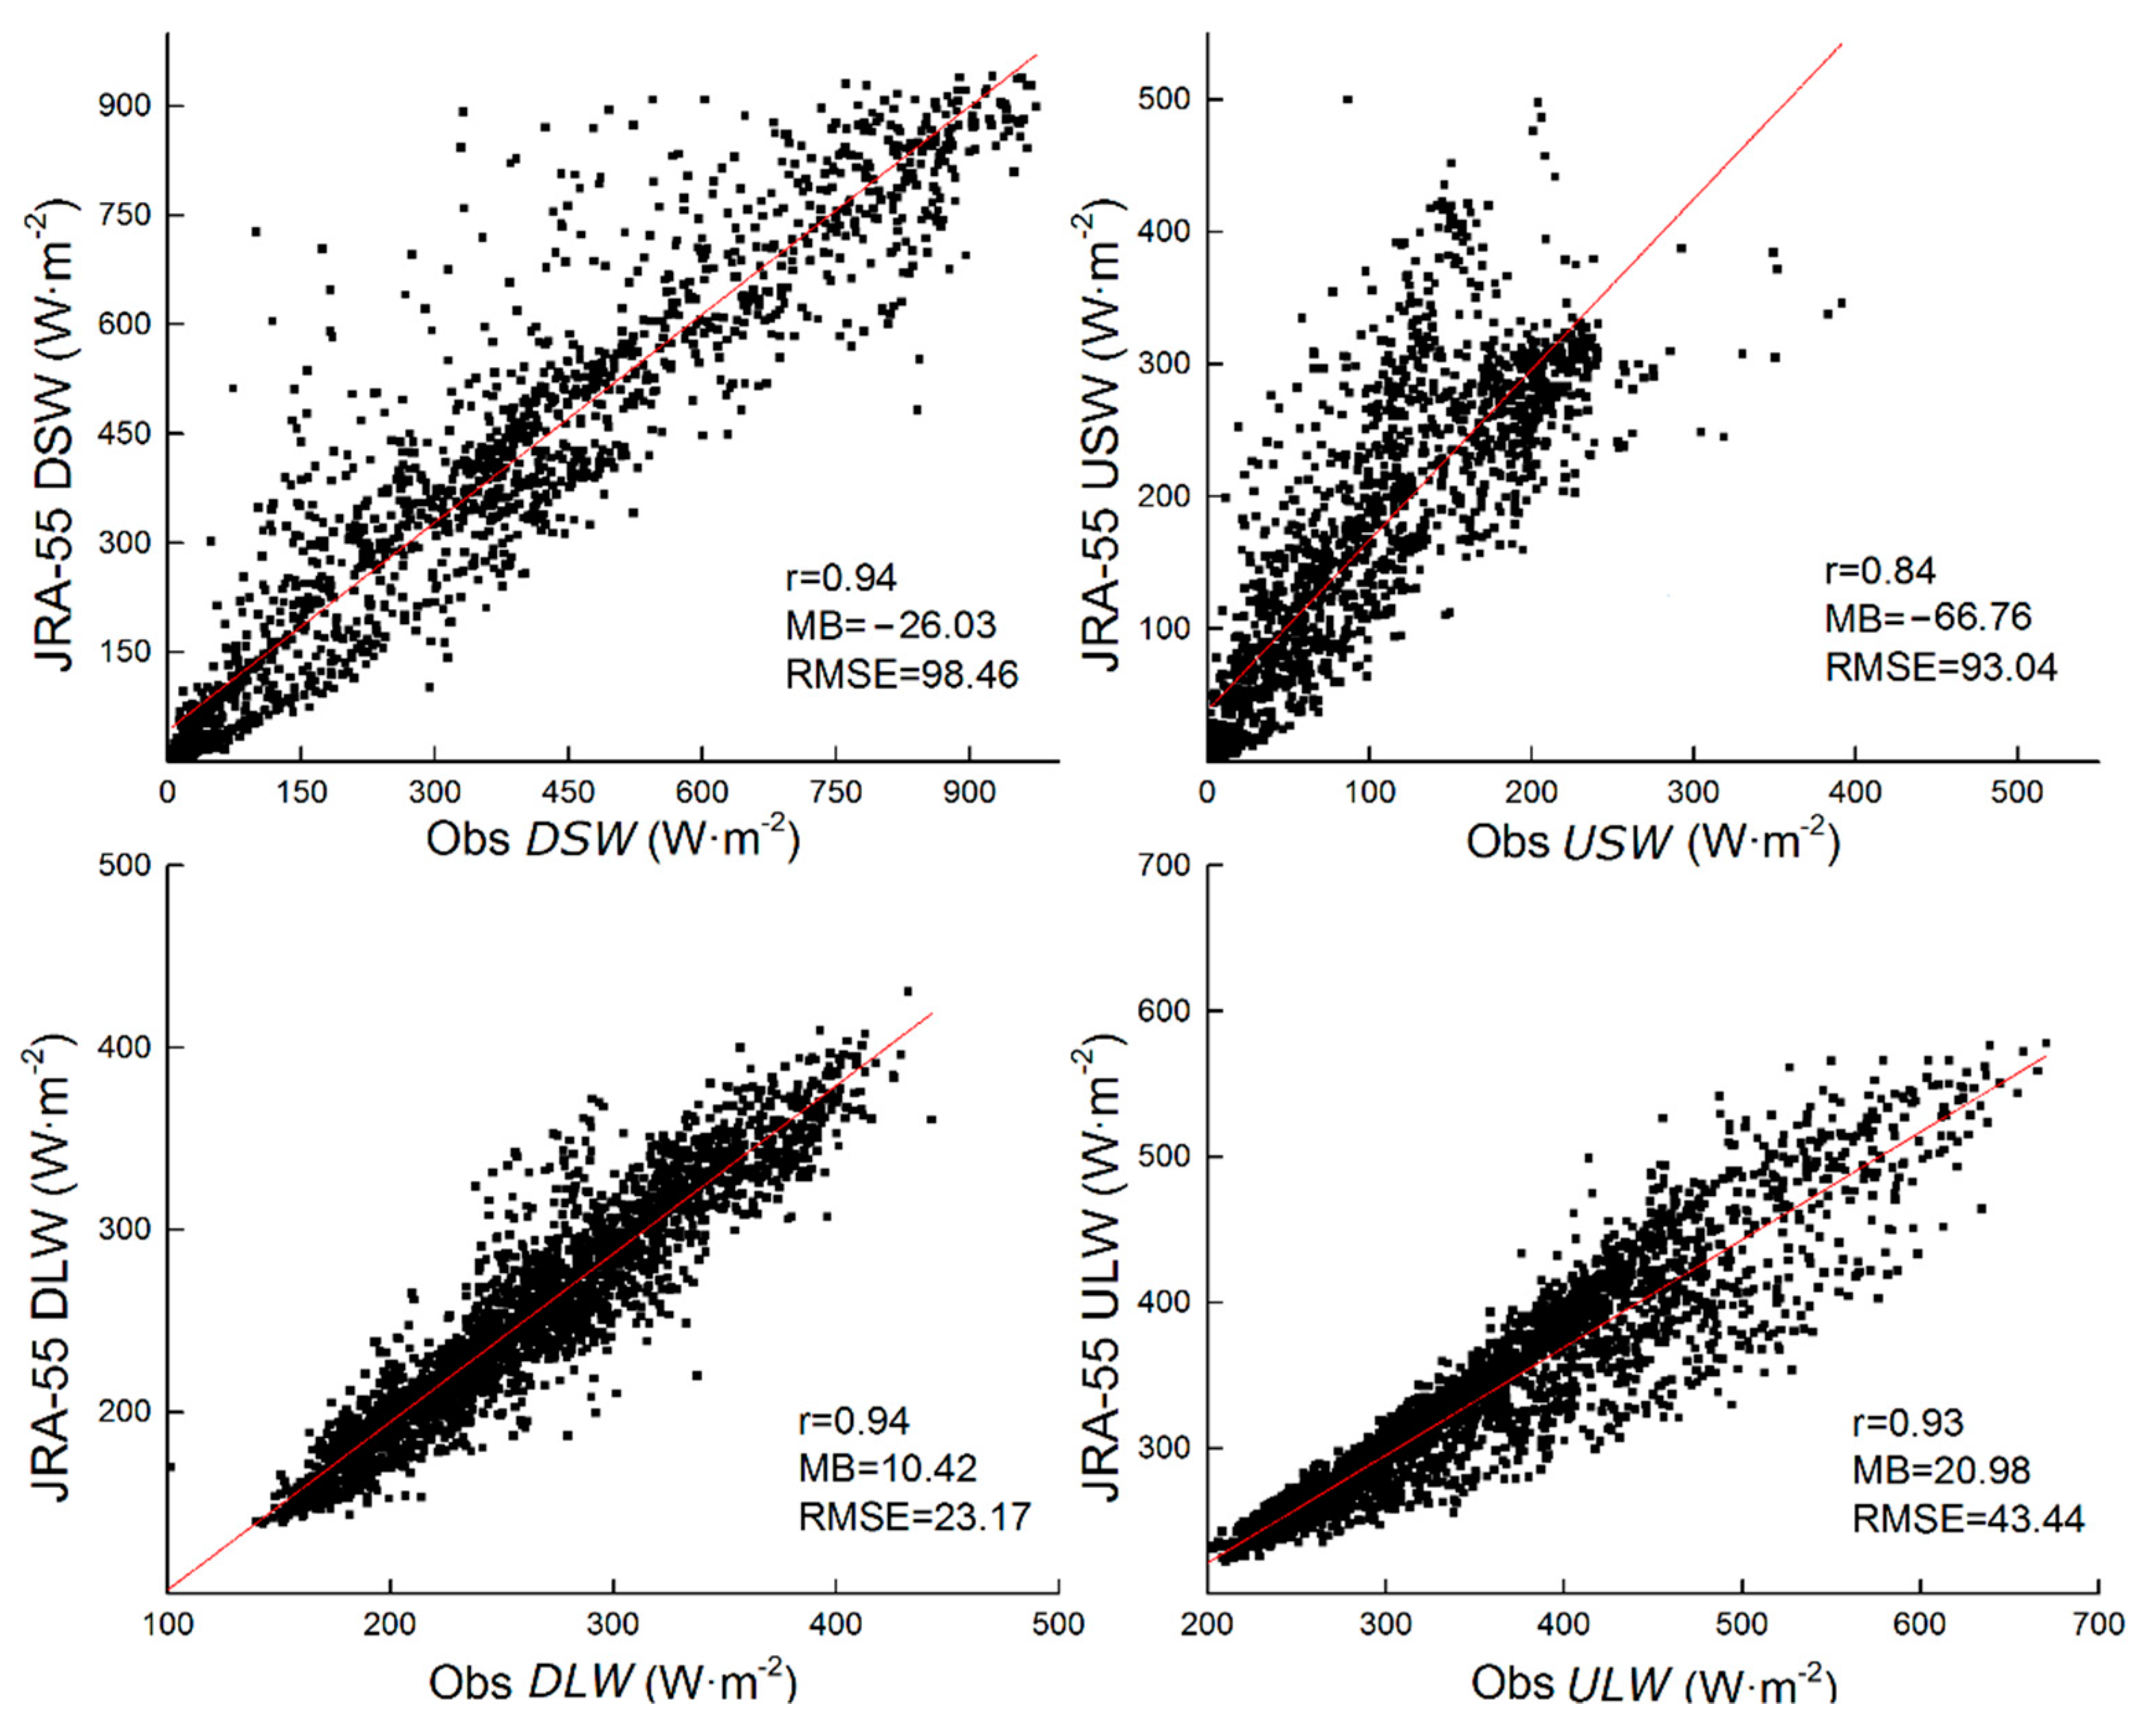
3.3.2. Applicability Evaluation of the JRA-55 Reanalysis Dataset

In order to evaluate the accuracy of the JRA-55 at HLH, we calculated the 3 h average of the ground-based observation data and compared it with the JRA-55. As shown in Figure 7, the correlation coefficient of USW between JRA-55 and the observation was 0.84, and the correlation coefficients of the other radiation components were all greater than 0.93. Upon calculating the MB (Table 3), the biases of ULW and DLW between JRA-55 and observations were 20.98 W·m−2 and 10.42 W·m−2, respectively, and the biases of the USW and DSW were −66.76 W·m−2 and −26.03 W·m−2, respectively. Overall, the JRA-55 underestimated the long-wave radiation and overestimated the short-wave radiation. In JRA-55, except for the USW, the rMB of other radiation components was less than 10%. However, according to the scatter plot and the RMSE, the short-wave radiation had a high dispersion to the fitted line, and the RMSEs were 98.47 W·m−2 and 93.04 W·m−2. Therefore, the radiation flux estimated by ERA5 has the best applicability in HLH on an annual scale.

3.3.3. Accuracy Evaluation of Reanalysis Datasets under Different Cloud Covers

The reflection and scattering of clouds, scattering and absorption of aerosols, absorption of water vapor, scattering of atmospheric molecules, and absorption of gases weaken solar radiation [39]. The contribution of cloud cover to the deviation of estimated solar radiation is more notable than that of aerosol and water vapor content [40]. Based on the CERES CAF data, the cloud cover was classified into four categories: sunny (CAF < 20%), partly cloudy (30% < CAF < 50%), cloudy (60% < CAF < 80%), and overcast (CAF > 80%). Then, the deviations of the ERA5, MERRA2, and JRA-55 radiation data from the observations under different cloud covers were analyzed on a daily scale.
It can be seen from Table 4 that the bias of NSW between the ERA5 and the observation under different cloud cover conditions ranged from 0.76% to 6.06%, and the bias of NLW ranged from −4.22% to −16.88%. The bias of NSW between the MERRA2 and the observation under different cloud cover conditions ranged from 1.21% to 3.67%, and the bias of NLW ranged from −3.80% to −9.69%. Moreover, the bias of NLW was the smallest under the partly cloudy conditions and the largest under the overcast conditions. The bias of NSW was the smallest under the sunny condition and the largest under partly cloudy conditions.
To match the temporal resolution of the JRA-55 dataset, a 3 h average was performed on the CERES cloud cover data, and then the biases between the JRA-55 and the surface observation radiation under different cloud cover conditions were evaluated. It can be seen from Table 4 that the bias of the estimated DSW in the JRA-55 dataset under different cloud cover conditions ranged from −2.94% to −11.01%, and it was the smallest under sunny conditions and the largest under the overcast conditions. The bias of the estimated DLW ranged from 3.11% to 4.88%, it was the smallest under sunny conditions and the largest under overcast conditions. The bias of the estimated ULW ranged from 4.51% to 6.41%, and it was the smallest under cloudy conditions and the largest under overcast conditions. The bias of the estimated USW was the largest, ranging from −61.89% to −71.96%.

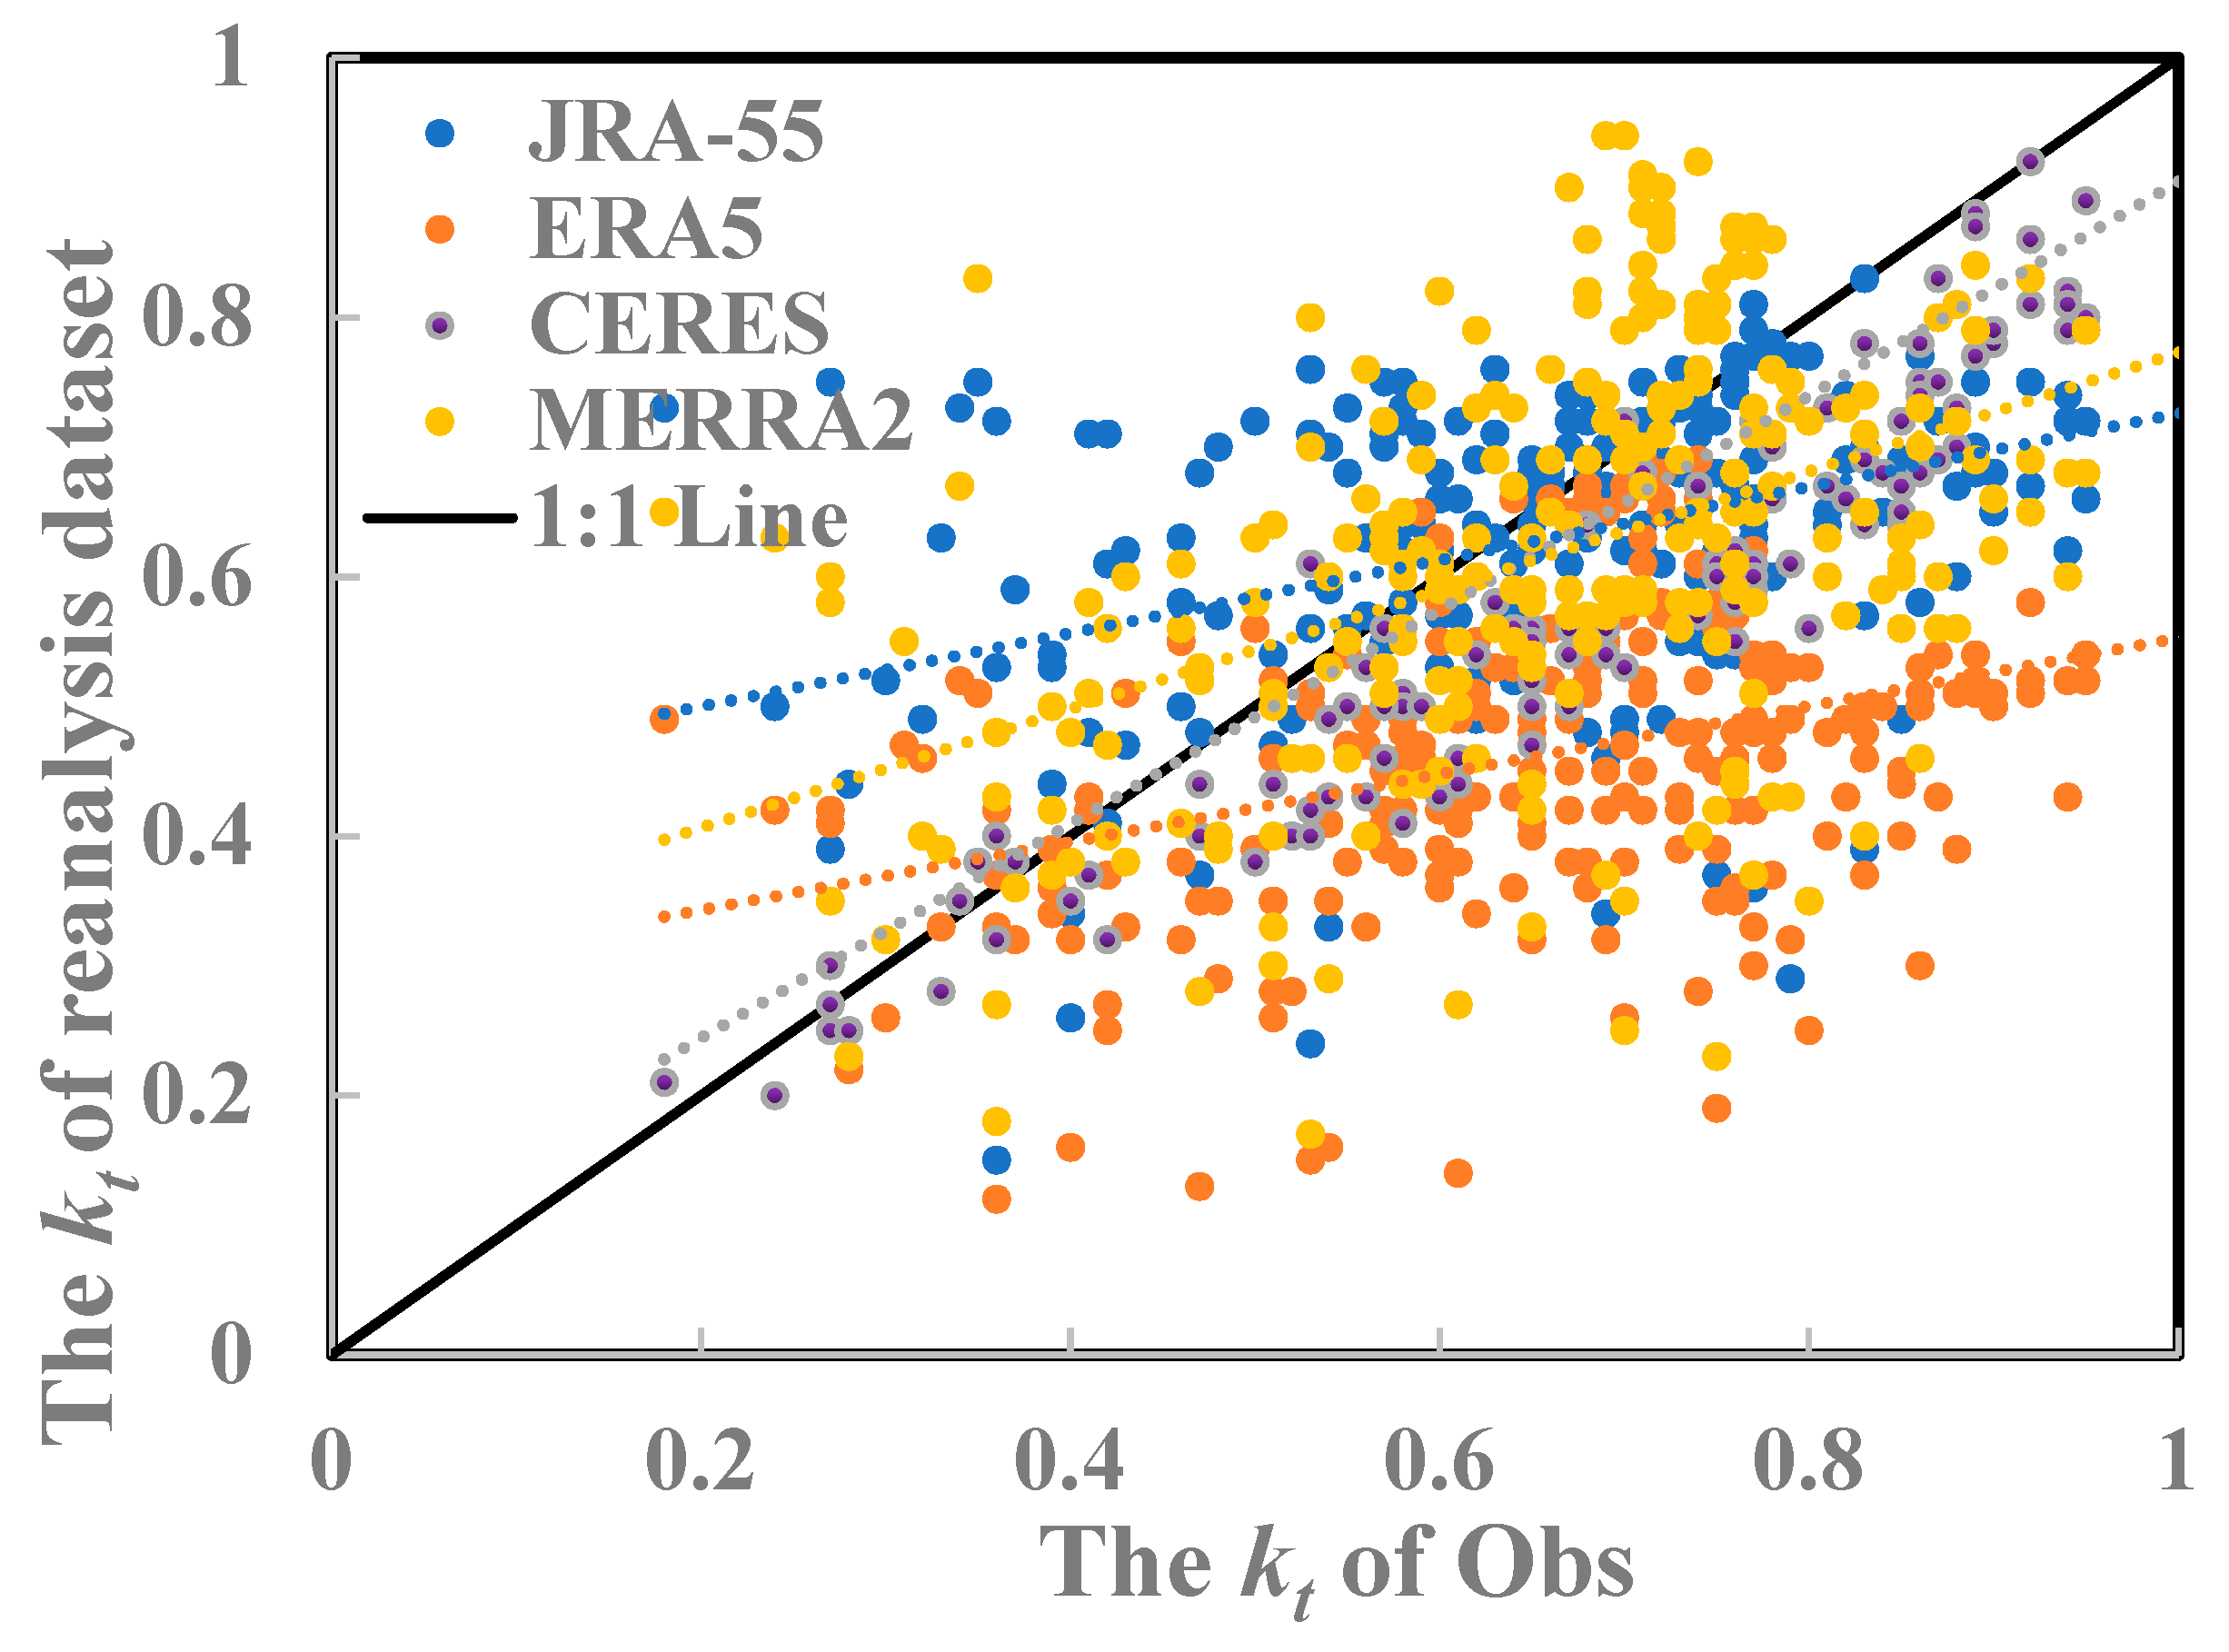
3.3.4. Comparison of Clearness Index

The prediction of the JRA-55, ERA5, CERES, and MERRA2 were all poor during the autumn and winter, and the main reason was the cloud score. The cloud score was quantified as kt. Table 5 shows the kt and statistical parameters for the comparison of the observed and reanalysis datasets. The positive values of RMSE, MB, and rMB represent an overestimation of kt by the dataset and vice versa.
The prediction error of kt for the JRA-55 data was the smallest, indicating better consistency between the predicted and observed values during spring (r = 0.75, rMB = 0.6%, MB = 3.98 W·m−2, RMSE = 26.33 W·m−2) and summer (r = 0.85, rMB = 4.2%, MB = 2.52 W·m−2, RMSE = 17.36 W·m−2). The r of kt for all reanalysis datasets was poor during autumn and winter. However, the error in the ERA5 dataset was small. It may be because the ERA5 dataset accurately considers the cloud cover in the calculation of the radiation transmission model.
The regression plots for kt of the reanalysis data are shown in Figure 8. The values of kt for clear sky were underestimated with more scatter for all datasets, and the least was for ERA5. For the partly cloudy days, kt values were overestimated with less scatter and the least is for JRA55.

3.3.5. Bias Correction by Linear Adaptation

Deviation may occur in the reanalysis dataset, resulting in an overall overestimation or underestimation of the radiation value, which makes the prediction unreliable. Therefore, it is important to correct the deviation. Linear adaptation of Equation (8) was used as a correction method to optimize the reanalysis dataset.
The statistical parameters of the radiation data of the reanalysis dataset after deviation correction are listed in Table 6. The r, RMSE, MB, and rMB after offsetting bias correction for the net long-wave and short-wave radiation of the HLH station are presented in Table 6. The corrected ERA5 data perform best for net short-wave radiation (r = 0.94, RMSE = 26.41 W·m−2, MB = 8.97 W·m−2 and rMB = 2.53 W·m−2). The corrected CERES data perform best for net long-wave radiation (r = 0.99, RMSE = −12.35 W·m−2, MB = −7.29 W·m−2 and rMB = −2.51 W·m−2).

4. Discussion

Reanalysis datasets (JRA-55, ERA5, and MERRA2) and satellite data from CERES were evaluated with in situ observations over the Gobi region of Xinjiang, China. We evaluated these observations for each radiation component.
We found that the annual variation of the radiation component in the Gobi area presents an inverted U-shaped distribution, and the overall radiation intensity ranking was DSW > ULW > DLW > USW, which was consistent with the results of Niu et al. [41]. In addition, CERES satellite data showed an overestimation of long-wave radiation, and a similar overestimation for long-wave radiation has been reported by Romano et al. [42]. However, CERES data underestimates the downward short-wave radiation; the average deviation and relative average deviation of the predicted downward short-wave radiation were 35.34 W·m−2 and 8.51%, respectively. The estimation accuracy of CERES for long-wave radiation was superior to that of short-wave radiation. One of the reasons for the satellite estimation accuracy for USW is surface snow in winter, which causes albedo and USW to increase. It was speculated that the CERES algorithm does not include a scheme of the underlying snow conditions [43,44], resulting in a serious underestimation of USW in this region.
The radiation datasets of the ERA-5 and MERRA2 were similar to the ground-based measured data; the correlation coefficients were all above 0.88. The net short-wave radiation in winter was estimated to be higher, and it was speculated to be due to snow cover (similarly to that of the CERES algorithm); in both cases, snow cover was not considered. Upon comparing the applicability of the net long-wave and short-wave radiation data for ERA-5 and MERRA2 over HLH, we found that ERA-5 has better applicability, which is consistent with the verification results of the Chen et al. [45]. However, the results of Yi [46] showed that the MERRA2 (with a small positive bias: <1 MJ·m−2·day−1) presents over some arid areas better statistics of daily short-wave (SWrad) compared to other satellite datasets. Wang [47] found that the MERRA2 has the smallest standard deviation of differences (σd) of upward short-wave radiation (σd = 1.00) and downward long-wave radiation (σd = 1.50) in the Tibetan Plateau. You [48] reported the surface radiation of the Tibet Plateau will be affected by elevation data and land cover. Therefore, the strong heterogeneity of the topography of the Gobi and the plateau leads to the difference in surface radiation between the two.
In addition, the JRA-55 underestimates the long-wave radiation and overestimates the short-wave radiation. The deviations between the upstream and downstream long-wave radiation were 20.98 W·m−2 and 10.42 W·m−2, respectively, and the deviations between the upward and downward short-wave radiation were −66.76 W·m−2 and −26.03 W·m−2, respectively. Furthermore, Peng [49] analyzed the error of JRA-55 solar radiation data on a global scale, and the result showed an overestimation (22.61 W·m−2) on an annual scale, which was consistent with the results from this study. According to the deviation of the ERA5, MERRA2, and JRA-55 reanalysis data under different cloud cover on a daily scale, it can be seen that for ERA5 and MERRA2 data, NLW is the smallest under low cloud conditions (rMB of ERA: −5.42%, rMB of MERRA2: −3.80%) and the largest under cloudy conditions (rMB of ERA: −16.88%, rMB of MERRA2: −9.69%), and the smallest under NSW cloudy conditions (rMB of ERA: 0.76%, rMB of MERRA2: 2.04%) and the largest in the less cloud state (rMB of ERA: 6.06%, rMB of MERRA2: 3.67%).
The kt values of all datasets were poor during autumn and winter. The JRA-55 had the best prediction effect, and the sunny or cloudy weather predicted by the reanalysis of the data may be contrary to the actual situation, which was consistent with the results of Alexandre [50] and Zia [51]. Finally, this study optimized each dataset by the deviation correction method of linear equation adaptation and showed that the order of increasing overall accuracy of reanalysis dataset prediction was JRA-55 (r = 0.94, RMSE = 33.30 W·m−2, MB = 15.71 W·m−2 and rMB = 4.87 W·m−2), CERES (r = 0.99, RMSE = −12.35 W·m−2, MB = 7.29 W·m−2 and rMB = −2.51 W·m−2), MERRA (r = 0.91, RMSE = 13.24 W·m−2, MB = 3.85 W·m−2 and rMB = −3.35 W·m−2), and ERA5 (r = 0.94, RMSE = 26.41 W·m−2, MB = 8.97 W·m−2 and rMB = 2.53 W·m−2). The above research shows that the radiative transfer model of all reanalysis datasets needs to be improved according to the cloud cover and aerosol of different regions to better estimate radiation [52].
In general, the radiant flux estimated by the ERA-5 reanalysis dataset has the best applicability in the Gobi area on an annual scale. The results from a study of Pakistan’s Baluchistan area (average sunshine duration is 8–8.5 h), which is a region that experiences strong sunlight, also showed that the radiation dataset of ERA5 has the best prediction results in this area [53]. In another study, it was found that the radiation of ERA5 shows moderate errors with an average absolute deviation of the global monthly average level of irradiance of 6.8 W·m−2, while other satellite images are considerably larger in high-latitude locations [54].

5. Conclusions

The annual variations of the various radiation components at the HLH in 2018 were distributed in an inverted “U” shape. The overall radiation intensities were ranked in the order DSW > ULW > DLW > USW. The USW was the highest during the snow cover period in winter. Due to the influence of cloud cover, the DSW was the highest in May while the DLW and ULW were the highest in July.
The CERES dataset displayed an overestimation of the surface short-wave radiation and an underestimation of the surface long-wave radiation. The estimation accuracy for the DSW, DLW, and ULW was high, and their correlation coefficients with the surface observation data were above 0.97; while the estimation accuracy for the USW was low, and the correlation coefficient was only 0.48. According to the albedo data (0.51–0.63), it was speculated that this was because the snow conditions of the underlying area were not considered enough in the algorithm.
The ERA5 and MERRA2 reanalysis datasets showed an overestimation of the NLW and NSW in the HLH region. In contrast, the performance of the ERA5 dataset was slightly better, and its correlation coefficients with the surface observation data for NSW and NLW were 0.91 and 0.92, respectively. In addition, the performances of the two reanalysis datasets under different cloud cover conditions were different. For ERA5, the rMB of NSW was the smallest under overcast conditions and the largest under partly cloudy conditions (6.06%), while the rMB of NLW was the smallest under sunny conditions and the largest under overcast conditions (−16.88%). However, for MERRA2, the rMB of NSW was the smallest under sunny conditions and the largest under partly cloudy conditions (3.67%); while the rMB of NLW was the smallest under partly cloudy conditions and the largest under overcast conditions (−9.69%).
The correlation coefficients of DSW, DLW, and ULW between the JRA-55 reanalysis dataset and the observations are all above 0.93, and the correlation coefficient of the USW was 0.84. JRA-55 underestimated short-wave radiation and overestimated long-wave radiation. In the JRA-55 dataset, the MB of DSW was the smallest under sunny conditions and the largest under overcast conditions (11.01%). The MB of DLW was similar to that of DSW, and it was the largest under overcast conditions (4.88%). The MB of ULW was large, with it being the smallest under cloudy conditions and the largest under overcast conditions (6.41%). The MB of USW was the largest, ranging from −61.89% to −71.96% under different cloud cover conditions.
The kt of the JRA-55 dataset had the best prediction effect, indicating better agreement between the predicted and observed values during spring (r = 0.91 and rMB = 0.6) and summer (r = 0.91 and rMB = 0.6).
Overall, the ERA5 dataset had the best estimation accuracy on the surface observation among all the reanalysis datasets and better applicability in the Gobi area. Future research will be directed at improving the radiation transmission model of the reanalysis data set according to the cloud cover and aerosol in different regions to effectively estimate the radiation.

Author Contributions

Conceptualization, Y.W. and A.M. (Ali Mamtimin); methodology, Y.W. and X.Z.; data curation, H.S. and S.A.; writing—original draft preparation, A.M. (Amina Maturdi) and X.Z.; writing—review and editing, Y.W. and F.Y.; visualization, W.H.; supervision, C.Z. and X.Y.; project administration, X.L.; funding, Y.W. and A.M. (Ali Mamtimin). All authors have read and agreed to the published version of the manuscript.

Funding

This research was funded by the National Natural Science Foundation of China (41875023), Central Scientific Research Institute of the Public Basic Scientific Research Business Professional (IDM2021005, IDM2021001, IDM2017001), Innovative and Development Project of China Meteorological Administration (CXFZ2021J044), the Central Asia Atmospheric Research Foundation (CASS202009), Flexible Talents Introducing Project of Xinjiang (2018).

Institutional Review Board Statement

Not applicate.

Informed Consent Statement

Not applicate.

Data Availability Statement

The remote sensing datasets for this study are available on the website link in Section 2.3 and Section 2.4, and other data used in this paper can be provide by Ali Mamtimin ([email protected]) upon request.

Conflicts of Interest

All authors state no conflict of interest.

References

  1. Fang, H.; Qin, W.; Wang, L.; Zhang, M.; Yang, X. Solar brightening/dimming over China’s mainland: Effects of atmospheric aerosols, anthropogenic emissions, and meteorological conditions. Remote Sens. 2020, 13, 88. [Google Scholar] [CrossRef]
  2. He, Y.; Wang, K.; Feng, F. Improvement of ERA5 over ERA-Interim in simulating surface incident solar radiation throughout China. J. Clim. 2021, 34, 3853–3867. [Google Scholar] [CrossRef]
  3. Zha, L. Temporal and spatial variation of surface solar radiation in China. Geogr. Sci. 1996, 16, 232. (In Chinese) [Google Scholar]
  4. Zhou, Y.; Wu, W.; Hu, Y.; Liu, G. Spatial distribution characteristics and potential assessment of solar energy resources in Northwest China. J. Nat. Resour. 2010, 25, 1738–1749. (In Chinese) [Google Scholar]
  5. Wang, F.; Wang, Q.; Liu, S.; Chai, C.; Wang, F.; Liu, S.; Sun, T.; Zhu, S. Application of photovoltaic power generation in the desert and gobi and analysis of its ecological benefits. Open J. Nat. Sci. 2020, 8, 136–141. [Google Scholar] [CrossRef]
  6. Qi, Y.; Fang, S.B.; Zhou, W.Z. Variation and spatial distribution of surface solar radiation in China over recent 50 years. J. Ecol. 2014, 34, 7444–7453. [Google Scholar] [CrossRef] [Green Version]
  7. Zhang, X.; Lu, N.; Yao, L.; Jiang, H. Error analysis of ECMWF surface solar radiation data in China. Geo Inf. Sci. 2018, 20, 254–267. (In Chinese) [Google Scholar] [CrossRef]
  8. Jia, B.; Xie, Z.; Dai, A.; Shi, C.; Chen, F. Evaluation of satellite and reanalysis products of downward surface solar radiation over East Asia: Spatial and seasonal variations. J. Geophys. Res. Atmos. 2013, 118, 3431–3446. [Google Scholar] [CrossRef]
  9. Pang, M.; Zhou, D.; Chen, Y.; Zhong, K.; Xin, Y.; Qing, R.; Liu, Q.; Hu, J. Temporal and spatial distribution characteristics of downward shortwave radiation in Xinjiang. Based Ceres Aqua Satell. Data 2017, 11, 9–15. (In Chinese) [Google Scholar]
  10. Yan, H.; Huang, J.; Minnis, P.; Wang, T.; Bi, J. Comparison of CERES surface radiation fluxes with surface observations over Loess Plateau. Remote Sens. Environ. 2011, 115, 1489–1500. [Google Scholar] [CrossRef] [Green Version]
  11. Urraca, R.; Huld, T.; Gracia-Amillo, A.; Martínez-De-Pisón, F.; Kaspar, F.; Sanz-Garcia, A. Evaluation of global horizontal irradiance estimates from ERA5 and COSMO-REA6 reanalyses using ground and satellite-based data. Sol. Energy 2018, 164, 339–354. [Google Scholar] [CrossRef]
  12. Johnston, B.; Randel, W.; Sjoberg, J. Evaluation of tropospheric moisture characteristics among COSMIC-2, ERA5, and MERRA-2 in the tropics and subtropics. Remote Sens. 2021, 13, 880. [Google Scholar] [CrossRef]
  13. Zhao, T.B.; Fu, C.B. Preliminary comparison and analysis between ERA-40, NCEP-2 reanalysis and observations over China. Clim. Environ. Res. 2006, 11, 14–32. [Google Scholar] [CrossRef]
  14. Zhang, R.; Zhang, S.; Luo, J.; Han, Y.; Zhang, J. Analysis of near-surface wind speed change in China during 1958–2015. Theor. Appl. Clim. 2019, 137, 2785–2801. [Google Scholar] [CrossRef]
  15. Sianturi, Y.; Marjuki; Sartika, K. Evaluation of ERA5 and MERRA2 reanalyses to estimate solar irradiance using ground observations over Indonesia region. In Proceedings of the International Energy Conference ASTECHNOVA 2019, Yogyakarta, Indonesia, 6 April 2020. [Google Scholar] [CrossRef]
  16. Yiming, F.; Bo, W.; Aidong, Y. A study on classification system and inventory of gobi. Acta Geogr. J. 2014, 69, 391–398. [Google Scholar] [CrossRef]
  17. Xian, D.; Zheng, X.; Li, X.; Li, Y. Characteristics of climate change in the black gobi region of China. Acta Meteorol. Sin. 2014, 30, 81–87. (In Chinese) [Google Scholar]
  18. Zhang, Q.; Wei, G.; Huang, R.; Cao, X. Bulk transfer coefficients of the atmospheric momentum and sensible heat over desert and Gobi in arid climate region of Northwest China. Sci. China 2002, 45, 468–480. [Google Scholar] [CrossRef]
  19. Keqin, G.; Lianhai, H. Iguanians from the upper Cretaceous Djadochta formation, Gobi Desert, China. J. Vertebr. Paléontol. 1995, 15, 57–78. [Google Scholar] [CrossRef]
  20. Shen, Y.; Wang, X.; Cheng, W.; Wu, J.; Lu, Q.; Feng, Y. Study on the comprehensive natural regionalization of Gobi in China. Prog. Geogr. Sci. 2016, 35, 59–68. (In Chinese) [Google Scholar]
  21. Li, R. Climatic characteristics of temperature and precipitation in Hongliuhe. Agric. Technol. Serv. 2009, 26, 107–108. (In Chinese) [Google Scholar]
  22. Muñoz-Sabater, J.; Dutra, E.; Agustí-Panareda, A.; Albergel, C.; Arduini, G.; Balsamo, G.; Boussetta, S.; Choulga, M.; Harrigan, S.; Hersbach, H.; et al. ERA5-Land: A state-of-the-art global reanalysis dataset for land applications. Earth Syst. Sci. Data Discuss. 2021, 3, 1–5. [Google Scholar] [CrossRef]
  23. Reichle, R.H.; Koster, R.D.; De Lannoy, G.J.; Forman, B.A.; Liu, Q.; Mahanama, S.P.; Touré, A. Assessment and enhancement of MERRA land surface hydrology estimates. J. Clim. 2011, 24, 6322–6338. [Google Scholar] [CrossRef] [Green Version]
  24. Iqbal, M. An Introduction to Solar Radiation; Academic Press: Toronto, ON, Canada, 1983; Volume 39, pp. 387–390. ISBN 0123737508. [Google Scholar]
  25. Qing, H.; Li, J.L.; Hua, Y.X. Characteristics and influencing factors of ultraviolet radiation in desert hinterland. Desert Oasis Meteorol. 2011, 5, 7–14. (In Chinese) [Google Scholar]
  26. Gu, L.; Fuentes, J.D.; Shugart, H.H.; Staebler, R.M.; Black, T.A. Responses of net ecosystem exchanges of carbon dioxide to changes in cloudiness: Results from two North American deciduous forests. J. Geophys. Res. Atmos. 1999, 104, 31421–31434. [Google Scholar] [CrossRef]
  27. Smith, C.J.; Bright, J.M.; Crook, R. Cloud cover effect of clear-sky index distributions and differences between human and automatic cloud observations. Sol. Energy 2017, 144, 10–21. [Google Scholar] [CrossRef] [Green Version]
  28. Zhang, X.; Liang, S.; Wang, G.; Yao, Y.; Jiang, B.; Cheng, J. Evaluation of the reanalysis surface incident shortwave radiation products from NCEP, ECMWF, GSFC, and JMA using satellite and surface observations. Remote Sens. 2016, 8, 225. [Google Scholar] [CrossRef] [Green Version]
  29. Glahn, H.R.; Lowry, D.A. The use of model output statistics (MOS) in objective weather forecasting. J. Appl. Meteorol. 1972, 11, 1203–1211. [Google Scholar] [CrossRef] [Green Version]
  30. Polo, J.; Wilbert, S.; Ruiz-Arias, J.; Meyer, R.; Gueymard, C.; Suri, M.; Martin, L.; Mieslinger, T.; Blanc, P.; Grant, I.; et al. Integration of Ground Measurements with Model-Derived Data. 2015. Available online: https://elib.dlr.de/99181/ (accessed on 12 September 2021).
  31. Maraun, D. Bias correcting climate change simulations—A critical review. Curr. Clim. Chang. Rep. 2016, 2, 211–220. [Google Scholar] [CrossRef] [Green Version]
  32. Maraun, D.; Wetterhall, F.; Ireson, A.; Chandler, R.; Kendon, E.J.; Widmann, M.; Brienen, S.; Rust, H.; Sauter, T.; Themeßl, M.; et al. Precipitation downscaling under climate change: Recent developments to bridge the gap between dynamical models and the end user. Rev. Geophys. 2010, 48, 48. [Google Scholar] [CrossRef]
  33. Teutschbein, C.; Seibert, J. Bias correction of regional climate model simulations for hydrological climate-change impact studies: Review and evaluation of different methods. J. Hydrol. 2012, 456–457, 12–29. [Google Scholar] [CrossRef]
  34. Hempel, S.; Frieler, K.; Warszawski, L.; Schewe, J.; Piontek, F. A trend-preserving bias correction-the ISI-MIP approach. Earth Syst. Dyn. 2013, 4, 219–236. [Google Scholar] [CrossRef] [Green Version]
  35. Harding, R.J.; Weedon, G.P.; Van Lanen, H.A.; Clark, D.B. The future for global water assessment. J. Hydrol. 2014, 518, 186–193. [Google Scholar] [CrossRef] [Green Version]
  36. Wang, C.; Wei, Z.; Li, Z.; Xiao, T.; Ni, C. Simulation of land surface processes on Gobi underlying surface in Arid Northwest China. Acta Sol. Sin. 2016, 37, 2422–2429. (In Chinese) [Google Scholar]
  37. Brunt, D. Notes on radiation in the atmosphere. Q. J. R. Meteorol. Soc. 1932, 58, 389–420. [Google Scholar] [CrossRef]
  38. Berdahl, P. Emissivity of clear skies. Sol. Energy 1984, 32, 663–664. [Google Scholar] [CrossRef]
  39. Shen, Y.; Zhao, Z.; Shi, G. The latest research progress on the variation of surface solar radiation, its influencing factors and possible climate effects. Prog. Earth Sci. 2008, 9, 915–923. (In Chinese) [Google Scholar] [CrossRef]
  40. Zib, B.J.; Dong, X.; Xi, B.; Kennedy, A. Evaluation and intercomparison of cloud fraction and radiative fluxes in recent reanalyses over the Arctic using BSRN surface observations. J. Clim. 2012, 25, 2291–2305. [Google Scholar] [CrossRef]
  41. Niu, S.J.; Wang, C.Z.; Yue, P. Case study of dust event on surface heat and radiation budget over gobi in Heihe basin during winter to spring. J. Desert Res. 2010, 30, 407–412. (In Chinese) [Google Scholar]
  42. Romano, S.; Perrone, M.R. Mineral dust impact on short- and long-wave radiation and comparison with ceres measurements. EPJ Web Conf. 2016, 119, 8005. [Google Scholar] [CrossRef] [Green Version]
  43. Radkevich, A.; Khlopenkov, K.; Rutan, D.; Kato, S. A supplementary clear-sky snow and ice recognition technique for CERES level 2 products. J. Atmos. Ocean. Technol. 2013, 30, 557–568. [Google Scholar] [CrossRef] [Green Version]
  44. Minnis, P.; Sun-Mack, S.; Chen, Y.; Chang, F.-L.; Yost, C.R.; Smith, W.L.; Heck, P.W.; Arduini, R.F.; Bedka, S.T.; Yi, Y.; et al. CERES MODIS Cloud product retrievals for edition 4-Part I: Algorithm changes. IEEE Trans. Geosci. Remote Sens. 2021, 59, 2744–2780. [Google Scholar] [CrossRef]
  45. Chen, G.; Iwasaki, T.; Qin, H.; Sha, W. Evaluation of the warm-season diurnal variability over east Asia in recent reanalysis JRA-55, ERA-Interim, NCEP CFSR, and NASA MERRA. J. Clim. 2014, 27, 5517–5537. [Google Scholar] [CrossRef]
  46. Yi, Y.; Kimball, J.S.; Jones, L.A.; Reichle, R.; McDonald, K.C. Evaluation of MERRA land surface estimates in preparation for the soil moisture active passive mission. J. Clim. 2011, 24, 3797–3816. [Google Scholar] [CrossRef] [Green Version]
  47. Wang, A.; Zeng, X. Evaluation of multireanalysis products with in situ observations over the Tibetan Plateau. J. Geophys. Res. Atmos. 2012, 117, 1–12. [Google Scholar] [CrossRef]
  48. You, Q.; Fraedrich, K.; Ren, G.; Pepin, N.; Kang, S. Variability of temperature in the Tibetan Plateau based on homogenized surface stations and reanalysis data. Int. J. Climatol. 2013, 33, 1337–1347. [Google Scholar] [CrossRef] [Green Version]
  49. Peng, X. Global Solar Radiation Reanalysis Product Error and Influence Factor Analysis. Doctoral Dissertation, Nanjing University, Nanjing, China, 2019. (In Chinese). [Google Scholar]
  50. Boilley, A.; Wald, L. Comparison between meteorological re-analyses from ERA-Interim and MERRA and measurements of daily solar irradiation at surface. Renew. Energy 2015, 75, 135–143. [Google Scholar] [CrossRef]
  51. Tahir, Z.U.R.; Azhar, M.; Blanc, P.; Asim, M.; Imran, S.; Hayat, N.; Shahid, H.; Ali, H. The evaluation of reanalysis and analysis products of solar radiation for Sindh province, Pakistan. Renew. Energy 2020, 145, 347–362. [Google Scholar] [CrossRef]
  52. Dolinar, E.K.; Dong, X.; Xi, B.; Jiang, J.H.; Loeb, N.G. A clear-sky radiation closure study using a one-dimensional radiative transfer model and collocated satellite-surface-reanalysis data sets. J. Geophys. Res. Atmos. 2016, 121, 13–698. [Google Scholar] [CrossRef] [Green Version]
  53. Tahir, Z.U.R.; Azhar, M.; Mumtaz, M.; Asim, M.; Moeenuddin, G.; Sharif, H.; Hassan, S. Evaluation of the reanalysis surface solar radiation from NCEP, ECMWF, NASA, and JMA using surface observations for Balochistan, Pakistan. J. Renew. Sustain. Energy 2020, 12, 023703. [Google Scholar] [CrossRef]
  54. Babar, B.; Graversen, R.; Boström, T. Solar radiation estimation at high latitudes: Assessment of the CMSAF databases, ASR and ERA5. Sol. Energy 2019, 182, 397–411. [Google Scholar] [CrossRef]
Figure 1. Map of the studied area.
Remotesensing 13 04191 g001
Figure 2. Annual variations of season average data of each radiation component in 2018. DSW: downward short-wave solar radiation, USW: upward short-wave solar radiation, DLW: downward long-wave solar radiation, ULW: upward long-wave solar radiation.
Remotesensing 13 04191 g002
Figure 3. Scatter diagram of surface-observed and satellite-retrieved radiation components. (a) DSW: downward short-wave solar radiation, (b) USW: upward short-wave solar radiation, (c) DLW: downward long-wave solar radiation, (d) ULW: upward long-wave solar radiation.
Remotesensing 13 04191 g003
Figure 4. Scatter diagram of surface-observed and satellite-retrieved surface-reflected radiation.
Remotesensing 13 04191 g004
Figure 5. Annual variation characteristics of daily averaged radiation of ERA-5, MERRA2, and observation data.
Remotesensing 13 04191 g005
Figure 6. Scatter diagram of absorbed short-wave radiation and effective long-wave radiation from ERA-5, MERRA2 and observation data.
Remotesensing 13 04191 g006
Figure 7. Scatter diagram of JRA-55 and surface observed radiation.
Remotesensing 13 04191 g007
Figure 8. Scatter diagram of daily kt for observed data versus reanalysis dataset.
Remotesensing 13 04191 g008
Table 1. Statistical table of differences between CERES satellite-retrieved products and surface observation data.
DSWUSWNSWDLWULWNLW
r0.970.480.850.980.990.99
MB (W·m−2)35.3439.4031.6−9.81−4.78−7.29
rMB (%)8.5133.128.51−3.71−1.32−2.51
RMSE (W·m−2)45.2749.5542.316.3612.36−12.35
Table 2. Statistic table of the differences among ERA-5, MERRA2, and the ground-based observation data.
NSWNLW
ERA5MERRA2ERA5MERRA2
r0.910.880.920.88
MB (W·m−2)11.797.469.226.39
rMB (%)3.98%2.52%−9.37%−6.50%
RMSE (W·m−2)46.3150.0816.3317.36
Table 3. Statistics of the difference between JRA-55 and observation data.
DSWUSWNSWDLWULWNLW
r0.940.840.910.940.930.94
MB (W·m−2)−26.03−66.7616.5110.4220.9815.71
rMB (%)−7.43−68.073.743.955.794.87
RMSE (W·m−2)98.4793.0416.5123.1743.4433.30
Table 4. The estimated relative mean bias of reanalysis datasets under different cloud cover conditions (a represents the ERA5 and MERRA2 and b represents the JRA-55, unit: %).
aNSW (%)NLW (%)
ERA5MERRA2ERA5MERRA2
Sunny5.931.21−4.22−4.62
Partly cloudy6.063.67−5.42−3.80
Cloudy2.691.71−13.16−9.00
Overcast0.762.04−16.88−9.69
bDSW (%)USW (%)DLW (%)ULW (%)
Sunny−2.94−61.893.116.11
Partly cloudy−3.6−71.963.245.03
Cloudy−9.99−63.43.524.51
Table 5. The estimated relative mean bias of the reanalysis dataset under different cloud cover conditions.
DatasetSpringSummerAutumnWinter
rMB (%)rrMB (%)rrMB (%)rrMB (%)r
CERES10.40.9620.10.94−34.20.21−68.20.19
JRA-550.60.754.2 0.85 −11.30.38−27.40.28
ERA533.70.9142.2 0.48 9.80.52−16.10.78
MERRA211.20.9423.1 0.21 −22.00.41−70.40.16
Table 6. Comparison between observed and estimated data after bias correction.
DatasetNSWNLW
rRMSE
(W·m−2)
MB
(W·m−2)
rMB
(%)
rRMSE
(W·m−2)
MB
(W·m−2)
rMB
(%)
CERES0.8542.331.68.510.99−12.35−7.29−2.51
JRA−550.9148.6416.513.740.9433.3015.714.87
ERA50.9426.418.972.560.9512.017.82−5.73
MERRA20.9027.345.622.530.9113.243.85−3.35
Publisher’s Note: MDPI stays neutral with regard to jurisdictional claims in published maps and institutional affiliations.

