
Recent Progress on Vegetation Remote Sensing Using Spaceborne GNSS-Reflectometry


Abstract
:
1. Introduction
2. Research Status
2.1. Ground-Based GNSS-R Vegetation Remote Sensing Research
2.2. Airborne GNSS-R Vegetation Remote Sensing Experiments
2.3. Spaceborne GNSS-R Observation Experiment
2.4. Theoretical Model Research
3. Existing Problems
3.1. Polarization Characteristics
3.2. Utilization of Observation Angle for Vegetation Biomass Monitoring
3.3. Better Understanding of the Coherent and Incoherent Scattering of GNSS Signal
3.4. Improve Our Understanding of the Mechanism Model for Vegetation
4. Model Simulations and Discussion
4.1. Theoretical Models
4.2. Polarization Difference
4.3. Differences in Coherent and Incoherent Scattering Characteristics
4.4. The Influence of Observation Geometry on Scattering Characteristics
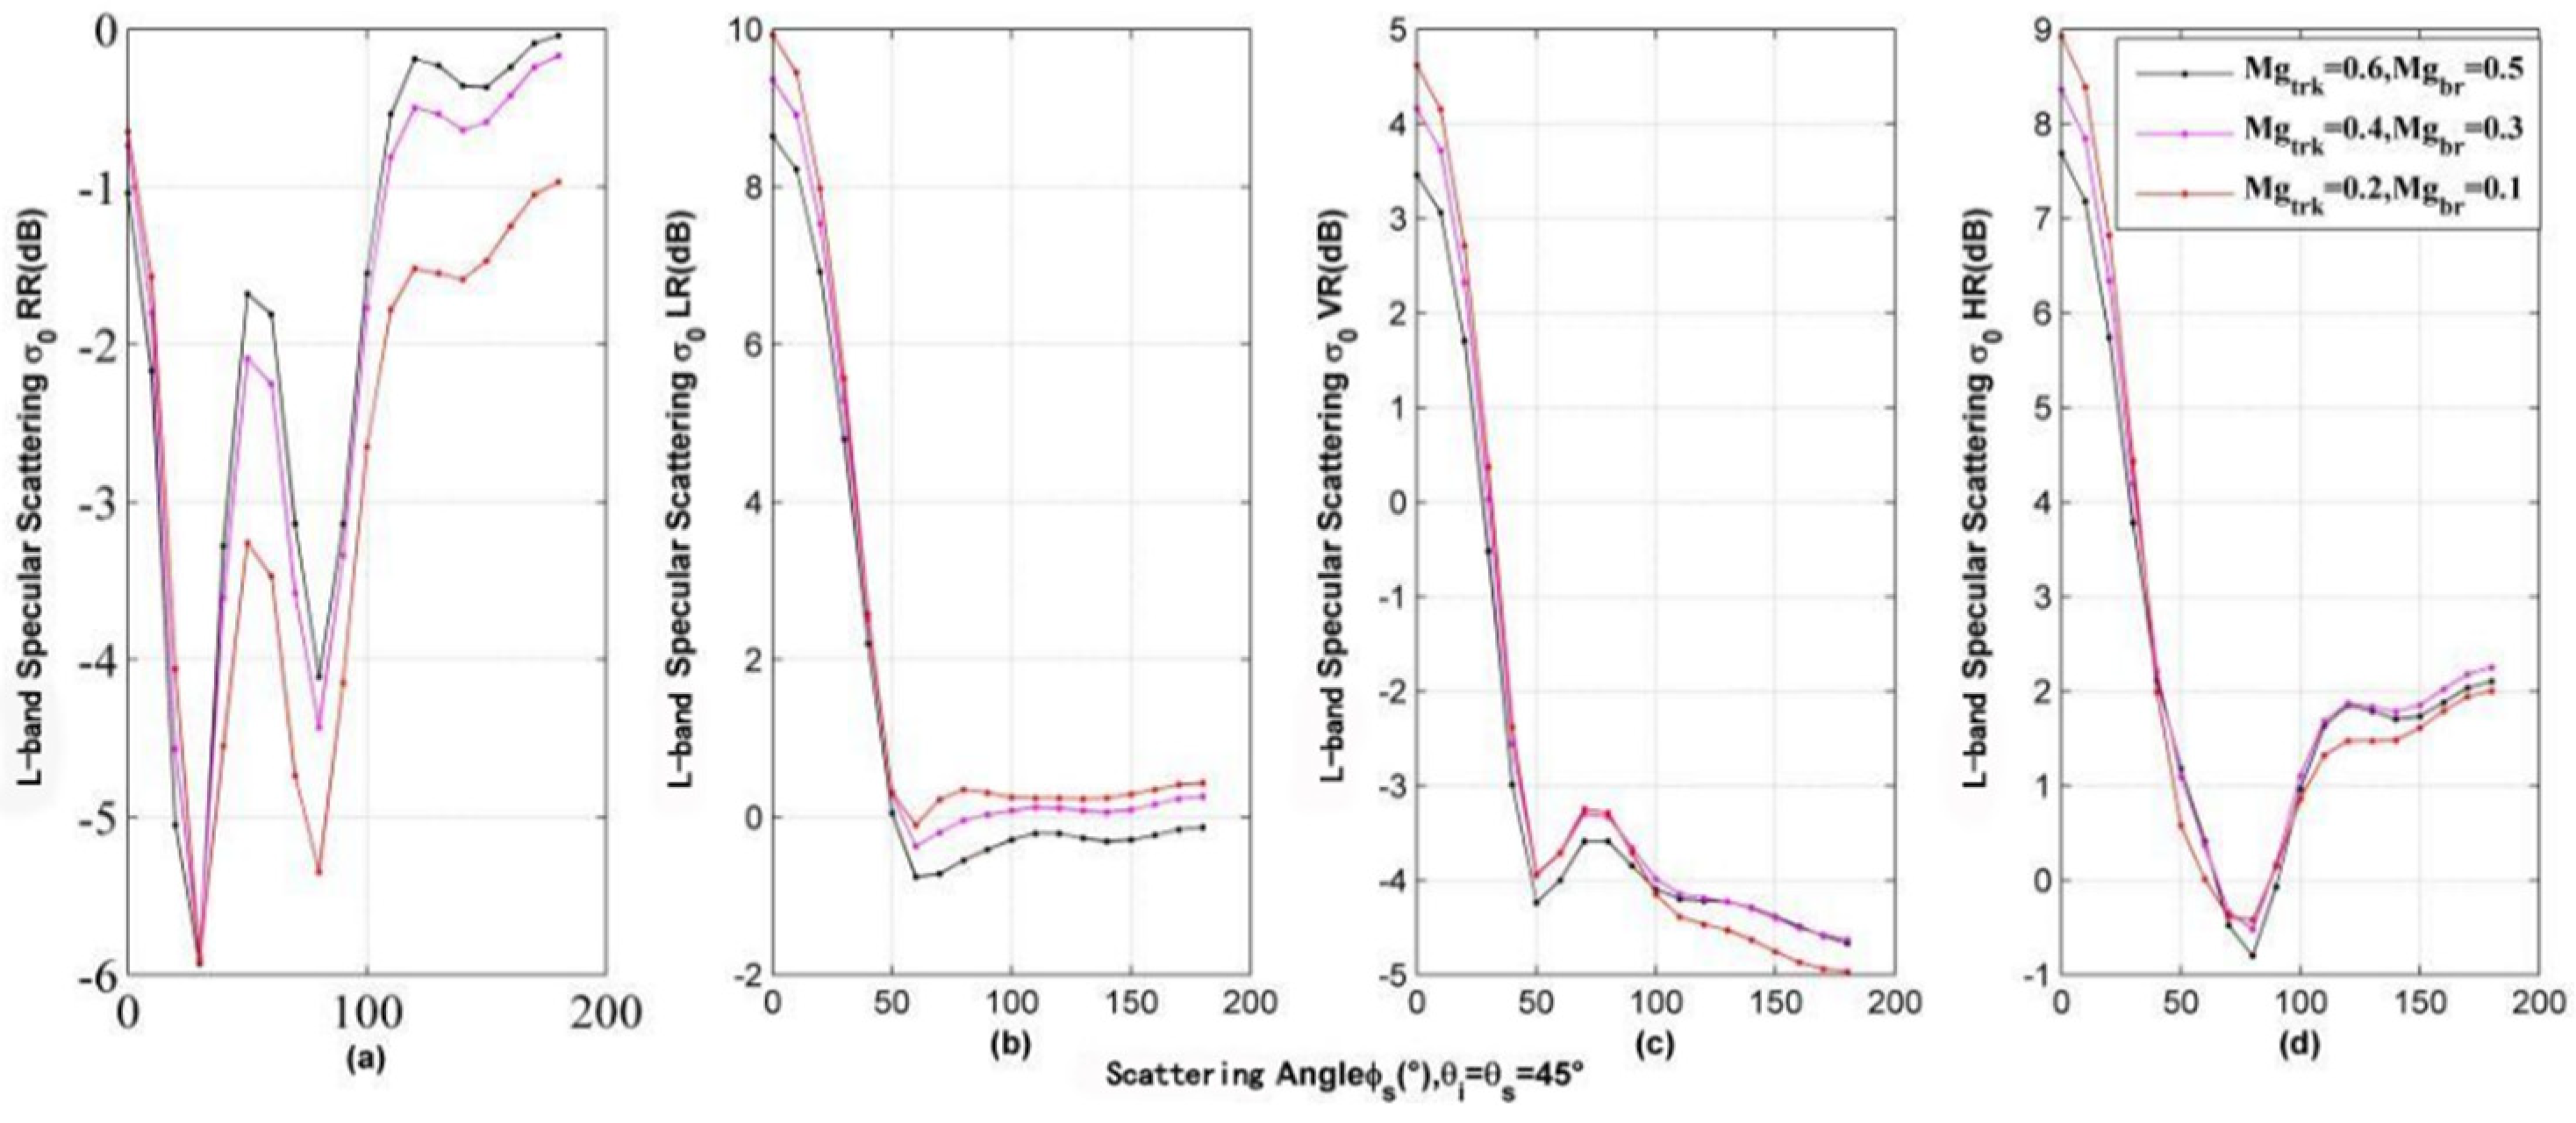
4.5. Different Vegetation Parameters at Various Polarizations on the Scattering Characteristics
4.6. Development of Retrieval Algorithm
5. Conclusions
Author Contributions
Funding
Institutional Review Board Statement
Informed Consent Statement
Data Availability Statement
Acknowledgments
Conflicts of Interest
References
- Hall, C.D.; Cordey, R.A. Multistatic Scatterometry. In Proceedings of the International Geoscience and Remote Sensing Symposium, ‘Remote Sensing: Moving Toward the 21st Century’, Edinburgh, UK, 12–16 September 1988. [Google Scholar]
- Martin-Neira, M.A. Passive Reflectometry and Interferometry System (PARIS): Application to ocean altimetry. ESA J. 1993, 17, 331–355. [Google Scholar]
- Zavorotny, V.U.; Gleason, S.; Cardellach, E.; Camps, A. Tutorial on Remote Sensing Using GNSS Bistatic Radar of Opportunity. IEEE Geosci. Remote Sens. Mag. 2014, 2, 8–45. [Google Scholar] [CrossRef] [Green Version]
- Gleason, S.; Adjrad, M.; Unwin, M. Sensing ocean, ice and land reflected signals from space: Results from the UK-DMC GPS reflectometry experiment. In Proceedings of the 18th International Technical Meeting of the Satellite Division of The Institute of Navigation, Palm Springs, CA, USA, 1 January 2005; pp. 1679–1685. [Google Scholar]
- Ruf, C.S.; Chew, C.; Lang, T.; Morris, M.G.; Nave, K.; Ridley, A.; Balasubramaniam, R. A New Paradigm in Earth Environmental Monitoring with the CYGNSS Small Satellite Constellation. Sci. Rep. 2018, 8, 8782. [Google Scholar] [CrossRef] [Green Version]
- Li, W.; Cardellach, E.; Fabra, F.; Rius, A.; Ribó, S.; Martín-Neira, M. First spaceborne phase altimetry over sea ice using TechDemoSat-1 GNSS-R signals. Geophys. Res. Lett. 2017, 44, 8369–8376. [Google Scholar] [CrossRef]
- Mayers, D.; Ruf, C. Tropical Cyclone Center Fix Using CYGNSS Winds. J. Appl. Meteorol. Clim. 2019, 58, 1993–2003. [Google Scholar] [CrossRef]
- Warnock, A.; Ruf, C. Response to Variations in River Flowrate by a Spaceborne GNSS-R River Width Estimator. Remote Sens. 2019, 11, 2450. [Google Scholar] [CrossRef] [Green Version]
- Morris, M.; Chew, C.; Reager, J.T.; Shah, R.; Zuffada, C. A novel approach to monitoring wetland dynamics using CYGNSS: Everglades case study. Remote Sens. Environ. 2019, 233, 111417. [Google Scholar] [CrossRef]
- Chew, C.; Reager, J.T.; Small, E. CYGNSS data map flood inundation during the 2017 Atlantic hurricane season. Sci. Rep. 2018, 8, 9336. [Google Scholar] [CrossRef] [PubMed]
- Sun, Y.; Liu, C.; Du, Q. Global navigation satellite system occultation sounder II (GNOS II). In Proceedings of the 2017 IEEE International Geoscience and Remote Sensing Symposium (IGARSS), Fort Worth, TX, USA, 23–28 July 2017; pp. 1189–1192. [Google Scholar]
- Munoz-Martin, J.; Llaveria, D.; Herbert, C.; Pablos, M.; Park, H.; Camps, A. Soil Moisture Estimation Synergy Using GNSS-R and L-Band Microwave Radiometry Data from FSSCat/FMPL-2. Remote Sens. 2021, 13, 994. [Google Scholar] [CrossRef]
- Unwin, M.J.; Pierdicca, N.; Cardellach, E.; Rautiainen, K.; Foti, G.; Blunt, P.; Guerriero, L.; Santi, E.; Tossaint, M. An Introduction to the HydroGNSS GNSS Reflectometry Remote Sensing Mission. IEEE J. Sel. Top. Appl. Earth Obs. Remote Sens. 2021, 99, 1. [Google Scholar]
- Kerr, Y.H.; Waldteufel, P.; Wigneron, J.-P.; Delwart, S.; Cabot, F.; Boutin, J.; Escorihuela, M.J.; Font, J.; Reul, N.; Gruhier, C.; et al. The SMOS Mission: New Tool for Monitoring Key Elements ofthe Global Water Cycle. Proc. IEEE 2010, 98, 666–687. [Google Scholar] [CrossRef] [Green Version]
- Entekhabi, D.; Njoku, E.G.; O’Neill, P.; Kellogg, K.H.; Crow, W.; Edelstein, W.N.; Entin, J.K.; Goodman, S.D.; Jackson, T.J.; Johnson, J.; et al. The Soil Moisture Active Passive (SMAP) Mission. Proc. IEEE 2010, 98, 704–716. [Google Scholar] [CrossRef]
- Chew, C.; Small, E. Estimating inundation extent using CYGNSS data: A conceptual modeling study. Remote Sens. Environ. 2020, 246, 111869. [Google Scholar] [CrossRef]
- Kim, H.; Lakshmi, V. Use of Cyclone Global Navigation Satellite System (CyGNSS) Observations for Estimation of Soil Moisture. Geophys. Res. Lett. 2018, 45, 8272–8282. [Google Scholar] [CrossRef] [Green Version]
- Clarizia, M.P.; Pierdicca, N.; Costantini, F. Analysis of CYGNSS data for soil moisture retrieval. IEEE J. Sel. Top. Appl. Earth Obs. Remote Sens. 2019, 12, 2227–2235. [Google Scholar] [CrossRef]
- Al-Khaldi, M.M.; Johnson, J.T.; O’Brien, A.J.; Balenzano, A.; Mattia, F. Time-Series Retrieval of Soil Moisture Using CYGNSS. IEEE Trans. Geosci. Remote Sens. 2019, 57, 4322–4331. [Google Scholar] [CrossRef]
- Yan, Q.; Huang, W.; Jin, S.; Jia, Y. Pan-tropical soil moisture mapping based on a three-layer model from CYGNSS GNSS-R data. Remote Sens. Environ. 2020, 247, 111944. [Google Scholar] [CrossRef]
- Camps, A.; Vall·llossera, M.; Park, H.; Portal, G.; Rossato, L. Sensitivity of TDS-1 GNSS-R Reflectivity to Soil Moisture: Global and Regional Differences and Impact of Different Spatial Scales. Remote Sens. 2018, 10, 1856. [Google Scholar] [CrossRef] [Green Version]
- Ferrazzoli, P.; Guerriero, L.; Pierdicca, N.; Rahmoune, R. Forest biomass monitoring with GNSS-R: Theoretical simulations. Adv. Space Res. 2011, 47, 1823–1832. [Google Scholar] [CrossRef]
- Loria, E.; O’Brien, A.; Zavorotny, V.; Lavalle, M.; Chew, C.; Shah, R.; Zuffada, C. Analysis of Wetland Extent Retrieval Accuracy Using CYGNSS. In Proceedings of the IGARSS 2019–2019 IEEE International Geoscience and Remote Sensing Symposium 2019, Yokohama, Japan, 28 July–2 August 2019. [Google Scholar]
- Haase, J.S.; Xie, F.; Muradyan, P.; Garrison, J.L.; Lulich, T.; Voo, J.; Larson, K.M. New Atmospheric Observations from the Airborne GNSS Instrument System for Multistatic and Occultation Sensing (GISMOS). In Proceedings of the AGU Fall Meeting Abstracts 2008, San Francisco, CA, USA, 15–19 December 2008. [Google Scholar]
- Chew, C.; Small, E.E.; Larson, K.M. An algorithm for soil moisture estimation using GPS-interferometric reflectometry for bare and vegetated soil. GPS Solutions 2015, 20, 525–537. [Google Scholar] [CrossRef]
- Rodriguez-Alvarez, N.; Bosch, X.; Camps, A.; Ramos-Perez, I.; Valencia, E.; Park, H.; Vall-Llossera, M. Vegetation Water Content Estimation Using GNSS Measurements. IEEE Geosci. Remote Sens. Lett. 2011, 9, 282–286. [Google Scholar] [CrossRef]
- Rodriguez-Alvarez, N.; Camps, A.; Vall-Llossera, M.; Bosch, X.; Monerris, A.; Ramos-Perez, I.; Valencia, E.; Marchan-Hernandez, J.F.; Martínez-Fernández, J.; Baroncini-Turricchia, G.; et al. Land Geophysical Parameters Retrieval Using the Interference Pattern GNSS-R Technique. IEEE Trans. Geosci. Remote Sens. 2010, 49, 71–84. [Google Scholar] [CrossRef]
- Arroyo, A.A.; Camps, A.; Aguasca, A.; Forte, G.; Monerris, A.; Rüdiger, C.; Walker, J.P.; Park, H.; Pascual, D.; Onrubia, R. Improving the Accuracy of Soil Moisture Retrievals Using the Phase Difference of the Dual-Polarization GNSS-R Interference Patterns. IEEE Geosci. Remote Sens. Lett. 2014, 11, 2090–2094. [Google Scholar] [CrossRef] [Green Version]
- Egido, A.E. GNSS Reflectometry for Land Remote Sensing Applications; Universitat Politècnica de Catalunya: Barcelona, Spain, 2014. [Google Scholar]
- Carreno-Luengo, H.; Camps, A.; Querol, J.; Forte, G. First Results of a GNSS-R Experiment from a Stratospheric Balloon Over Boreal Forests. IEEE Trans. Geosci. Remote Sens. 2015, 54, 2652–2663. [Google Scholar] [CrossRef] [Green Version]
- Egido, A.; Caparrini, M.; Ruffini, G.; Paloscia, S.; Santi, E.; Guerriero, L.; Pierdicca, N.; Floury, N. Global Navigation Satellite Systems Reflectometry as a Remote Sensing Tool for Agriculture. Remote Sens. 2012, 4, 2356–2372. [Google Scholar] [CrossRef] [Green Version]
- Egido, A.; Paloscia, S.; Motte, E.; Guerriero, L.; Pierdicca, N.; Caparrini, M.; Santi, E.; Fontanelli, G.; Floury, N. Airborne GNSS-R Polarimetric Measurements for Soil Moisture and Above-Ground Biomass Estimation. IEEE J. Sel. Top. Appl. Earth Obs. Remote Sens. 2014, 7, 1522–1532. [Google Scholar] [CrossRef]
- Zribi, M.; Guyon, D.; Motte, E.; Dayau, S.; Wigneron, J.P.; Baghdadi, N.; Pierdicca, N. Performance of GNSS-R GLORI data for biomass estimation over the Landes forest. Int. J. Appl. Earth Obs. Geoinf. 2018, 74, 150–158. [Google Scholar] [CrossRef]
- Camps, A.; Park, H.; Pablos, M. Sensitivity of GNSS-R spaceborne observations to soil moisture and vegetation. IEEE J. Sel. Top. Appl. Earth Obs. Remote Sens. 2016, 9, 4730–4742. [Google Scholar] [CrossRef] [Green Version]
- Carreno-Luengo, H.; Lowe, S.; Zuffada, C.; Esterhuizen, S.; Oveisgharan, S. Spaceborne GNSS-R from the SMAP Mission: First Assessment of Polarimetric Scatterometry over Land and Cryosphere. Remote Sens. 2017, 9, 362. [Google Scholar] [CrossRef] [Green Version]
- Carreno-Luengo, H.; Luzi, G.; Crosetto, M. Above-Ground Biomass Retrieval over Tropical Forests: A Novel GNSS-R Approach with CyGNSS. Remote Sens. 2020, 12, 1368. [Google Scholar] [CrossRef]
- Santi, E.; Paloscia, S.; Pettinato, S. Remote sensing of forest biomass using GNSS reflectometry. IEEE J. Sel. Top. Appl. Earth Obs. Remote Sens. 2020, 13, 2351–2368. [Google Scholar] [CrossRef]
- Zavorotny, V.; Voronovich, A. Scattering of GPS signals from the ocean with wind remote sensing application. IEEE Trans. Geosci. Remote Sens. 2000, 38, 951–964. [Google Scholar] [CrossRef] [Green Version]
- Nievinski, F.G.; Larson, K.M. Forward modeling of GPS multipath for near-surface reflectometry and positioning applications. GPS Solut. 2013, 18, 309–322. [Google Scholar] [CrossRef]
- Larson, K.M. GPS interferometric reflectometry: Applications to surface soil moisture, snow depth, and vegetation water content in the western United States. Wiley Interdiscip. Rev. Water 2016, 3, 775–787. [Google Scholar] [CrossRef]
- Chew, C.C.; Small, E.E.; Larson, K.M. Effects of Near-Surface Soil Moisture on GPS SNR Data: Development of a Retrieval Algorithm for Soil Moisture. IEEE Trans. Geosci. Remote Sens. 2014, 52, 537–543. [Google Scholar] [CrossRef]
- Mccreight, J.L.; Small, E.E.; Larson, K.M. Snow depth, density, and SWE estimates derived from GPS reflection data: Validation in the western U.S. Water Resour. Res. 2015, 50, 6892–6909. [Google Scholar] [CrossRef]
- Chew, C.C.; Small, E.E.; Larson, K.M.; Zavorotny, V.U. Vegetation Sensing Using GPS-Interferometric Reflectometry: Theoretical Effects of Canopy Parameters on Signal-to-Noise Ratio Data. IEEE Trans. Geosci. Remote Sens. 2015, 53, 2755–2764. [Google Scholar] [CrossRef]
- Masters, D.S. Surface Remote Sensing Applications of GNSS Bistatic Radar: Soil Moisture and Aircraft Altimetry; University of Colorado: Boulder, CO, USA, 2004. [Google Scholar]
- Pierdicca, N.; Guerriero, L.; Giusto, R.; Brogioni, M.; Egido, A. SAVERS: A Simulator of GNSS Reflections from Bare and Vegetated Soils. IEEE Trans. Geosci. Remote Sens. 2014, 52, 6542–6554. [Google Scholar] [CrossRef]
- Kurum, M.; Deshpande, M.; Joseph, A.T.; O’Neill, P.E.; Lang, R.H.; Eroglu, O. SCoBi-Veg: A Generalized Bistatic Scattering Model of Reflectometry from Vegetation for Signals of Opportunity Applications. IEEE Trans. Geosci. Remote Sens. 2018, 57, 1049–1068. [Google Scholar] [CrossRef]
- Martínez-Vazquez, A. Emisividad Polarimétrica del Terreno Efecto de la Vegetación. Master’s Thesis, Universitat Politècnica de Catalunya, Barcelona, Spain, 2001. [Google Scholar]
- Ledesma-Galera, I. Estudio Experimental del Comportamiento Radiométrico de LAS Superfícies naturales. Master’s Thesis, Universitat Politècnica de Catalunya, Barcelona, Spain, 2002. [Google Scholar]
- Carreno-Luengo, H.; Amèzaga, A.; Vidal, D.; Olivé, R.; Munoz, J.F.; Camps, A. First Polarimetric GNSS-R Measurements from a Stratospheric Flight over Boreal Forests. Remote Sens. 2015, 7, 13120–13138. [Google Scholar] [CrossRef] [Green Version]
- Park, H.; Camps, A.; Castellvi, J.; Muro, J. Generic Performance Simulator of Spaceborne GNSS-Reflectometer for Land Applications. IEEE J. Sel. Top. Appl. Earth Obs. Remote Sens. 2020, 13, 3179–3191. [Google Scholar] [CrossRef]
- Wu, X.; Jin, S. GNSS-Reflectometry: Forest canopies polarization scattering properties and modeling. Adv. Space Res. 2014, 54, 863–870. [Google Scholar] [CrossRef]
- Wu, X.; Jin, S. Models and Theoretical Analysis of SoOp Circular Polarization Bistatic Scattering for Random Rough Surface. Remote Sens. 2020, 12, 1506. [Google Scholar] [CrossRef]
- Wu, X.; Xu, J.; Duan, Z.; Jin, S. Bistatic Scattering Simulations of Circular and Linear Polarizations Over Land Surface for Signals of Opportunity Reflectometry. Geosci. Lett. 2021, 8, 11. [Google Scholar] [CrossRef]
- Ulaby, F.T.; Sarabandi, K.; Mcdonald, K.; Whitt, M. Michigan microwave canopy scattering model. Int. J. Remote Sens. 1990, 11, 1223–1253. [Google Scholar] [CrossRef]
- Katzberg, S.J.; Torres, O.; Grant, M.S. Utilizing calibrated GPS reflected signals to estimate soil reflectivity and dielectric con-stant: Results from SMEX02. Remote Sens. Environ. 2006, 100, 17–28. [Google Scholar] [CrossRef] [Green Version]
- Zavorotny, V.; Masters, D.; Gasiewski, A.; Bartram, B.; Katzberg, S.; Axelrad, P.; Zamora, R. Seasonal polarimetric measurements of soil moisture using tower-based GPS bistatic radar. In Proceedings of the IEEE International Geoscience and Remote Sensing Symposium, Toulouse, France, 21–25 July 2003. [Google Scholar]
- Egido, A.; Caparrini, M.; Guerriero, L.; Pierdicca, N.; Paloscia, S.; Santi, E.; Brogioni, M. LEiMON Land Monitoring with Navigation Signals. In Proceedings of the 2011 ESA/ESTEC, Noordwijk, The Netherlands, 9–10 November 2011. [Google Scholar]
- Ulaby, F.T.; Elachi, C. Radar Polarimetry for Geoscience Applications; Norwood: Fairport, NY, USA, 1990. [Google Scholar]
- Chew, C.C.; Small, E.E. Soil Moisture Sensing Using Spaceborne GNSS Reflections: Comparison of CYGNSS Reflectivity to SMAP Soil Moisture. Geophys. Res. Lett. 2018, 45, 4049–4057. [Google Scholar] [CrossRef] [Green Version]
- Calabia, A.; Molina, I.; Jin, S. Soil Moisture Content from GNSS Reflectometry Using Dielectric Permittivity from Fresnel Re-flection Coefficients. Remote Sens. 2020, 12, 122. [Google Scholar] [CrossRef] [Green Version]
- Munoz-Martin, J.F.; Onrubia, R.; Pascual, D.; Park, H.; Camps, A.; Rüdiger, C.; Walker, J.; Monerris, A. Untangling the Incoherent and Coherent Scattering Components in GNSS-R and Novel Applications. Remote Sens. 2020, 12, 1208. [Google Scholar] [CrossRef] [Green Version]
- Camps, A.; Munoz-Martin, J.F. Analytical Computation of the Spatial Resolution in GNSS-R and Experimental Validation at L1 and L5. Remote Sens. 2020, 12, 3910. [Google Scholar] [CrossRef]
- Wu, X.; Ma, W.; Xia, J.; Bai, W.; Jin, S.; Calabia, A. Spaceborne GNSS-R Soil Moisture Retrieval: Status, Development Opportunities, and Challenges. Remote Sens. 2020, 13, 45. [Google Scholar] [CrossRef]
- Marchan-Hernandez, J.F.; Camps, A.; Rodriguez-Alvarez, N.; Valencia, E.; Bosch-Lluis, X.; Ramos-Pérez, I. An Efficient Algorithm to the Simulation of Delay–Doppler Maps of Reflected Global Navigation Satellite System Signals. IEEE Trans. Geosci. Remote Sens. 2009, 47, 2733–2740. [Google Scholar] [CrossRef]
- Carreno-Luengo, H.; Camps, A. Unified GNSS-R Formulation Including Coherent and Incoherent Scattering Components. In Proceedings of the IEEE International Geoscience and Remote Sensing Symposium (IGARSS), Beijing, China, 10–15 July 2016. [Google Scholar]
- Carreno-Luengo, H.; Ruf, C.; Warnock, A.; Brunner, K. Investigating the Impact of Coherent and Incoherent Scattering Terms in GNSS-R Delay Doppler Maps. In Proceedings of the IEEE International Geoscience and Remote Sensing Symposium (IGARSS), Waikoloa, HI, USA, 26 September–2 October 2020. [Google Scholar]
- Fung, A.K. Microwave Scattering and Emission Models and Their Applicati; Artech House: Norwood, MA, USA, 2009. [Google Scholar]


| V Pol | H Pol | LHCP Pol | RHCP Pol | +45° Pol | −45° Pol | |
|---|---|---|---|---|---|---|
| Modified Stokes vector |
| Stand | Aspen |
|---|---|
| Trunk density (number/ha) | 1100 |
| Trunk height (m) | 8 |
| Trunk diameter (cm) | 24 |
| Trunk moisture (gravimetric) | 0.5 |
| Crown depth (m) | 2 |
| Brunch density (number/m3) | 4.1 |
| Branch length (m) | 0.75 |
| Branch diameter (cm) | 0.7 |
| Branch moisture (gravimetric) | 0.4 |
| Stand | Soil | Trunk | Branch |
|---|---|---|---|
| Aspen | 5.99 + 0.99 i | 14.49 + 4.76 i | 10.19 + 3.36 i |
| Stand 1 | Stand 2 | Stand 3 | Stand 4 | |
|---|---|---|---|---|
| Trunk diameter (cm) | 24 | 30 | 24 | 30 |
| Branch diameter (cm) | 0.7 | 0.7 | 0.9 | 0.9 |
| Forest 1 (Trees/ha) | Forest 2 (Trees/ha) | Forest 3 (Trees/ha) | Forest 4 (Trees/ha) | |
|---|---|---|---|---|
| Tree density | 2000 | 1000 | 700 | 500 |
| Trunk | Branch | |||
|---|---|---|---|---|
| Moisture | Permittivity | Moisture | Permittivity | |
| Aspen1 | 0.6 | 41.84 + 18.93 i | 0.5 | 32.97 + 14.73 i |
| Aspen2 | 0.4 | 25.60 + 11.25 i | 0.3 | 19.29 + 8.28 i |
| Aspen3 | 0.2 | 13.33 + 5.47 i | 0.1 | 6.67 + 2.33 i |
Publisher’s Note: MDPI stays neutral with regard to jurisdictional claims in published maps and institutional affiliations. |
© 2021 by the authors. Licensee MDPI, Basel, Switzerland. This article is an open access article distributed under the terms and conditions of the Creative Commons Attribution (CC BY) license (https://creativecommons.org/licenses/by/4.0/).
Share and Cite
Wu, X.; Guo, P.; Sun, Y.; Liang, H.; Zhang, X.; Bai, W. Recent Progress on Vegetation Remote Sensing Using Spaceborne GNSS-Reflectometry. Remote Sens. 2021, 13, 4244. https://doi.org/10.3390/rs13214244
Wu X, Guo P, Sun Y, Liang H, Zhang X, Bai W. Recent Progress on Vegetation Remote Sensing Using Spaceborne GNSS-Reflectometry. Remote Sensing. 2021; 13(21):4244. https://doi.org/10.3390/rs13214244
Chicago/Turabian StyleWu, Xuerui, Peng Guo, Yueqiang Sun, Hong Liang, Xinggang Zhang, and Weihua Bai. 2021. "Recent Progress on Vegetation Remote Sensing Using Spaceborne GNSS-Reflectometry" Remote Sensing 13, no. 21: 4244. https://doi.org/10.3390/rs13214244
APA StyleWu, X., Guo, P., Sun, Y., Liang, H., Zhang, X., & Bai, W. (2021). Recent Progress on Vegetation Remote Sensing Using Spaceborne GNSS-Reflectometry. Remote Sensing, 13(21), 4244. https://doi.org/10.3390/rs13214244