Article

Landsat-Based Monitoring of the Heat Effects of Urbanization Directions and Types in Hangzhou City from 2000 to 2020

1
Zhejiang Provincial Key Laboratory of Urban Wetlands and Regional Change, Institute of Remote Sensing and Earth Sciences, Hangzhou Normal University, Hangzhou 311121, China
2
Hebei Key Laboratory of Mining Development and Security Technology, Hebei Industrial Technology Institute of Mine Ecological Remediation, College of Mining Engineering, North China University of Science and Technology, Tangshan 063210, China
*
Author to whom correspondence should be addressed.
Remote Sens. 2021, 13(21), 4268; https://doi.org/10.3390/rs13214268
Submission received: 1 September 2021 / Revised: 19 October 2021 / Accepted: 21 October 2021 / Published: 23 October 2021

Abstract

:
Rapid urbanization has produced serious heat effects worldwide. However, the literature lacks a detailed study on heat effects based on the directions and types of urban expansion. In this work, a typical city with an extremely hot summer climate, Hangzhou, was selected as a case study to determine the relationships between the urban heat-effect dynamics and spatiotemporal patterns of impervious surface expansion. Based on long-term Landsat imagery, this study characterized the spatiotemporal patterns of urban expansion and normalized surface temperatures in Hangzhou City from 2000 to 2020 using object-based backdating classification and a generalized single-channel algorithm with the help of a land-use transfer matrix, expansion index, and spatial centroids. Relevant policies, industries, and traffic networks were discussed to help explain urban expansion and thermal environment changes. The results demonstrated that in 2020, the area of impervious surfaces covered 1139.29 km2. The majority of the gains were in farmland, water, and forests, and the annual growth rate was 32.12 km2/year beginning in 2000. During the expansion of impervious surfaces, the city warmed at a slower rate, and more thermal contributions came from sub-urban areas. The southeast-oriented expansion of impervious surfaces was the key reason for the spatiotemporal dynamics of the urban heat effects. The dominant urban edge expansion intensified the local heat effects. This research provides a Landsat-based methodology for better understanding the heat effects of urban expansion.

1. Introduction

Urban areas comprise approximately 5% of the total surface of the Earth [1]. However, more than half of the human population lives in cities [2]. This arrangement has produced a series of global environmental problems due to the replacement of natural land cover with impervious surfaces [3]. Meanwhile, urbanization introduces a number of local modifications, such as anthropogenic heat, emissions, roughness and canyons, multiple solar inter-reflections in packed areas, and diversified shading, most of which alter the radiative forcing and air circulation [4,5]. Heat stress due to these local modifications on land-use types, radiative forcing, and air circulation is one of the most severe challenges facing urban residents [6,7]. This phenomenon is traditionally called the urban heat island effect, and induces the growth of energy consumption, especially in summer. This phenomenon has a strong impact on the local air quality and greenhouse gas emissions [8,9]. Therefore, subjects related to the spatiotemporal patterns of urbanization and its heat effects have attracted wide attention and extensive investigations [10,11,12].
Satellite remote sensing data, such as imagery from Landsat, the Advanced Spaceborne Thermal Emission and Reflection Radiometer (ASTER), the Advanced Very High Resolution Radiometer (AVHRR), and the Moderate Resolution Imaging Spectroradiometer (MODIS), provide thermal infrared bands and spatially explicit earth observations over long-term periods in a comparable and repeatable manner [13,14,15]. Due to their relatively high spatial resolution and long time-sequenced data, Landsat series have become a common measure for characterizing urbanization and its heat effects [11,16,17]. Lu et al. [18] summarized methods to extract impervious surface areas from satellite images, concluding that object-based approaches are preferable for reducing the heterogeneity of the urban landscape, and that Landsat images are valuable for long-term comparisons. Aina et al. [19] used time-series Landsat images to map impervious surfaces and analyzed the urban landscape through change analysis and determining expansion types. As a direct surface phenomenon, the land-use change from natural land cover to impervious surfaces was a common perspective of remote sensing-based monitoring of the urbanization. Namely, the classification of impervious surfaces from Landsat imagery commonly represents the first step. Moreover, an object-based backdating approach based on existing mapping efforts, with a consistent classification scheme, was able to improve the accuracy by decreasing pseudo changes and heterogeneity [18,20]. Then, urbanization patterns were conventionally characterized via the spatiotemporal analysis of impervious surfaces. This type of analysis involves studying areal changes, spatial distribution, and conversion from the land-use transfer matrix; expansion types from expansion index calculations; and directions based on spatial centroid movements [14,21,22,23]. After that, the linkage between land-use changes and local thermal patterns was historically determined in one of two ways: (1) a direct temperature comparison between impervious surfaces and other land-use types or a comparison between temperature at different distances from the city; and (2) indirect analysis based on the temporal phenological changes of urban plants, with the former method being more popular [11,24,25]. Du et al. [26] adopted Landsat-based impervious surface mapping and land surface temperature (LST) retrieval and analyzed urban expansion and its heat-island effects using a transfer matrix and buffer analysis, along with a discussion of driving forces. Estoque et al. [27] conducted a correlation analysis between the density of impervious surfaces or green space and LST and compared the mean LSTs of different sizes, shape complexities, and aggregations of patches of impervious surfaces and green space to quantify the urban heat effect based on Landsat images. Roy et al. [17] assessed land-use dynamics based on Landsat images using areal changes and type conversions and linked the spectral indices of urban expansion to LST through linear regressions. The generalized single-channel algorithm is a mature method with wide applicability that is used to accurately map fine-resolution LSTs [26,27]. Overall, previous studies have closely analyzed the relevant classification methods, the spatiotemporal patterns of urban expansion, the surface urban heat island effects, and the driving forces [24,28,29]. However, there remains a lack of studies relating urban expansion types to local heat effects.
Hangzhou, an emerging “stove city” (which implies an extremely hot summer climate) experienced rapid urban development and an increasing urbanization rate, from 22.96% in 1978 to 61.81% in 2015, thereby becoming the second-hottest metropolitan area in China [14,30]. Urban expansion and its heat effects in Hangzhou City have drawn additional attention due to government planning efforts related to polycentric urban structures and market forces. Nevertheless, prior research was limited to separately studying urban expansion patterns and the land/air temperature changes before 2015. However, the precise up-to-date influences of urban expansion patterns on the thermal environment of Hangzhou City require further exploration. Most notably, the detailed heat effects of different urbanization types and directions in Hangzhou have been insufficiently researched but remain crucial for supporting government planning to achieve urban heat mitigation. Hence, in this study, the spatiotemporal patterns of urban expansion and their heat effects were quantified using object-based backdating classification and the generalized single-channel algorithm based on Landsat imagery between 2000 and 2020. Then, the explicit spatiotemporal effects of urban expansion compared to LST patterns were analyzed with the help of a land-use transfer matrix, an expansion index, and spatial centroids. The specific objectives were to: (1) characterize the spatiotemporal patterns of urban expansion; (2) quantify the spatiotemporal variations in the LST; and (3) analyze the heat effects of urbanization directions and types in Hangzhou City from 2000 to 2020.

2. Materials and Methods

2.1. The Study Area

Hangzhou is the capital of Zhejiang Province in China and the second largest metropolis on the Yangtze River delta. It is located in the lower reaches of the Qiantang River (Figure 1). Based on previous studies, the study area (119°40′38″–120°42′50″E, 30°33′54″–29°50′48″N), Hangzhou City, was selected from the main metropolitan area, which includes the Shangcheng, Xiacheng, Jianggan, Gongshu, Xihu, Binjiang, Xiaoshan, and Yuhang districts, covering 3345.91 km2 [14]. This region has a humid subtropical monsoon climate with distinct urban heat island effects in summer [31]. The study area has an annual average temperature of 17.83 °C and annual precipitation of 1941.23 mm [32,33]. The summer daytime and nighttime temperatures of the area can reach nearly 40 and 20 °C, respectively. In the past two decades, characterized by its famous landscape and rapid economic growth, this area has experienced rapid urbanization, with the urban population rising from 3.73 million in 2000 to 8.13 million in 2019 [32,33]. Moreover, this region has experienced intense land-use changes during urban expansion, and consequently suffered from environmental effects [34].

2.2. Data and Preprocessing
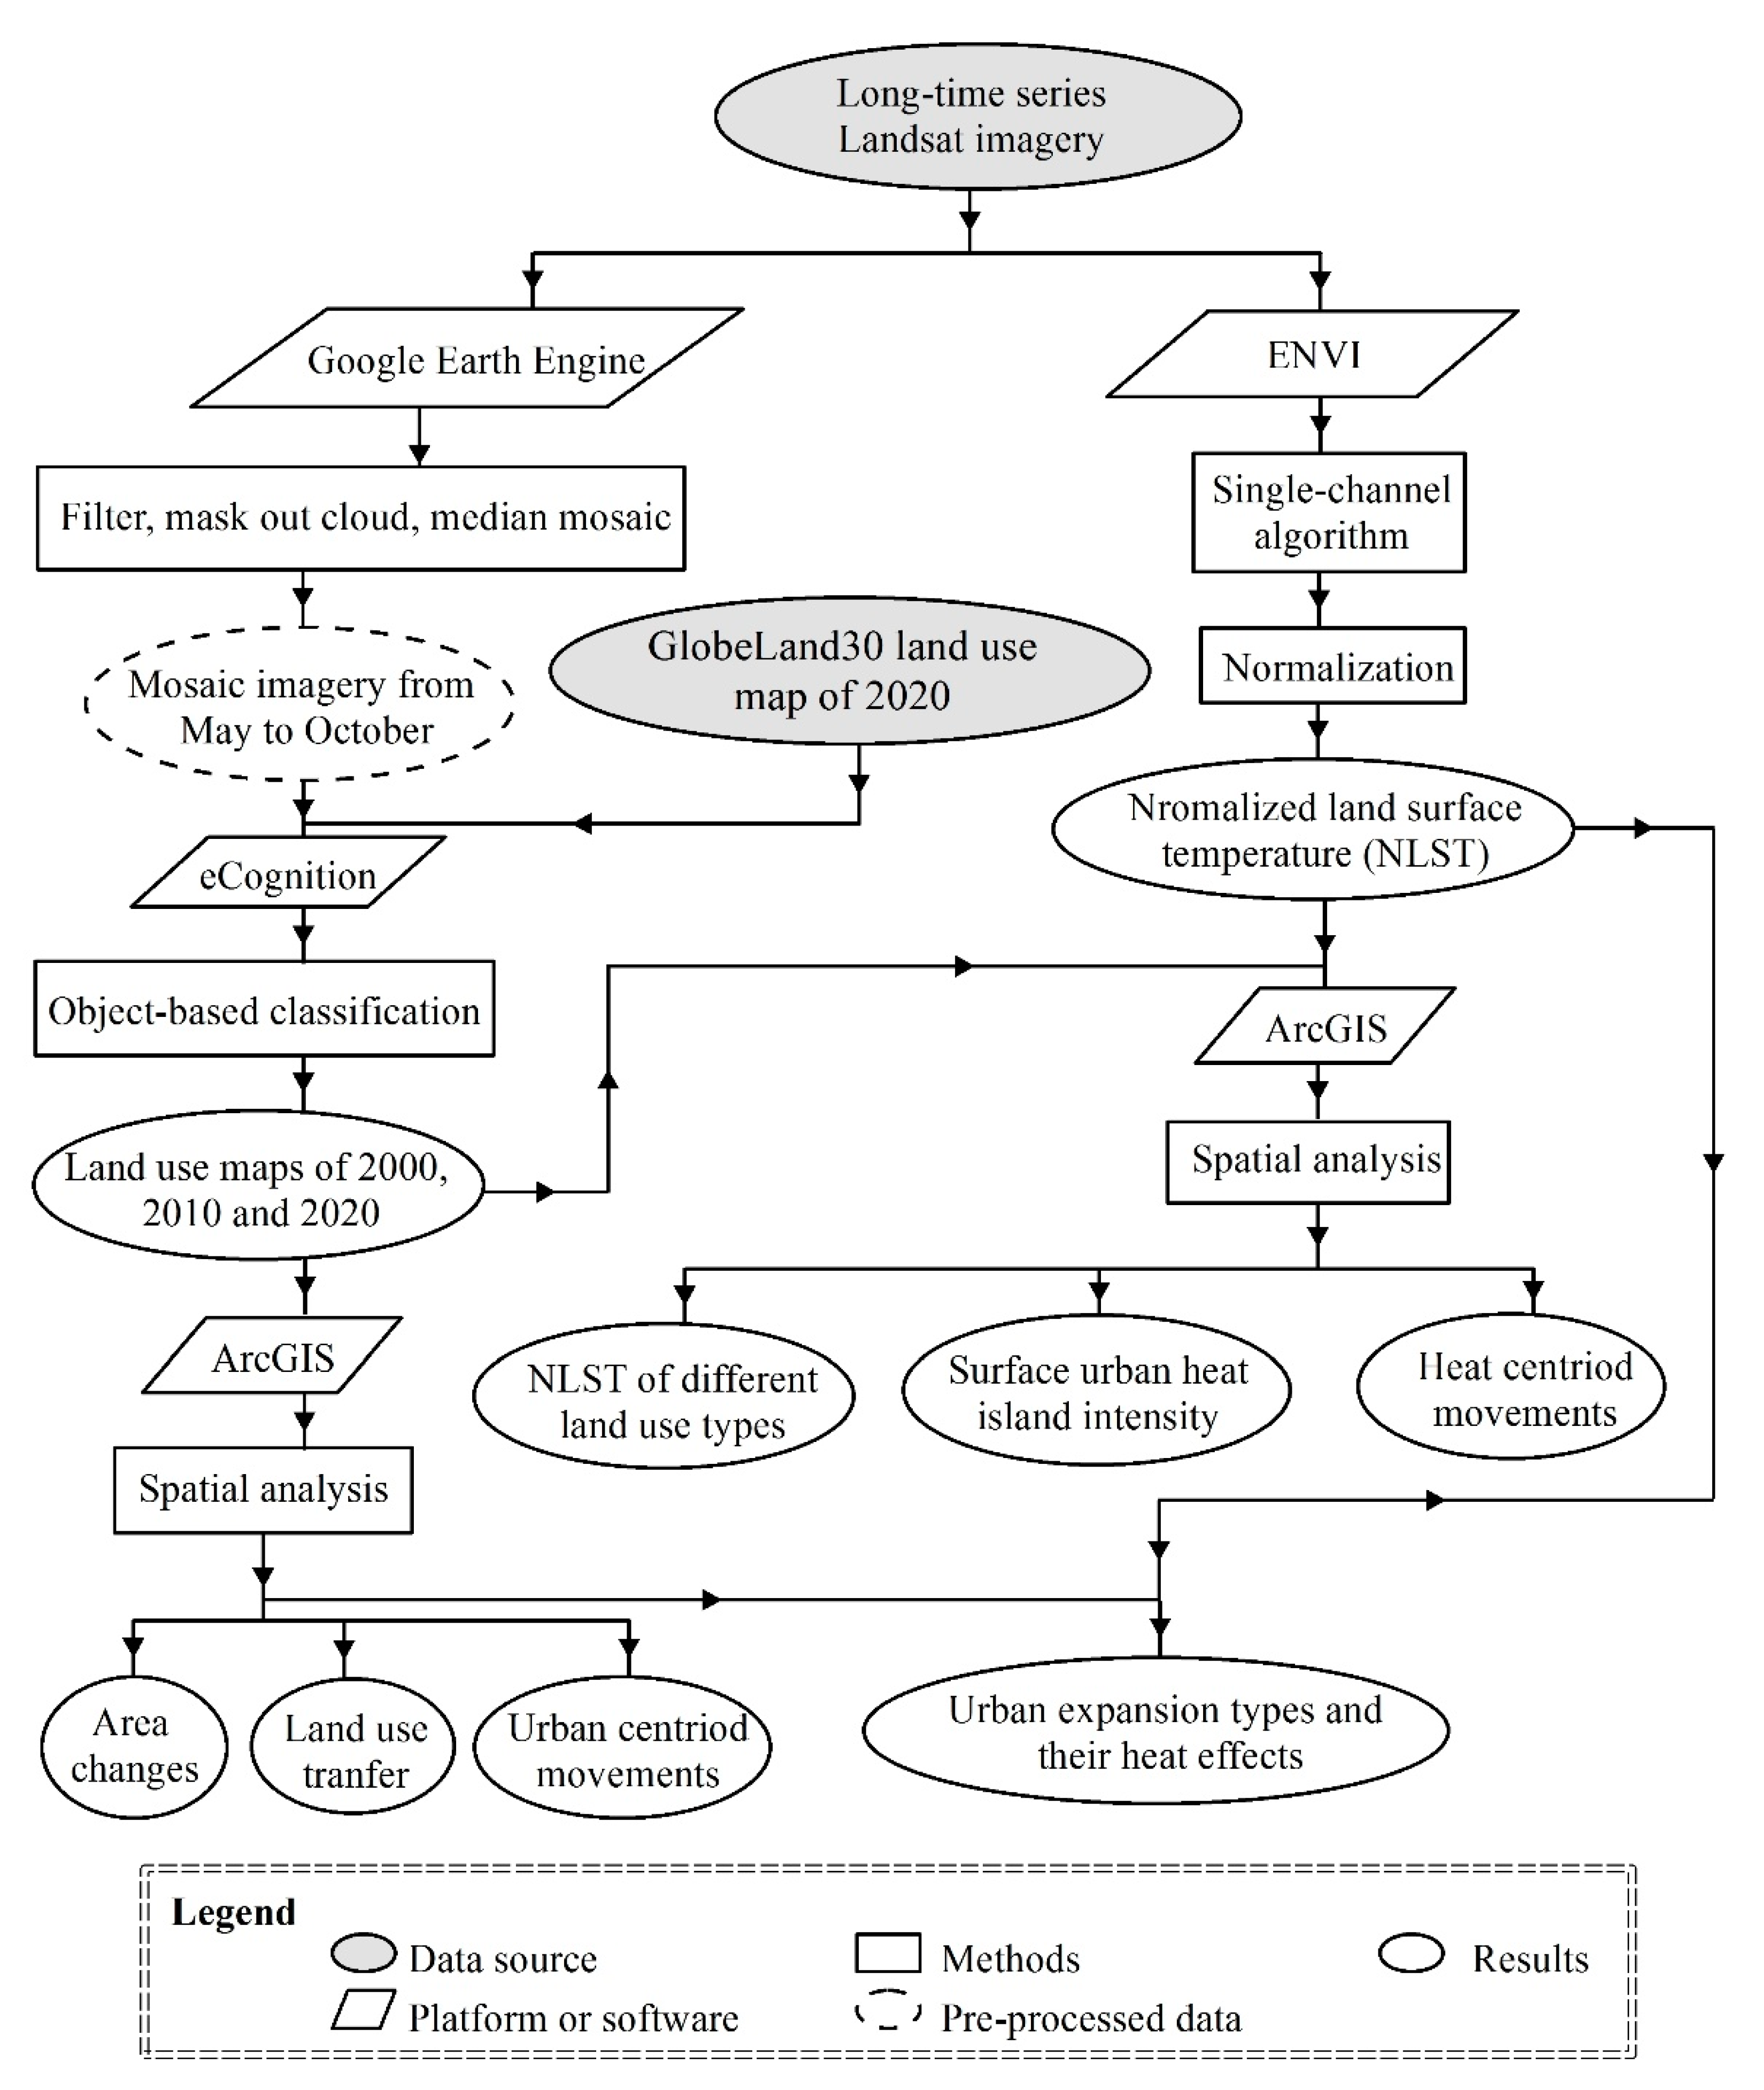
The 16 remote sensing images adopted in this study included Landsat Thematic Mapper (TM) imagery from 2000 and 2010 and Landsat Operational Land Imager (OLI) imagery from 2020 (Table 1). The level 2 surface reflectance images (atmospherically corrected from level 1 images) with the smallest cloud cover used for LST retrieval in summer (June to August) were downloaded from the United States Geological Survey (USGS) Center (http://glovis.usgs.gov/, accessed on 23 January 2021). These three images were pre-processed and converted from the digital number (DN) values of the thermal bands (band 6 for Landsat-5 and band 10 for Landsat-8) to the at-sensor brightness temperatures [25,35].
For land-use classification, mosaic images from 1 May to 31 October were downloaded from the Google Earth Engine (GEE) cloud-computing platform after pre-processing (Figure 2). Based on GEE, a series of 16 low-cloud-cover (less than 20%) Landsat surface reflectance tier 1 images were selected and processed to composite median values of the multi-spectral bands at 30 m spatial resolution by remove various types of clouds and noise, with a compositing function [36,37,38]. The acquired mosaic image of the Landsat-8 OLI is shown in Figure 1. GlobeLand30 2020, a 30-m resolution global land-cover data product, was developed by China, with a total accuracy of 85.72% and a Kappa coefficient of 0.82 [39]. The names of the mapsheets of N50_30, N51_25, and N51_30 from GlobeLand30 2020 were applied and downloaded from the National Geomatics Center of China (http://www.globallandcover.com/, accessed on 4 February 2021) as the baselines for the classification.

2.3. Methods

As shown in Figure 2, the workflow of this study contained three major parts: (1) extracting spatiotemporal characteristics of impervious surfaces using the object-based backdating classification and the land-use transfer matrix (Section 2.3.1 and Section 2.3.4); (2) quantifying the spatiotemporal patterns of the thermal environment through normalized land surface temperature (NLST) retrieval, and calculation of the surface urban heat island intensity and spatial centroids (Section 2.3.2, Section 2.3.3 and Section 2.3.6); and (3) analyzing the heat effects of the urban expansion types and directions by calculating the expansion index, spatial centroids, and NLSTs of different expansion types (Section 2.3.5 and Section 2.3.6).

2.3.1. Object-Based Backdating Classification

Based on the classification system of GlobeLand30 products, land-use types in the study area contained farmland, grassland, forests (including forest and shrub-wood), wetlands, water, and impervious surfaces [40]. To achieve change analysis effectively with a consistent classification scheme, while recognizing existing mapping efforts, the object-based backdating method was adopted to acquire land-use maps of 2000, 2010, and 2020. As a common time interval for temporal comparisons, a decade was used in this study. The accuracy assessment of land-use classification was based on randomly selected samples from Google Earth images, presenting overall accuracy of over 85% (Table 2). Classification involved the following five steps [20,41]:
  • Object-based image analysis: The GlobeLand30 map of 2020, as Phase I data, and Landsat-8 OLI mosaic image of 2020, as Phase II data, were segmented using the eCognition Developer 9.0 software with 50, 0.1, and 0.5 as values of the scale, shape, and compactness, respectively.
  • Stratified image classification: The classes of objects from Phase II data were assigned by that from Phase I data.
  • Visual interpretation and manual modification: The changed objects from the Phase II data were modified manually with the help of finer resolution images from Google Earth.
  • Dissolve was applied to obtain the final land-use map of 2020 at a 30 m spatial resolution.
  • Backdating: The final land-use map of 2020 was used as the Phase I data and the Landsat-5 TM mosaic image of 2010 was used as the Phase II data. The steps from 1 to 4 were conducted to acquire a land-use map for 2010. In the same way, based on the land-use map of 2010 (as Phase I data) and the Landsat-5 TM mosaic image of 2000 (as Phase II data), the steps from 1 to 4 were conducted to acquire a land-use map for 2000.

2.3.2. Normalized Land Surface Temperature Retrieval

The LST was retrieved based on the Landsat imagery and the generalized single-channel algorithm. In detail, the radiative transfer equation was utilized to estimate the surface temperature from the thermal infrared bands of Landsat-5 TM (band 6) and Landsat-8 (band 10). The retrieved LSTs of 2000 and 2010 were consistent with the temperature products from the DATABANK Remote Sensing Data Engine (http://databank.casearth.cn/, accessed on 13 January 2021), the errors of which were below 2 K [42]. Due to the lack of LST products in the summer of 2020 and insufficient weather station data in the study area, the LST in 2020 was not validated in this study.
The LST was retrieved using Equation (1) [42]:
T s = γ [ 1 ε i ( Ψ 1 L i + Ψ 2 ) + Ψ 3 ] + δ
where Ts is the LST; Li is the radiance of band i; εi is the land-surface emissivity calculated by the normalized difference vegetation index (NDVI) threshold method [14,25]; Ψ1, Ψ2, and Ψ3 are the atmospheric functional parameters calculated by the atmosphere water vapor content (w); w is calculated from the MODIS water-vapor product (MOD05, with a similar time of passing territory with used Landsat images) based on the ratio technique (http://modis-atmos.gsfc.nasa.gov/, accessed on 20 January 2021) [42]; γ and δ are the Planck’ parameters, which were calculated by Equations (2) and (3), respectively:
γ     T i 2 b γ L i
δ     T i T i 2 b γ
where Ti is the at-sensor brightness temperature; bγ was 1256 K for Landsat-5 band 6 and 1324 K for Landsat-8 band 10.
To compare spatiotemporal variations, the NLST was adopted using the following equation:
NLST = Tsj   - Tsmin Tsmax   -   Tsmin
where Tsj, Tsmin, and Tsmax are the LST values of pixel j and the minimum and maximum of all pixels, respectively. Here, larger values of NLST denote relatively high LSTs at spatiotemporal scales. The smaller values of NLST variations between impervious surfaces and other land-use types represent weaker heat effects.

2.3.3. Analysis of Surface Urban Heat Island Intensity

To quantify the spatiotemporal patterns of heat effects from urbanization, the surface urban heat island intensity (SUHII) was calculated. In this study, the SUHII was defined as the NLST difference between areas of high and sub-high intensity impervious surfaces, which is different from other studies that used LST as the base [8,43]. Our SUHII definition can reduce the uncertainties associated with the land surface temperature retrieval and site-specific rural conditions. The SUHII was acquired through following steps:
  • Impervious surface intensity maps were generated from land use data using moving windows of 120 × 120 m for 2000 and 2010 and 100 × 100 m for 2020 to match the pixel sizes of Landsat-5 band 6 and Landsat-8 band 10, respectively.
  • A 50% threshold of the impervious surface intensity was used as a criterion to separate the maps into high- and low-intensity impervious surfaces [44].
  • The buffer areas outside the high intensity impervious surfaces with distances of 240 m for 2000 and 2010 and 200 m for 2020 were used as the sub-high areas. Finally, the NLST difference between the high-intensity area and its surrounding sub-high areas was taken as the SUHII.

2.3.4. Land-Use Transfer Matrix

The land-use transfer matrix is widely adopted to characterize the structure of land-use dynamics. It describes areal conversions across different land-use types in a certain region during a particular period [45]. To quantify the contributions of other land-use types to the growth of impervious surfaces in Hangzhou City, the land-use transfer matrix was calculated using the tabulate area tool in the ArcGIS software:
S ij = ( S 11 S 1 n S n 1 S nn )
where Sij is the area of land-use type i transferred to land-use type j, and n is the number of land-use types. In this study, n was 6. i and j (1, 2, …, 6) are land-use types before and after a certain transfer process, respectively. Each element on the main diagonal of the matrix denotes the area of each land-use type remaining unchanged. The contributions of other land-use types to the growth of impervious surfaces represent the values from one of the columns of this matrix.

2.3.5. The Expansion Index

The expansion index (E) was chosen to determine three main urban expansion types: infilling, edge-expansion, and outlying [46,47]. A newly-grown patch expanding as a gap or hole among or within old patches is defined here as an infilling expansion, whereas uniaxial spreading in parallel strips from one edge is an edge-expansion type. The expansion is referred to as outlying expansion when a newly-grown patch is found isolated from an old patch [48]. E was acquired by using Equation (6) via the analysis tool in the ArcGIS software:
E = L com / P new
where Pnew is the perimeter of a newly-developed patch of impervious surfaces, Lcom is the length of the common edge of the expansion patch of impervious surfaces, and Lcom and Pnew have the same units (such as kilometers). In this method, the patch is identified as infilling when E > 0.5, edge-expansion when 0 < E ≤ 0.5, and outlying when E = 0.

2.3.6. Spatial Centroids

The spatial centroid is defined as the location determined by the coordinates of the weighted geometric center of a polygon or multiple polygons, as applied in the analysis of land-use type evolution and thermal environmental patterns [49,50]. The spatial centroids of impervious surfaces and the surface temperatures in 2000, 2010, and 2020 were mapped to delineate the direction of changes as follows:
{ X t = i = 1 N ( C ti · X i ) / i = 1 N C ti Y t = i = 1 N ( C ti · Y i ) / i = 1 N C ti
where Xt and Yt are the longitude and latitude of a centroid of impervious surfaces and the surface temperature in year t, respectively; Cti is the area of patch i in year t when calculating the centroid of impervious surfaces; Cti is is the NLST values of the patch i in year t for the calculation of centroids of the temperature; Xi and Yi are the longitude and latitude of patch i used for impervious surfaces or NLST, respectively; and N is the total patch number of impervious surfaces or NLST. When impervious surfaces or the surface temperature have the same growth or decline rates in every direction, the spatial centroid remains invariant; otherwise, its centroid moves toward the direction in which impervious surfaces (or the surface temperature) gain or reduce more [51].

3. Results

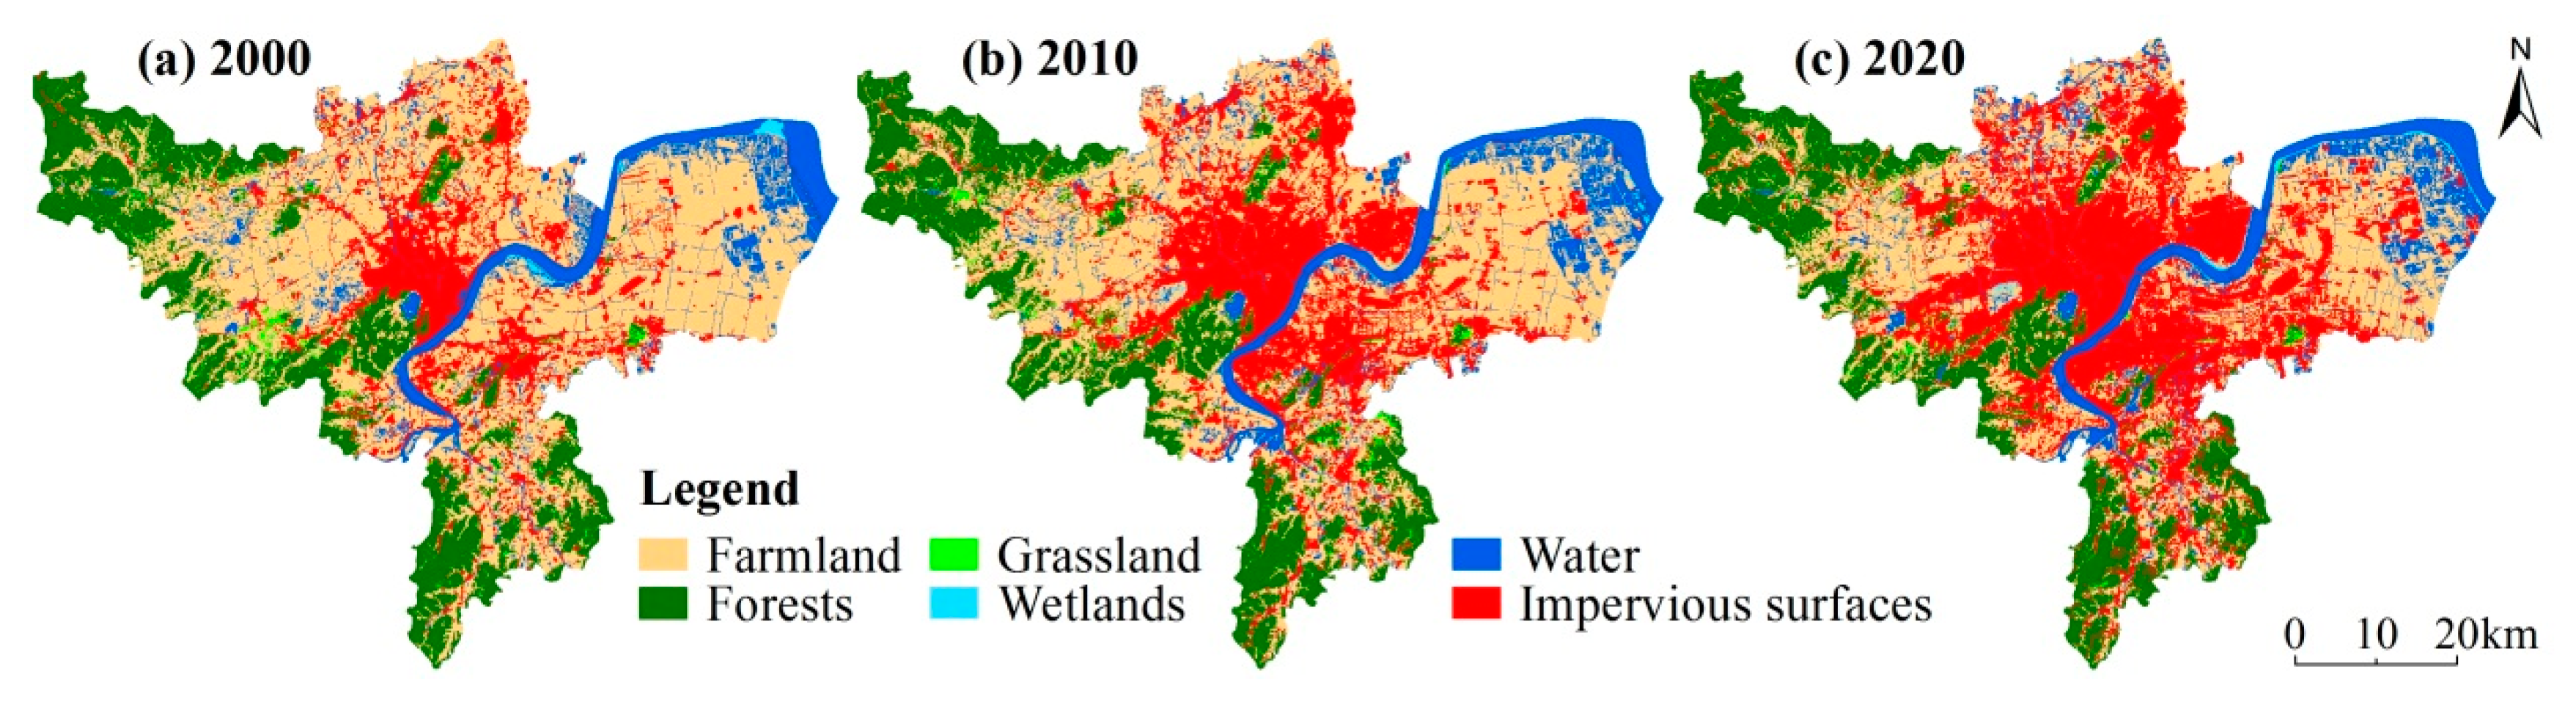
3.1. Spatiotemporal Distribution of Impervious Surfaces

Impervious surfaces were spread widely across Hangzhou City from 2000 to 2020 and were mainly located to the north of the Qiantang River (Figure 3). In 2020, the area of impervious surfaces totaled 1139.29 km2, which represented 34.05% of the total study area (Figure 4). Xiacheng, Gongshu, Jianggan, Shangcheng, and Binjiang were the top five districts with the greatest percentages of impervious surfaces, with values of 96.32%, 77.64%, 69.65%, 69.09%, and 67.77%, respectively (Figure 4). In the last 20 years, although expansion slowed in Shangcheng, Xiacheng, Jianggan, Gongshu and Binjiang districts, impervious surfaces expanded with an increasing growth rate of 6.11% in Hangzhou City (Figure 4). From 2000 to 2010, the expansion rate of impervious surfaces in Hangzhou City was 31.16 km2/year, with Xiaoshan, Yuhang and Jianggan being the top three districts. In the following 10 years, this rate increased to 33.07 km2/year. Xiaoshan, Yuhang, and Xihu districts had the highest growth speeds of impervious surfaces (Figure 4).
Over the 20 years under analysis, impervious surfaces mostly occupied farmland and water, which reached above 90% of the contribution proportion for the growth of impervious surfaces (Figure 5). During the two phases, the contributions of farmland and water notably decreased, while that of grassland reduced slightly and that of forests increased by 3.15%. Most reductions in farmland and water due to urban expansion occurred in Jianggan, Binjiang, Xiaoshan, and Yuhang districts (Figure 3). Impervious surfaces occupied forests and grassland principally in the Xiaoshan and Yuhang districts.

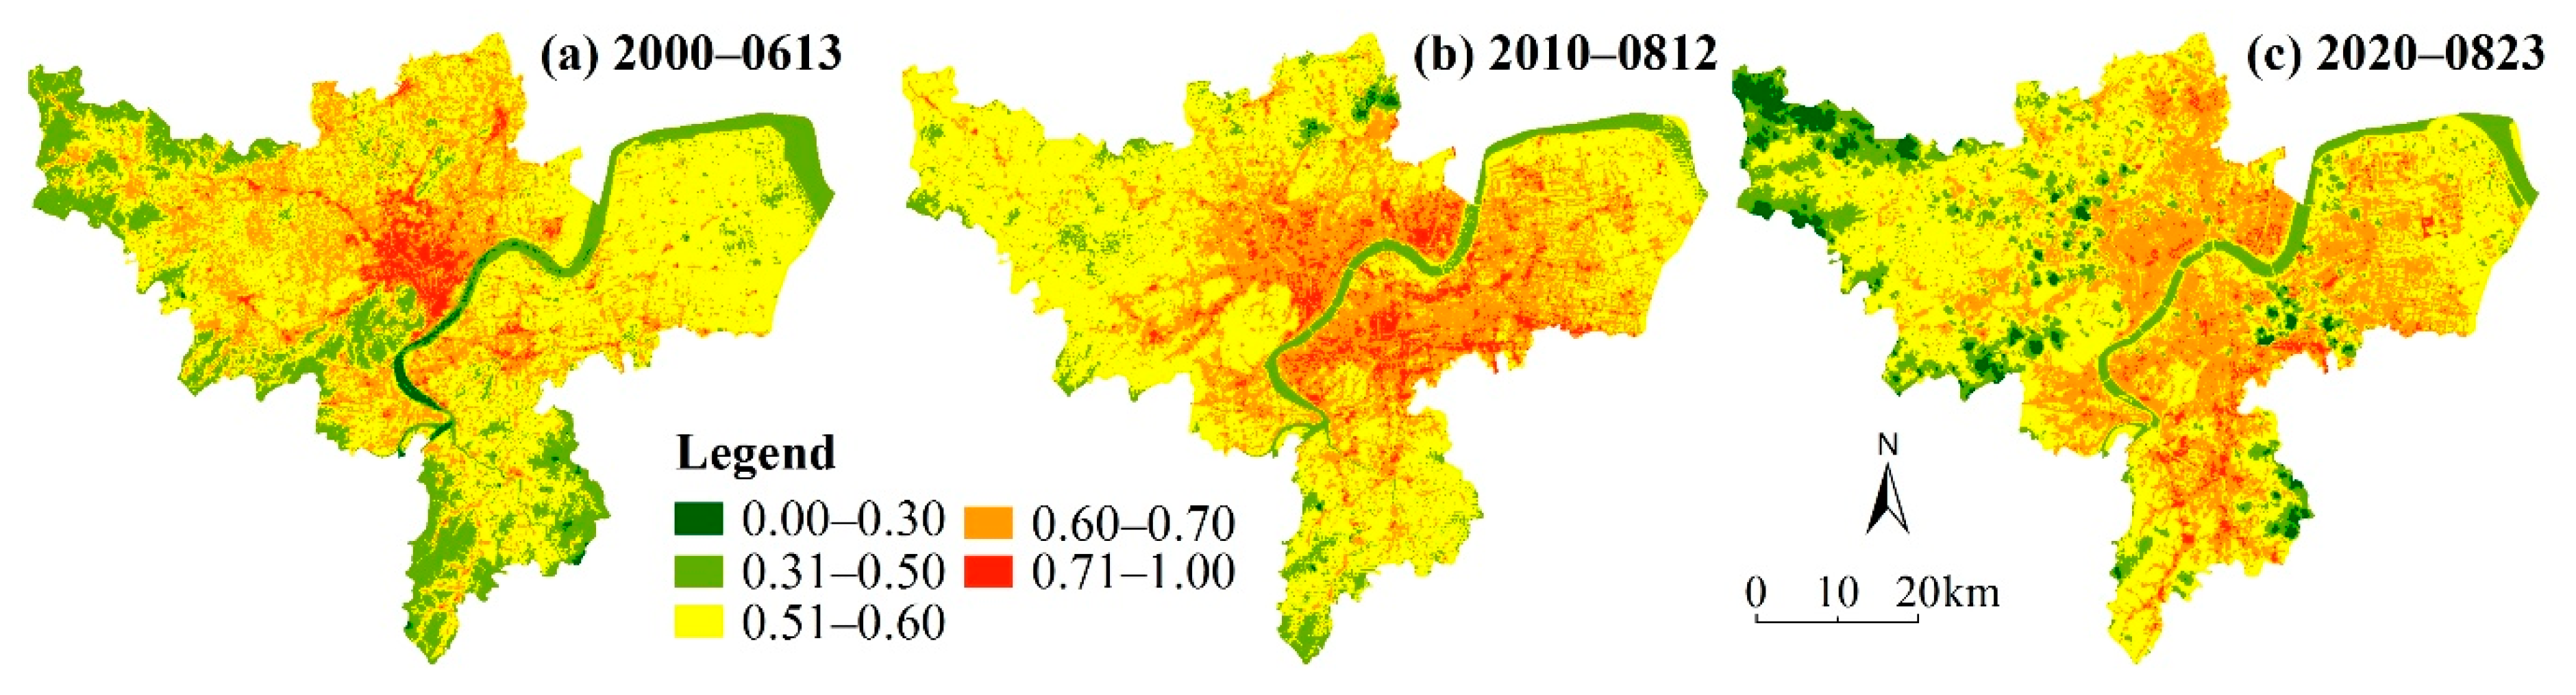
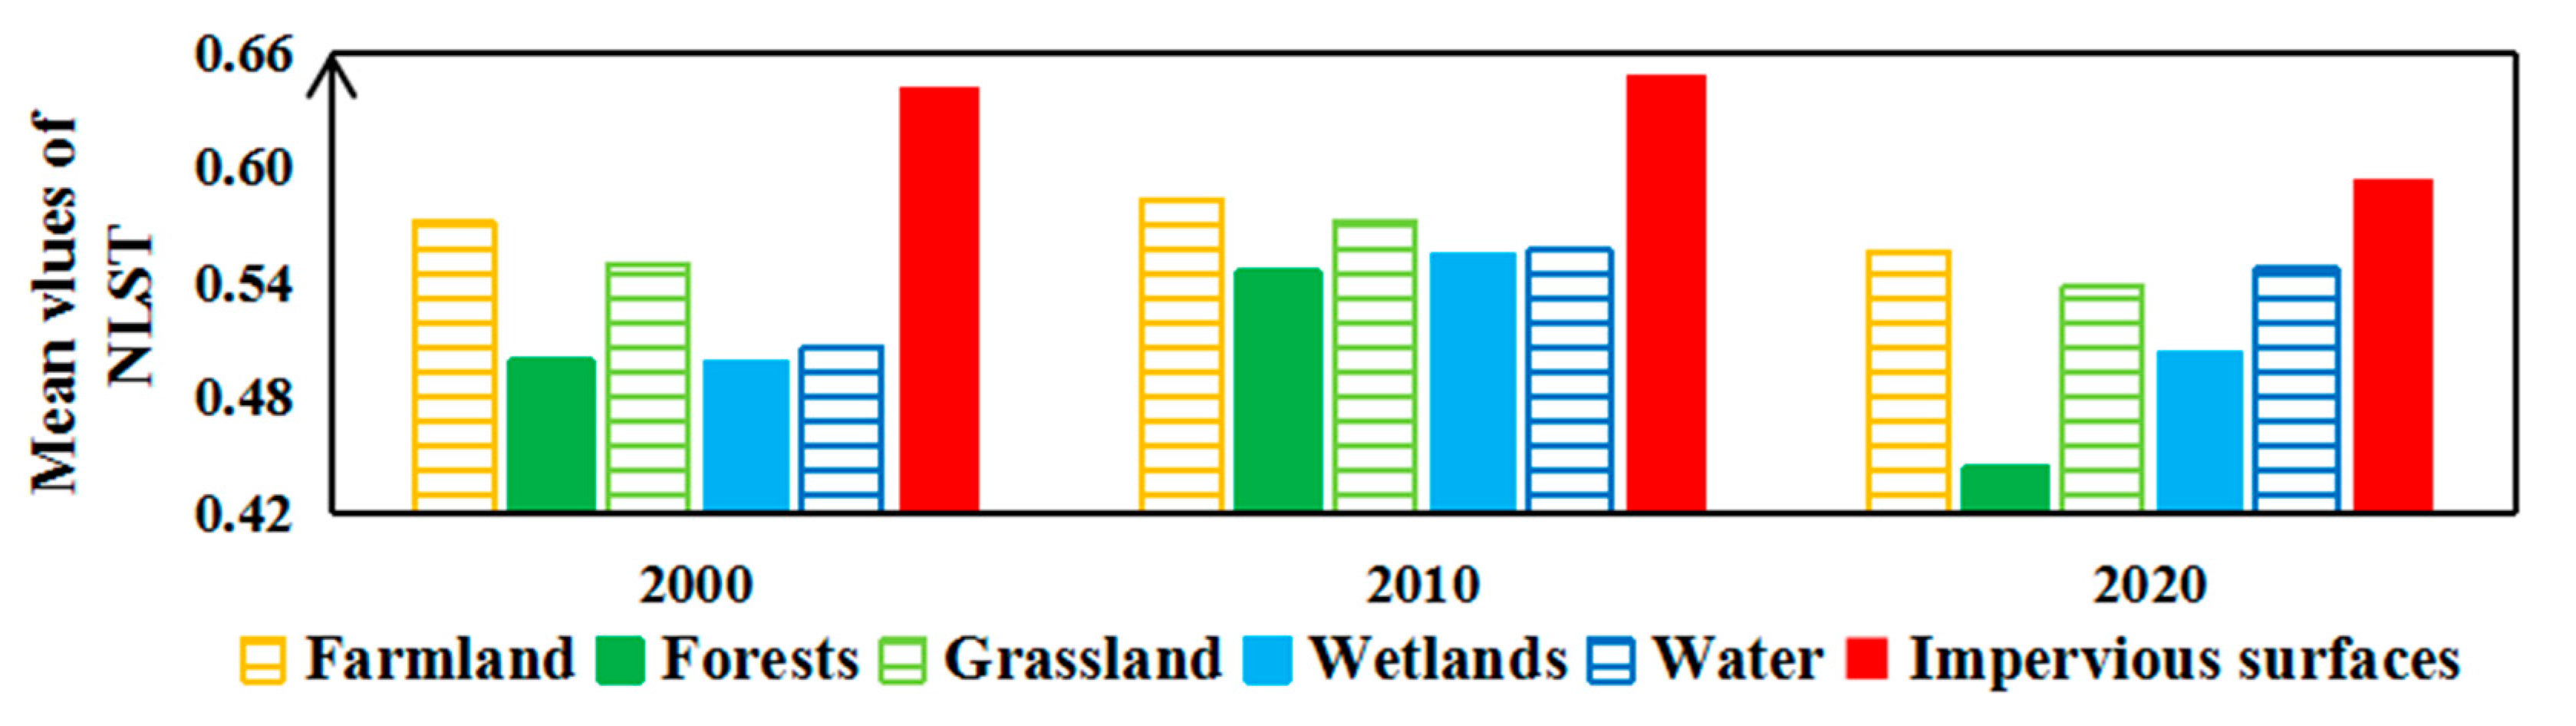
3.2. Spatiotemporal Dynamics of LST

The NLST showed dramatic spatiotemporal variations. The increasing distribution of high values indicated the warming environment of Hangzhou City (Figure 6). Overall, irrespective of the outlying smallest values of NLST in 2020 due to the cloud cover, especially in the northwestern and southern forests, spatial variations in surface temperature decreased during the two phases of 2000–2010 and 2010–2020 (Figure 6 and Figure 7). Impervious surfaces had the largest mean values of NLST, followed by farmland (Figure 7). However, the smallest mean values of NLST were observed for the wetlands in 2000 and for forests in 2010 and 2020.
The SUHII decreased in the last 20 years (Table 3). This result was consistent with the afore-mentioned spatiotemporal distribution of NLST, through which spatial variations in the heat effects of urban expansion reduced from 2000 to 2020. However, the NLST changes yielding impervious surfaces with different intensities varied over time. From 2000 to 2010, the high and sub-high intensity impervious surfaces featured a decreasing NLST. Nonetheless, in the next 10 years, the NLST of high and sub-high intensity areas grew. This result indicated that the spatial variations in heat effects in high and sub-high intensity urban areas weakened and then increased, but were still weaker than the initial values. The centroid of NLST moved to the southeast from 2000 to 2020, and was mainly located in the north of the Qiantang River, which was in line with the major distribution of impervious surfaces (Figure 3 and Figure 8). Movements of the NLST centroid revealed that the heat effects of urban expansion in the southeastern part of Hangzhou city experienced a larger change rate than the effects in other directions. The centroid movement was more strongly distinguished during the first 10 years, similarly to the changes in SUHII. In other words, the change in the heat effects of urban expansion was faster from 2000 to 2010 than that during the last 10 years.

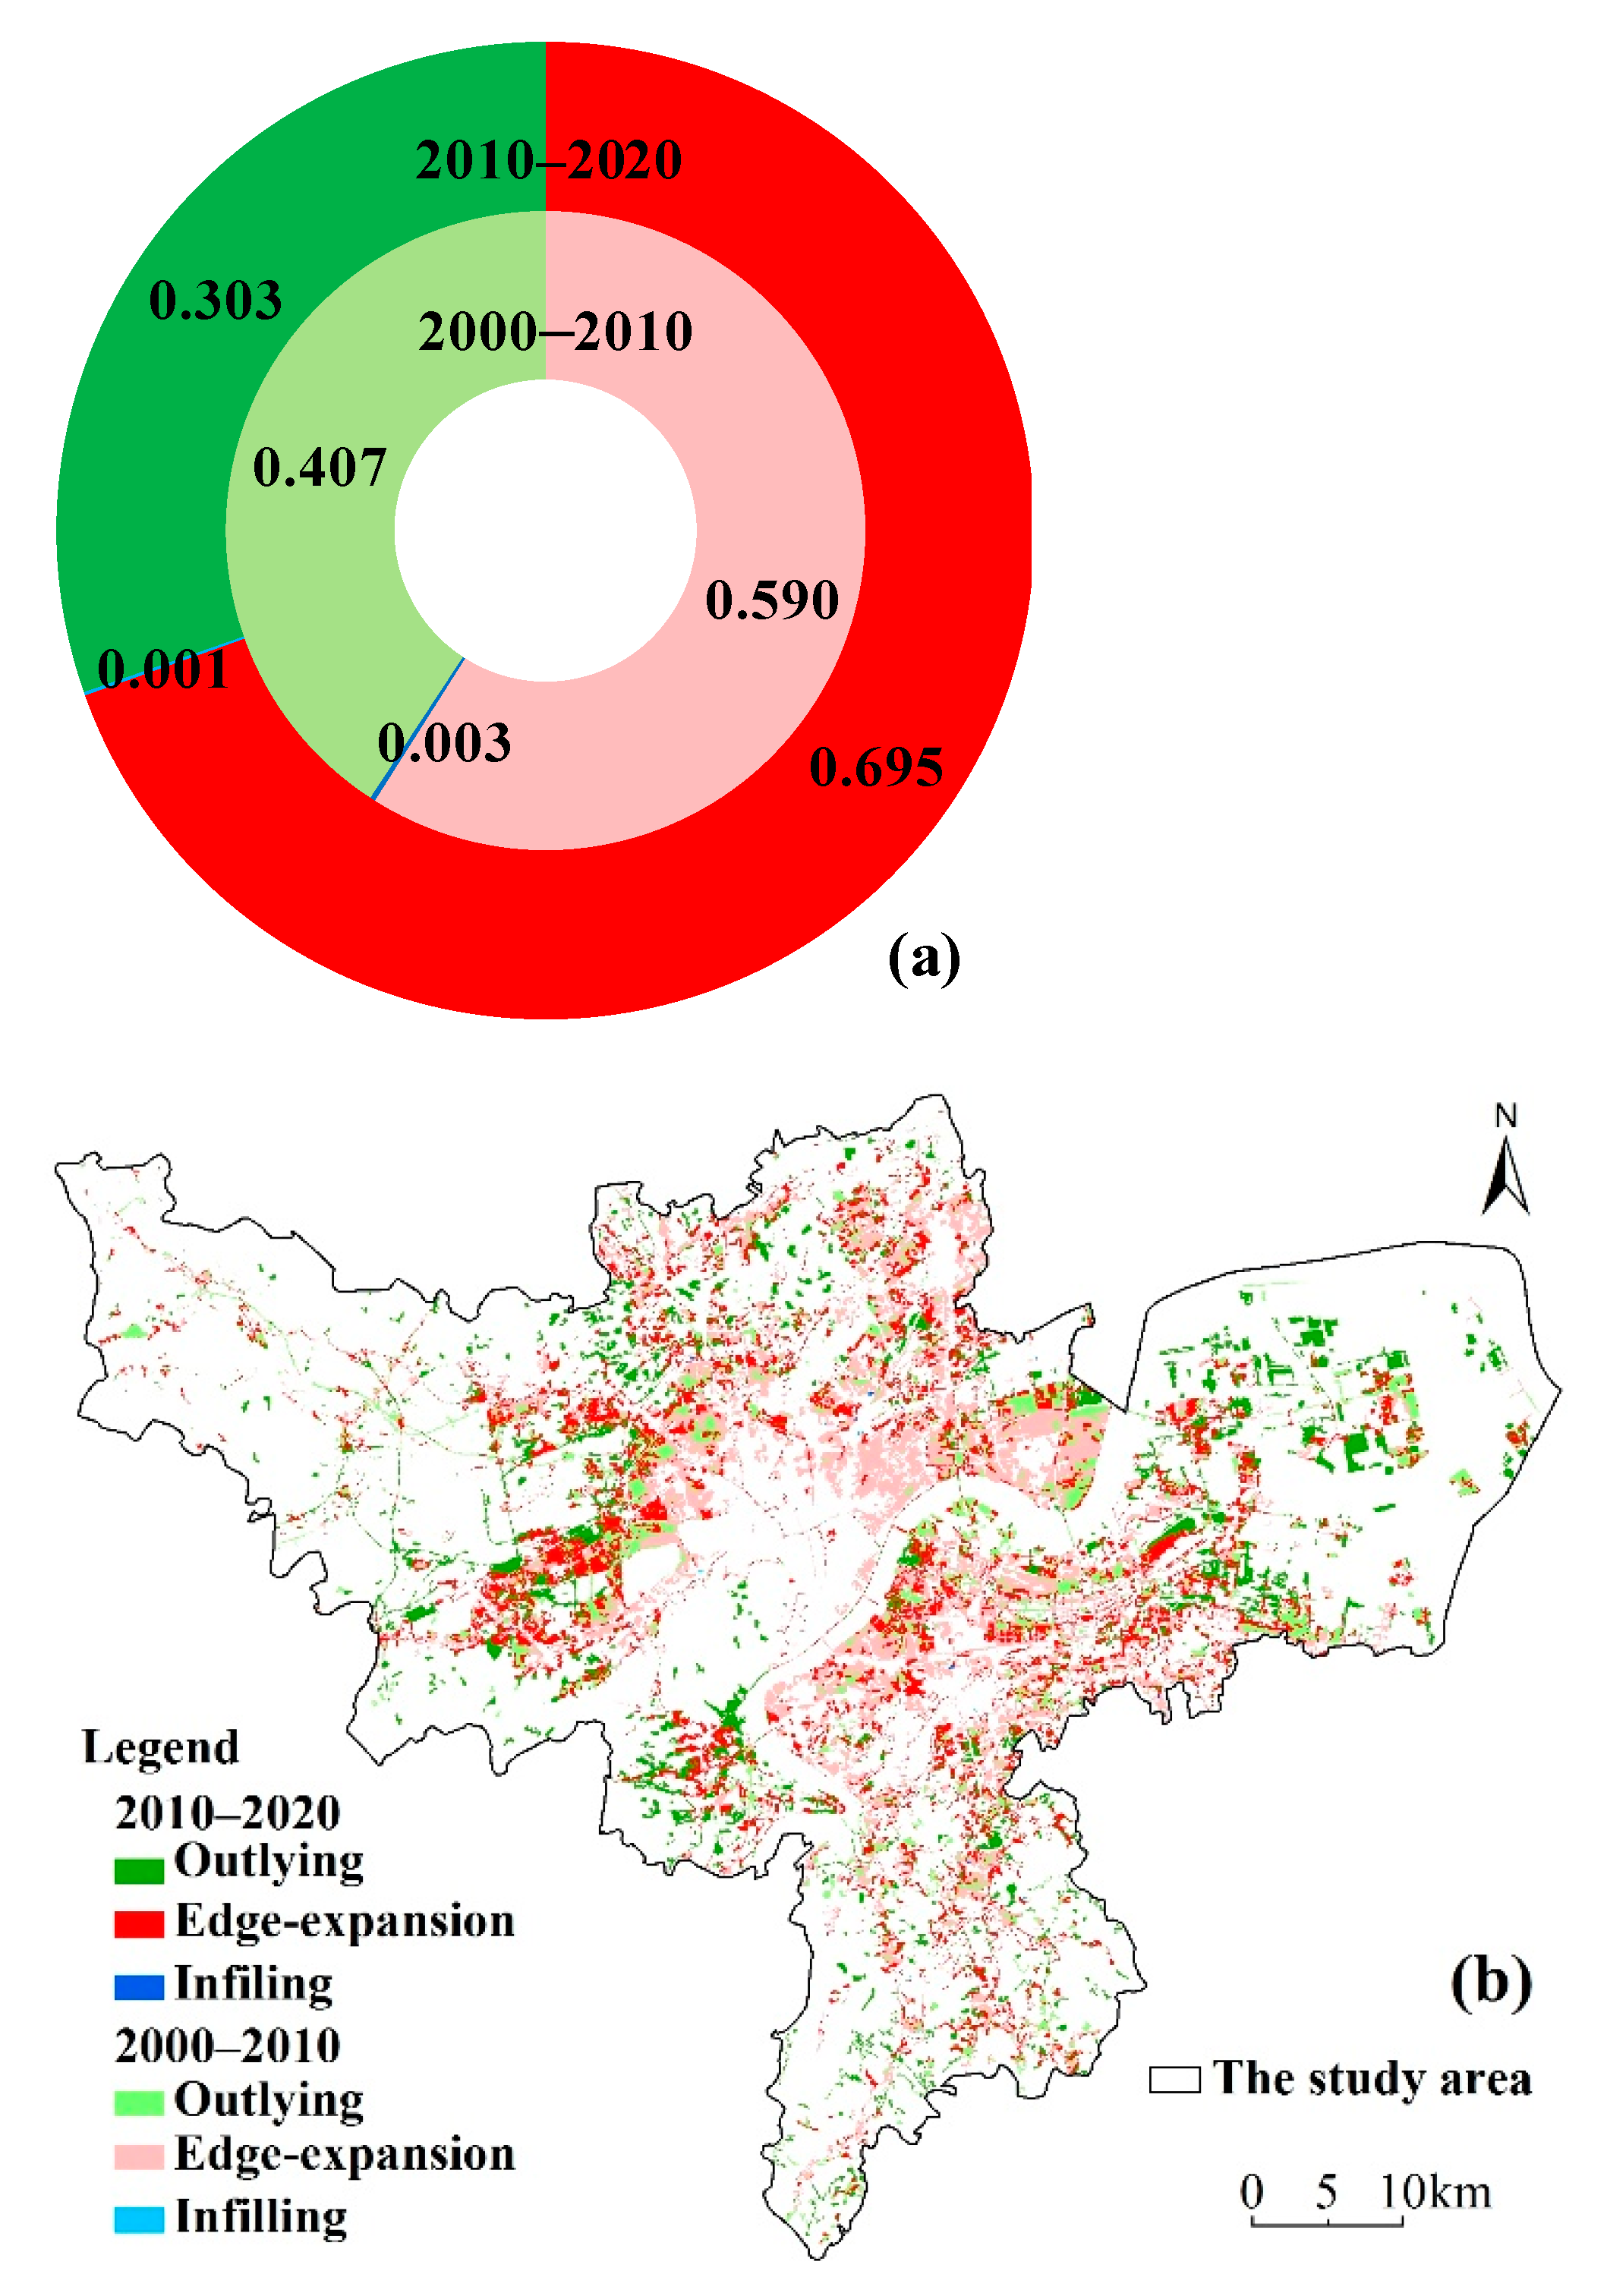
3.3. Directions, Types, and Temperature Variations of Urban Expansion

The centroid of impervious surfaces moved to the east from 2000 to 2010, and then turned to the south in the next decade (Figure 8). This result reveals that in the first decade, urban expansion in the eastern part of Hangzhou City was more notable than that in other directions, and the growth pole transformed to the south. This result agrees with NLST temporal dynamics showing that the spatial variations of urban expansion in Hangzhou City were more remarkable in the first 10 years according to the smaller movement of centroids from 2010 to 2020.
The distribution of different expansion types illustrates that the edge-expansion was the uppermost type and widely distributed across Hangzhou City in the last two decades (Figure 9). The outlying expansion was mainly clustered in Jianggan, Xihu, Xiaoshan and Yuhang districts. Infilling expansion was the least common and scattered in Hangzhou City, with the majority located in the east. The edge-expansion increased from 2000 to 2020, while outlying and infilling decreased. Firstly, edge-expansion and the outlying urban patches featured relatively close proportions to those of the former aggregations in Jianggan and Binjiang districts, with the latter typically located in Xiaoshan District. Nonetheless, the edge-expansion became dominant from 2010 to 2020, especially in Xiaoshan and Yuhang districts. At the same time, outlying urban patches were primarily located in Xihu, Xiaoshan, and Yuhang districts. The heat effects of the three types of urban expansion displayed different variations (Table 4). The edge-expansion had the largest values of maximum, average, and variations of NLST during the last 20 years. Conversely, infilling urban expansion possessed the smallest values of the maximum, average, and variation of NLST. However, the minimum value of NLST belonged to the outlying expansion from 2000 to 2010, which appeared in the edge-expanded urban patch during the next 10 years. Generally, the heat effects of infilling growth were slightly weaker than those of outlying growth, and those of the edge-expansion were strongest.

4. Discussion

4.1. Spatiotemporal Patterns of Urban Expansion

We observed that the expansion of Hangzhou City was mainly concentrated in the northeast of the city with flat terrain (Figure 3 and Figure 8). This concentration was due to the limitations of the mountainous regions in the south and west, such as Tianmu and Chuanwu Mountains [52]. Given the constraints of land availability, Xiaoshan and Yuhang districts were merged into Hangzhou City in 2001, which provided these two administrative units the highest urban expansion rates (Figure 4). Further, Xiaoshan and Yuhang districts featured expanses of available farmland, which made farmland the greatest contributor to urban sprawl (Figure 3 and Figure 5). The centroid movement revealed that urban expansion was more rapid in the southeast (Figure 8), which resulted from the extensive urban growth in the flat terrain of southeastern Hangzhou City, such as in Xiaoshan District and the east of Yuhang District. This phenomenon also agreed with the urban planning emphasized in the Hangzhou Ninth Party Congress involving “active east, quiet west, new south, beautiful north, and prosperous center” and “eastward urban expansion, westward tourism and industry, and development along the two sides of the Qiantang River” [53].
The results illustrated that edge-expansion was the dominant type of urban growth from 2000 to 2020, while infilling expansion was sparsely distributed (Figure 9). This result agrees with prior studies on urban expansion from 2000 to 2015 and can be explained by strip development with subjection to the southwestern mountains and the Qiantang River [54]. A previous study concluded that outlying growth, followed by edge-expansion, was the primary type of urban sprawl from 1995 to 2005 in districts that were built earlier [55]. It can be inferred that the urban expansion of Hangzhou City transformed from outlying-oriented to leading edge-expansion (Figure 9a). Infilling expansion was lowest because of the high land use efficiency in Hangzhou City, which featured few gaps or holes across urban areas.

4.2. Spatial Characteristics of Heat Effects from the Urban Expansion

Unlike previous studies, the present study focused on the relative values of LST across Hangzhou City, and their spatiotemporal dynamics based on NLST. It was reported that the absolute values of the air and land temperature in urban areas increased during the urbanization process in the study area, which was shown in this study as high increases in NLST (Figure 6) [14,30,31,56]. It was found that the spatial variations in the heat effects of urban expansion decreased during the last two decades, which was principally due to the growing distribution of high values of NLST (Figure 6 and Table 3). In other words, the whole city has heated during the process of urban expansion. Although the whole city became warmer, the cooling effects of forests and wetlands were more distinguished from 2000 to 2020, as shown in Figure 7, which was explained in past studies as being caused by carbon sequestration and the climate-regulation functions of urban forests and wetlands [25,57,58].
The SUHII values and NLST centroid movements revealed that the spatial variations in the heat effects of urban expansion were significant in the eastern part of Hangzhou City from 2000 to 2010 (Figure 8 and Table 3). Specifically, the sprawl of impervious surfaces in the east was a key factor for the decrease in the spatial variation of urban heat effects. However, in the last 10 years, despite the NLST growth in high and sub-high intensity impervious surfaces, spatial variations in urban heat effects have decreased southwards at a slower rate. This observation indicates that changes in heat effects were larger in sub-urban than core-urban areas and that the south-oriented expansion of impervious surfaces largely induced warming of the city. Meanwhile, the warming rate slowed, and sub-urban areas contributed more from 2010 to 2020.
The increase in the edge-expansion of impervious surfaces also intensified urban heat effects (Figure 9). The new edge-built urban areas had the warmest relative temperatures (Table 4) because edge-expansion was extensive across Hangzhou City. Meanwhile, edge-expansion conventionally occurred in areas where human activities were intense accompanied by economies of scale and the movement of centers, which hampered the air and radiative circulation [55,59]. These factors simultaneously transformed the urban heat effect from a monocentric to polycentric pattern [14]. These results demonstrated that edge-built impervious surfaces were the hot spots of Hangzhou City with abundant conversions from cooler areas, such as farmland, water, and forests. The declining spatial variations in urban heat effects resulted from decreasing NLST differences among impervious surfaces and these cooler land-use types. The increasing of edge-expansion and decreasing of infilling also verified the growth of contributions from sub-urban areas to urban heat effects in the last decade.

4.3. Spatial Characteristics of Heat Effects from Urban Expansion

The driving forces of urban expansion patterns in Hangzhou City included topographic factors, urban planning policies and other socioeconomic determinants, while the influence of natural drivers weakened gradually [52,60,61]. Topographic factors such as the elevation, slope, and natural barriers of mountains and rivers directly resulted in urban expansion patterns as reported in 4.1. Based on the urban master plan of Hangzhou (2001–2020), the urban expansion pattern of this city was designated as a polycentric structure with a main center, three sub-centers, and six clusters [62]. Moreover, this plan emphasized urban expansion along the Qiangtang River and the six ecological belts connecting suburban and exurban ecological, green, and agricultural areas [63]. The theme of urban expansion thus changed from the “Xihu (West Lake) Era” to the “Qiantang River Era” [64]. This urban planning promoted urban expansion across the city and mitigated urban heat effects, with the NLST values of impervious surfaces reduced from 2000 to 2020 (Figure 3 and Figure 7). Although the NLST values of impervious surfaces slightly increased from 2000 to 2010, new polices were put forward with consideration of the landscape composition and configuration and took effects from 2010 to 2020. In this way, starting in 2011, the municipal government took measures to propel industrial transformation and shut down outdated production facilities [65]. Moreover, the metropolis developed a strategy to enhance the optimization of inner-city functions and structures to improve land-use efficiency and restore lost green spaces, resulting in a relatively lower warming rate and greater contributions from sub-urban areas in recent years [66].
Industrial suburbanization was articulated in previous studies as a vital socioeconomic factor for underlying the spatiotemporal dynamics of urban expansion from 2000 to 2015 [62,64,67]. The development core of industries moved from Jianggan District to Xiaoshan District, which was consistent with the movements of the NLST centroid (Figure 8). This agreement was because industries increased the anthropogenic heat and emissions in southeastern areas of Hangzhou City. In recent years, the development of technology- and knowledge-intensive industries, and science and technology based industrial zones located in Binjiang, Xiaoshan, and Yuhang districts, has entailed increasing labor, land, and production value [32,68,69], thus supporting polycentric urban development and thermal environment and decreasing the spatial variations of urban heat effects (Figure 3, Figure 6, and Table 3). This development of technology- and knowledge-intensive industries also accelerated roughness changes by the construction of tall buildings, which modified radiative forcing and air circulation by leading to multiple solar inter-reflections in packed areas and diversified shading. Traffic network construction was reported to be another socioeconomic determinant [52,61]. Two subway lines completed in 2012 facilitated the urban sprawl into urban–rural frontiers with a massive physical edge-expansion along major road corridors toward the east and south, which also promoted a boom in urban heat effects on the south shore of the Qiantang River (Figure 3 and Figure 6). Population and economic conditions, as additional common socioeconomic factors that are easily quantified, were considerably influenced by policies in the short term and indirectly influenced urban expansion [55,70].
Thus, the important roles of policies, industries, and traffic networks in the urban expansion of Hangzhou City and its thermal environment were widely recognized in previous studies and further highlighted in this study.

5. Conclusions

Urban land-use changes hinder ecosystem sustainability through the loss of habitats and carbon storage and an increase in warming the environment. It is urgent further explore the heat effects of different urbanization types and directions in Hangzhou to support urban heat mitigation strategies.
The present research selected Hangzhou City as a case study to determine the spatiotemporal patterns of urban expansion and their heat effects using Landsat imagery between 2000 and 2020. Policies, industries, and traffic networks were discussed to help explain the urban expansion of Hangzhou City and the changes in its thermal environment. The following conclusions were drawn from this study:
(1)
The impervious surface expansion of Hangzhou City was mainly concentrated in the northeast of the city with flat terrain. In 2020, the area of impervious surfaces totaled 1139.29 km2, with the majority being in farmland, water, and forests. The annual growth rate was 31.16 km2/year from 2000 to 2010 and 33.07 km2/year in the last 10 years.
(2)
The city has heated over time with decreases in spatial variation during the urbanization process. Impervious surfaces were cores of heat, and forests and wetlands had the lowest surface temperatures. Urban areas expanded with decreases in the warming rate and featured greater contributions from sub-urban areas.
(3)
The impervious-surface sprawl in the southeast was most important factor underlying the spatiotemporal dynamics of urban heat effects. The newly edge-built urban area featured the warmest relative temperature, and the dominant urban edge-expansion intensified local heat effects.

Author Contributions

Conceptualization, L.C. and B.Z.; methodology, L.C.; software, L.C.; validation, W.M. and M.L.; formal analysis, L.C.; investigation, L.C.; resources, B.Z.; data curation, L.C.; writing—original draft preparation, L.C.; writing—review and editing, B.Z., W.M., and M.L.; visualization, L.C.; supervision, B.Z.; project administration, B.Z.; funding acquisition, L.C., B.Z., and W.M. All authors have read and agreed to the published version of the manuscript.

Funding

This study is supported by the Global Change and Air-Sea Interaction Project of China under Grant JC-YGFW-YGJZ, the Start-up Foundation of Hangzhou Normal University under Grant 4085C50220204092, Natural Science Foundation of Zhejiang Province, China (No. LY19D010005), and Nature Science Foundation of Hebei Province, China (number D2019209317).

Data Availability Statement

The level 2 surface reflectance Landsat images were downloaded from the United States Geological Survey (USGS) Center (http://glovis.usgs.gov/, accessed on 23 Jan 2021). The GlobeLand30 2020 were downloaded from the National Geomatics Center of China (http://www.globallandcover.com/, accessed on 4 February 2021). The LSTs were downloaded from the DATABANK Remote Sensing Data Engine (http://databank.casearth.cn/, accessed on 13 January 2021). MODIS water-vapor product (MOD05) were downloaded from the National Aeronautics and Space Administration (http://modis-atmos.gsfc.nasa.gov/, accessed on 20 January 2021).

Acknowledgments

We appreciate critical and constructive comments and suggestions from the reviewers that helped improve the quality of this manuscript. The authors thank the National Geomatics Center of China (http://www.globallandcover.com/, accessed on 4 February 2021) and National Earth System Science Data Center (http://www.geodata.cn/, accessed on 5 February 2021) for providing land use maps of 2020 and geographic information data, respectively. This study is supported by the Global Change and Air-Sea Interaction Project of China under Grant JC-YGFW-YGJZ, the Start-up Foundation of Hangzhou Normal University under Grant 4085C50220204092, Natural Science Foundation of Zhejiang Province, China (No. LY19D010005) and Nature Science Foundation of Hebei Province, China (No. D2019209317).

Conflicts of Interest

The authors declare no conflict of interest.

References

  1. Seto, K.C.; Güneralp, B.; Hutyra, L.R. Global forecasts of urban expansion to 2030 and direct impacts on biodiversity and carbon pools. Proc. Natl. Acad. Sci. USA 2012, 109, 16083–16088. [Google Scholar] [CrossRef] [PubMed] [Green Version]
  2. Ayanlade, A. Seasonality in the daytime and night-time intensity of land surface temperature in a tropical city area. Sci. Total Environ. 2016, 557, 415–424. [Google Scholar] [CrossRef] [PubMed]
  3. Chen, G.; Li, X.; Liu, X.; Chen, Y.; Liang, X.; Leng, J.; Xu, X.; Liao, W.; Qiu, Y.; Huang, K. Global projections of future urban land expansion under shared socioeconomic pathways. Nat. Commun. 2020, 11, 537. [Google Scholar] [CrossRef] [PubMed] [Green Version]
  4. Pu, X.; Wang, T.; Huang, X.; Melas, D.; Zanis, P.; Papanastasiou, D.K.; Poupkou, A. Enhanced surface ozone during the heat wave of 2013 in Yangtze River Delta region, China. Sci. Total Environ. 2017, 603–604, 807–816. [Google Scholar] [CrossRef]
  5. Kalsoo, U.; Wang, T.; Ma, C.; Shu, L.; Huang, C.; Gao, L. Quadrennial variability and trends of surface ozone across China during 2015–2018: A regional approach. Atmos. Environ. 2021, 245, 117989. [Google Scholar] [CrossRef]
  6. Zhao, L. Urban growth and climate adaptation. Nat. Clim. Chang. 2018, 8, 1034. [Google Scholar] [CrossRef]
  7. Manoli, G.; Fatichi, S.; Schläpfer, M.; Yu, K.; Crowther, T.W.; Naika, M.; Burlando, P.; Katul, G.G.; Bou-Zeid, E. Magnitude of urban heat islands largely explained by climate and population. Nature 2019, 573, 55–60. [Google Scholar] [CrossRef]
  8. Zhou, D.; Zhao, S.; Liu, S.; Zhang, L.; Zhu, C. Surface urban heat island in China’s 32 major cities: Spatial patterns and drivers. Remote Sens. Environ. 2014, 152, 51–61. [Google Scholar] [CrossRef]
  9. Aflaki, A.; Mirnezhad, M.; Ghaffarianhoseini, A.; Ghaffarianhoseini, A.; Omrany, H.; Wang, Z.-H.; Akbari, H. Urban heat island mitigation strategies: A state-of-the-art review on Kuala Lumpur, Singapore and Hong Kong. Cities 2017, 62, 131–145. [Google Scholar] [CrossRef] [Green Version]
  10. Jones, E.; O’Neill, B.C.; McDaniel, L.; McGinnis, S.; Mearns, L.O.; Tebaldi, C. Future population exposure to US heat extremes. Nat. Clim. Chang. 2015, 5, 652–655. [Google Scholar] [CrossRef]
  11. Fu, P.; Weng, Q. A time series analysis of urbanization induced land use and land cover change and its impact on land surface temperature with Landsat imagery. Remote Sens. Environ. 2016, 175, 204–215. [Google Scholar] [CrossRef]
  12. Yu, Z.; Yao, Y.; Yang, G.; Wang, X.; Vejre, H. Spatiotemporal patterns and characteristics of remotely sensed region heat islands during the rapid urbanization (1995–2015) of Southern China. Sci. Total Environ. 2019, 674, 242–254. [Google Scholar] [CrossRef] [PubMed]
  13. Peng, J.; Xie, P.; Liu, Y.; Ma, J. Urban thermal environment dynamics and associated landscape pattern factors: A case study in the Beijing metropolitan region. Remote Sens. Environ. 2016, 173, 145–155. [Google Scholar] [CrossRef]
  14. Li, F.; Sun, W.; Yang, G.; Weng, Q. Investigating spatiotemporal patterns of surface urban heat islands in the Hangzhou metropolitan area, China, 2000–2015. Remote Sens. 2019, 11, 1553. [Google Scholar] [CrossRef] [Green Version]
  15. Huang, F.; Zhan, W.; Wang, Z.-H.; Voogt, J.; Hu, L.; Quan, J.; Liu, C.; Zhang, N.; Lai, J. Satellite identification of atmospheric-surface-subsurface urban heat islands under clear sky. Remote Sens. Environ. 2020, 250, 112039. [Google Scholar] [CrossRef]
  16. Estoque, R.C.; Murayama, Y. Monitoring surface urban heat island formation in a tropical mountain city using Landsat data (1987–2015). ISPRS J. Photogram. 2017, 133, 18–29. [Google Scholar] [CrossRef]
  17. Roy, S.; Pandit, S.; Eva, E.A.; Bagmar, M.S.H.; Papia, M.; Banik, L.; Dube, T.; Rahman, F.; Razi, M.A. Examining the nexus between land surface temperature and urban growth in Chattogram Metropolitan Area of Bangladesh using long term Landsat series data. Urban Clim. 2020, 32, 100593. [Google Scholar] [CrossRef]
  18. Lu, D.; Li, G.; Kuang, W.; Moran, E. Methods to extract impervious surface areas from satellite images. Int. J. Digit. Earth 2014, 7, 93–112. [Google Scholar] [CrossRef]
  19. Aina, Y.A.; Adam, E.; Ahmed, F.; Wafer, A.; Alshuwaikhat, H.M. Using multisource data and the V-I-S model in assessing the urban expansion of Riyadh city, Saudi Arabia. Eur. J. Remote Sens. 2019, 52, 557–571. [Google Scholar] [CrossRef] [Green Version]
  20. Yu, W.; Zhou, W.; Qian, Y.; Yan, J. A new approach for land cover classification and change analysis: Integrating backdating and an object-based method. Remote Sens. Environ. 2016, 177, 37–47. [Google Scholar] [CrossRef]
  21. Zhao, S.; Zhou, D.; Zhu, C.; Qu, W.; Zhao, J.; Sun, Y.; Huang, D.; Wu, W.; Liu, S. Rates and patterns of urban expansion in China’s 32 major cities over the past three decades. Landsc. Ecol. 2015, 30, 1541–1559. [Google Scholar] [CrossRef]
  22. Maimaiti, B.; Ding, J.; Simayi, Z.; Kasimu, A. Characterizing urban expansion of Korla City and its spatial-temporal patterns using remote sensing and GIS methods. J. Arid Land 2017, 9, 458–470. [Google Scholar] [CrossRef] [Green Version]
  23. Fu, Y.; Li, J.; Weng, Q.; Zheng, Q.; Li, L.; Dai, S.; Guo, B. Characterizing the spatial pattern of annual urban growth by using time series Landsat imagery. Sci. Total Environ. 2019, 666, 274–284. [Google Scholar] [CrossRef]
  24. Deilami, K.; Kamruzzaman, M.; Liu, Y. Urban heat island effect: A systematic review of spatio-temporal factors, data, methods, and mitigation measures. Int. J. Appl. Earth Obs. 2018, 67, 30–42. [Google Scholar] [CrossRef]
  25. Hou, H.; Estoque, R.C. Detecting cooling effect of landscape from composition and configuration: An urban heat island study on Hangzhou. Urban For. Urban Green. 2020, 53, 126719. [Google Scholar] [CrossRef]
  26. Du, J.; Xiang, X.; Zhao, B.; Zhou, H. Impact of urban expansion on land surface temperature in Fuzhou, China using Landsat imagery. Sustain. Cities Soc. 2020, 61, 102346. [Google Scholar] [CrossRef]
  27. Estoque, R.C.; Murayama, Y.; Myint, S.W. Effects of landscape composition and pattern on land surface temperature: An urban heat island study in the megacities of Southeast Asia. Sci. Total Environ. 2017, 577, 349–359. [Google Scholar] [CrossRef]
  28. Guindon, B.; Zhang, Y.; Dillabaugh, C. Landsat urban mapping based on a combined spectral–spatial methodology. Remote Sens. Environ. 2004, 92, 218–232. [Google Scholar] [CrossRef]
  29. Son, N.T.; Chen, C.F.; Chen, C.R.; Thanh, B.X.; Vuong, T.H. Assessment of urbanization and urban heat islands in Ho Chi Minh City, Vietnam using Landsat data. Sustain. Cities Soc. 2017, 30, 150–161. [Google Scholar] [CrossRef]
  30. Lin, Y.; Jim, C.; Deng, J.; Wang, Z. Urbanization effect on spatiotemporal thermal patterns and changes in Hangzhou (China). Build. Environ. 2018, 145, 166–176. [Google Scholar] [CrossRef]
  31. Zhang, Y.; Cheng, J. Spatio-temporal analysis of urban heat island using multisource remote sensing data: A case study in Hangzhou, China. IEEE J. STARS 2019, 12, 3317–3326. [Google Scholar] [CrossRef]
  32. Hangzhou Statistical Bureau. Hangzhou Statistical Yearbook 2001; China Statistical Press: Beijing, China, 2001. [Google Scholar]
  33. Hangzhou Statistical Bureau. Hangzhou Statistical Yearbook 2020; China Statistical Press: Beijing, China, 2020. [Google Scholar]
  34. Du, X.; Huang, Z. Ecological and environmental effects of land use change in rapid urbanization: The case of hangzhou, China. Ecol. Indic. 2017, 81, 243–251. [Google Scholar] [CrossRef]
  35. Li, J.; Song, C.; Cao, L.; Zhu, F.; Meng, X.; Wu, J. Impacts of landscape structure on surface urban heat islands: A case study of Shanghai, China. Remote Sens. Environ. 2011, 115, 3249–3263. [Google Scholar] [CrossRef]
  36. Jia, M.; Mao, D.; Wang, Z.; Ren, C.; Zhu, Q.; Li, X.; Zhang, Y. Tracking long-term floodplain wetland changes: A case study in the China side of the Amur River Basin. Int. J. Appl. Earth Obs. 2020, 92, 102185. [Google Scholar] [CrossRef]
  37. Sayler, K.; Zanter, K. Landsat 4–7 Collection 1 (C1) Surface Reflectance (LEDAPS) Product Guide (Version 3.0); Earth Resources Observation and Science (EROS) Center: Sioux Falls, SD, USA, 2020. [Google Scholar]
  38. Sayler, K.; Zanter, K. Landsat 8 Collection 1 (C1) Land Surface Reflectance Code (LaSRC) Product Guide (Version 3.0); Earth Resources Observation and Science (EROS) Center: Sioux Falls, SD, USA, 2020. [Google Scholar]
  39. Xiong, B.; Chen, R.; An, L.; Zhang, Q.; Xia, Z. Telecoupling urbanization and mountainous deforestation between 2000 and 2020: Evidence from Zhejiang Province, China. Authorea 2021. [Google Scholar] [CrossRef]
  40. Chen, J.; Ban, Y.; Li, S. Open access to Earth land-cover map. Nature 2014, 514, 434. [Google Scholar]
  41. Wang, Y.; Chen, L. A hybrid spproach for mapping salt marsh vegetation. In Coastal and Marine Environments, 2nd ed.; Wang, Y., Ed.; CRC Press: Boca Raton, FL, USA, 2020; pp. 299–306. [Google Scholar]
  42. Zhang, Z.; He, G.; Peng, Y.; Long, T.; Wang, M.; Wei, M.; Landsat Surface Temperature Products over China. China Scientific Data. Available online: http://csdata.org/p/435/ (accessed on 1 November 2020).
  43. Clinton, N.; Gong, P. MODIS detected surface urban heat islands and sinks: Global locations and controls. Remote Sens. Environ. 2013, 134, 294–304. [Google Scholar] [CrossRef]
  44. Imhoff, M.L.; Zhang, P.; Wolfe, R.E.; Bounoua, L. Remote sensing of the urban heat island effect across biomes in the continental USA. Remote Sens. Environ. 2010, 114, 504–513. [Google Scholar] [CrossRef] [Green Version]
  45. Chen, L.; Ren, C.; Zhang, B.; Li, L.; Wang, Z.; Song, K. Spatiotemporal Dynamics of Coastal Wetlands and Reclamation in the Yangtze Estuary During Past 50 Years (1960s–2015). Chin. Geogr. Sci. 2018, 28, 386–399. [Google Scholar] [CrossRef] [Green Version]
  46. Xu, C.; Liu, M.; Zhang, C.; An, S.; Yu, W.; Chen, J. The spatiotemporal dynamics of rapid urban growth in the Nanjing metropolitan region of China. Landsc. Ecol. 2007, 22, 925–937. [Google Scholar] [CrossRef]
  47. Li, Y.; Li, Y.; Karácsonyi, D.; Liu, Z.; Wang, Y.; Wang, J. Spatio-temporal pattern and driving forces of construction land change in a poverty-stricken county of China and implications for poverty-alleviation-oriented land use policies. Land Use Policy 2020, 91, 104267. [Google Scholar] [CrossRef]
  48. Wu, W.; Zhao, S.; Zhu, C.; Jiang, J. A comparative study of urban expansion in Beijing, Tianjin and Shijiazhuang over the past three decades. Landsc. Urban Plan. 2015, 134, 93–106. [Google Scholar] [CrossRef]
  49. Jia, M.; Wang, Z.; Zhang, Y.; Ren, C.; Song, K. Landsat-based estimation of mangrove forest loss and restoration in Guangxi Province, China, influenced by human and natural factors. IEEE J. STARS 2015, 8, 311–323. [Google Scholar] [CrossRef]
  50. Xiong, Y.; Peng, F.; Zou, B. Spatiotemporal influences of land use/cover changes on the heat island effect in rapid urbanization area. Front. Earth Sci. 2019, 13, 614–627. [Google Scholar] [CrossRef]
  51. Zuo, L.; Zhang, Z.; Zhao, X.; Wang, X.; Wu, W.; Yi, L.; Liu, F. Multitemporal analysis of cropland transition in a climate-sensitive area: A case study of the arid and semiarid region of northwest China. Reg. Environ. Chang. 2013, 14, 75–89. [Google Scholar] [CrossRef]
  52. Li, L.; Lu, D.; Kuang, W. Examining urban impervious surface distribution and its dynamic change in Hangzhou metropolis. Remote Sens. 2016, 8, 265. [Google Scholar] [CrossRef] [Green Version]
  53. Shen, J.; Kee, G. Development and Planning in Seven Major Coastal Cities in Southern and Eastern China; Springer: Cham, Switzerland, 2017. [Google Scholar]
  54. Fang, C.; Zhao, S. A comparative study of spatiotemporal patterns of urban expansion in six major cities of the Yangtze River Delta from 1980 to 2015. Ecosyst. Health Sustain. 2018, 4, 95–114. [Google Scholar] [CrossRef] [Green Version]
  55. Yue, W.; Liu, Y.; Fan, P. Measuring urban sprawl and its drivers in large Chinese cities: The case of Hangzhou. Land Use Policy 2013, 31, 358–370. [Google Scholar] [CrossRef]
  56. Du, Y.; Xie, Z.; Zeng, Y.; Shi, Y.; Wu, J. Impact of urban expansion on regional temperature change in the Yangtze River Delta. J. Geogr. Sci. 2007, 17, 387–398. [Google Scholar] [CrossRef]
  57. Sheng, L.; Lu, D.; Huang, J. Impacts of land-cover types on an urban heat island in Hangzhou, China. Int. J. Remote Sens. 2015, 36, 1584–1603. [Google Scholar] [CrossRef]
  58. Xia, C.; Li, Y.; Xu, T.; Ye, Y.; Shi, Z.; Peng, Y.; Liu, J. Quantifying the spatial patterns of urban carbon metabolism: A case study of Hangzhou, China. Ecol. Indic. 2018, 95, 474–484. [Google Scholar] [CrossRef]
  59. Li, L.; Qi, Z.; Xian, S. State spatial selectivity and its impacts on urban sprawl: Insights from remote sensing images of Zhuhai. In ICIC 2020 Intelligent Computing Theories and Application; Huang, D.S., Bevilacqua, V., Hussain, A., Eds.; Springer: Cham, Switzerland, 2020; pp. 329–341. [Google Scholar]
  60. You, H.; Yang, X. Urban expansion in 30 megacities of China: Categorizing the driving force profiles to inform the urbanization policy. Land Use Policy 2017, 68, 531–551. [Google Scholar] [CrossRef]
  61. Cao, Y.; Zhang, X.; Fu, Y.; Lu, Z.; Shen, X. Urban spatial growth modeling using logistic regression and cellular automata: A case study of Hangzhou. Ecol. Indic. 2020, 113, 106200. [Google Scholar] [CrossRef]
  62. Yue, W.; Qiu, S.; Xu, H.; Xu, L.; Zhang, L. Polycentric urban development and urban thermal environment: A case of Hangzhou, China. Landsc. Urban Plan. 2019, 189, 58–70. [Google Scholar] [CrossRef]
  63. Hangzhou Municipal Government. Master Plan for Hangzhou City (2001–2020); The Municipal Government of Hangzhou: Hangzhou, China, 2007. [Google Scholar]
  64. Zhang, X.; Li, H. The evolving process of the land urbanization bubble: Evidence from Hangzhou, China. Cities 2020, 102, 102724. [Google Scholar] [CrossRef]
  65. Huang, L.; Wu, Y.; Zheng, Q.; Zheng, Q.; Zheng, X.; Gan, M.; Wang, K.; Shahtahmassebi, A.; Dong, J.; Wang, J.; et al. Quantifying the spatiotemporal dynamics of industrial land uses through mining free access social datasets in the mega Hangzhou Bay region, China. Sustainability 2018, 10, 3463. [Google Scholar] [CrossRef] [Green Version]
  66. Byrne, J.A.; Lo, A.Y.; Yang, J. Residents’ understanding of the role of green infrastructure for climate change adaptation in Hangzhou, China. Landsc. Urban Plan. 2015, 138, 132–143. [Google Scholar] [CrossRef] [Green Version]
  67. Huang, L.; Shahtahmassebi, A.; Gan, M.; Deng, J.; Wang, J.; Wang, K. Characterizing spatial patterns and driving forces of expansion and regeneration of industrial regions in the Hangzhou megacity, China. J. Clean. Prod. 2020, 253, 119959. [Google Scholar] [CrossRef]
  68. Qian, Z. Hangzhou. Cities 2015, 48, 42–54. [Google Scholar] [CrossRef]
  69. Anzoise, V.; Slanzi, D.; Poli, I. Local stakeholders’ narratives about large-scale urban development: The Zhejiang Hangzhou Future Sci-Tech City. Urban Stud. 2019, 57, 655–671. [Google Scholar] [CrossRef]
  70. Ma, Q. Integrating ecological correlation into cellular automata for urban growth simulation: A case study of Hangzhou, China. Urban For. Urban Green. 2020, 51, 126697. [Google Scholar] [CrossRef]
Figure 1. The location (a,b) and mosaic image (c) of the Landsat-8 OLI from May to October of 2020, and the elevation (d) from the Advanced Land Observing Satellite World 3D-30m (AW3D30) of the study area. Here, a, b, c, d, e, f, g, and h represent Shangcheng, Xiacheng, Jianggan, Gongshu, Xihu, Binjiang, Xiaoshan, and Yuhang districts, respectively. The mosaic image is displayed as RGB = Band 7 (short wave infrared-2), 5 (near-infrared), and 4 (red) to highlight the impervious surfaces.
Remotesensing 13 04268 g001
Figure 2. The workflow of this study.
Remotesensing 13 04268 g002
Figure 3. Land-use maps of Hangzhou City from 2000 to 2020.
Remotesensing 13 04268 g003
Figure 4. Growth of impervious surfaces in Hangzhou City from 2000 to 2020. The polar plot shows the proportions of impervious surfaces in the study area and the districts in 2020. SC, XC, JG, GS, XH, BJ, XS, and YH are abbreviations for the Shangcheng, Xiacheng, Jianggan, Gongshu, Xihu, Binjiang, Xiaoshan, and Yuhang districts, respectively.
Remotesensing 13 04268 g004
Figure 5. The proportions of contributions to the growth of impervious surfaces in Hangzhou City during different periods.
Remotesensing 13 04268 g005
Figure 6. Normalized land surface temperature (NLST) in Hangzhou City from 2000 to 2020.
Remotesensing 13 04268 g006
Figure 7. Mean values of NLST in Hangzhou City from 2000 to 2020.
Remotesensing 13 04268 g007
Figure 8. Centroid movements for NLST and impervious surfaces in Hangzhou City from 2000 to 2020. The background represents the band 5 (near infrared) of the mosaic Landsat-8 OLI imagery used for the classification.
Remotesensing 13 04268 g008
Figure 9. The proportions (a) and distribution (b) of urban expansion types in Hangzhou City from 2000 to 2020.
Remotesensing 13 04268 g009
Table 1. List of Landsat images used to retrieve the land surface temperature (LST) and create a mosaic for land-use classification.
UseSensorPath/RowAcquisition DateCloud Cover Land (%)
LST retrievalLandsat-5 TM119/3913 June 20001
119/398 December 20107
Landsat-8 OLI119/3923 August 202016.76
Land use classificationLandsat-5 TM118/396 June 20004
119/3913 June 20001
119/3931 July 20009
119/3917 September 20000
118/391 May 201013
118/3920 July 20106
118/395 August 20108
119/3924 May 20100
119/3912 August 20107
Landsat-8 OLI118/3912 May 20206.54
118/3916 August 20200.26
119/393 May 20200.94
119/3919 May 20204.12
119/3922 July 20208.15
119/3923 August 202016.76
119/398 September 20202.19
Table 2. Classification accuracy.
Index200020102020
Overall accuracy (%)89.3391.3392.33
Kappa coefficient0.880.900.91
Table 3. Statistical description of the surface urban heat island intensity (SUHII) in Hangzhou City from 2000 to 2020.
Year200020102020
Indictors of Heat Effects
NLST of high intensity impervious surfaces0.640.480.56
NLST of sub-intensity impervious surfaces0.570.440.54
SUHII0.070.040.02
Table 4. Statistical description of the NLSTs of different expansion types in Hangzhou City.
NLSTMinimumMaximumAverageStandard DeviationCoefficient of Variation (%)
Expansion Types 2000–20102010–20202000–20102010–20202000–20102010–20202000–20102010–20202000–20102010–2020
Outlying0.0000.0400.9500.8900.6380.5870.0720.08611.32514.591
Edge-expansion0.0600.0201.0001.0000.6430.5970.0840.09213.10115.356
Infilling0.4700.0800.8000.7500.6330.5830.0570.0728.98912.389
Publisher’s Note: MDPI stays neutral with regard to jurisdictional claims in published maps and institutional affiliations.

