Abstract
Phytoplankton blooms have caused many serious public safety incidents and eco-environmental problems worldwide and became a focus issue for research. Accurate and rapid monitoring of phytoplankton blooms is critical for forecasting, treating, and management. With the advantages of large spatial coverage and high temporal resolution, remote sensing has been widely used to monitor phytoplankton blooms. Numerous advances have been made in the remote sensing of phytoplankton blooms, biomass, and phenology over the past several decades. To fully understand the development history, research hotspots, and future trends of remote-sensing technology in the study of phytoplankton blooms, we conducted a comprehensive review to systematically analyze the research trends in the remote sensing of phytoplankton blooms through bibliometrics. Our findings showed that research on the use of remote-sensing technology in this field increased substantially in the past 30 years. “Oceanography,” “Environmental Sciences,” and “Remote Sensing” are the most popular subject categories. Remote Sensing of Environment, Journal of Geophysical Research: Oceans, and International Journal of Remote Sensing were the journals with the most published articles. The results of the analysis of international influence and cooperation showed that the United States had the greatest influence in this field and that the cooperation between China and the United States was the closest. The Chinese Academy of Sciences published the largest number of papers, reaching 542 articles. Keyword and topic analysis results showed that “phytoplankton,” “chlorophyll,” and “ocean” were the most frequently occurring keywords, while “eutrophication management and monitoring,” “climate change,” “lakes,” and “remote-sensing algorithms” were the most popular research topics in recent years. Researchers are now paying increasing attention to the phenological response of phytoplankton under the conditions of climate change and the application of new remote-sensing methods. With the development of new remote-sensing technology and the expansion of phytoplankton research, future research should focus on (1) accurate observation of phytoplankton blooms; (2) the traits of phytoplankton blooms; and (3) the drivers, early warning, and management of phytoplankton blooms. In addition, we discuss the future challenges and opportunities in the use of remote sensing in phytoplankton blooms. Our review will promote a deeper and wider understanding of the field.
1. Introduction
Algae (phytoplankton) are one of the most widely distributed groups of organisms on Earth [1]. As an important primary producer, phytoplankton are a fundamental component of the material cycle and energy flow in aquatic ecosystems [2]. With eutrophication and climate change, phytoplankton blooms exhibited widespread global increases, severely threatening aquatic ecosystem functioning and degrading water quality for recreation, drinking water, fisheries, and human health [3,4]. Phytoplankton blooms can produce toxic secondary metabolites, which can cause severe acute poisoning of animals and humans; affect the hepatopancreas, digestion, endocrine, skin, and nervous systems [5,6,7]; and cause serious pollution of water, fish, and shellfish. Moreover, they emit unpleasant odors, leading to beach closures and losses in the fishing, recreation, food, and real estate industries [2]. Phytoplankton blooms also cause a loss of water transparency, which inhibits the growth of aquatic macroplants and negatively affects invertebrate and fish habitats [8]. The oxygen depletion that is caused by microbial degradation after the termination of blooms may lead to hypoxia, and the subsequent death of fish and benthic invertebrates [9].
An effective and reliable method for monitoring phytoplankton dynamics is critically important for the early warning, treatment, and management of phytoplankton blooms and, in turn, improving water quality management and lake ecological restoration [10]. The traditional method for phytoplankton bloom monitoring was well documented through ship-based field sampling and laboratory analyses [11,12]. While the traditional method can provide accurate results, its limitations are obvious. The method is highly laborious, time-consuming, and expensive, and it is nearly impossible to derive spatial information on phytoplankton blooms. These disadvantages have severely limited its application to the timely monitoring of phytoplankton blooms at a large scale [13]. The unique spectral characteristics of phytoplankton pigments (e.g., the obvious absorption peaks of chlorophyll a near 440 nm and 675 nm, and the absorption peaks of phycocyanin at 615‒630 nm) enable the use of remote-sensing data to monitor phytoplankton blooms [14]. With the advantages of wide coverage, high temporal resolution, and low cost, remote-sensing approaches have been widely used to derive phytoplankton biomass (chlorophyll a concentrations), bloom area, and phenology for the past several decades [15,16,17]. However, the use of remote-sensing technology to study phytoplankton blooms has focused on specific research objectives. The overall research progress in this field and future research directions remain vague.
Bibliometrics is a discipline that uses the literature system and bibliometric characteristics to study the distribution, quantitative characteristics, variation patterns, and quantitative management of bibliographic information via mathematical and statistical methods [18,19]. Based on objective and accurate methods, bibliometrics has been widely used to examine the research hotspots and future trends of various disciplines with large amounts of data and long timescales [20]. The Social Sciences Citation Index (SSCI) database and the Science Citation Index Expanded (SCIE) database are the most commonly used data sources in bibliometric research, and their high-quality publications can convincingly assess the development of disciplines, current hotspots, and future directions. We reviewed the literature on the use of remote-sensing technology to study phytoplankton blooms in the SSCI and SCIE databases and found that the field was used in phenology [21,22], phycocyanin recognition [17], sensors and remote-sensing methods for monitoring phytoplankton blooms [23,24,25], phytoplankton bloom early warning [26], phytoplankton diversity identification [27], and other aspects; however, few researchers have focused on evaluating the application of remote sensing in the study of phytoplankton blooms through bibliometric methods.
Therefore, in this study, based on the SSCI and SCIE databases, we used bibliometrics to perform a comparative quantitative and qualitative analysis of the development status, current hotspots, and future directions of remote-sensing technology in the study of phytoplankton blooms. Specifically, the purpose of this research was to (1) summarize the change characteristics of the total number of publications, the distribution of disciplines, and the influence of countries, journals, and institutions; (2) review current research hotspots based on the analysis of keywords and topic trends; and (3) discuss future directions to provide a reference for the future work of researchers.
2. Data and Methods
2.1. Data
The data that was used in this article were based on online versions of the SSCI and SCIE databases in Web of Science. The SCI is a multidisciplinary database of the Institute of Scientific Information in Philadelphia, Pennsylvania, USA. According to the Journal Citation Report (JCR), as of 2020, the SSCI and SCIE databases included 20,042 major journals, involving 236 scientific disciplines. To conduct the bibliometric analysis, the following retrieval formula was used to obtain all publications that were related to the application of remote-sensing technology to study phytoplankton blooms from 1990 to 2020:
TS = ((“cyanophyt*” OR “cyanobacteri*” OR diatom* OR “bacillariophyt*” OR “chlorophyt*” OR “pyrrophyt*” OR “dinoflagellate*” OR phytoplankton OR alga* OR phycocyanin OR (bloom* AND (water* OR alga* OR phytoplankton OR cyanobacteri*)) OR (chlorophyll* NOT (Forest* OR Leaf* OR Grain* OR Crop* OR Plant*)) OR “red tide”) AND (“remot* sens*” OR “remot* estimat*” OR satellite* OR “Landsat*” OR “MERIS” OR “SPOT” OR “GOCI*” OR “ SeaWiFS *” OR “Sentinel*” OR “IKONOS*” OR “HJ-*” OR “GF-*” OR “MODIS*” OR “AVHRR” OR “Quickbird*” OR “ASTER*” OR “WorldView*” OR “UAV”)).
In the retrieval formula, we collected common vocabularies that can represent phytoplankton and restricted the term “bloom” to blooms in water as opposed to blooms on land. We also collected the sensor names that are widely mentioned in the SSCI and SCIE databases to establish a comprehensive list of related publications. A total of 10,938 publications were retrieved, and 6956 publications remained after data cleaning and screening. Document information included the publication year, source journal, subject, author, language, country, institution, and keywords. The complete record was downloaded to Microsoft Excel 2019 to reveal the pattern of phytoplankton bloom research using remote-sensing technology in the following aspects: the changing characteristics of the total publications, the distribution of publications in subject categories and journals, the influence and cooperation of countries and institutions, and the current hotspots and future directions in this field. The contributions of countries and institutions were determined based on the affiliation of at least one author of a published paper. Articles from Hong Kong and Taiwan were considered to be from China.
2.2. Analysis Method
Keywords include the most critical information in the paper. Research on keywords can uncover hot topics in a given field. VOSviewer is a program that can clearly show the coauthors of authors and countries (institutions) and the co-occurrence of keywords, and the powerful data processing function of VOSviewer allows for the intuitive mining of research hotspots [28]. The latent Dirichlet allocation (LDA) model is a powerful tool for bibliometric research and the LDA model can identify topics and determine their trends by using abstracts from related publications [29]. The LDA model captures the relationship between words and topics according to the frequencies of the keywords in different topics, classifies the topics through word sense clustering, and analyzes the temporal characteristics of the content of each topic to investigate the interannual changes in the popularity of related fields; thus, the development and evolution of topics are predicted [30,31]. The LDA model has been widely used in the fields of topic detection, topic mining and hotspot discovery and is currently the most popular topic modeling technology [32]. In this research, we used VOSviewer to analyze the cooperative relationship between the country and the organization, the co-occurrence of keywords, and the timing of keywords, and we used the LDA model for topic analysis.
3. Results and Discussion
3.1. Variation Characteristics of Total Publications
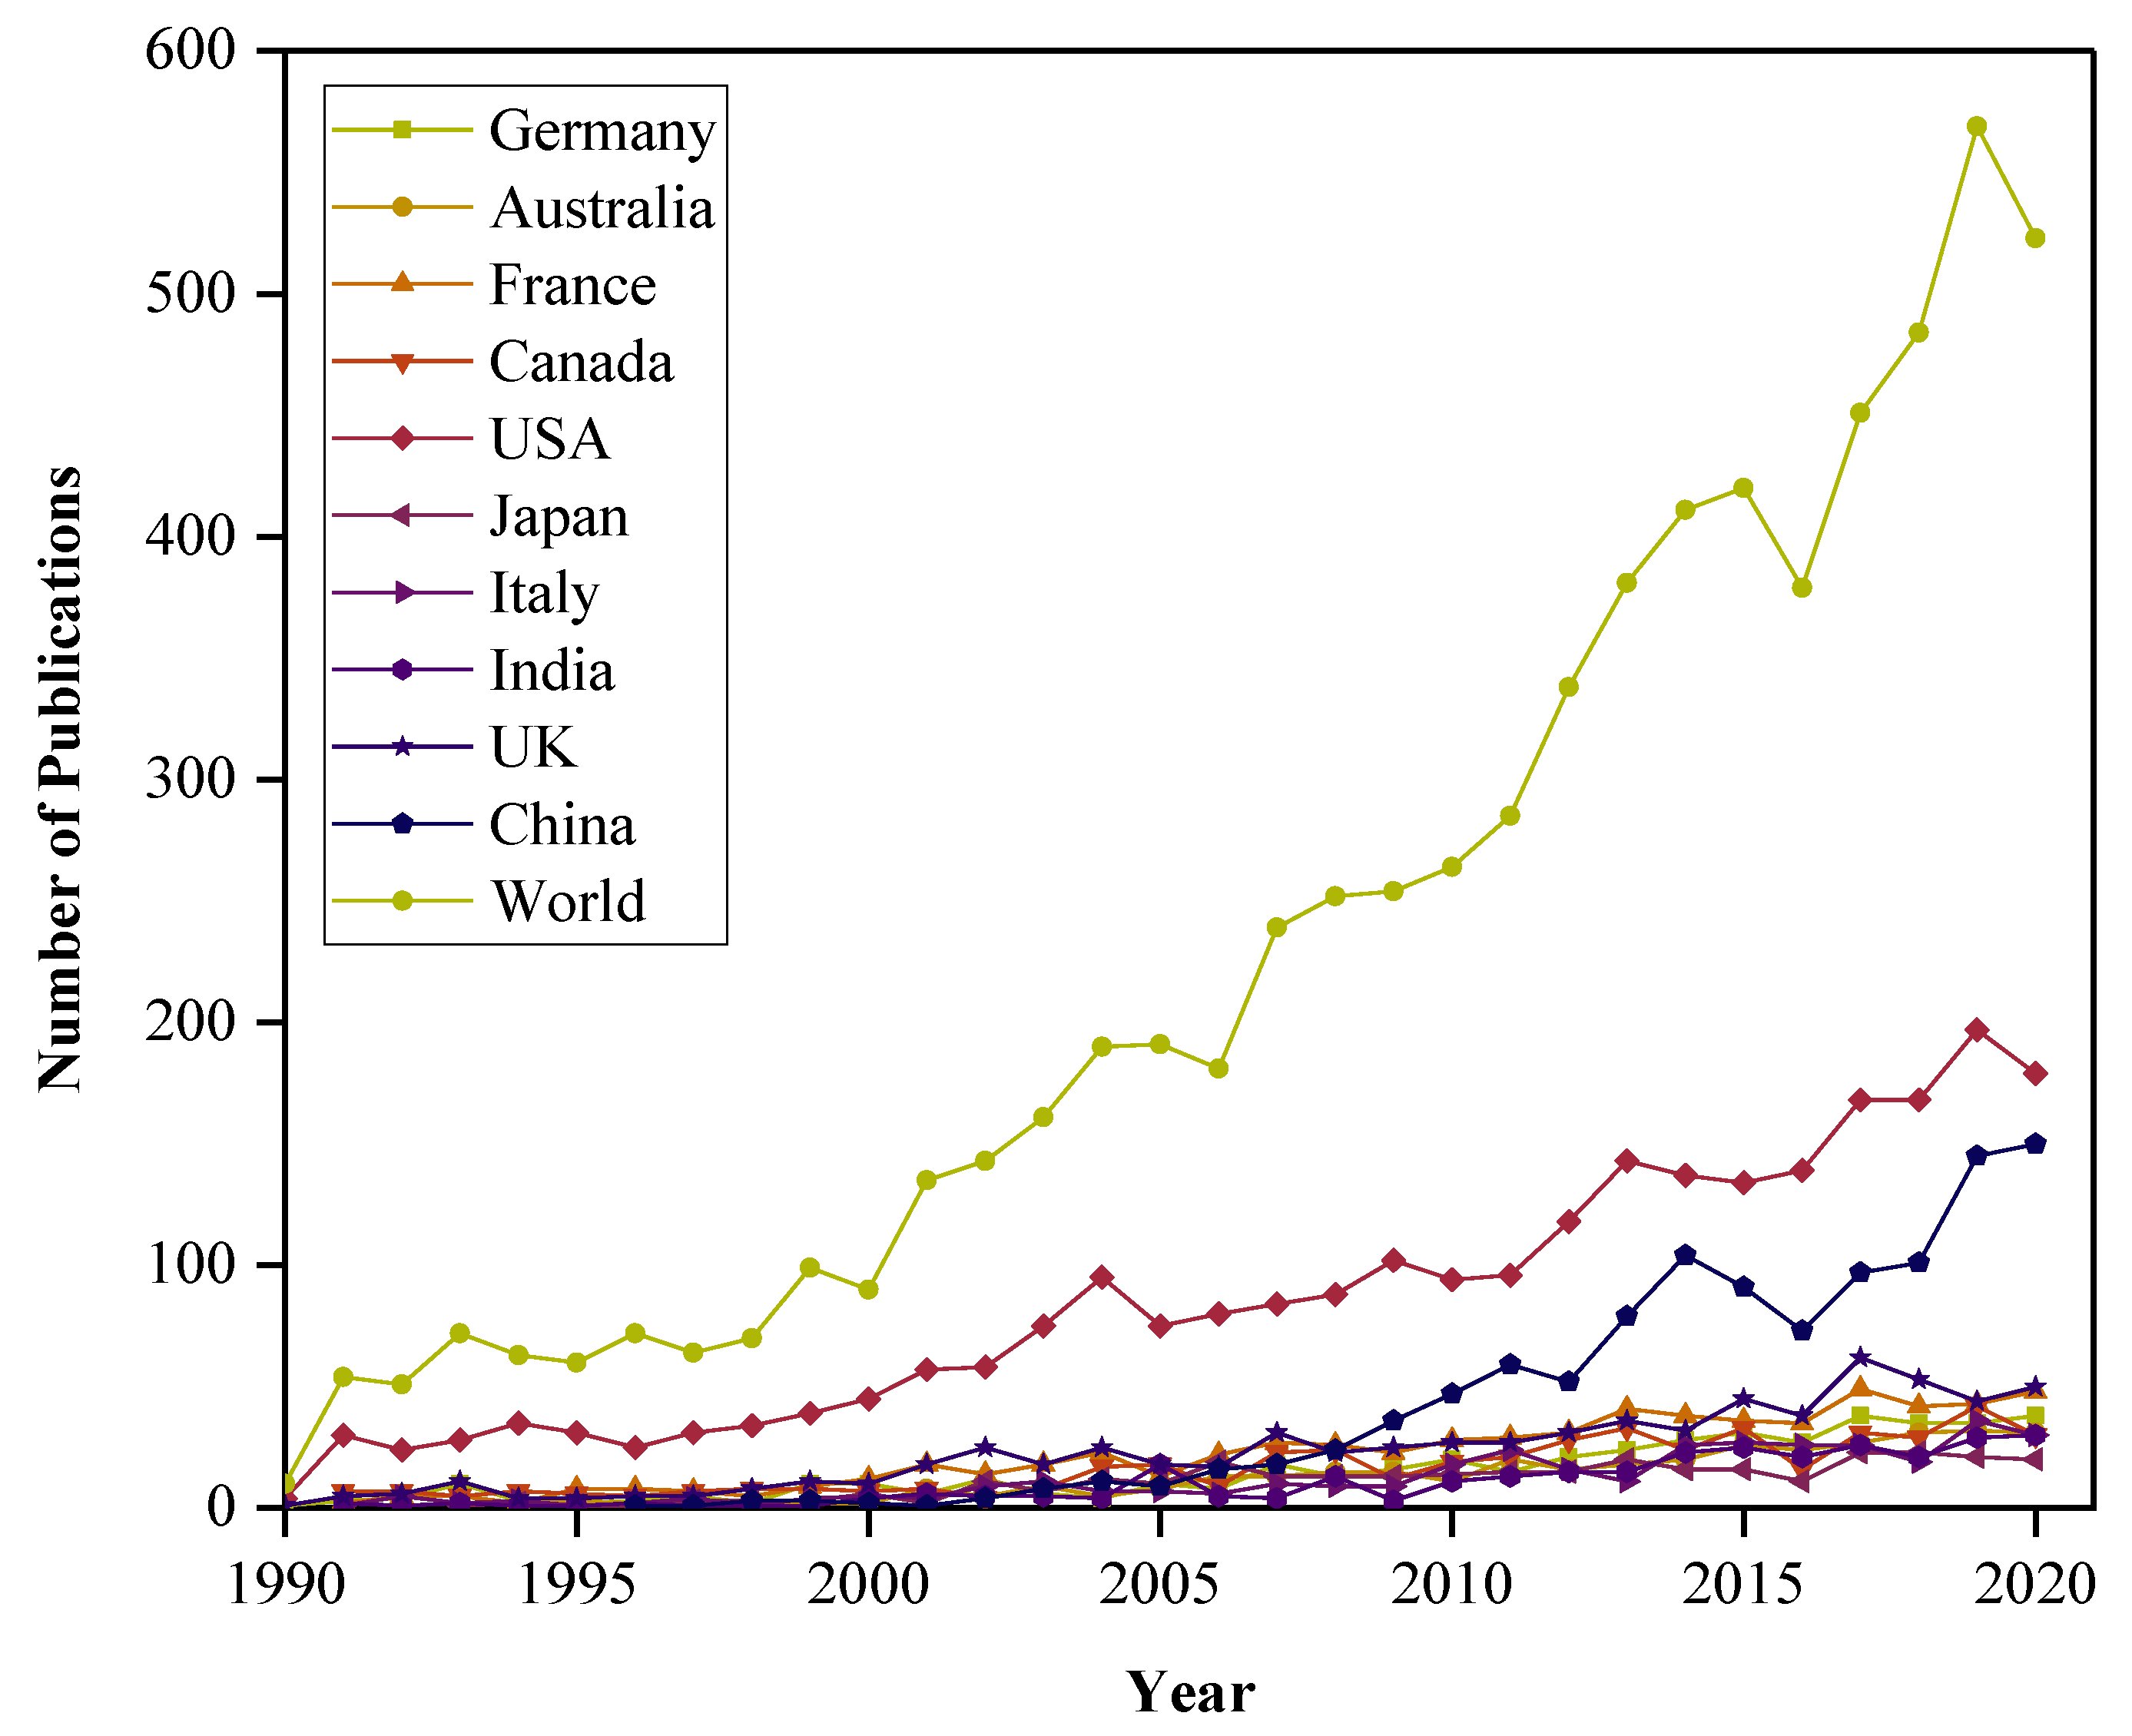
Based on the statistical analysis of the annual number of publications (Figure 1), the number of various types of publications that were related to the application of remote sensing in phytoplankton research showed an overall increase between 1990 and 2020. The number of publications from 1990 to 2000 was low, with fewer than 100 papers per year. From 2000–2015, the number of publications increased significantly, and the number of articles steadily increased from 90 in 2000 to 420 in 2015. The total number of papers that were published in 2015 was close to four times that in 2000. However, from 2015–2017, the number of publications slowly increased, with a decline in 2016, where the number dropped to 379. After 2016, the total number of world publications continued to grow and peaked at 569 in 2019 but declined slightly in 2020.
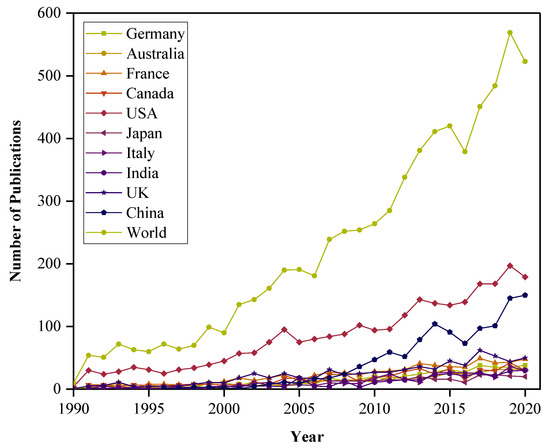
Figure 1.
Trends in the number of articles from around the world and major countries.
From a national perspective, the United States was the first to apply remote sensing to study phytoplankton, and it published considerably more papers than other countries. Between 1990 and 1995, there was a gap in this field in China, where almost no relevant research papers were published. In recent years, many publications have emerged. The development trend of other countries has also shown steady growth but to a lesser extent. The overall interest in this field was low, but a certain amount of research was conducted. From the regional perspective, East Asia, Europe, and North America have made the largest contributions to this field, while Africa, West Asia, and South America made fewer contributions, which may be related to the state of the aquatic environment in these areas and whether there is technical, economic, and policy support. In addition, land-locked countries without large lakes may not have the incentive to pursue remote-sensing monitoring of phytoplankton blooms. Furthermore, countries with higher industrial and agricultural levels are more likely to have issues with aquatic ecosystems, exacerbating the occurrence of phytoplankton blooms, which leads these countries to pay more attention to water environment issues [33].
3.2. Publication Patterns: Subject Categories and Journals
The discipline and journal distributions were analyzed from the search results to identify the overall disciplinary hotspots. According to Table 1, for the application of remote sensing to phytoplankton research, Oceanography was the main discipline, and remote sensing was most often applied to Environmental Science, Imaging Science Photographic Technology, Geosciences, and Biology. Thus, biological and environmental topics were the issues to which remote sensing was most often applied.

Table 1.
Distribution of major disciplines during 1990‒2020 (there is an overlap between the discipline percentages in the table).
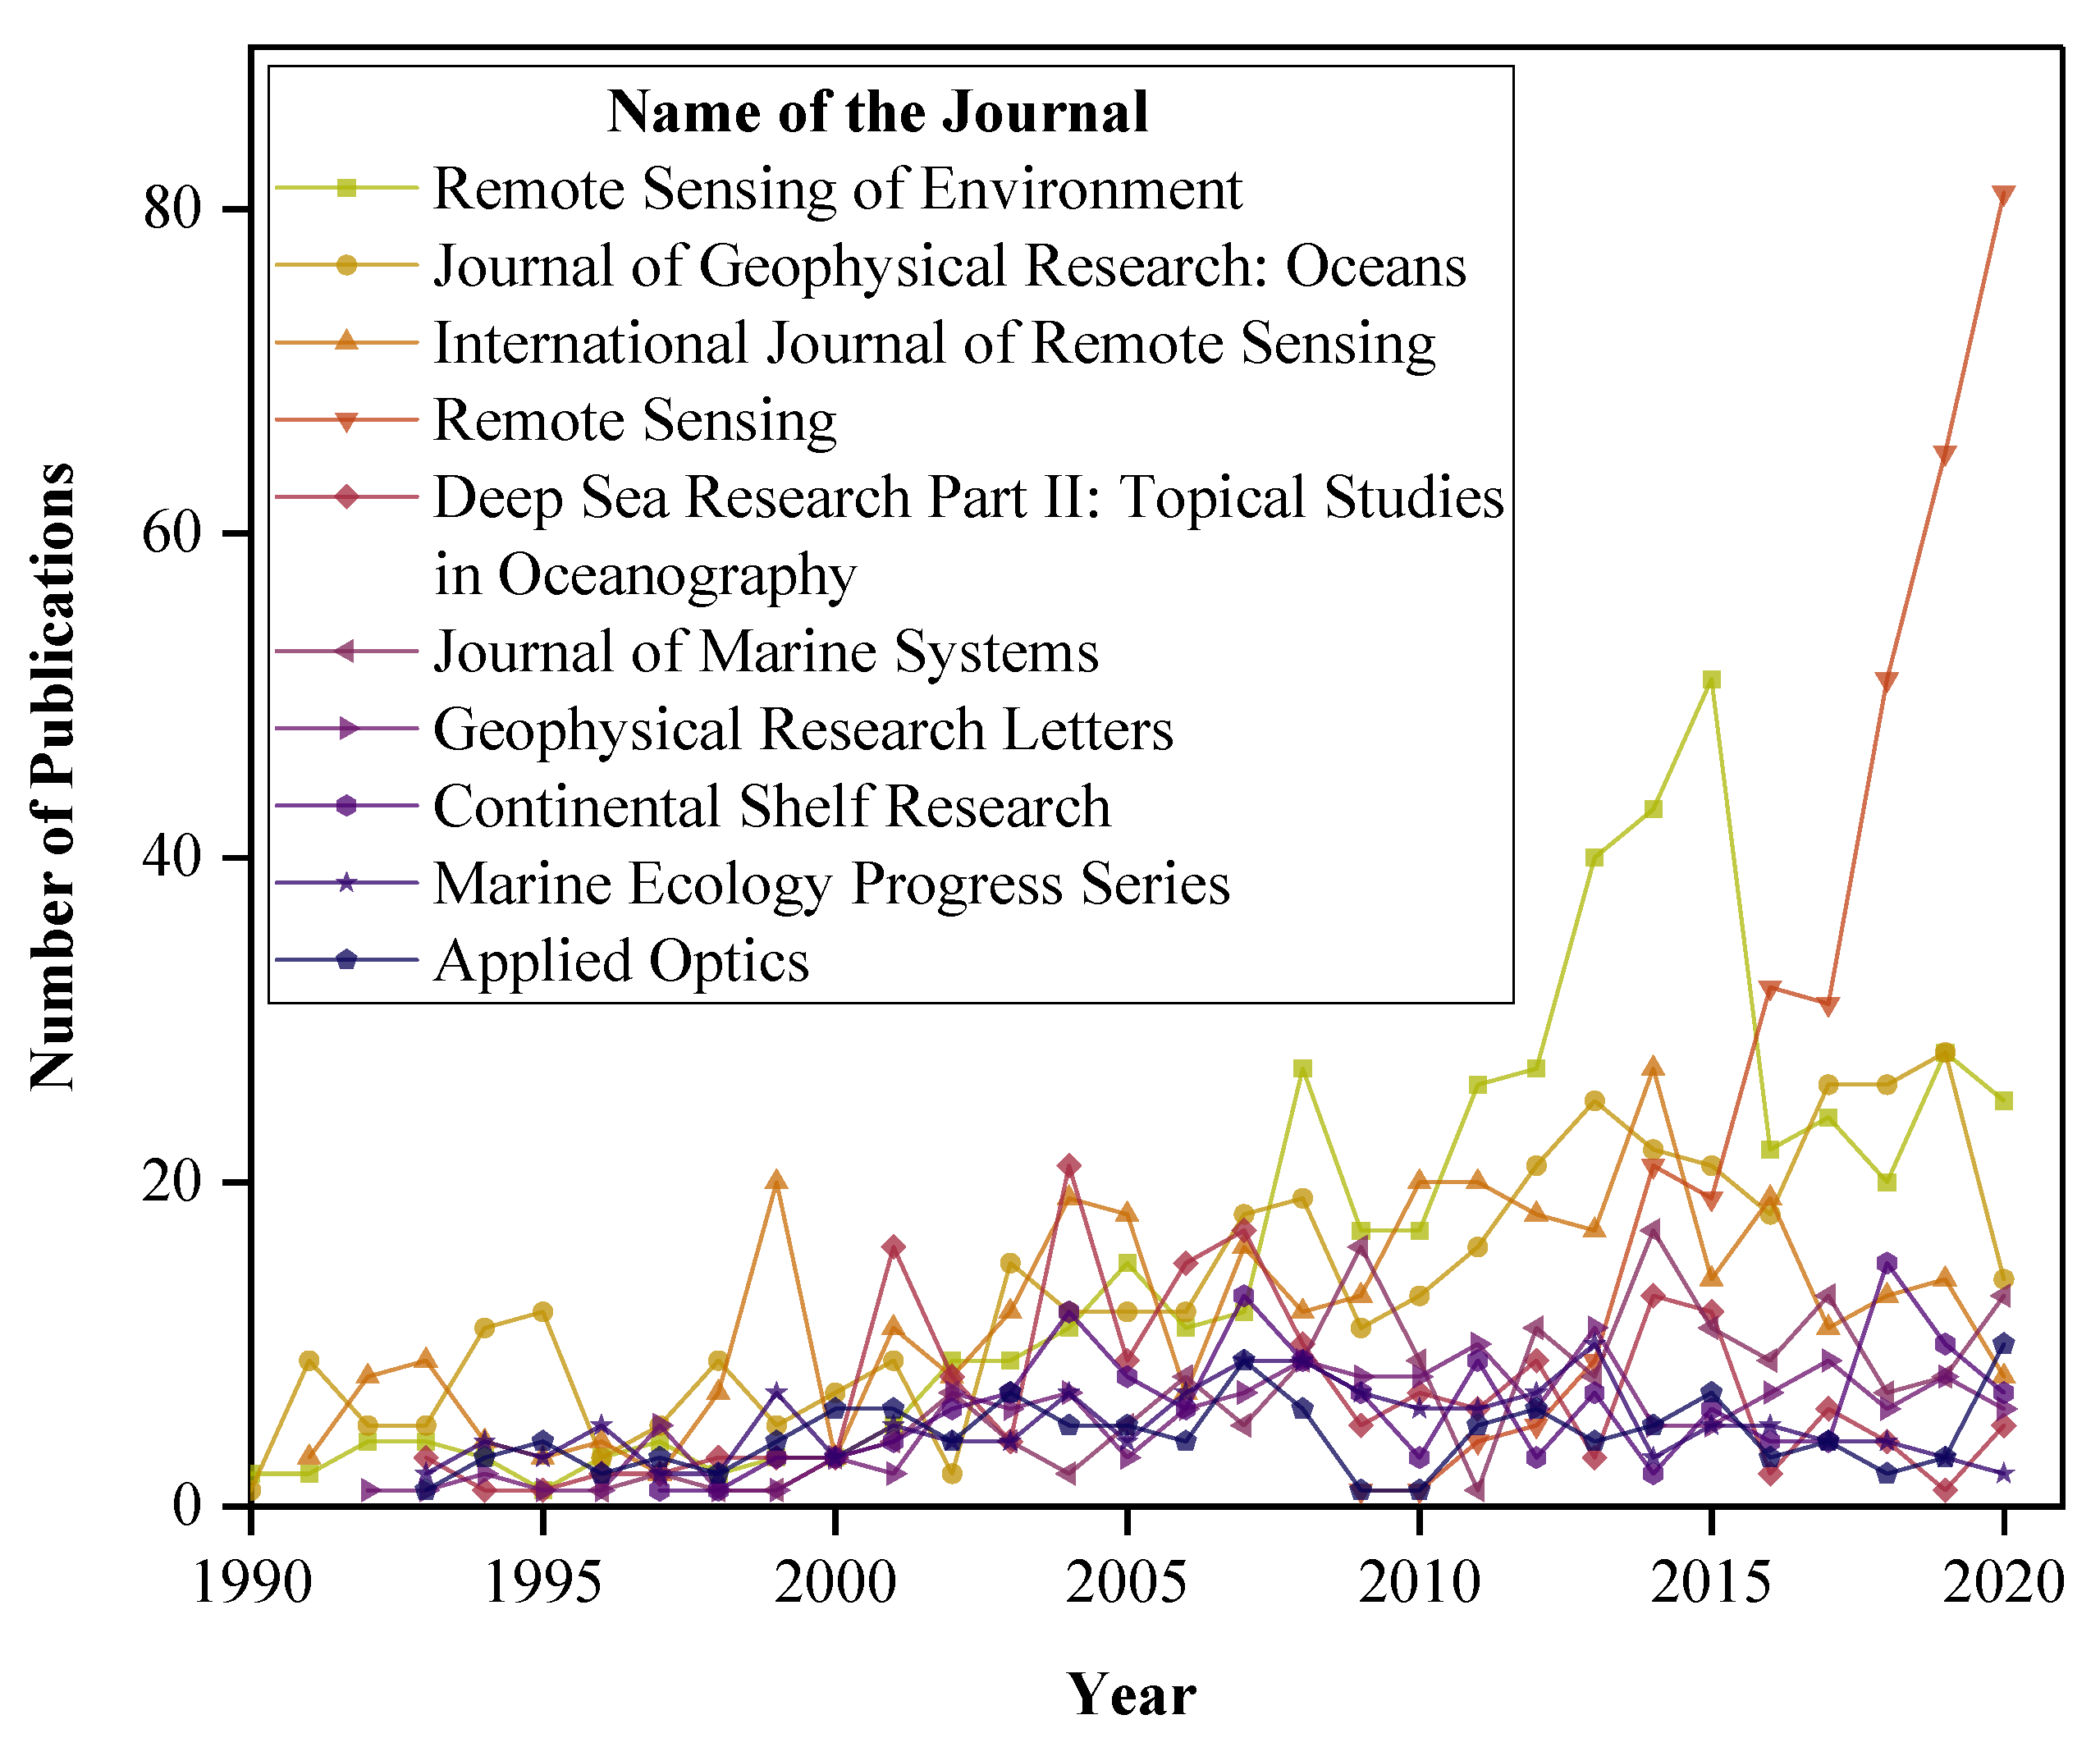
According to Table 2, of the 10 journals with the most publications, Remote Sensing of Environment published the most articles, followed by Journal of Geophysical Research: Oceans, International Journal of Remote Sensing, Remote Sensing, and Deep Sea Research Part II: Topical Studies in Oceanography. The number of publications in other journals was relatively low, all below 200. In terms of the publication trends of major journals (Figure 2), the journal Remote Sensing has increased its relevant publications rapidly since it was founded in 2009 and has become the journal with the most relevant publications in recent years. The number of publications in Remote Sensing of Environment was high and continued to increase until 2015, but the number of articles published in the journal has fluctuated in recent years. Nevertheless, it is still the journal with the most publications and, thus, its influence cannot be ignored. The number of publications in Journal of Geophysical Research: Oceans also showed a steady increase and is also exerting an important influence. Other journals with fewer publications showed irregular trends and fewer annual publications.
Table 2.
The top 10 most productive journals and their impact factors in 2020, and the number and percentage of papers from 1990 to 2020.
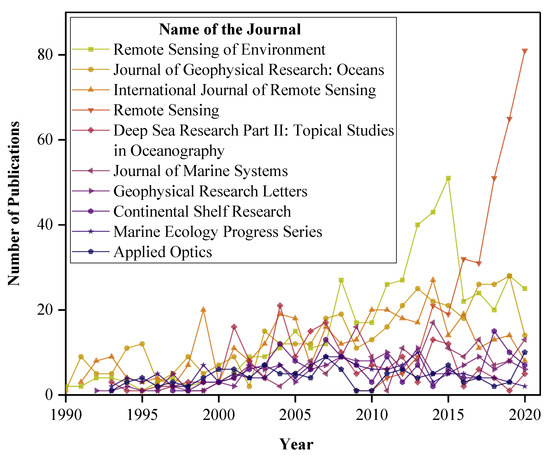
Figure 2.
Trends in the number of papers published in major journals.
3.3. National Publication Performance and Cooperation
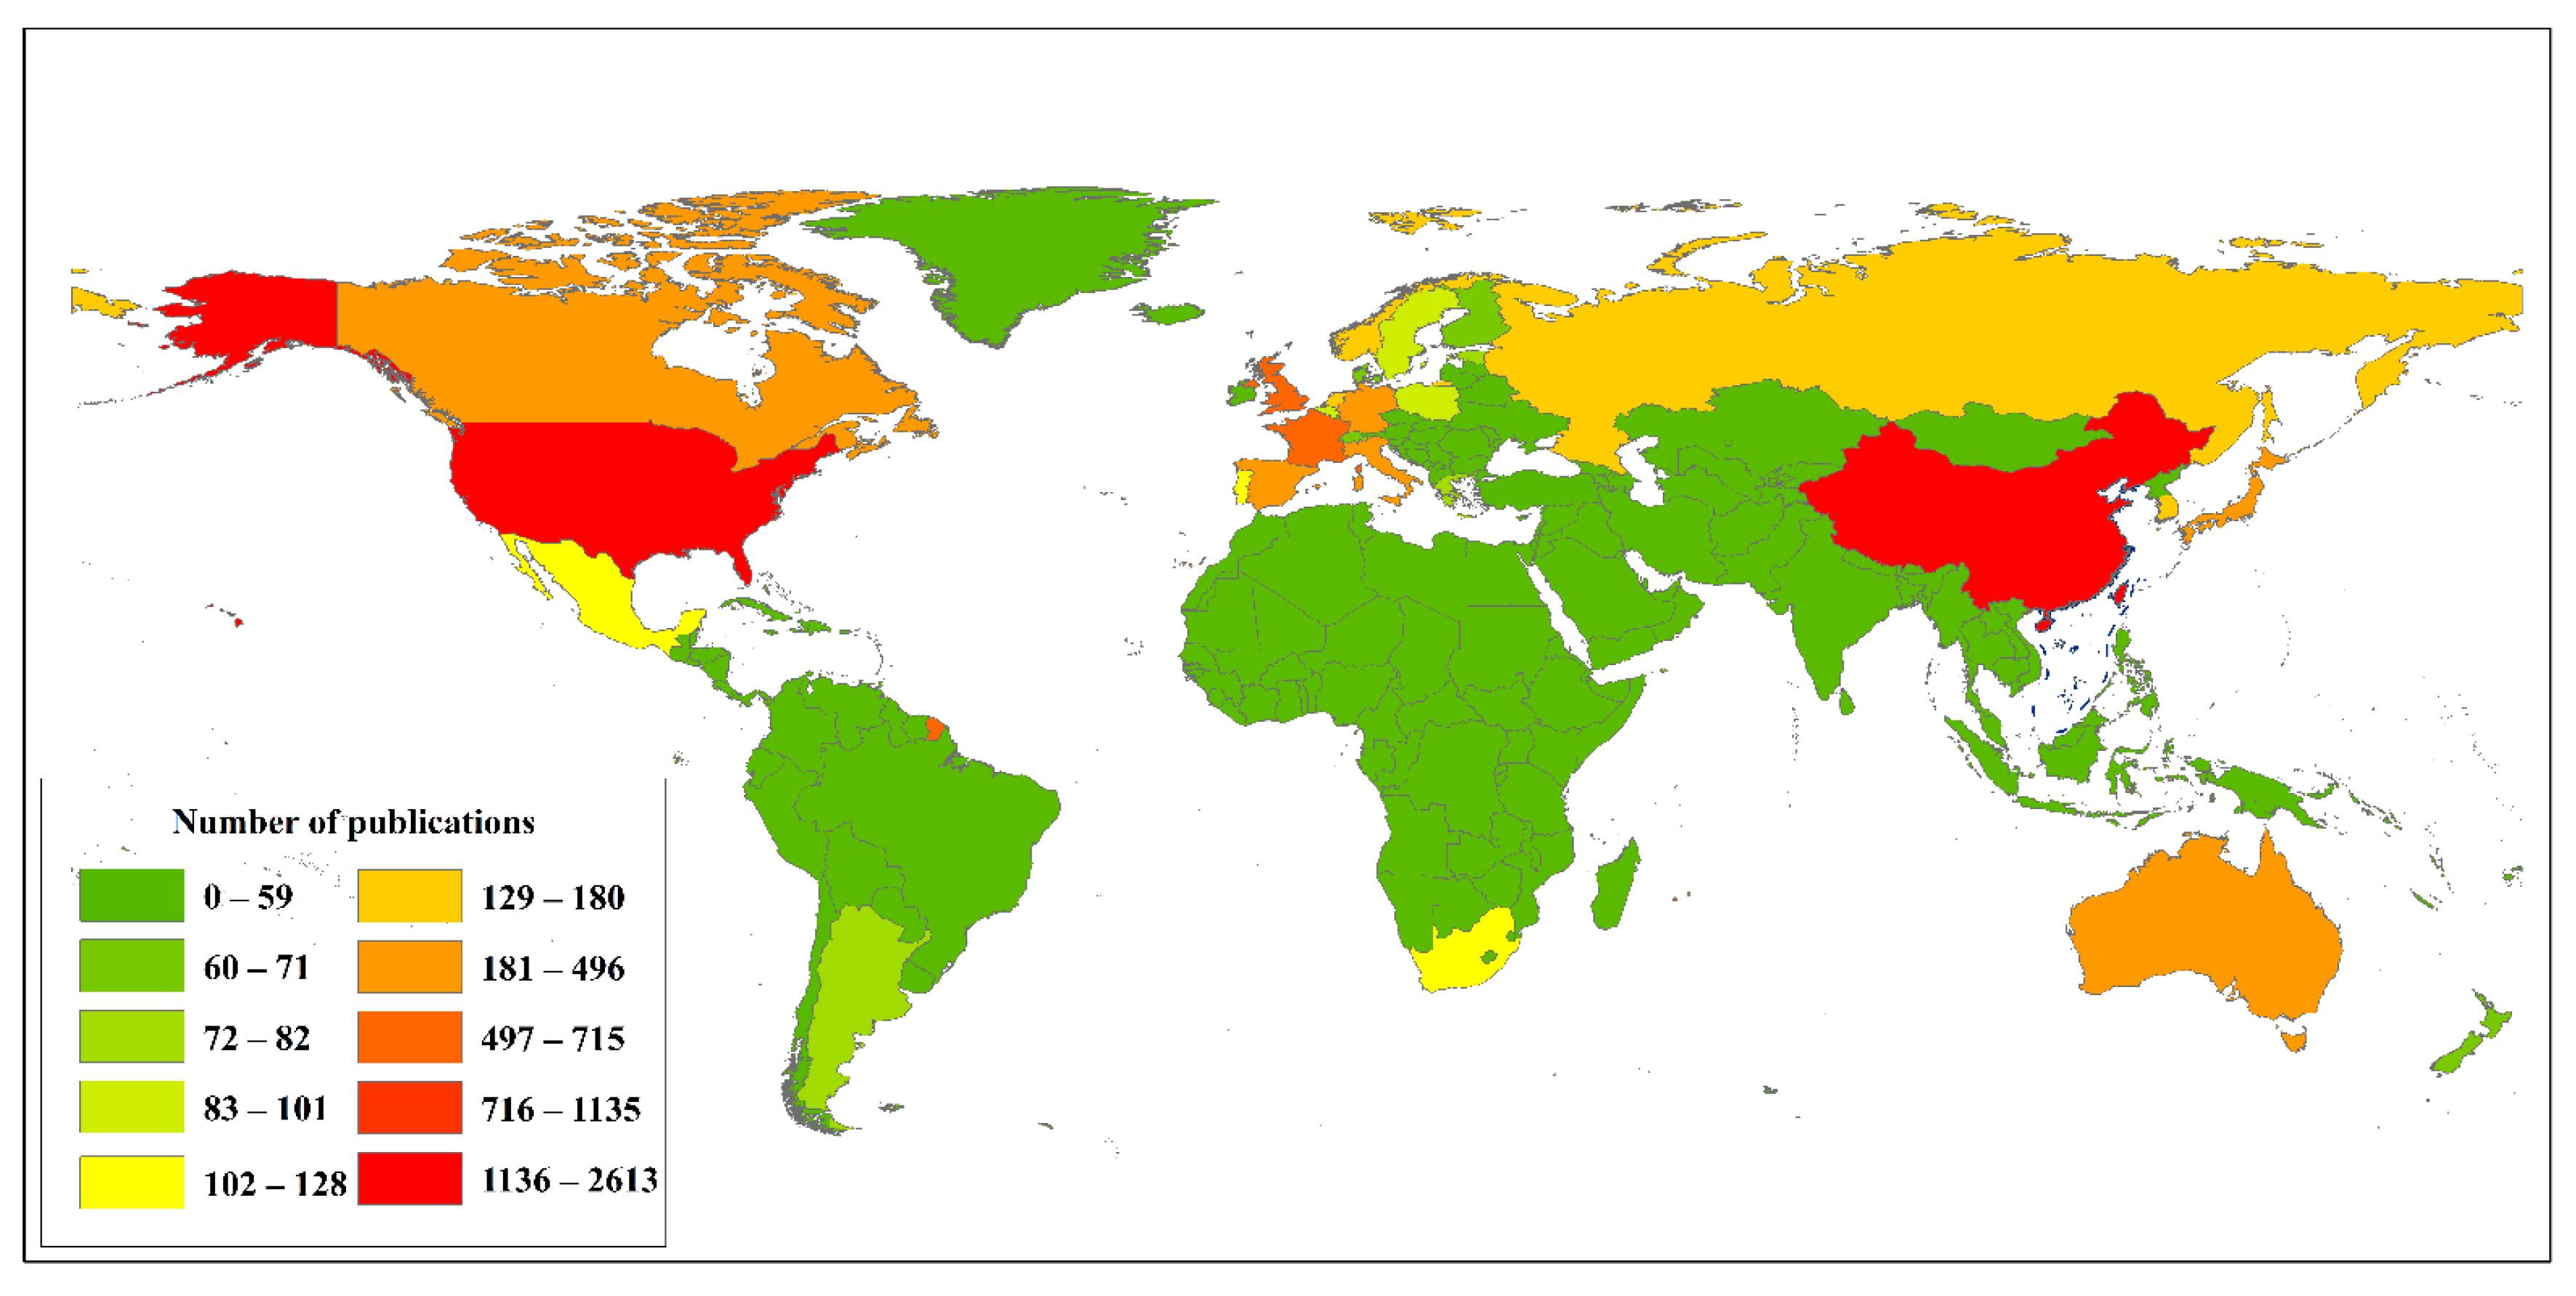
Visual analysis of the number of publications and the collaborative relationships between countries and research institutions can clarify research hotspots and institutional influence and visually demonstrate the developmental status of related fields (the notion of a cooperative relationship in this study was only based on the association between articles and the absence of conflicts of interest). We classified cooperative relations into three parts (Figure 3): cooperative relationships that were mainly based in the United States and China; cooperative relationships that were based in the United Kingdom, Norway, Germany, Spain, etc.; and cooperative relations based in France, Canada, Brazil, etc. The number of publications by major countries (Figure 4) showed that the United States and China had the largest number of publications, the closest cooperative relationships, and the greatest influence. Although Germany, England, Spain, Italy, France, and other countries had good research outcomes in this field, the total number of publications and the publication growth trends for these countries were lower than those of China and the United States. The United States was a leader in this field and had the closest collaborations with other countries. Although China ranked second in terms of the number of publications, its degree of international collaboration was fairly low. We recommend strengthening international exchange to better develop new technologies to improve the monitoring and early warning of phytoplankton blooms.
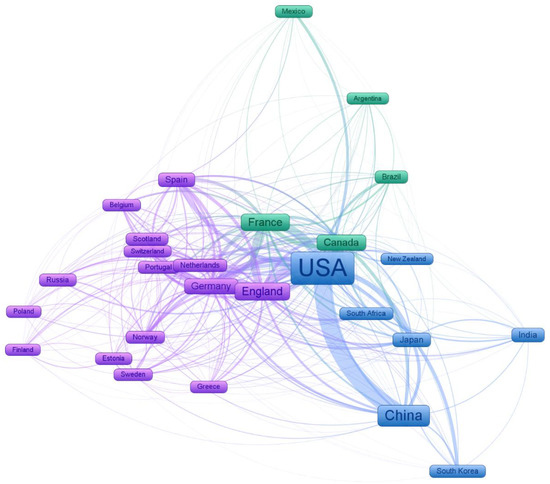
Figure 3.
Cooperation between countries (the same color in the figure indicates the most closely related cooperation group; the size of the box indicates the number of national papers, with a larger box indicating more papers; and a connection between countries indicates the intensity of cooperation, with a thicker connection indicating a closer cooperative relationship).
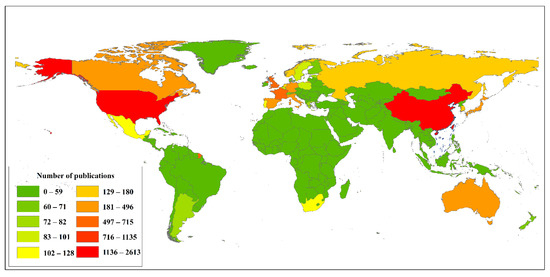
Figure 4.
Number of papers published by major countries from 1990 to 2020 (publications may be counted multiple times because of the affiliations between authors).
Statistical analysis of the number of publications by major institutions (Table 3) and collaboration with the institutions are visually illustrated in Figure 5. Interinstitutional collaboration was mainly between high-impact institutions, such as the Chinese Academy of Sciences (CAS), the University of Florida, the National Aeronautics and Space Administration (NASA), the National Oceanic and Atmospheric Administration (NOAA), and the Plymouth Marine Laboratory. The collaborations between China and the United States were limited compared with the collaboration within Chinese institutions. The Chinese partner institution was mainly the CAS, and the main collaborative institutions were well-known domestic universities (such as Xiamen University and the Ocean University of China) and well-known research institutions with research partnerships abroad. In contrast, collaborating institutions in the United States were diversified, with a large number of collaborating institutions and close cooperation. Although the CAS was credited in many publications in this field, most of them were authored only by Chinese authors, with a relatively low degree of international collaboration. The other well-known universities had large gaps in the number of publications from the CAS, and the degree of international collaboration was also weak.
Table 3.
The top 10 most productive institutions and the country in which they were located and the number and percentage of papers from 1990 to 2020.
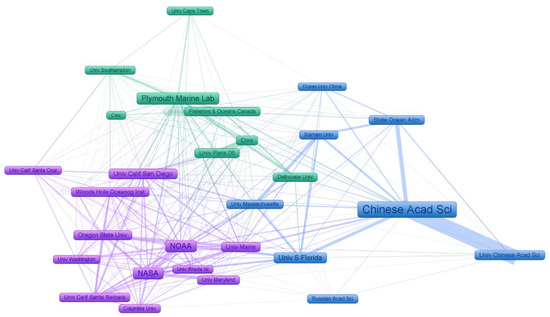
Figure 5.
Cooperative relationships of major scientific research institutions around the world from 1990 to 2020 (the same color in the figure indicates the most closely related cooperation group; the size of the box indicates the number of papers that were published by the institution, with a larger box indicating more papers; and the connection between institutions indicates the intensity of cooperation, with a thicker connection indicating a closer cooperative relationship).
3.4. Research Hotspots and Tendencies
3.4.1. Keyword Analysis
The analysis of keywords is an important way to reveal the core content of a paper. We classified the keywords into three groups, namely, marine phytoplankton dynamics, water color, and eutrophication of inland water bodies (Figure 6a). For the topic of dynamics of phytoplankton in ocean water, “phytoplankton,” “ocean,” “dynamics,” “temperature,” and “climate change” all showed a high status in terms of position and size. For the topic of water color, “model,” “DOM (Dissolved Organic Matter),” “ocean color,” “absorption,” and “optical-properties” reflected the popular research methods of colored substances in water bodies with the support of remote sensing. For the topic of eutrophication of inland water bodies, the popularity of “remote sensing,” “chlorophyll,” “inland waters,” “reflectance,” “water quality,” “lake,” and “blooms” indicated that the study of inland water environments was also an important research direction in this field.
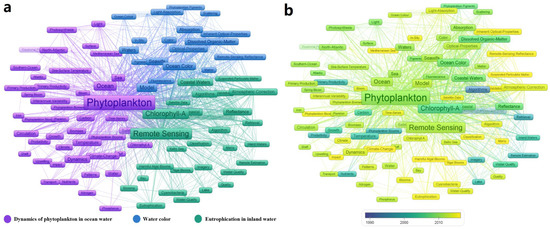
Figure 6.
(a) Keyword relevance analysis (the larger the box in the graph, the higher the word frequency; the closer the box is to the center, the higher the importance; the thicker the line between boxes, the more times they appeared together). (b) Time sequence analysis of keywords (the closer to purple the keyword color is, the earlier the keyword appeared; in contrast, the closer to yellow the keyword color is, the later the keyword appeared).
Based on the keyword sequence diagram (Figure 6b), the terms “algorithm,” “retrieval,” “ocean color,” “chlorophyll,” and “primary productivity” appeared the earliest, followed by “phytoplankton,” “remote sensing,” “climate change,” “harmful blooms,” and “eutrophication” in recent years.
Based on the results of keywords and our summary of their sequential variation, with the increasing severity of water environment problems, people have paid more attention to these problems in a timely manner, and a variety of new research methods have gradually emerged, of which, water color remote sensing has become particularly important. However, in terms of categories, more attention was given to marine research than to inland water bodies, as represented by lakes and reservoirs. Under the dual pressure of global climate change and human activities, the water environment of inland water bodies is changing, and ecological problems are becoming more prominent; therefore, researchers’ attention has gradually turned to lakes and reservoirs. Against the background of global change, inland water environments are also becoming a research hotspot in this field, as are the bio-optical properties of the water environment, remote–sensing monitoring of eutrophication, phytoplankton information extraction, and biomass estimation.
3.4.2. Topic Analysis
We used the LDA model to extract 84 topics, of which, six topics with no clear meaning were deleted (16, 22, 39, 25, 47, 76), and topics with the same or similar meanings were merged (70 and 83; 56, 77, and 80; 36, 52, and 84; 5, 7, and 13; 43 and 75; 44 and 54). In total, 69 representative topics were obtained and divided into four general categories (Table 4). Then, we performed a linear trend analysis of the change in the number of publications corresponding to each topic over time. The degree of popularity of the corresponding topic was analyzed according to the slope and level of significance (p = 0.05, p = 0.01, p = 0.001, p = 0.0001).
Table 4.
Subject classification (the numbers in the table only represent the numbers assigned to each topic).
After the topic trend was analyzed using the LDA model, 22, 17, 9, and 7 topics were identified with significant linear declines at the p = 0.05, p = 0.01, p = 0.001, and p = 0.0001 levels, respectively, and 25, 23, 20, and 15 topics showed a significant linear increase at the p = 0.05, p = 0.01, p = 0.001, and p = 0.0001 levels, respectively (Table 5). Finally, we analyzed the popularity of the abovementioned topics with significant relevance (Figure 7 and Figure 8).
Table 5.
Topic significance classifications.
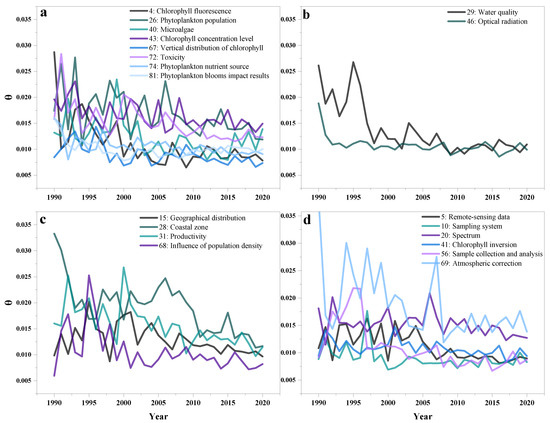
Figure 7.
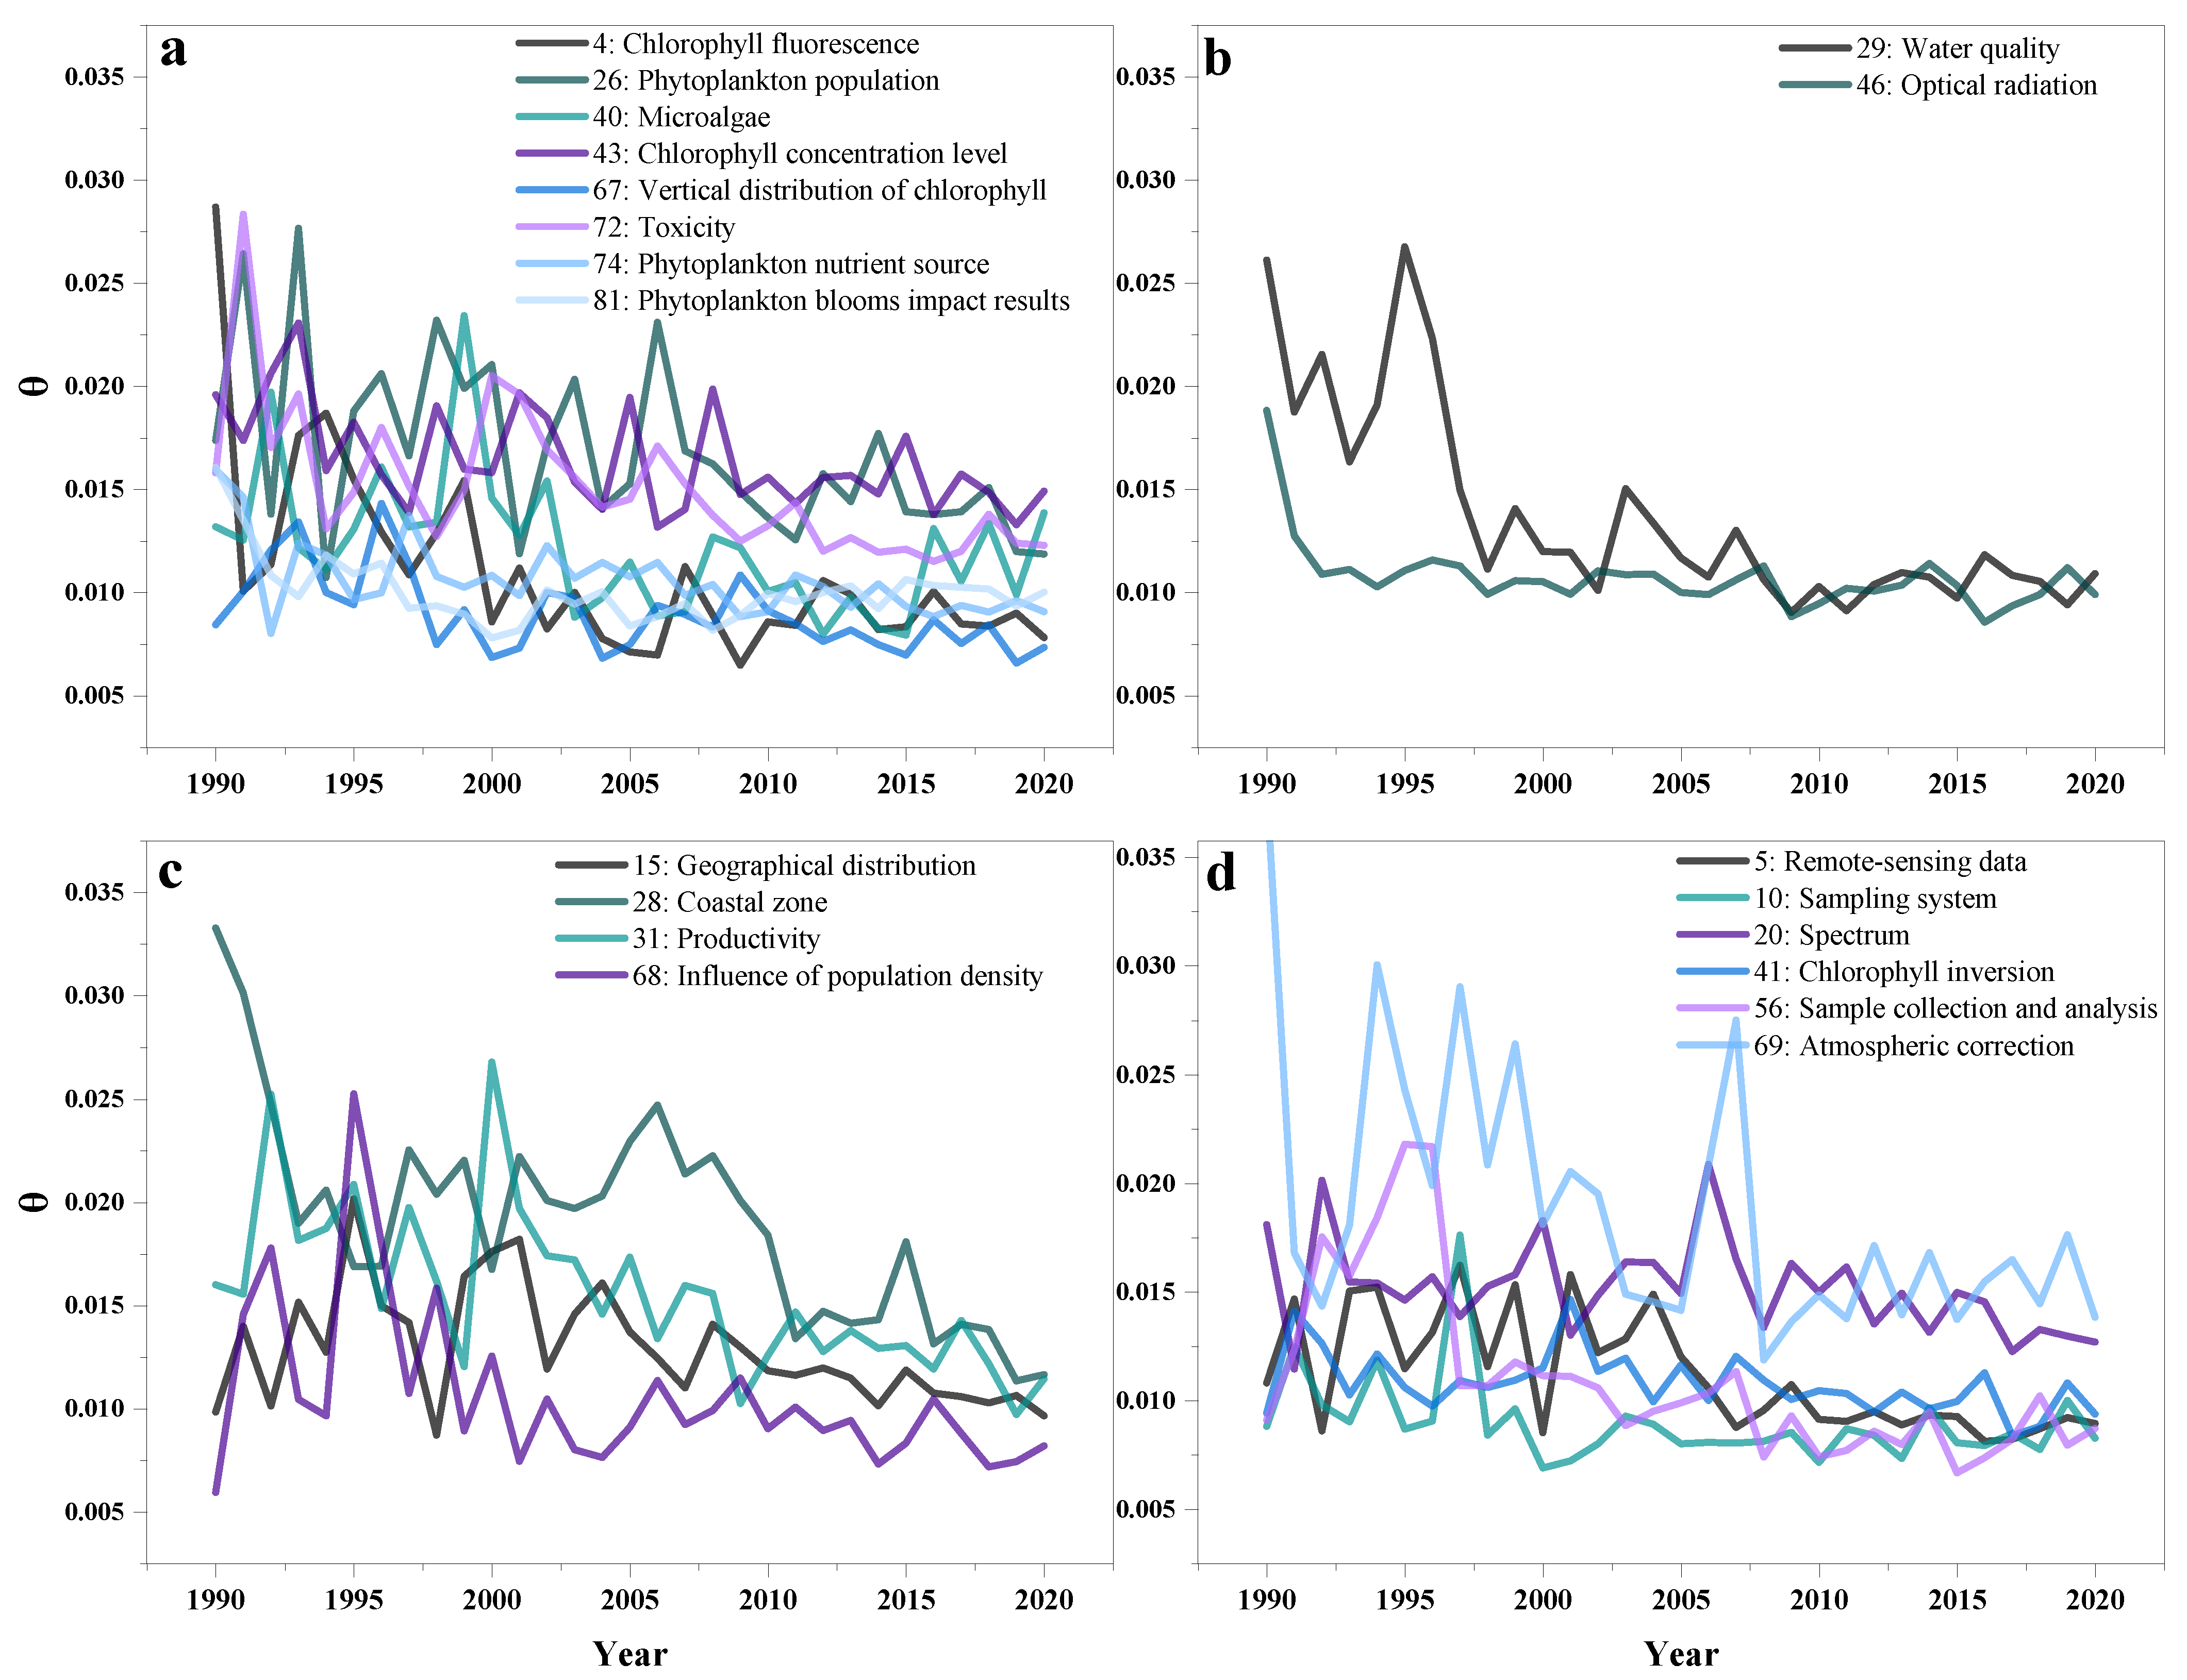
Cold theme tendency: (a) the subject of “algal (chlorophyll) changes,” (b) the subject of “temporal–spatial and environmental factors,” (c) the subject of “biological and geographic factors,” and (d) the subject of “remote sensing and methods.” The figure only shows topics with a significant linear decrease.
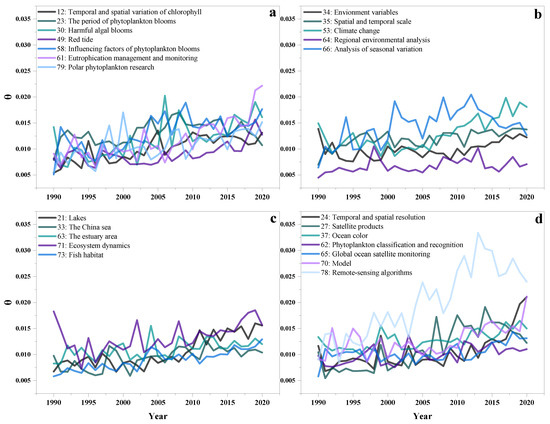
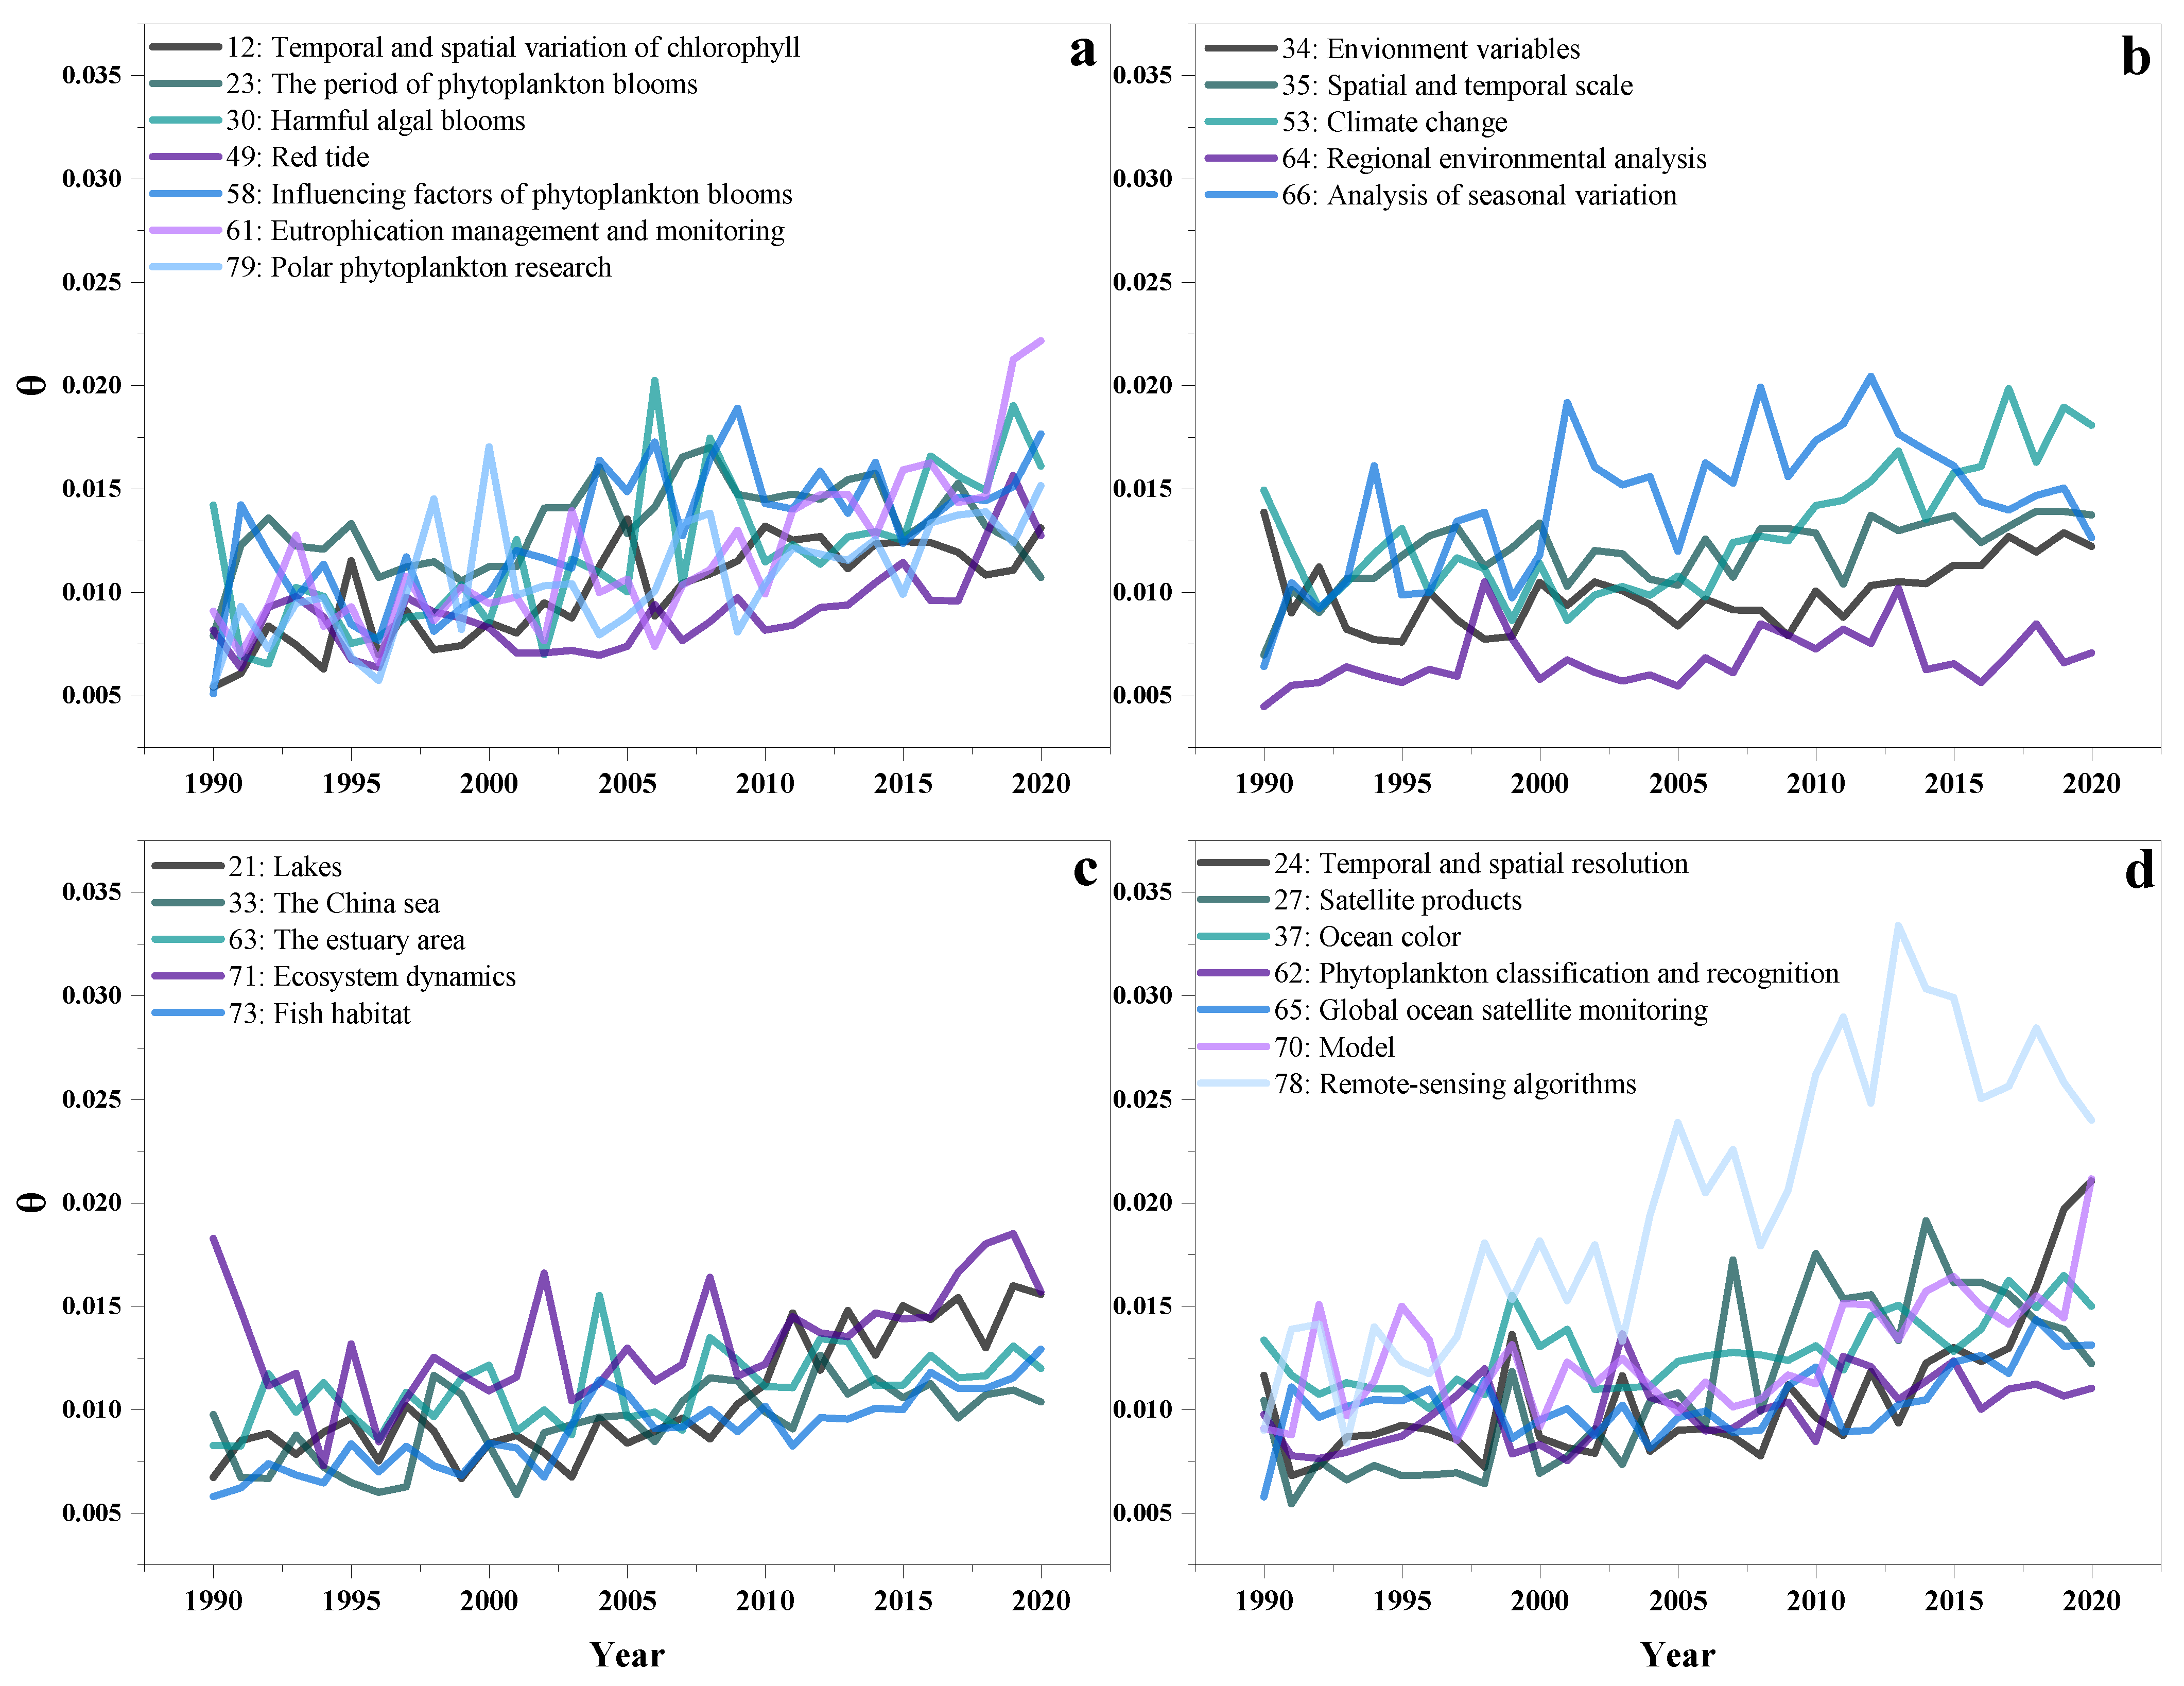
Figure 8.
Hot theme tendency: (a) the subject of “algal (chlorophyll) changes,” (b) the subject of “temporal–spatial and environmental factors,” (c) the subject of “biological and geographic factors,” and (d) the subject of “remote sensing and methods.” The figure only shows topics with a significant linear increase.
According to Figure 7, in the category of “algal (chlorophyll) changes,” attention to chlorophyll fluorescence remote sensing decreased, and the algal bloom impact results also showed a significant decline. In the category of “temporal–spatial and environmental factors,” the popularity of water quality and optical radiation gradually decreased. Then, in the “biological and geographic factors” category, the attention to geographic distribution dropped the fastest, and the attention to productivity also dropped significantly. Finally, in the category of “remote sensing and methods,” atmospheric correction and satellite data showed the most obvious decline in popularity, and attention to these topics dropped significantly. Since the emergence of remote sensing in the 1980s, its application has been extensively discussed and explored, and it once became a hot topic in the fields of urban construction, agriculture, and ecology. With the rapid development of remote-sensing applications, research on traditional methods, models, and parameters has matured; however, the inherent limitations of traditional remote-sensing technology have also slowed down the progress of this field. For example, limitations in the temporal and spatial resolution, satellite transit cycles, and the accuracy of phytoplankton bloom information extraction have led to various degrees of “bottlenecks” for research in this field. With the further development of space technology, remote sensing has entered a new era of high data volume, data diversity, high speed, and high accuracy. The emergence of new remote-sensing technologies, such as remote-sensing image information mining based on deep learning [34], high-frequency observation of phytoplankton using UAVs (unmanned aerial vehicles), and rapid identification of phytoplankton species using portable fluorescent sensors [35], has broken through the inherent limitations of many traditional remote-sensing techniques and provided a great opportunity for phytoplankton research. New opportunities and the application of new technologies have gradually reduced the topic of traditional remote-sensing technology development and research on a global scale.
According to Figure 8, in the “algal (chlorophyll) changes” category, eutrophication management and monitoring had the highest degree of popularity, which was related to the increased attention given to phytoplankton blooms. In the category of “temporal–spatial and environmental factors,” spatial and temporal scales received considerable attention, and the degree of attention to climate change increased steadily in recent years, becoming one of the most popular topics. In the category of “biological and geographic factors,” lakes and ecosystem dynamics had the highest degree of attention. In the “remote sensing and methods” category, the popularity of remote-sensing algorithms increased significantly, followed by classification and recognition technology and modeling. Due to the impact of anthropogenic activities, such as indiscriminate discharge of pollutants, fencing of lakes, deforestation around lakes, and agricultural fertilization [36,37], the process of water eutrophication has accelerated, and phytoplankton blooms have recently become one of the most prominent environmental problems. In addition, phytoplankton are extremely sensitive to climate change, and abnormal algal blooms are occurring regularly under global warming. As a result, outbreaks of phytoplankton blooms and related secondary disasters are becoming increasingly serious [38,39,40] and have different degrees of direct or indirect negative impacts on human life, diet, and tourism [41,42,43,44]. Thus, the degree of attention that is given to this issue has gradually increased, and how to respond to dramatic changes in the water environment has been widely discussed worldwide. The application of remote sensing to explore temporal and spatial dynamics and outbreak mechanisms of phytoplankton blooms and the monitoring and early warning of phytoplankton blooms are becoming hot topics in this field.
3.5. Future Research Directions
Remote-sensing technology, which has received an increasing amount of attention, provides many opportunities and technical approaches to overcome problems that are related to phytoplankton blooms. Here, several possible directions for future research are proposed in the field of remote-sensing technology and phytoplankton blooms.
3.5.1. Accurate Observation of Phytoplankton Blooms
Remote-sensing observation of phytoplankton blooms has always been a key research topic. The effects of thick clouds, water vapor, and aerosols on satellite imaging, the limitation of high-definition imaging at night, and the limited temporal and spatial resolutions of satellites on phytoplankton bloom observations have been widely discussed [45]. At the same time, obtaining information that cannot be observed by traditional remote-sensing techniques, such as the vertical distribution and underwater growth of phytoplankton, has gradually become a topic of interest to researchers [46]. In recent years, with the development of remote-sensing technology and the application of new remote-sensing data sources in phytoplankton bloom monitoring, the monitoring accuracy of phytoplankton blooms has been improved to a certain extent. Some scholars use synthetic aperture radar (SAR) to monitor phytoplankton blooms, which can overcome the interference of weather factors on the monitoring accuracy. SAR can mark the oily surface of phytoplankton blooms as a black area in remote-sensing images to more accurately extract the area of phytoplankton blooms and their distribution in the water body [47]. Other researchers rely on active lidar and holographic systems to expand the monitoring of phytoplankton blooms below the water surface and to accurately observe the vertical distribution information of phytoplankton populations in water [48,49]. Although these new remote-sensing methods have solved some of the limitations that are associated with phytoplankton bloom observation, additional problems have not yet been resolved. For example, the strong interference of the atmosphere and sunlight with sensor imaging in complex water environments affects the remote-sensing accuracy of phytoplankton blooms to varying degrees. At the same time, other colored substances (e.g., chromophoric DOM and suspended particles) can lead to the misidentification of phytoplankton blooms [50]. Moreover, due to limitations in the temporal and spatial resolution of satellites, phytoplankton blooms cannot be comprehensively observed. To solve these problems and improve the ability to observe phytoplankton blooms, researchers should focus on (1) improving the accuracy of atmospheric correction, (2) developing and applying portable multispectral and hyperspectral sensors, and (3) developing models to separate phytoplankton blooms and other water-colored substances.
3.5.2. Traits of Phytoplankton Blooms
The application of remote-sensing technology to analyze the traits of phytoplankton blooms, such as the phytoplankton community structure, temporal and spatial distributions, and secondary metabolites and their long-term responses to environmental factors, can aid in exploring the causes and consequences of phytoplankton blooms. Combining remote-sensing technology and HPLC (high-performance liquid chromatography) pigment analysis, the phytoplankton community composition can be deduced [51,52]. In addition, some scholars explored the unique relationship between phytoplankton communities according to phytoplankton pigments and their optical characteristics to explore the composition and structure of phytoplankton communities [53]. For the species identification and classification of phytoplankton, some scholars developed an inversion model to inverse the pigment absorption coefficient of phytoplankton through hyperspectral remote-sensing reflectance, which can extract chlorophyll, carotenoid, phycocyanin, and other information from the pigment absorption coefficient [54,55]. However, to date, the accuracy and comprehensiveness of phytoplankton species identification that is based on remote-sensing technology are limited. With remote-sensing technology, algal toxin concentrations can be estimated [56], but these toxins may vary for algal blooms with different dominant species. Moreover, due to global changes, the phenological dynamics of phytoplankton blooms are a pressing issue [57,58]. To explore the phenology of phytoplankton, researchers investigated the variability of phytoplankton blooms in time and space by establishing a time series of chlorophyll concentrations to obtain the phenological characteristics of phytoplankton in the water body [21]. However, as discussed above, the observation accuracy, scale consistency, and comparability of influencing factors are limited. With the support of remote-sensing technology, future researchers should pay more attention to the following: (1) the dynamics of the phytoplankton community structure, e.g., distinguishing the optical characteristics of the dominant species in different phytoplankton blooms and their heterogeneous secondary environmental risks; and (2) the definition of the threshold of phytoplankton blooms and their multiscale responses to global changes, such as climate change and urbanization.
3.5.3. Drivers, Early Warning, and Management of Phytoplankton Blooms
With the gradual intensification of phytoplankton blooms and the impacts on the health and safety of human society, the prediction and management of phytoplankton blooms have become key issues. To address these challenges, researchers constructed phytoplankton biomass prediction models by monitoring the influencing factors of phytoplankton blooms, such as wind speed, precipitation, temperature, light intensity, and nitrogen and phosphorus concentrations, to predict phytoplankton blooms. This model can predict the spatial distribution of phytoplankton biomass through monitoring data and weather forecasting, which provides a management basis for managers [11,59]. Similarly, researchers used environmental data, hydrological data, meteorological data, and the normalized difference chlorophyll index (NDCI) to predict phytoplankton blooms and discussed the causes of phytoplankton blooms [60]. In addition, researchers grouped the pixels of the study area through Moderate-Resolution Imaging Spectroradiometer (MODIS) data, combined these data with the impact indicators of phytoplankton blooms sampled on site to assess spatial aggregation, discussed the temporal trends of phytoplankton blooms in different areas, and optimized the monitoring procedure of phytoplankton blooms [61]. However, the localization and dynamic adjustment of the models must be further improved. Moreover, using remote-sensing technology to analyze the driving factors of phytoplankton blooms is an important means of phytoplankton bloom early warning and management. In addition to intra-ecosystem dynamics, the intensification of climate change and human disturbances (e.g., land use, water diversion, and different measures for eutrophication mitigation) can impact the occurrence and degree of phytoplankton blooms [62,63]. At the same time, the use of remote-sensing technology in the early warning of phytoplankton blooms faces some difficulties. For example, the appearance of phytoplankton blooms with lower biomass levels can still produce toxic substances and affect biological health, but very small biomass levels are not easily observed by satellites. Therefore, it is important to further explore the fundamental and cross-scale causes of phytoplankton blooms and develop an early warning system of phytoplankton blooms that accounts for multiple factors in a changing world. In the future, researchers should focus on (1) developing a real-time monitoring and early warning system that is based on a satellite data networking platform and artificial intelligence technology, (2) combining environmental factors to explore the causes of phytoplankton blooms and make corresponding countermeasures, and (3) improving the accuracy of early warning and identification of small-scale phytoplankton blooms through the combination of satellite and ground images.
3.6. Future Challenges and Opportunities
Since the launch of the first remote-sensing satellite, a wide range of multifunctional sensors have been applied in many disciplines. In the field of phytoplankton and water environments, long time-series multispectral and hyperspectral sensors have provided breakthrough support for scientific research, but they also have many limitations, such as the temporal resolution of the satellite, the accuracy of the satellite’s spatial resolution for identifying algal taxa, and the high cost of new technologies. The future development of remote sensing in phytoplankton research holds great potential. For example, in the retrieval of cyanobacterial biomass, the strong correlation between phycocyanin levels and cyanobacterial populations [13,64] provides greater accuracy than chlorophyll-based methods in the monitoring of phycocyanins. However, due to the unique spectral characteristics of phycocyanins (absorption peak at 615–630 nm), their low specific absorption coefficient, and the lack of applicable satellite sensors and retrieval standards [17], it is still difficult to estimate phycocyanins using remote sensing. Moreover, the accuracy of atmospheric correction has a nonnegligible impact on the accuracy of the algal information extracted by sensors. Although many high-precision atmospheric correction models have been developed [65], for water bodies with different characteristics and environmental conditions, the applicability of different atmospheric correction models needs to be further tested [66]. In the future, improving the accuracy and applicability of the atmospheric correction model will be of great significance in the study of phytoplankton blooms. In addition, for the long-term monitoring of water environment dynamics, it is difficult for satellite sensors to achieve both high temporal resolution and high spatial resolution. The temporal and spatial resolution of satellites affects the extraction accuracy of phytoplankton bloom intensity measures. Therefore, in future remote-sensing phytoplankton research, the use of satellite sensors with a high spatial and temporal resolution and new algorithms that can organically combine sensors with different advantages will aid phytoplankton bloom research.
With the overcoming of the inherent limitations of traditional remote sensing by new remote-sensing technologies and methods, the acquisition and study of information such as phytoplankton bloom intensity, pigment concentration, phytoplankton community dynamics, phytoplankton biomass, and phytoplankton phenology will make substantial progress in the future. The emergence of multifunctional, highly efficient remote-sensing model algorithms and satellite sensors will also give a strong boost to phytoplankton research. For example, the application of UAVs in phytoplankton blooms has strongly promoted the development of this field. UAV data can be combined with HPLC data to rapidly measure algal biomass levels [67], and UAVs can be equipped with various types of portable airborne multispectral and hyperspectral sensors to perform high-frequency, high-resolution monitoring of aquatic environments, thereby increasing the accuracy of phytoplankton monitoring [68,69]. In future studies of water environment dynamics, the development and application of UAV airborne sensors and UAV data processing algorithms will be of great value. For satellite remote sensing, multisource remote sensing through the combination of multiple sensors will be a future trend in phytoplankton research. Multisource remote sensing can combine the advantages of different sensors to more effectively overcome each sensor’s inherent limitations, such as the reduction in image availability during cloudy and rainy weather [70], and achieve the multiangle and multilevel extraction of algal information. Meanwhile, multisensor images can be fused to integrate the characteristics of different images. Compared with a single-sensor image, these fused images can present richer information [71]. The establishment of virtual constellations will also break through the temporal and spatial barriers of traditional remote sensing, which will not only accelerate the revisit time but also ensure a high spatial resolution [72,73]. In this way, high-frequency and high-precision dynamic monitoring of the aquatic environment can be achieved to explore issues such as the characteristics and driving mechanisms of phytoplankton blooms. In virtual constellations, which are an emerging technology, sensors with similar spatial, spectral, temporal, and radiometric characteristics are combined to achieve comprehensive observation requirements [74]; this approach will support the future study of phytoplankton blooms.
With the networking of satellite data, the development of automatic aquatic-environment-monitoring platforms and the application of the Internet of things and artificial intelligence, phytoplankton research will reach a new level with the support of remote sensing and related technologies. We will make advancements, such as the long-term, accurate, and comprehensive monitoring of and early warning about the water environment; the exploration of the mechanism of phytoplankton blooms; the prediction and early warning of phytoplankton bloom occurrence; the prevention and control of water pollution; and aquatic ecological restoration.
4. Conclusions
In this research, we used bibliometrics to conduct a quantitative and qualitative analysis of the research progress, current hotspots, and future directions of remote-sensing technology in the study of phytoplankton blooms, and our findings provide another perspective for research in this field. Our research results showed that in the past 30 years, publications in this field have grown rapidly. “Oceanography,” “Environmental Sciences,” and “Remote Sensing” were the most popular subject categories. Our research results also showed that Remote Sensing of Environment was the most active journal. The Chinese Academy of Sciences was the institution with the most publications. The keyword and topic analysis results showed that “phytoplankton,” “chlorophyll,” and “ocean” occurred most frequently, while “eutrophication management and monitoring,” “climate change,” “lakes,” and “remote-sensing algorithms” were the most popular research topics in recent years. The popularity of “chlorophyll fluorescence,” “water quality,” “geographic distribution,” and “productivity” declined. Researchers are now paying increasing attention to the phenological response of phytoplankton under the conditions of climate change and the application of new remote-sensing methods.
Based on keyword analysis, topic analysis, and the development of current remote-sensing technologies, more research should focus on the following three aspects: (1) the accurate observation of phytoplankton blooms; (2) the traits of phytoplankton blooms; and (3) the drivers, early warning, and management of phytoplankton blooms. Although there are some limitations in studies on phytoplankton blooms through remote-sensing technology, with the continuous exploration of new remote-sensing methods and the integration of multiple technologies, research on phytoplankton blooms will achieve richer results in the future.
Author Contributions
Conceptualization, Y.L., Q.Z. and K.S.; Data collection, Y.L.; Methodology, Y.L., Y.Z. and J.L.; Software, Y.L. and J.L.; Writing—original draft, Y.L.; Writing—review and editing, Q.Z., Y.Z. and K.S. All authors have read and agreed to the published version of the manuscript.
Funding
The National Natural Science Foundation of China (nos. 41922005 and 42071131), the Science and Technology Project of Yunnan Province (nos. 202103AC100001 and 202001BB050067), the Scientific Instrument Developing Project of the Chinese Academy of Sciences (no. YJKYYQ20200071), and the NIGLAS foundation (no. E1SL002).
Institutional Review Board Statement
Not applicable.
Informed Consent Statement
Not applicable.
Data Availability Statement
The datasets are available from the corresponding author on reasonable request.
Acknowledgments
We thank Xuan Yang for her helpful suggestions on the LDA model. We appreciate all the comments and suggestions from the three anonymous reviewers, which have substantially improved this paper.
Conflicts of Interest
The authors declare no conflict of interest.
References
- Alvarenga, D.O.; Fiore, M.F.; Varani, A.M. A Metagenomic Approach to Cyanobacterial Genomics. Front. Microbiol. 2017, 8, 809. [Google Scholar] [CrossRef] [PubMed] [Green Version]
- Berdalet, E.; Fleming, L.E.; Gowen, R.; Davidson, K.; Hess, P.; Backer, L.C.; Moore, S.K.; Hoagland, P.; Enevoldsen, H. Marine harmful algal blooms, human health and wellbeing: Challenges and opportunities in the 21st century. J. Mar. Biol. Assoc. UK 2015, 2015, 61–91. [Google Scholar] [CrossRef] [Green Version]
- Ho, J.C.; Michalak, A.M.; Pahlevan, N. Widespread global increase in intense lake phytoplankton blooms since the 1980s. Nature 2019, 574, 667–670. [Google Scholar] [CrossRef]
- Huisman, J.; Codd, G.A.; Paerl, H.W.; Ibelings, B.W.; Verspagen, J.M.H.; Visser, P.M. Cyanobacterial blooms. Nat. Rev. Microbiol. 2018, 16, 471–483. [Google Scholar] [CrossRef] [PubMed]
- Christoffersen, K.; Lyck, S.; Winding, A. Microbial activity and bacterial community structure during degradation of microcystins. Aquat. Microb. Ecol. 2002, 27, 125–136. [Google Scholar] [CrossRef] [Green Version]
- Gorham, T.; Dowling Root, E.; Jia, Y.; Shum, C.K.; Lee, J. Relationship between cyanobacterial bloom impacted drinking water sources and hepatocellular carcinoma incidence rates. Harmful Algae 2020, 95, 101801. [Google Scholar] [CrossRef] [PubMed]
- Gorham, T.; Jia, Y.; Shum, C.K.; Lee, J. Ten-year survey of cyanobacterial blooms in Ohio’s waterbodies using satellite remote sensing. Harmful Algae 2017, 66, 13–19. [Google Scholar] [CrossRef]
- Paerl, H.W.; Otten, T.G. Harmful cyanobacterial blooms: Causes, consequences, and controls. Microb. Ecol. 2013, 65, 995–1010. [Google Scholar] [CrossRef]
- Rabalais, N.N.; Diaz, R.J.; Levin, L.A.; Turner, R.E.; Gilbert, D.; Zhang, J. Dynamics and distribution of natural and human-caused hypoxia. Biogeosciences 2010, 7, 585–619. [Google Scholar] [CrossRef] [Green Version]
- Mitrovic, S.M.; Kobayashi, T.; Roelke, D.L. Cyanobacteria in inland waters: New monitoring, reporting, modelling and ecological research. Mar. Freshw. Res. 2020, 71, i–iv. [Google Scholar] [CrossRef]
- Qin, B.Q.; Li, W.; Zhu, G.W.; Zhang, Y.L.; Wu, T.F.; Gao, G. Cyanobacterial bloom management through integrated monitoring and forecasting in large shallow eutrophic Lake Taihu (China). J. Hazard. Mater. 2015, 287, 356–363. [Google Scholar] [CrossRef]
- Xu, H.; Paerl, H.W.; Qin, B.Q.; Zhu, G.W.; Gao, G. Nitrogen and phosphorus inputs control phytoplankton growth in eutrophic Lake Taihu, China. Limnol. Oceanogr. 2010, 55, 420–432. [Google Scholar] [CrossRef] [Green Version]
- Shi, K.; Zhang, Y.; Qin, B.; Zhou, B. Remote sensing of cyanobacterial blooms in inland waters: Present knowledge and future challenges. Sci. Bull. 2019, 64, 1540–1556. [Google Scholar] [CrossRef] [Green Version]
- Simis, S.G.; Huot, Y.; Babin, M.; Seppala, J.; Metsamaa, L. Optimization of variable fluorescence measurements of phytoplankton communities with cyanobacteria. Photosynth. Res. 2012, 112, 13–30. [Google Scholar] [CrossRef] [Green Version]
- Zhao, S.H.; Wang, Q.; Li, Y.; Liu, S.H.; Wang, Z.T.; Zhu, L.; Wang, Z.F. An overview of satellite remote sensing technology used in China’s environmental protection. Earth Sci. Inform. 2017, 10, 137–148. [Google Scholar] [CrossRef]
- Zhang, Y.B.; Zhang, Y.L.; Shi, K.; Yao, X.L. Research development, current hotspots, and future directions of water research based on MODIS images: A critical review with a bibliometric analysis. Environ. Sci. Pollut. Res. 2017, 24, 15226–15239. [Google Scholar] [CrossRef]
- Yan, Y.; Bao, Z.; Shao, J. Phycocyanin concentration retrieval in inland waters: A comparative review of the remote sensing techniques and algorithms. J. Great Lakes Res. 2018, 44, 748–755. [Google Scholar] [CrossRef]
- Peng, K.; Deng, J.M.; Gong, Z.J.; Qin, B.Q. Characteristics and development trends of ecohydrology in lakes and reservoirs: Insights from bibliometrics. Ecohydrology 2019, 12, e2080. [Google Scholar] [CrossRef]
- Aria, M.; Cuccurullo, C. Bibliometrix: An R-tool for comprehensive science mapping analysis. J. Informetr. 2017, 11, 959–975. [Google Scholar] [CrossRef]
- Zhi, W.; Yuan, L.; Ji, G.; Liu, Y.; Cai, Z.; Chen, X. A bibliometric review on carbon cycling research during 1993–2013. Environ. Earth Sci. 2015, 74, 6065–6075. [Google Scholar] [CrossRef]
- Palmer, S.C.J.; Odermatt, D.; Hunter, P.D.; Brockmann, C.; Présing, M.; Balzter, H.; Tóth, V.R. Satellite remote sensing of phytoplankton phenology in Lake Balaton using 10years of MERIS observations. Remote Sens. Environ. 2015, 158, 441–452. [Google Scholar] [CrossRef] [Green Version]
- Bajocco, S.; Raparelli, E.; Teofili, T.; Bascietto, M.; Ricotta, C. Text Mining in Remotely Sensed Phenology Studies: A Review on Research Development, Main Topics, and Emerging Issues. Remote Sens. 2019, 11, 2751. [Google Scholar] [CrossRef] [Green Version]
- Shen, L.; Xu, H.; Guo, X. Satellite remote sensing of harmful algal blooms (HABs) and a potential synthesized framework. Sensors 2012, 12, 7778–7803. [Google Scholar] [CrossRef] [PubMed] [Green Version]
- Blondeau-Patissier, D.; Gower, J.F.R.; Dekker, A.G.; Phinn, S.R.; Brando, V.E. A review of ocean color remote sensing methods and statistical techniques for the detection, mapping and analysis of phytoplankton blooms in coastal and open oceans. Prog. Oceanogr. 2014, 123, 123–144. [Google Scholar] [CrossRef] [Green Version]
- Kutser, T. Passive optical remote sensing of cyanobacteria and other intense phytoplankton blooms in coastal and inland waters. Int. J. Remote Sens. 2009, 30, 4401–4425. [Google Scholar] [CrossRef]
- Schofield, O.; Grzymski, J.; Bissett, W.P.; Kirkpatrick, G.J.; Millie, D.F.; Moline, M.; Roesler, C.S. Optical Monitoring and Forecasting Systems for Harmful Algal Blooms: Possibility or Pipe Dream? J. Phycol. 1999, 35, 1477–1496. [Google Scholar] [CrossRef] [Green Version]
- Bracher, A.; Bouman, H.A.; Brewin, R.J.W.; Bricaud, A.; Brotas, V.; Ciotti, A.M.; Clementson, L.; Devred, E.; Di Cicco, A.; Dutkiewicz, S.; et al. Obtaining Phytoplankton Diversity from Ocean Color: A Scientific Roadmap for Future Development. Front. Mar. Sci. 2017, 4, 55. [Google Scholar] [CrossRef] [Green Version]
- Shah, S.H.H.; Lei, S.; Ali, M.; Doronin, D.; Hussain, S.T. Prosumption: Bibliometric analysis using HistCite and VOSviewer. Kybernetes 2019, 49, 1020–1045. [Google Scholar] [CrossRef]
- Zhang, Y.; Tao, J.; Wang, J.; Ding, L.Y.; Ding, C.Z.; Li, Y.L.; Zhou, Q.C.; Li, D.H.; Zhang, H.C. Trends in Diatom Research Since 1991 Based on Topic Modeling. Microorganisms 2019, 7, 213. [Google Scholar] [CrossRef] [PubMed] [Green Version]
- Jelodar, H.; Wang, Y.; Yuan, C.; Feng, X.; Jiang, X.; Li, Y.; Zhao, L. Latent Dirichlet allocation (LDA) and topic modeling: Models, applications, a survey. Multimed. Tools Appl. 2018, 78, 15169–15211. [Google Scholar] [CrossRef] [Green Version]
- Hu, B.B.; Dong, X.L.; Zhang, C.W.; Bowman, T.D.; Ding, Y.; Milojevic, S.; Ni, C.Q.; Yan, E.; Lariviere, V. A lead-lag analysis of the topic evolution patterns for preprints and publications. J. Assoc. Inf. Sci. Tech. 2015, 66, 2643–2656. [Google Scholar] [CrossRef]
- Heo, G.E.; Kang, K.Y.; Song, M.; Lee, J.H. Analyzing the field of bioinformatics with the multi-faceted topic modeling technique. BMC Bioinform. 2017, 18, 251. [Google Scholar] [CrossRef] [PubMed] [Green Version]
- Wurtsbaugh, W.A.; Paerl, H.W.; Dodds, W.K. Nutrients, eutrophication and harmful algal blooms along the freshwater to marine continuum. Wires Water 2019, 6, 1373. [Google Scholar] [CrossRef]
- Li, X.F.; Liu, B.; Zheng, G.; Ren, Y.B.; Zhang, S.S.; Liu, Y.J.; Gao, L.; Liu, Y.H.; Zhang, B.; Wang, F. Deep-learning-based information mining from ocean remote-sensing imagery. Natl. Sci. Rev. 2020, 7, 1584–1605. [Google Scholar] [CrossRef] [PubMed]
- Shin, Y.-H.; Teresa Gutierrez-Wing, M.; Choi, J.-W. Review—Recent Progress in Portable Fluorescence Sensors. J. Electrochem. Soc. 2021, 168. [Google Scholar] [CrossRef]
- Chakraborty, S.; Tiwari, P.K.; Sasmal, S.K.; Misra, A.K.; Chattopadhyay, J. Effects of fertilizers used in agricultural fields on algal blooms. Eur. Phys. J.-Spec. Top. 2017, 226, 2119–2133. [Google Scholar] [CrossRef]
- Zhao, C.S.; Shao, N.F.; Yang, S.T.; Ren, H.; Ge, Y.R.; Zhang, Z.S.; Feng, P.; Liu, W.L. Quantitative assessment of the effects of human activities on phytoplankton communities in lakes and reservoirs. Sci. Total Environ. 2019, 665, 213–225. [Google Scholar] [CrossRef]
- Townhill, B.L.; Tinker, J.; Jones, M.; Pitois, S.; Creach, V.; Simpson, S.D.; Dye, S.; Bear, E.; Pinnegar, J.K. Harmful algal blooms and climate change: Exploring future distribution changes. ICES J. Mar. Sci. 2018, 75, 1882–1893. [Google Scholar] [CrossRef]
- Gobler, C.J. Climate Change and Harmful Algal Blooms: Insights and perspective. Harmful Algae 2020, 91, 101731. [Google Scholar] [CrossRef]
- Smith, G.J.; Daniels, V. Algal blooms of the 18th and 19th centuries. Toxicon 2018, 142, 42–44. [Google Scholar] [CrossRef]
- Zohdi, E.; Abbaspour, M. Harmful algal blooms (red tide): A review of causes, impacts and approaches to monitoring and prediction. Int. J. Environ. Sci. Technol. 2019, 16, 1789–1806. [Google Scholar] [CrossRef]
- Grattan, L.M.; Holobaugh, S.; Morris, J.G. Harmful algal blooms and public health. Harmful Algae 2016, 57, 2–8. [Google Scholar] [CrossRef] [PubMed] [Green Version]
- Namsaraev, Z.; Melnikova, A.; Komova, A.; Ivanov, V.; Rudenko, A.; Ivanov, E. Algal Bloom Occurrence and Effects in Russia. Water 2020, 12, 285. [Google Scholar] [CrossRef] [Green Version]
- Chang, Y.; Wu, Y.; Zhang, J.; Wang, X.N.; Jiang, S.; Cao, W.W.; Wang, X.L.; Qu, J.G.; Zhang, Z.R.; Jin, J.; et al. Effects of algal blooms on selenium species dynamics: A case study in the Changjiang Estuary, China. Sci. Total Environ. 2021, 768, 144235. [Google Scholar] [CrossRef] [PubMed]
- Kudela, R.M.; Palacios, S.L.; Austerberry, D.C.; Accorsi, E.K.; Guild, L.S.; Torres-Perez, J. Application of hyperspectral remote sensing to cyanobacterial blooms in inland waters. Remote Sens. Environ. 2015, 167, 196–205. [Google Scholar] [CrossRef] [Green Version]
- Xue, K.; Zhang, Y.; Duan, H.; Ma, R.; Loiselle, S.; Zhang, M. A Remote Sensing Approach to Estimate Vertical Profile Classes of Phytoplankton in a Eutrophic Lake. Remote Sens. 2015, 7, 14403–14427. [Google Scholar] [CrossRef] [Green Version]
- Wu, L.; Wang, L.; Min, L.; Hou, W.; Guo, Z.; Zhao, J.; Li, N. Discrimination of Algal-Bloom Using Spaceborne SAR Observations of Great Lakes in China. Remote Sens. 2018, 10, 767. [Google Scholar] [CrossRef] [Green Version]
- Churnside, J.H. Review of profiling oceanographic lidar. Opt. Eng. 2014, 53, 051405. [Google Scholar] [CrossRef] [Green Version]
- Moore, T.S.; Churnside, J.H.; Sullivan, J.M.; Twardowski, M.S.; Nayak, A.R.; McFarland, M.N.; Stockley, N.D.; Gould, R.W.; Johengen, T.H.; Ruberg, S.A. Vertical distributions of blooming cyanobacteria populations in a freshwater lake from LIDAR observations. Remote Sens. Environ. 2019, 225, 347–367. [Google Scholar] [CrossRef]
- Shen, F.; Tang, R.; Sun, X.; Liu, D. Simple methods for satellite identification of algal blooms and species using 10-year time series data from the East China Sea. Remote Sens. Environ. 2019, 235, 111484. [Google Scholar] [CrossRef]
- Binding, C.E.; Zastepa, A.; Zeng, C. The impact of phytoplankton community composition on optical properties and satellite observations of the 2017 western Lake Erie algal bloom. J. Great Lakes Res. 2019, 45, 573–586. [Google Scholar] [CrossRef]
- Siegel, D.A.; Behrenfeld, M.J.; Maritorena, S.; McClain, C.R.; Antoine, D.; Bailey, S.W.; Bontempi, P.S.; Boss, E.S.; Dierssen, H.M.; Doney, S.C.; et al. Regional to global assessments of phytoplankton dynamics from the SeaWiFS mission. Remote Sens. Environ. 2013, 135, 77–91. [Google Scholar] [CrossRef] [Green Version]
- Catlett, D.; Siegel, D.A. Phytoplankton Pigment Communities Can be Modeled Using Unique Relationships With Spectral Absorption Signatures in a Dynamic Coastal Environment. J. Geophys. Res. Ocean. 2018, 123, 246–264. [Google Scholar] [CrossRef] [Green Version]
- Wang, G.; Lee, Z.; Mouw, C. Multi-Spectral Remote Sensing of Phytoplankton Pigment Absorption Properties in Cyanobacteria Bloom Waters: A Regional Example in the Western Basin of Lake Erie. Remote Sens. 2017, 9, 1309. [Google Scholar] [CrossRef] [Green Version]
- Wang, G.; Lee, Z.; Mishra, D.R.; Ma, R. Retrieving absorption coefficients of multiple phytoplankton pigments from hyperspectral remote sensing reflectance measured over cyanobacteria bloom waters. Limnol. Oceanogr. Methods 2016, 14, 432–447. [Google Scholar] [CrossRef] [Green Version]
- Shi, K.; Zhang, Y.; Xu, H.; Zhu, G.; Qin, B.; Huang, C.; Liu, X.; Zhou, Y.; Lv, H. Long-Term Satellite Observations of Microcystin Concentrations in Lake Taihu during Cyanobacterial Bloom Periods. Environ. Sci. Technol. 2015, 49, 6448–6456. [Google Scholar] [CrossRef] [PubMed]
- Zhang, M.; Duan, H.; Shi, X.; Yu, Y.; Kong, F. Contributions of meteorology to the phenology of cyanobacterial blooms: Implications for future climate change. Water Res. 2012, 46, 442–452. [Google Scholar] [CrossRef] [PubMed]
- Shi, K.; Zhang, Y.; Zhang, Y.; Li, N.; Qin, B.; Zhu, G.; Zhou, Y. Phenology of Phytoplankton Blooms in a Trophic Lake Observed from Long-Term MODIS Data. Environ. Sci. Technol. 2019, 53, 2324–2331. [Google Scholar] [CrossRef] [PubMed]
- Li, W.; Qin, B.; Zhu, G. Forecasting short-term cyanobacterial blooms in Lake Taihu, China, using a coupled hydrodynamic-algal biomass model. Ecohydrology 2014, 7, 794–802. [Google Scholar] [CrossRef]
- Aubriot, L.; Zabaleta, B.; Bordet, F.; Sienra, D.; Risso, J.; Achkar, M.; Somma, A. Assessing the origin of a massive cyanobacterial bloom in the Rio de la Plata (2019): Towards an early warning system. Water Res. 2020, 181, 115944. [Google Scholar] [CrossRef] [PubMed]
- Mercado, J.M.; Gómez-Jakobsen, F.; Cortés, D.; Yebra, L.; Salles, S.; León, P.; Putzeys, S. A method based on satellite imagery to identify spatial units for eutrophication management. Remote Sens. Environ. 2016, 186, 123–134. [Google Scholar] [CrossRef]
- Fink, G.; Burke, S.; Simis, S.G.H.; Kangur, K.; Kutser, T.; Mulligan, M. Management Options to Improve Water Quality in Lake Peipsi: Insights from Large Scale Models and Remote Sensing. Water Resour. Manag. 2018, 34, 2241–2254. [Google Scholar] [CrossRef] [Green Version]
- Zhang, Y.; Ma, R.; Liang, Q.; Guan, B.; Loiselle, S. Secondary impacts of eutrophication control activities in shallow lakes: Lessons from aquatic macrophyte dynamics in Lake Taihu from 2000 to 2015. Freshw. Sci. 2019, 38, 802–817. [Google Scholar] [CrossRef]
- Ogashawara, I.; Li, L. Removal of Chlorophyll-a Spectral Interference for Improved Phycocyanin Estimation from Remote Sensing Reflectance. Remote Sens. 2019, 11, 1764. [Google Scholar] [CrossRef] [Green Version]
- Martins, V.; Barbosa, C.; de Carvalho, L.; Jorge, D.; Lobo, F.; Novo, E. Assessment of Atmospheric Correction Methods for Sentinel-2 MSI Images Applied to Amazon Floodplain Lakes. Remote Sens. 2017, 9, 322. [Google Scholar] [CrossRef] [Green Version]
- Yu, C.; Li, Z.; Penna, N.T.; Crippa, P. Generic Atmospheric Correction Model for Interferometric Synthetic Aperture Radar Observations. J. Geophys. Res. Solid Earth 2018, 123, 9202–9222. [Google Scholar] [CrossRef]
- Kwon, Y.S.; Pyo, J.; Kwon, Y.-H.; Duan, H.; Cho, K.H.; Park, Y. Drone-based hyperspectral remote sensing of cyanobacteria using vertical cumulative pigment concentration in a deep reservoir. Remote Sens. Environ. 2020, 236, 111517. [Google Scholar] [CrossRef]
- Becker, R.H.; Sayers, M.; Dehm, D.; Shuchman, R.; Quintero, K.; Bosse, K.; Sawtell, R. Unmanned aerial system based spectroradiometer for monitoring harmful algal blooms: A new paradigm in water quality monitoring. J. Great Lakes Res. 2019, 45, 444–453. [Google Scholar] [CrossRef]
- Wu, D.; Li, R.; Zhang, F.; Liu, J. A review on drone-based harmful algae blooms monitoring. Environ. Monit. Assess. 2019, 191, 211. [Google Scholar] [CrossRef]
- Mu, M.; Wu, C.; Li, Y.; Lyu, H.; Fang, S.; Yan, X.; Liu, G.; Zheng, Z.; Du, C.; Bi, S. Long-term observation of cyanobacteria blooms using multi-source satellite images: A case study on a cloudy and rainy lake. Environ. Sci. Pollut. Res. Int. 2019, 26, 11012–11028. [Google Scholar] [CrossRef]
- Chang, N.B.; Bai, K.X.; Imen, S.; Chen, C.F.; Gao, W. Multisensor Satellite Image Fusion and Networking for All-Weather Environmental Monitoring. IEEE Syst. J. 2018, 12, 1341–1357. [Google Scholar] [CrossRef]
- Sagan, V.; Peterson, K.T.; Maimaitijiang, M.; Sidike, P.; Sloan, J.; Greeling, B.A.; Maalouf, S.; Adams, C. Monitoring inland water quality using remote sensing: Potential and limitations of spectral indices, bio-optical simulations, machine learning, and cloud computing. Earth-Sci. Rev. 2020, 205, 103187. [Google Scholar] [CrossRef]
- Tahsin, S.; Medeiros, S.C.; Singh, A. Consistent Long-Term Monthly Coastal Wetland Vegetation Monitoring Using a Virtual Satellite Constellation. Remote Sens. 2021, 13, 438. [Google Scholar] [CrossRef]
- Wulder, M.A.; Hilker, T.; White, J.C.; Coops, N.C.; Masek, J.G.; Pflugmacher, D.; Crevier, Y. Virtual constellations for global terrestrial monitoring. Remote Sens. Environ. 2015, 170, 62–76. [Google Scholar] [CrossRef] [Green Version]


Publisher’s Note: MDPI stays neutral with regard to jurisdictional claims in published maps and institutional affiliations. |
© 2021 by the authors. Licensee MDPI, Basel, Switzerland. This article is an open access article distributed under the terms and conditions of the Creative Commons Attribution (CC BY) license (https://creativecommons.org/licenses/by/4.0/).