Article

Climate Change Decreased Net Ecosystem Productivity in the Arid Region of Central Asia

1
State Key Laboratory of Desert and Oasis Ecology, Xinjiang Institute of Ecology and Geography, Chinese Academy of Sciences, Urumqi 830011, China
2
College of Resources and Environment, University of Chinese Academy of Sciences, Beijing 100049, China
3
Akesu National Station of Observation and Research for Oasis Agro-Ecosystem, Akesu 843017, China
4
College of Life Sciences, Xinjiang Normal University, Urumqi 830054, China
*
Author to whom correspondence should be addressed.
Remote Sens. 2021, 13(21), 4449; https://doi.org/10.3390/rs13214449
Submission received: 7 September 2021 / Revised: 27 October 2021 / Accepted: 2 November 2021 / Published: 5 November 2021
(This article belongs to the Section Environmental Remote Sensing)

Abstract

:
Numerous studies have confirmed that climate change leads to a decrease in the net ecosystem productivity (NEP) of terrestrial ecosystems and alters regional carbon source/sink patterns. However, the response mechanism of NEP to climate change in the arid regions of Central Asia remains unclear. Therefore, this study combined the Carnegie–Ames–Stanford approach (CASA) and empirical models to estimate the NEP in Central Asia and quantitatively evaluate the sensitivity of the NEP to climate factors. The results show that although the net primary productivity (NPP) in Central Asia exhibits an increasing trend, it is not significant. Soil heterotrophic respiration (RH) has increased significantly, while the NEP has decreased at a rate of 6.1 g C·m−2·10 a−1. Spatially, the regional distribution of the significant increase in RH is consistent with that of the significant decrease in the NEP, which is concentrated in western and southern Central Asia. Specifically, the NPP is more sensitive to precipitation than temperature, whereas RH and NEP are more sensitive to temperature than precipitation. The annual contribution rates of temperature and precipitation to the NEP are 28.79% and 23.23%, respectively. Additionally, drought has an important impact on the carbon source/sink in Central Asia. Drought intensified from 2001 to 2008, leading to a significant expansion of the carbon source area in Central Asia. Therefore, since the start of the 21st century, climate change has damaged the NEP of the Central Asian ecosystem. Varying degrees of warming under different climate scenarios will further aggravate the expansion of carbon source areas in Central Asia. An improved understanding of climate change impacts in Central Asia is critically required for sustainable development of the regional economy and protection of its natural environment. Our results provide a scientific reference for the construction of the Silk Road Economic Belt and global emissions reduction.

Graphical Abstract

1. Introduction

Since 1880, the average global temperature has increased by 0.85 ± 0.2 °C [1]. The burning of fossil fuels and the rapid reduction in the forest area have resulted in the emission of large quantities of carbon into the atmosphere. Therefore, climate change and increasing atmospheric carbon dioxide concentrations have attracted extensive attention [2]. The Paris Agreement stipulates that by the end of this century, the temperature rise should not exceed the pre-industrialization level by more than 2 °C [3]. To achieve this goal, we must better understand the feedback relationship between terrestrial ecosystems and the climate. The net ecosystem productivity (NEP) represents the net carbon exchange between terrestrial ecosystems and the atmosphere [4]. It is an important index for the quantitative estimation of the carbon source/sink of terrestrial ecosystems [5,6].
At present, NEP estimation has become the main target of carbon research. Research on large-scale forest and grassland ecosystems has improved our understanding of changes in global and regional carbon balances and expenditures [7,8,9]. A climate-driven soil respiration model was established using a global database to analyze the temporal and spatial distributions of global soil respiration and forest ecosystem NEP [10]. Tropical rainforests in terrestrial ecosystems are generally considered major contributors to global carbon sinks. However, net carbon emissions from tropical forests may likely be neutral. Deforestation and degradation will further lead to the transformation of carbon sinks into carbon sources [11]. Affected by seasonal warming, the annual distribution pattern of soil respiration in forest ecosystems in northern China has changed, with a significant shortening of the autumn carbon sink period [12]. Affected by drought, the carbon sink of grassland ecosystems in the United States will weaken; some regions may also be transformed into carbon sources [4]. Climate warming has accelerated soil respiration, resulting in carbon neutral grassland ecosystems in northern China over the last 20 years [13]. At the regional scale, 70% of China’s regions are carbon sinks, with highest concentrations in the southeastern and southwestern monsoon regions [14]. Estimations from biogeochemical and productivity models based on remote sensing have shown that the contribution rate of climate change to changes in carbon sinks in terrestrial ecosystems in China is 40% [15]. There is a significant exponential correlation among environmental factors, such as temperature, precipitation, and carbon emissions, on the Qinghai Tibet Plateau [16]. Climate change has an important impact on the terrestrial ecosystem NEP. In addition, there is a strong logarithmic correlation between the NEP and seasonal carbon absorption-release ratio [7]. However, owing to the scarcity of carbon flux sites, obtaining carbon absorption and release data is difficult. In contrast, empirical statistical models and remote sensing are widely used [17].
Central Asia is an arid and semi-arid region; globally, it is one of the most sensitive regions to climate change. Some studies show that the surface temperature in Central Asia increased significantly (by 0.36 °C to 0.42 °C) from 1979 to 2011, rendering it a center of global warming [18]. Different degrees of warming in winter and spring will not only change the vegetation phenology, but also affect regional extreme precipitation events [19]. From 1936 to 2005, indices related to extreme precipitation (e.g., the annual total precipitation, annual precipitation intensity, Rx1day, and Rax5day) showed upward trends. Extreme precipitation and mild drought will likely increase significantly in the late 21st century [20]. Although the trend is small, Central Asia has become drier [21]. Climate change and drought are the main drivers of vegetation dynamics and variously affect soil respiration. The semi-arid ecosystem carbon flux is the main contributor to variations in the global ecosystem carbon flux. Therefore, the quantitative estimation of the ecosystem NEP in Central Asia is of great significance.
In the context of climate change, research on the ecosystem carbon cycle in arid areas of Central Asia has significantly increased [22]. Studies have found that farmland, grassland, forest, and shrub share a similar response to climate change; grassland is the most sensitive ecosystem in Central Asia [23]. Both climate change and grazing affect the grassland ecosystem, which is the main carbon source [24]. The estimation of the grassland ecosystem NEP lays a foundation for the comprehensive evaluation of the terrestrial ecosystem NEP [5,25]. However, elucidation of the impact of climate factors on the terrestrial ecosystem NEP remains necessary. In the past two decades, problems have persisted regarding the sensitivity of the vegetation net primary productivity (NPP), soil heterotrophic respiration (RH), and NEP to precipitation and temperature in Central Asia. In addition, determining the contribution of precipitation and temperature changes to the NEP of terrestrial ecosystems in Central Asia is necessary, as well as the link between carbon source/sink areas and increased drought. Therefore, in this study, Central Asia was selected as the research area, and the empirical models of forest and grassland ecosystems were combined to estimate the NEP of the Central Asian terrestrial ecosystem. Our results provide a scientific reference for the construction of the Silk Road Economic Belt and global emissions reduction.

2. Materials and Methods

2.1. Study Area

Central Asia includes Kazakhstan, Uzbekistan, Turkmenistan, Kyrgyzstan, Tajikistan, and Xinjiang. These countries and states are located far from the sea and are home to a temperate continental climate. Central Asia, which is characterized by large day and night temperature differences, strong evaporation, and reduced precipitation, is influenced by westerly circulation and the North Atlantic Oscillation. Precipitation is highest in the spring and winter. Approximately 80–90% of the global temperate deserts are located in Central Asia, which is one of the driest regions in the world.
Non-tree and -vegetation coverage in Central Asia is relatively large (Figure 1, https://lpdaac.usgs.gov/data_access/, 9 September 2021), with the ratio of tree coverage being <3%. Most areas are covered by grassland, followed by shrubs and farmland. The forest area is <0.3%.

2.2. Data

Four-day grid data from the Fraction of Photosynthetically Active Radiation from 2001 to 2019, with a spatial resolution of 500 m in Central Asia, were collected from the Moderate Resolution Imaging Spectroradiometer (MODIS) data product (MOD15A3H, https://lpdaacsvc.cr.usgs.gov/appeears/task/area/, 9 September 2021). Normalized difference vegetation index (NDVI) data were obtained from MOD13A1, with a spatial resolution of 500 m and temporal resolution of 16 d. Land use data, with a spatial resolution of 500 m, were collected from https://lpdaacsvc.cr.usgs.gov/appeears/task/area, 9 September 2021. Total solar radiation (SOL) data were obtained from the global meteorological and water balance change dataset, TrraCLimate, with a spatial resolution of 0.25° and a time resolution of days (available at http://aphrodite.st.hirosaki-u.ac.jp/products.html/, 9 September 2021). Temperature and precipitation data were derived from the GLDAS data products, with a spatial resolution of 0.25° and a temporal resolution of months (available at https://search.earthdata.nasa.gov/search/, 9 September 2021). To accurately distinguish the boundary between the forest and the rest of the ecosystem, ESA Land Cover Maps-v2.0.7 land use data were used to extract the forest, with a spatial resolution of 300 m and a temporal resolution of years. The Vegetation Continuous Fields (VCF) was obtained from MOD44B, with a spatial resolution of 500 m and a temporal resolution of years (available at https://lpdaacsvc.cr.usgs.gov/appeears/task/area/, 9 September 2021). Continuous monthly RH observation data were derived from the Fukang Desert Ecosystem in Xinjiang (44°17′N, 87°56′E) from 2004 to 2008.

2.3. NPP Estimation

CASA was used to estimate the NPP. The simulation was determined by two variables, i.e., the absorbed photosynthetically active radiation (APAR) (MJ/m2) and light energy conversion ( ε ) (g C/MJ), as follows:
N P P = A P A R × ε
where
A P A R = S O L × F P A R × 0.5
where APAR is the product of PAR and the fraction of photosynthetically active radiation (FPAR). PAR (PAR, radiation in the 400- to 700-nm wave band) is a portion of the photosynthetically active radiation and received by an ecosystem is absorbed by green plants, which can be calculated as half the total solar surface radiation (SOL) (MJ/m2) [26]. FPAR is estimated by two variables, i.e., the F P A R N D V I and F P A R S R [27,28]:
F P A R N D V I = ( N D V I N D V I i , m i n ) × ( F P A R m a x F P A R m i n ) N D V I i , m a x N D V I i , m i n + F P A R m i n
where F P A R m a x (=0.95) and F P A R m i n (=0.001) are independent of the vegetation type. Here, N D V I i , m a x is the NDVI value corresponding to 95% of NDVI population I, while N D V I i , m i n is the NDVI value corresponding to 5% of NDVI population i. The relation between FPAR and SR can be represented as follows:
F P A R S R = ( S R S R i , m i n ) × ( F P A R m a x F P A R m i n ) S R i , m a x S R i , m i n + F P A R m i n
S R = [ 1 + N D V I 1 N D V I ]
where S R i , m a x and S R i , m i n correspond to the N D V I i , m a x and N D V I i , m i n , respectively.
F A P R = α F P A R N D V I + ( 1 α ) F P A R S R
with α set at 0.5. Finally, the light energy conversion (ε) (g C/MJ) was calculated as follows:
ε = T 1 × T 2 × w ε × ε m a x
where T 1   and   T 2 represent the effect of the low and high temperature stress, respectively, w ε represents the effects of the water stress, and ε m a x is the maximum light use efficiency (g C/MJ). The calculation of each stress factor and the value of the maximum light energy utilization rate of each vegetation type was based on existing research results [28].

2.4. NEP Estimation

The NEP is defined as the difference between the NPP and soil microbial respiration carbon emissions (RH), calculated as follows:
N E P = N P P R H
If NEP > 0, the carbon fixed by vegetation is greater than the carbon released to the atmosphere by soil respiration (i.e., a carbon sink). If NEP < 0, it is a carbon source. RH in (8) was calculated using the climate-driven model. The RH of the forest ecosystem was estimated as follows:
l n ( a n R H ) = 1.22 + 0.73 l n ( a n R S )
where the interannual RH (anRH) was estimated using the interannual RS (anRS). RS was estimated as follows:
m o R S = F × e ( a T b T 2 ) × α P + ( 1 α ) P m 1 K + α P + ( 1 α ) P m 1
where moRS is the monthly average autotrophic respiration of the forest ecosystem (g C·m−2·d−1); T is the monthly average temperature (°C); P is the monthly precipitation (cm); Pm−1 is the precipitation of the previous month (cm); F (g C·m−2·d−1) and K (cm mol−1) are parameters [10]; a (°C−1) and b (°C−2) are parameters for temperature; and α is the parameter for the precipitation formula.
The RH estimation model for grassland and other ecosystems is as follows [16]:
R H = 0.22 × ( e 0.0913 T + l n ( 0.3145 P + 1 ) ) × 30 × 46.5 %
where T is temperature (°C) and P is precipitation (mm).

2.5. Theil-Sen Median Trend Analysis and Mann-Kendall Test

The Theil–Sen median trend analysis method can be effectively combined with the Mann–Kendall test, yielding a robust non-parametric statistical trend calculation method, expressed as follows:
β = m e d i a n ( y j y i j i ) ,   2001 i j 2019
where β refers to the Theil-Sen median and y i and y j represent the variable (NPP, RH, and NEP) value of years i and j. If β   > 0, the variable presents a rising trend; otherwise, the variable displays a decreasing trend. The Mann–Kendall test measures the significance of a trend [29]. In this study, a piecewise linear regression model was used to detect the interannual variation trend of the carbon source/sink areas [30], and the inflection point was 2008.

2.6. Sensitivity Analysis

According to (4), we can obtain the following:
d N E P = N E P N P P · d N P P + N E P R H · d R H
We can further obtain the change in the NEP via the RH and NPP as follows:
d N E P N E P = N P P N E P · N E P N P P · d N P P N P P + R H N E P · N E P R H · d R H R H
Therefore, the sensitivity of the NEP to the NPP and RH is:
d N E P N E P = ε N P P · d N P P N P P + ε R H · d R H R H
ε N P P = N P P N E P · N E P N P P ,   and
ε R H = R H N E P · N E P R H
where ε N P P and ε R H represent the sensitivity coefficients of the NEP to the NPP and RH, respectively. Then, according to (7), the sensitivity of the RH to precipitation and temperature was obtained as follows:
ε R H _ p = P R H · R H P   and
ε R H _ T = T R H · R H T ,  
where ε R H _ p and ε R H _ T represent the sensitivity coefficients of the RH to precipitation and temperature, respectively. When the formula could not be used to calculate the partial derivative, such as the sensitivity coefficient of the NPP to precipitation and temperature, and the sensitivity coefficient of the forest ecosystem RH to precipitation and temperature, non-parametric estimation was used to calculate the corresponding sensitivity coefficient:
ε = m e d i a n ( Q t Q P t P × P ¯ Q ¯ )
where Q t and P t are the NEP/RH and climatic factors in the t-th year, respectively, and Q ¯ and P ¯ are the respective averages.

3. Results

3.1. Spatio-Temporal Variation Characteristics of NEP

Since the beginning of the 21st century, the NPP of vegetation and RH have increased in Central Asia. Compared to the NPP, soil RH has increased significantly (R2 = 0.73, p < 0.01) (Figure 2), whereas the NEP has decreased significantly (R2 = 0.20, p < 0.1; Figure 2). The annual NEP was between −53.85 and −108.49 g C·m−2·a−1. Forests are carbon sinks, whereas grassland, shrubs, crops, and sparse vegetation are all carbon sources. Forest carbon sinks have played a role for many years; the NEPs of broad-leaved forests and coniferous forests have partially increased. The multi-year averages of the NEP in broad-leaved and coniferous forests were 95.63 and 83.76 g Cm−2a−1, respectively, with maximum values of 138.75 and 122.13 g C·m−2, respectively. Herbs and crops had similar carbon sequestration capabilities and have been weak carbon sources for many years, with no significant inter-annual changes. However, shrubs and sparse vegetation are strong carbon sources, showing a significant downward trend, where the downward trend of shrubs (R2 = 0.65, p < 0.01) was greater than that of sparse vegetation (R2 = 0.47, p < 0.01).
Spatially, the NPP was higher in northern and northeastern Kazakhstan, western Kyrgyzstan, and the Tianshan Mountains of Xinjiang, but lower in central and southwestern Kazakhstan, Uzbekistan, Turkmenistan, and along the edge of the Xinjiang Junggar Basin and Taklimakan Desert. High-value NPP areas were mainly covered by forest while low-value areas were covered by shrubs, herbs, and crops. The area where the NPP increased (189.35 × 10⁴ km2) was significantly larger than the area where it decreased (32.34 × 10⁴ km2). Among them, eastern Kazakhstan and southern Xinjiang increased significantly while western and southeastern Kazakhstan, Turkmenistan, and eastern Uzbekistan decreased significantly (Figure 3b). The RH was mainly affected by latitude and altitude. As the latitude decreased, RH tended to increase. As the altitude increased, RH decreased. As such, high soil respiration areas were mainly concentrated in the southwest. In terms of the interannual variability, 64.36% of the area increased significantly. Only the northern and central high mountain areas of Kazakhstan decreased (Figure 3d).
The distribution pattern of the carbon source/sink in Central Asia is consistent with the spatial distribution of the NPP. Carbon sinks are concentrated in forest-covered mountainous areas, such as northern and eastern Kazakhstan, western Kyrgyzstan, and the Tianshan Mountains of Xinjiang; in addition, the NEP of the southern source (the Gurbantunggut Desert in Xinjiang and the edge of the Taklimakan Desert) are relatively small long-term carbon sources. Since 2001, the NEP in Central Asia has shown a downward trend, and the decreasing area has accounted for 35.16% of the total area. The area with a significant increase accounts for <6.00%. In addition, at the national level, only Kyrgyzstan is a weak carbon sink; Xinjiang, Kazakhstan, Turkmenistan, and Uzbekistan are carbon sources.

3.2. Response of NEP to Climate Factors

Vegetation dynamics are highly sensitive to climate change, especially in arid and semi-arid areas [31]. The NPP, as an important indicator of vegetation productivity, is also sensitive to climate change. The sensitivity coefficient of the NPP to precipitation ranged from −7.71 to 8.52, with an average of 0.38. Moreover, 84.94% of the regions had positive feedback to precipitation, indicating that the NPP increased with increasing precipitation. Areas with high sensitivity were mainly distributed in northwestern and southeastern Central Asia. Among the land cover types, 48.64% of the crop area had high sensitivity compared with 31.20% of the grasslands and <0.5% of forests (Figure 4a). The sensitivity coefficient of the NPP to temperature was less than that of precipitation; areas of positive and negative sensitivity coefficients were similar. The area of the NPP with negative sensitivity to temperature was mainly concentrated in northwestern, northeastern, and southern Central Asia, with an annual average temperature of 5.64 °C. It was dominated by grassland coverage (46.73%), with sparse vegetation, crop, shrub, and forest proportions of 22.36%, 22.09%, 6.36%, and 2.45%, respectively. The area of the NPP with positive sensitivity to temperature mainly occurred in the periphery of the region, and the annual average temperature was 7.76 °C. The area of shrubs (11.36%) has increased compared with the area showing a negative sensitivity coefficient.
The sensitivity of the RH to precipitation ranged from −0.09 to 0.75, with an average of 0.17. Most of the regional sensitivity was positive, and high sensitivity was mainly concentrated in the southeast (Figure 4e); only 0.09% of the regional sensitivity was negative, most accounted for by forests. In addition, the sensitivity of the RH to temperature (between −0.72 and 2.02) was stronger than that of precipitation, with an average value of 0.29. Most regional sensitivity coefficients were positive, and 57.55% of the regions with 0 < εRH-t < 0.3 were concentrated in northeastern Central Asia, northern Xinjiang, and the central Tianshan mountains. The area of 0.3 < εRH-t < 0.6 accounted for 19.95%, mainly distributed in the southern Kazakhstan. Furthermore, 6.15% of the area with 0.6 < εRH-t < 0.9 was mainly distributed in southwestern Central Asia and on the edge of the Taklimakan Desert. Moreover, 7.20% of the area was highly sensitive (εRH-t > 0.9) and was mainly distributed in southwestern Central Asia. The sensitivity coefficient has increased, the annual average temperature has increased, and the precipitation has decreased. The sensitivity coefficients of εRH-t < 0, 0 < εRH-t < 0.3, 0.3 < εRH-t < 0.6, 0.6 < εRH-t < 0.9, and εRH-t > 0.9 correspond to multi-year average temperatures of −4.42 °C, 5.18 °C, 10.87 °C, 14.00 °C, and 16.51 °C, respectively, and to multi-year average precipitation values of 308.31, 421.54, 340.35, 332.97, and 256.51 mm, respectively. The RH was more sensitive to temperature in regions with high temperature and low precipitation. Regions with high sensitivity had relatively low forest cover and relatively high shrub and crop cover. Southwestern Central Asia is sensitive to both precipitation and temperature, such that it is most sensitive to climate change (Figure 4d).
The sensitivity coefficient of the NEP to precipitation ranged from −7.94 to 8.38, with an average of 0.21. Among them, 73.92% of the regional sensitivity coefficients were positive, and 35.86% of the regions with 0 < εNEP_p < 0.3 were widely distributed in Central Asia. Areas with 0.3 < εNEP_p < 0.6 accounted for 25.14%, and areas with εNEP_p > 0.6 accounted for 12.52%, being mainly distributed in the north and northwest, respectively. The area of −0.3 < εNEP_p < 0 was 18.92%, concentrated in the northeast. εNEP_p < −0.3 accounted for only 7.17%, mainly distributed in the southeast Kunlun Mountains. The sensitivity of the NEP to precipitation was closely related to the regional average annual precipitation. The less the precipitation, the stronger the negative sensitivity; the greater the precipitation, the stronger the positive sensitivity. When the regional average temperature was <6.76 °C, the sensitivity of the NEP to precipitation was negative. The lower the temperature, the stronger the negative sensitivity. When the temperature exceeded 7.55 °C, the sensitivity of the NEP to precipitation was positive. However, with increasing sensitivity, the temperature decreased. The sensitivity of the NEP to temperature (from −20.45 to 12.88) was slightly higher than that of precipitation, with an average of −0.30. We found that 66.70% of the regional sensitivity coefficients were negative, and 30.17% of the regions with −0.3 < εNEP_t < 0 were concentrated in northern and central Central Asia. Areas with −0.6 < εNEP_t < −0.3 and εNEP_t < −0.6 accounted for 15.94% and 20.60%, respectively, and were concentrated in western and southern Central Asia. The temperature sensitivity coefficient of the NEP was positive in the north. The sensitivity of the NEP to temperature increased with an increasing annual mean temperature. When 0 < |εNEP_t| < 0.3, the corresponding temperature was 5.11 °C. When 0.3 < |εNEP_t| < 0.6, the annual average temperature was 7.30 °C, and when |εNEP_t| > 0.6, the annual average temperature was 10.40 °C.
Recently, the temperature in Central Asia has increased, especially in the south, but interannual variation in the precipitation has not been significant (Figure 5). Owing to the high sensitivity of the RH to temperature, the increase in the temperature in most parts of southwest Central Asia has accelerated soil respiration and caused substantial carbon loss. Overall, the contribution rate of warming to the interannual variability of the NEP was larger than that of precipitation. The contribution rate of precipitation changes to the NEP interannual variation was approximately 23.23%. Here, 58% of regional precipitation contributed <20% to the NEP, which was concentrated in the central and northeast regions of Central Asia (Figure 6a). Further, 32.68% of the areas had a negative contribution, which were distributed in forest coverage areas of northeast Central Asia and around Kunlun Mountain, characterized by a coniferous forest coverage ratio of 9.94%. The area where the contribution rate of precipitation to the NEP was between 20% and 40% accounted for a 24.64% contribution rate. The regions with >40% contribution rate accounted for 17.01% of the region, mainly in the west and southwest. Only 1.50% of the regions contributed > 100%. In contrast, temperature showed a greater contribution to the interannual variation of the NEP. The contribution rate of the temperature change to the NEP interannual variation was approximately 28.79%. Furthermore, 56% of the regions contributed <20% of the temperature, with the largest contributions concentrated in western and southern Central Asia (Figure 6b).
The spatial distribution of the controlled factors of the NEP interannual variation was obtained from the difference in the annual contribution rates of precipitation and temperature. A positive value indicated that the change in the NEP was mainly controlled by precipitation. A negative value indicated that the NEP was controlled by temperature. The proportions of the precipitation and temperature control areas were 47.75% and 52.25%, respectively. Temperature control areas were mainly distributed in the west, northeast, center, and south. The sensitivity coefficients of most areas in the south were negative (Figure 6c). Precipitation control areas were mainly concentrated in the north, with positive sensitivity coefficients, i.e., the NEP increased with increasing precipitation.

3.3. Effect of Drought on Carbon Source/Sink Relationship

Water is a major problem in Central Asia. Recently, the evaporation capacity has increased with increasing temperatures, leading to the aggravation of drought in Central Asia. Drought affects vegetation dynamics, which not only leads to the death of shallow root vegetation, but also causes shrubs to invade grassland, further changing the carbon sequestration capacity of the ecosystem. From 2001 to 2019, Central Asia experienced different stages of drought, during which drought intensified from 2001 to 2008, mainly concentrated in northern and western Kazakhstan and northern Xinjiang (Figure 7a). Affected by the decrease in precipitation and the increase in temperature, the annual NEP decreased significantly. However, from 2009 to 2016, the trend in Central Asia became humid, and the Palmer Drought Severity Index (PDSI) increased in most regions, especially in northern Kazakhstan, Uzbekistan, Turkmenistan, and the eastern Tianshan Mountains (Figure 7b). The increase in both precipitation and temperature accelerated soil respiration. Therefore, the NPP and NEP of the terrestrial ecosystem under warming and wetting did not significantly increase over this short period. According to the different degrees of drought, the carbon sequestration capacity of the ecosystem also changed: with an increasing drought degree, soil respiration increased and the ecosystem lost more carbon. Although there was a slight trend of wetting from 2009 to 2016, the drought in Central Asia has been aggravated since the start of the 21st century (Figure 7c). Regions of drought aggravation are consistent with regions of decreasing NEP (i.e., concentrated in western Central Asia).
Using the segmented command in R language for piecewise regression, we found that the change in the carbon source/sink area in Central Asia over the last 20 years can be roughly divided into two stages: (1) from 2001 to 2008, the carbon sink area decreased significantly (slope = −3.33, Figure 8b) and the carbon source area increased significantly (slope = 4.06, Figure 8a); and (2) from 2009 to 2019, the carbon sink area increased slightly (slope = 1.63, Figure 8b) and the carbon source area decreased (slope = −1.35, Figure 8a). The change in the carbon source/sink areas in Central Asia was most significant in years with marked drought intensification. From 2001 to 2008, the carbon source area increased from 285.60 × 10⁴ to 312.15 × 10⁴ km2 (R2 = 0.46); the areas of NEP < −200 (R2 = 0.64) and −200 < NEP < −150 (R2 = 0.66) increased significantly. Therefore, drought intensification led to the expansion of the strong carbon source area in the ecosystem. Previous studies have shown that shrub invasion into grasslands during drought is also prominent [5]. The carbon sink area decreased from 56.57 × 10⁴ to 33.91 × 10⁴ km2, in which the area of the weak carbon sink decreased most notably (R2 = 0.54) while the area of the strong carbon sink did not change significantly. Therefore, years characterized by intensified drought mainly led to decreasing NEP for two reasons: the invasion of shrubs into grassland, resulting in the expansion of a strong carbon source area, and the death of shallow root vegetation, resulting in the transformation from a weak carbon sink to a carbon source (Figure 8).

4. Discussion

4.1. Data Uncertainty Analysis

The NPP and RH contributed to 84.17% and 15.83% of the annual average of NEP, and 59.03% and 30.45% of the interannual variation in the NEP, respectively. The NEP usually increases with an increasing NPP. For example, the NPP in 2002 and 2007 increased by 23.12 and 11.84 g C·m−2, respectively, compared with the previous year. The NEP in the same year increased by 15.98 and 19.37 g C·m−2, respectively, compared with the previous year (Figure 2). The NPP was positively correlated with precipitation [32]. Studies have shown that the NPP may have two-fold the effect on the NEP as the RH in northwest China [15], which is consistent with the results of this study. However, the total contribution rate of precipitation and temperature to the NEP was <100%, which indicates that radiation, human activities, and other climatic factors may have also caused recent interannual variations in the NEP in Central Asia [33,34,35,36,37].
In addition, we extracted 5124 points from the arid area of Central Asia, verifying the NPP simulated by CASA with the NPP data derived from MOD17. The results show that both have good consistency (Figure 9a), with R2 = 0.74 (p < 0.01) and RMSE = 112.18 g C·m−2·a−1. Li et al. [5,38] showed that the NPP estimated by MODIS can be used in arid and semi-arid areas, reflecting the growth and distribution of vegetation. Therefore, CASA is suitable for Central Asia. Owing to the lack of flux stations in the arid area of Central Asia, we only collected continuous monthly observation data from the Fukang Desert Ecosystem in Xinjiang (44°17′N, 87°56′E) from 2004 to 2008. However, the simulation results obtained in this study demonstrated a good consistency with the station observation data (Figure 9b), with R2 = 0.53 (p < 0.01) and RMSE = 13.12 g C m−2 month−1. Therefore, the estimates of the NPP and RH in this study are reasonable.
The calculation of the soil respiration in this study was based on empirical models; the calculation model for the forest ecosystem improves upon Raich and Potter’s model [10]. In the original model, the sensitivity of the RH to every 10 °C rise in the temperature did not change with the change in temperature, whereas the sensitivity of the RH to every 10 °C rise in the temperature after improvement was a function of the temperature. It reached the peak value when T = a(2b)−1 (where a and b are temperature-related parameters, as shown in (6)). The sensitivity of soil respiration to precipitation was calculated by the weight of precipitation in the previous and current months; in other words, the precipitation in the current month could be zero, such that the model was suitable for the arid region of Central Asia. The best value for the weighting factor, α, was 0.98, but α was characterized by a large uncertainty (0.03–0.99, 95% confidence interval). Factor α only appeared in the soil respiration formula for the forest ecosystem, and the contribution rate of the forest ecosystem to the NEP of the Central Asian ecosystem was 13.12% (Figure 9c). The sensitivity coefficient of α to the forest ecosystem NEP was 6.22. Finally, the influence range of the α factor on the NEP of the entire Central Asian ecosystem ranged from −0.48 to 46.38 g C·m−2. Therefore, the error between the results of this study and the boreal ecosystem productivity simulator (BFPS) model may be due to the uncertainty of the α factor. Reducing the uncertainty caused by parameters in the empirical model remains the main problem [39]. Soil inorganic carbon is one form of atmospheric carbon dioxide sequestration in arid and semi-arid ecosystems. Although the soil inorganic carbon content in the upper 30- and 50-cm soil layers is lower than that of the soil organic carbon, ignoring the soil organic carbon in this study may still underestimate the carbon sink capacity [40].

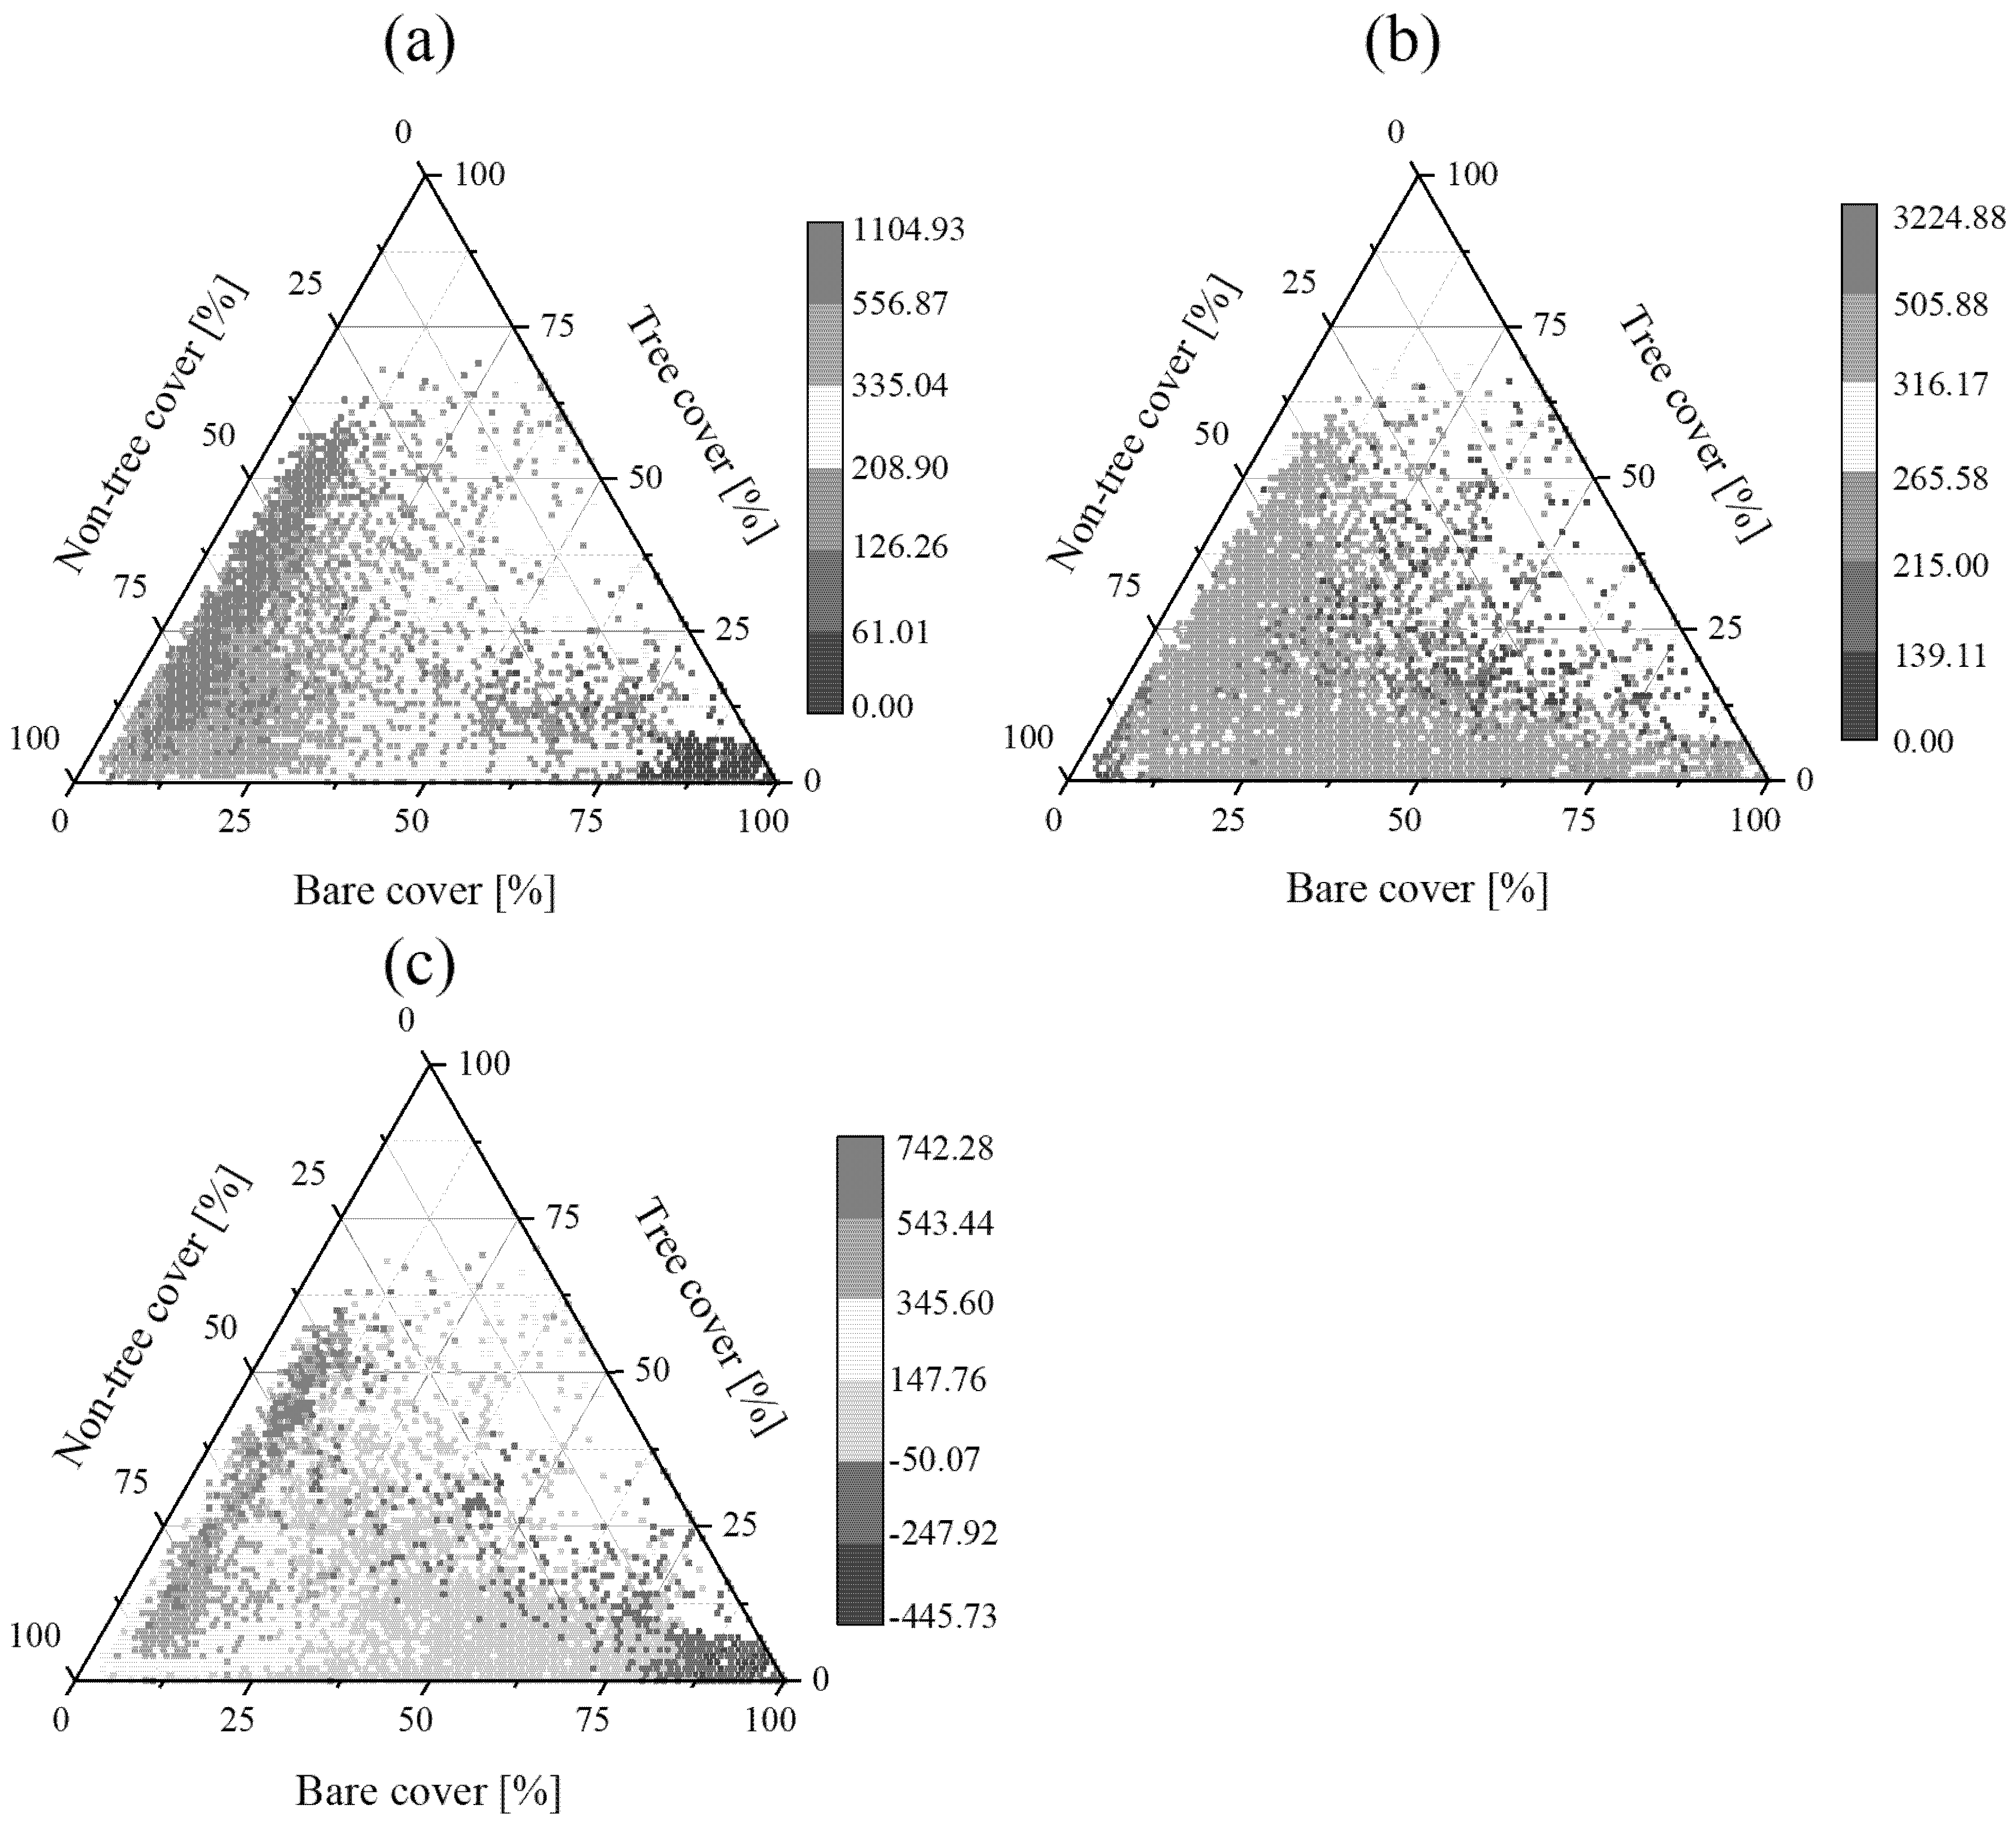
4.2. Relationships among NPP, RH, NEP, and Land Cover

In the ecosystem, tree cover, non-tree cover, and non-vegetation affect the response to disturbance. Areas with large trees and less non-vegetation have higher resistance, whereas areas with large non-vegetation have higher resilience [41]. Different vegetation coverages are important to the ecosystem. The NPP was divided into six grades, from small to large, using the natural segmentation method. From low to high NPP grades, the average values of tree coverage were 0.20%, 1.80%, 3.33%, 7.13%, 15.74%, and 29.80%. The NPP increased with increasing tree cover. As the NPP increased from small to large, non-tree cover first increased and then decreased, and non-vegetation cover decreased monotonously. When the NPP level reached its maximum, the average proportions of non-tree and non-vegetation cover were 60.38 and 9.81%, respectively. Therefore, when tree cover was large and non-vegetation cover was small, the regional NPP may have first increased and then decreased with increasing non-tree cover (Figure 10a). However, the correlation between the RH and tree, non-tree, and non-vegetation cover was weak, and the proportions of tree, non-tree, and non-vegetation cover showed no notable trend from small to large (Figure 10b). Therefore, in Central Asia, the impact that climate and environmental factors have on soil respiration is greater than that of vegetation coverage.
The NEP had a strong correlation with tree, non-tree, and non-vegetation coverage. The average values of tree coverage were 0.08%, 1.55%, 5.16%, 14.10%, 24.66%, and 39.28%, from low to high. With increasing NEP, the non-tree coverage first increased and then decreased, and the proportion of non-vegetation cover decreased continuously. Therefore, the NEP and NPP were strongly correlated with tree coverage. When the proportion of trees was high and the proportion of non-vegetation cover was small, the NPP of regional vegetation was large and the carbon sink capacity was strong.

4.3. Future Trends in NEP in Central Asia

Soil respiration is one of the most important carbon fluxes in terrestrial ecosystems and is key to predicting ecosystem functions [36,42]. Studies have found that dryland soil has an important carbon sink function, but global warming has led to the loss of soil organic carbon in many areas [43]. The combined effect of warming and drought will lead to an increase in soil respiration [44]. In addition, under the 18 climate models integrated with the 5th Coupled Model Intercomparison Project (CMIP5), more than half of the simulations predict that atmospheric carbon dioxide concentrations will significantly increase and that the terrestrial ecosystem will become a carbon source in the future [45].
Therefore, warming may lead to more carbon emissions from soil to the atmosphere, resulting in a decrease in the NEP [46,47]. If temperatures continue to rise and droughts intensify, it will have a significant impact on the carbon source/sink pattern in the Central Asia arid region. According to the CMIP5 model simulation, the global average surface temperature will rise from 0.3 °C to 1.7 °C [1] from 2081 to 2100 under the Representative Concentration Pathway (RCP) 2.6 scenario. According to the results of this study, the NEP of the Central Asian terrestrial ecosystem will decrease by 1.33–7.95 g C·m−2. Under the RCP4.5 scenario, the global surface temperature will rise by 1.1 °C to 2.6 °C, and the NEP of the Central Asian terrestrial ecosystem will decrease by 5.31–12.7 g C·m−2. Under the RCP6.0 scenario, the global surface temperature will increase by 1.4 °C to 3.1 °C, and the NEP of the Central Asian terrestrial ecosystem will decrease by 22.54–50.49 g C·m−2. Under the RCP8.5 scenario, the global surface temperature will increase by 2.6 °C to 4.8 °C, and the NEP of the Central Asian terrestrial ecosystem will decrease by 42.42–78.17 g C·m−2. The global and Northern Hemisphere annual average temperature growth rates from 1960 to 2010 were 0.07 °C/10 a and 0.1 °C/10 a, respectively; the highest temperature in the arid areas of Northwest China increased by 0.29–0.34 °C, and the highest temperature in Central Asia significantly increased, with a growth rate of 0.32 °C/10 a, which is substantially higher than that of the global or Northern Hemisphere trend [18,48]. Therefore, according to the global temperature rise scenarios, the NEP will increase in Central Asia. However, an increase in temperature will also clearly lead to a reduction in carbon storage and further expansion of the carbon source area in the Central Asian terrestrial ecosystem.
In addition, based on the CMIP5 model simulation, all extreme precipitation indices in Central Asia from 1936 to 2005 showed an increasing trend, except for consecutive dry days (CCD), and the growth rate of the total precipitation (PRCPTOT) reached 9.78 mm. Even under RCP4.5 and RCP8.5, the intensity of extreme precipitation will increase significantly in the future [20]. The results showed that there was a strong positive correlation between the NPP and precipitation, but the increase in the NPP in the Central Asian ecosystem was not significant from 2001 to 2019, which indicates that an increase in total precipitation alone cannot promote an increase in the NEP. In addition, with the increase in available water, the increase in extreme precipitation may lead to an increase in flood risks. Therefore, in the future, necessary measures should be taken to alleviate problems related to climate change. The scientific and reasonable allocation of water resources is an urgent problem facing Central Asia at present and will continue to be so in the future.

5. Conclusions

We used CASA to estimate the NPP and an empirical model to estimate the soil respiration in the Central Asia ecosystem to finally obtain the spatiotemporal changes in the NEP of the Central Asian ecosystem. According to the calculation results, the natural driving factors and contribution rate of the NEP spatiotemporal evolution in the context of climate change were quantitatively analyzed. This study should provide new insights into the response of the NEP to climate change. The main findings were as follows:
(1)
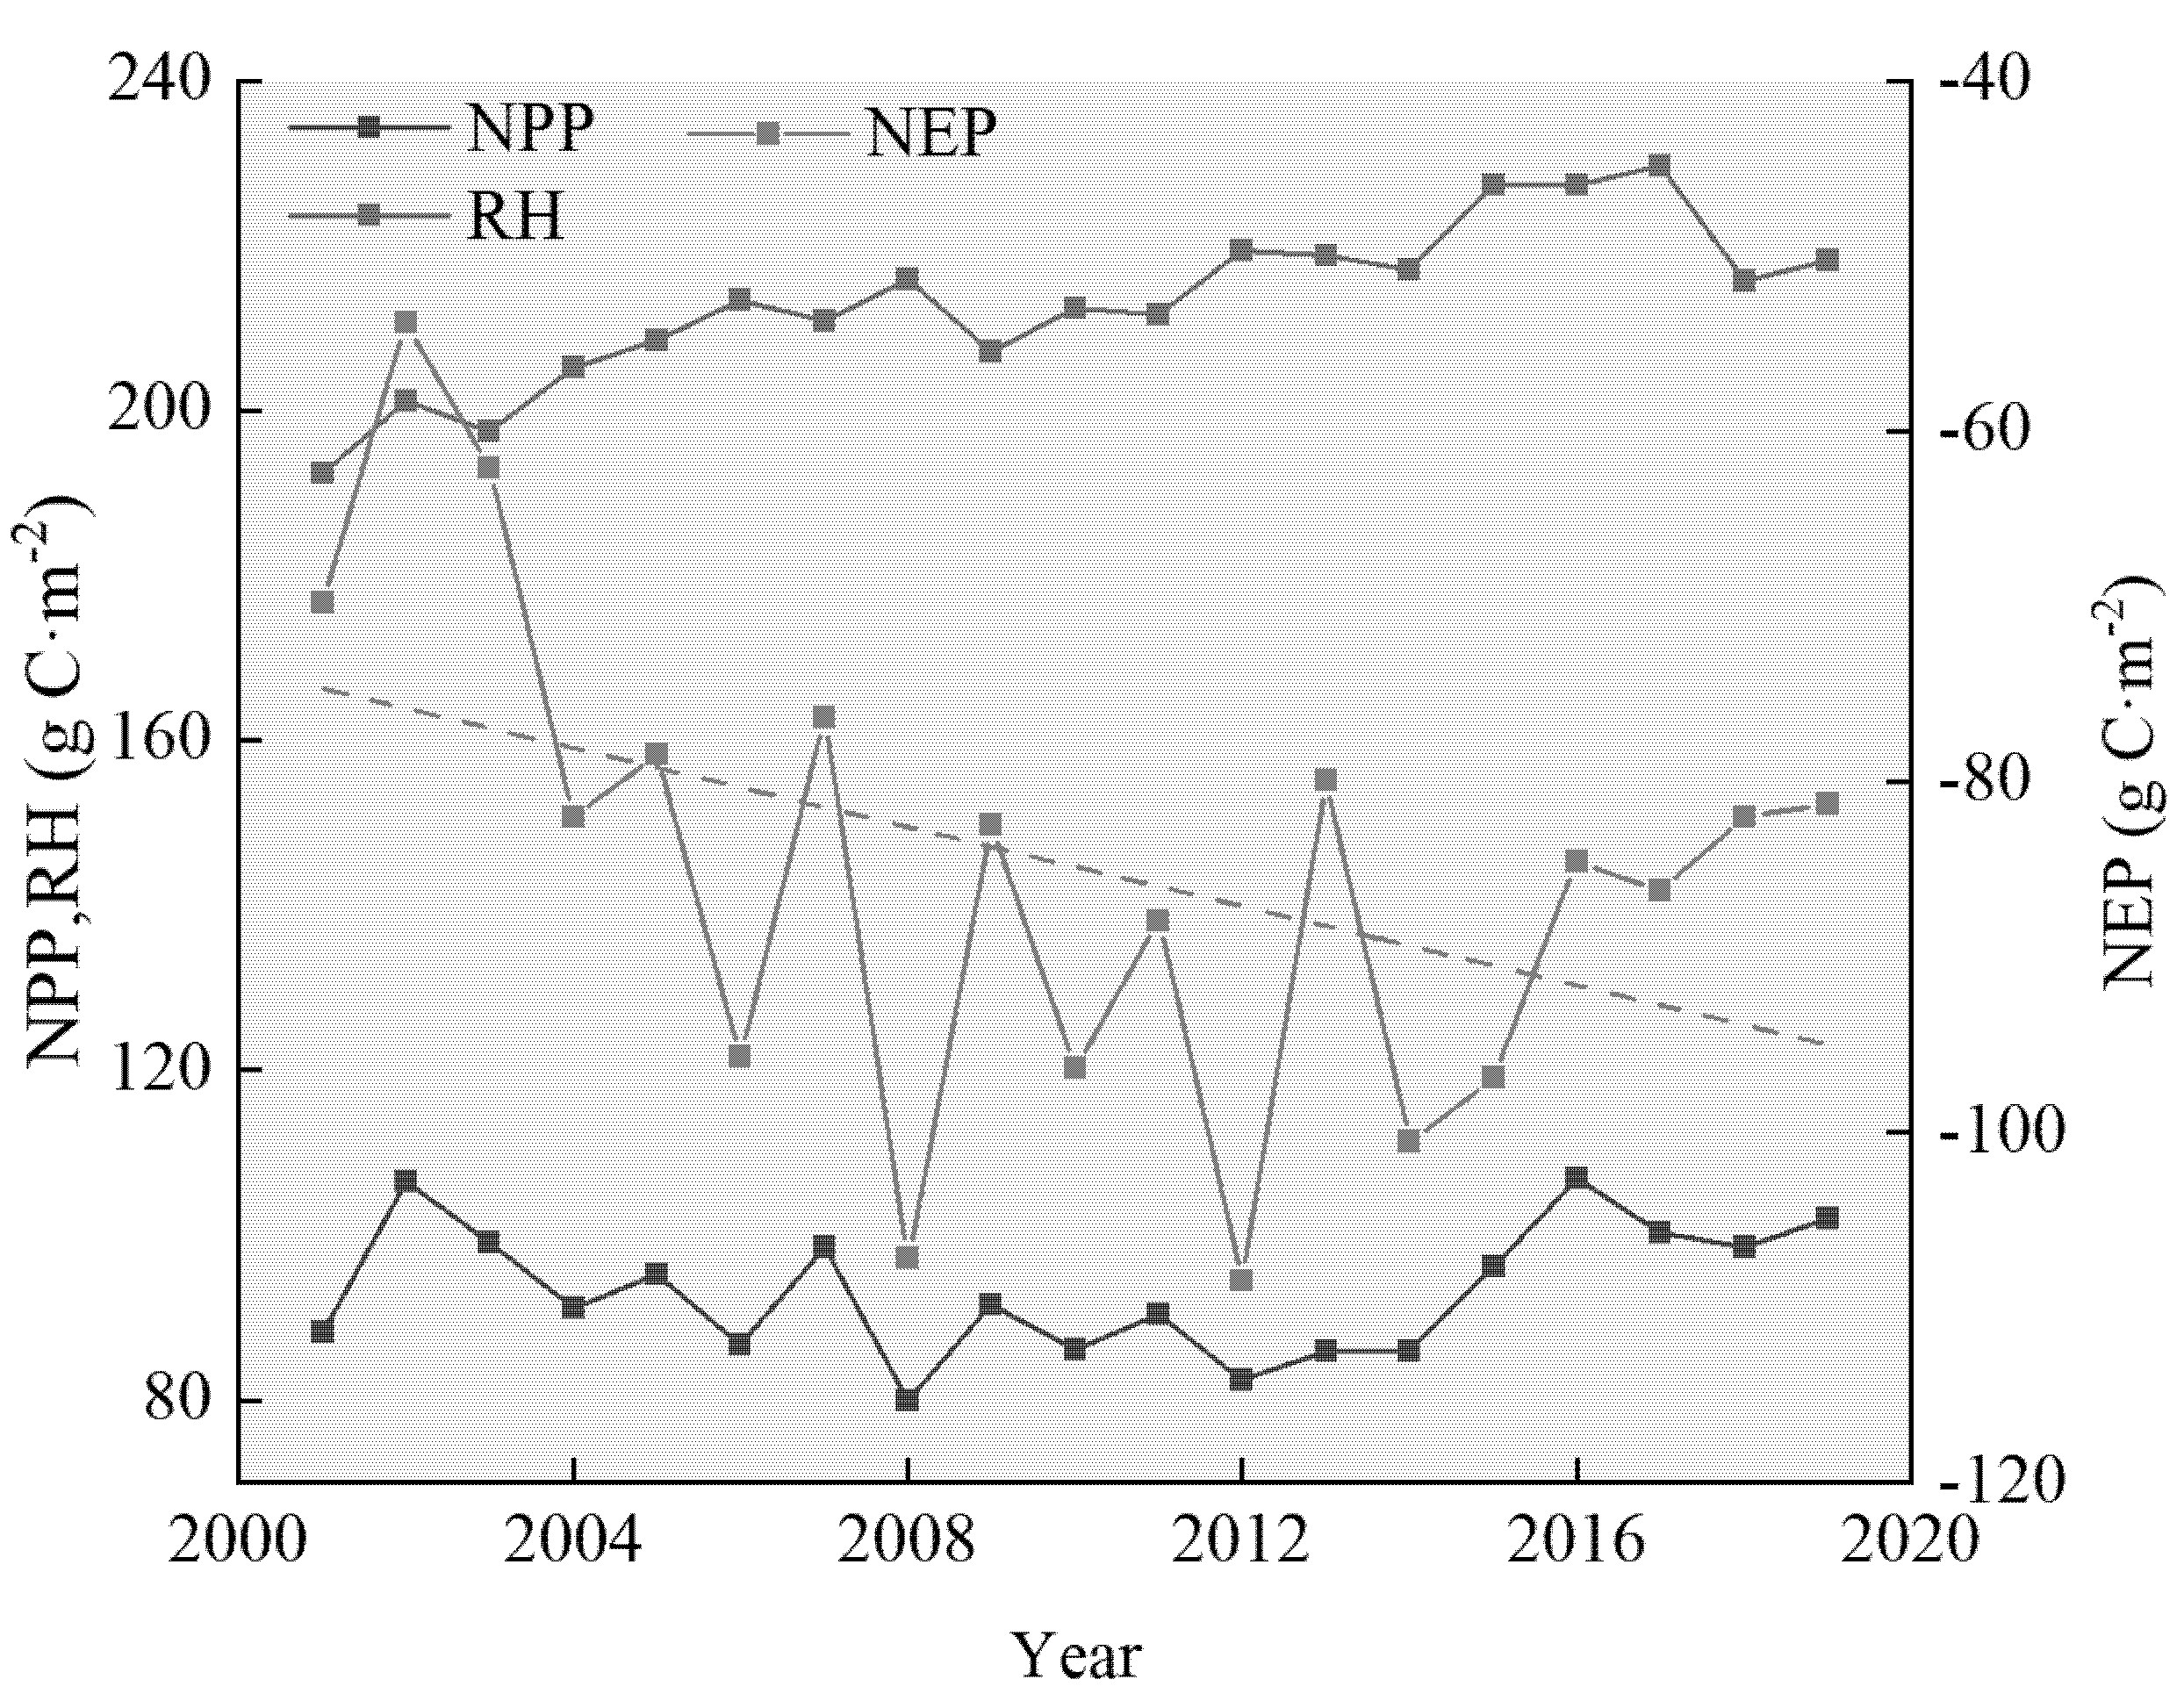
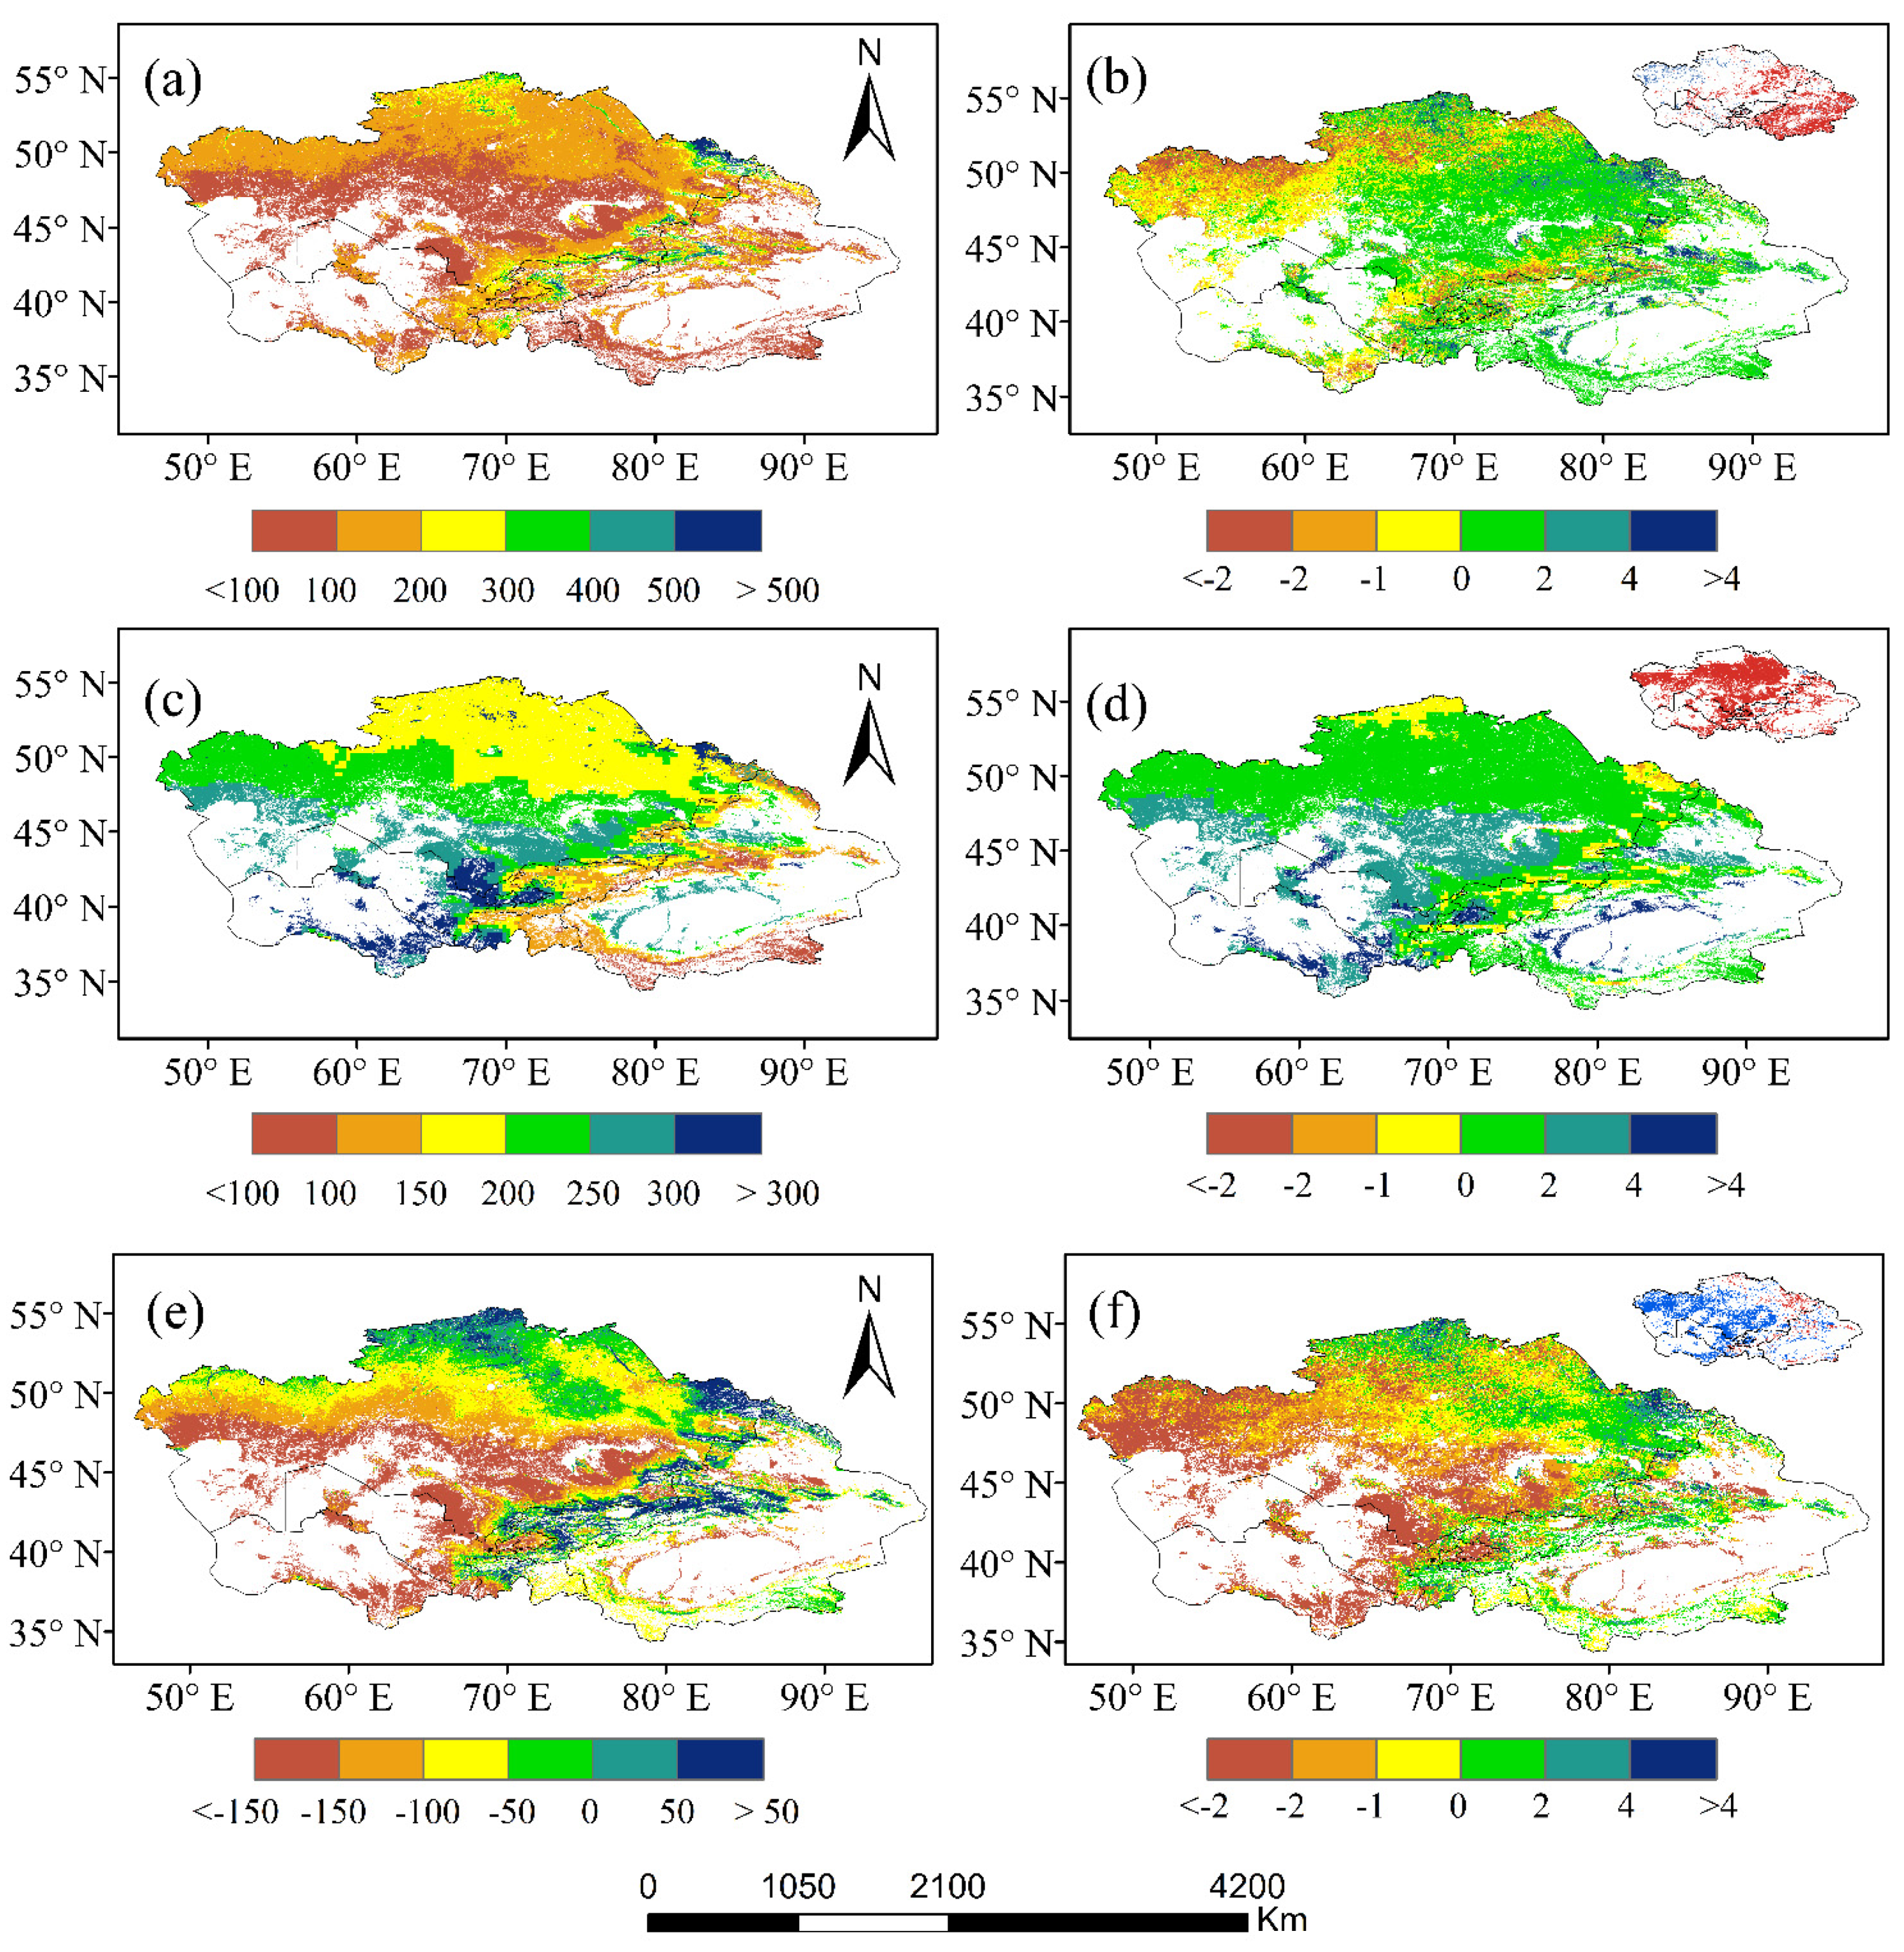
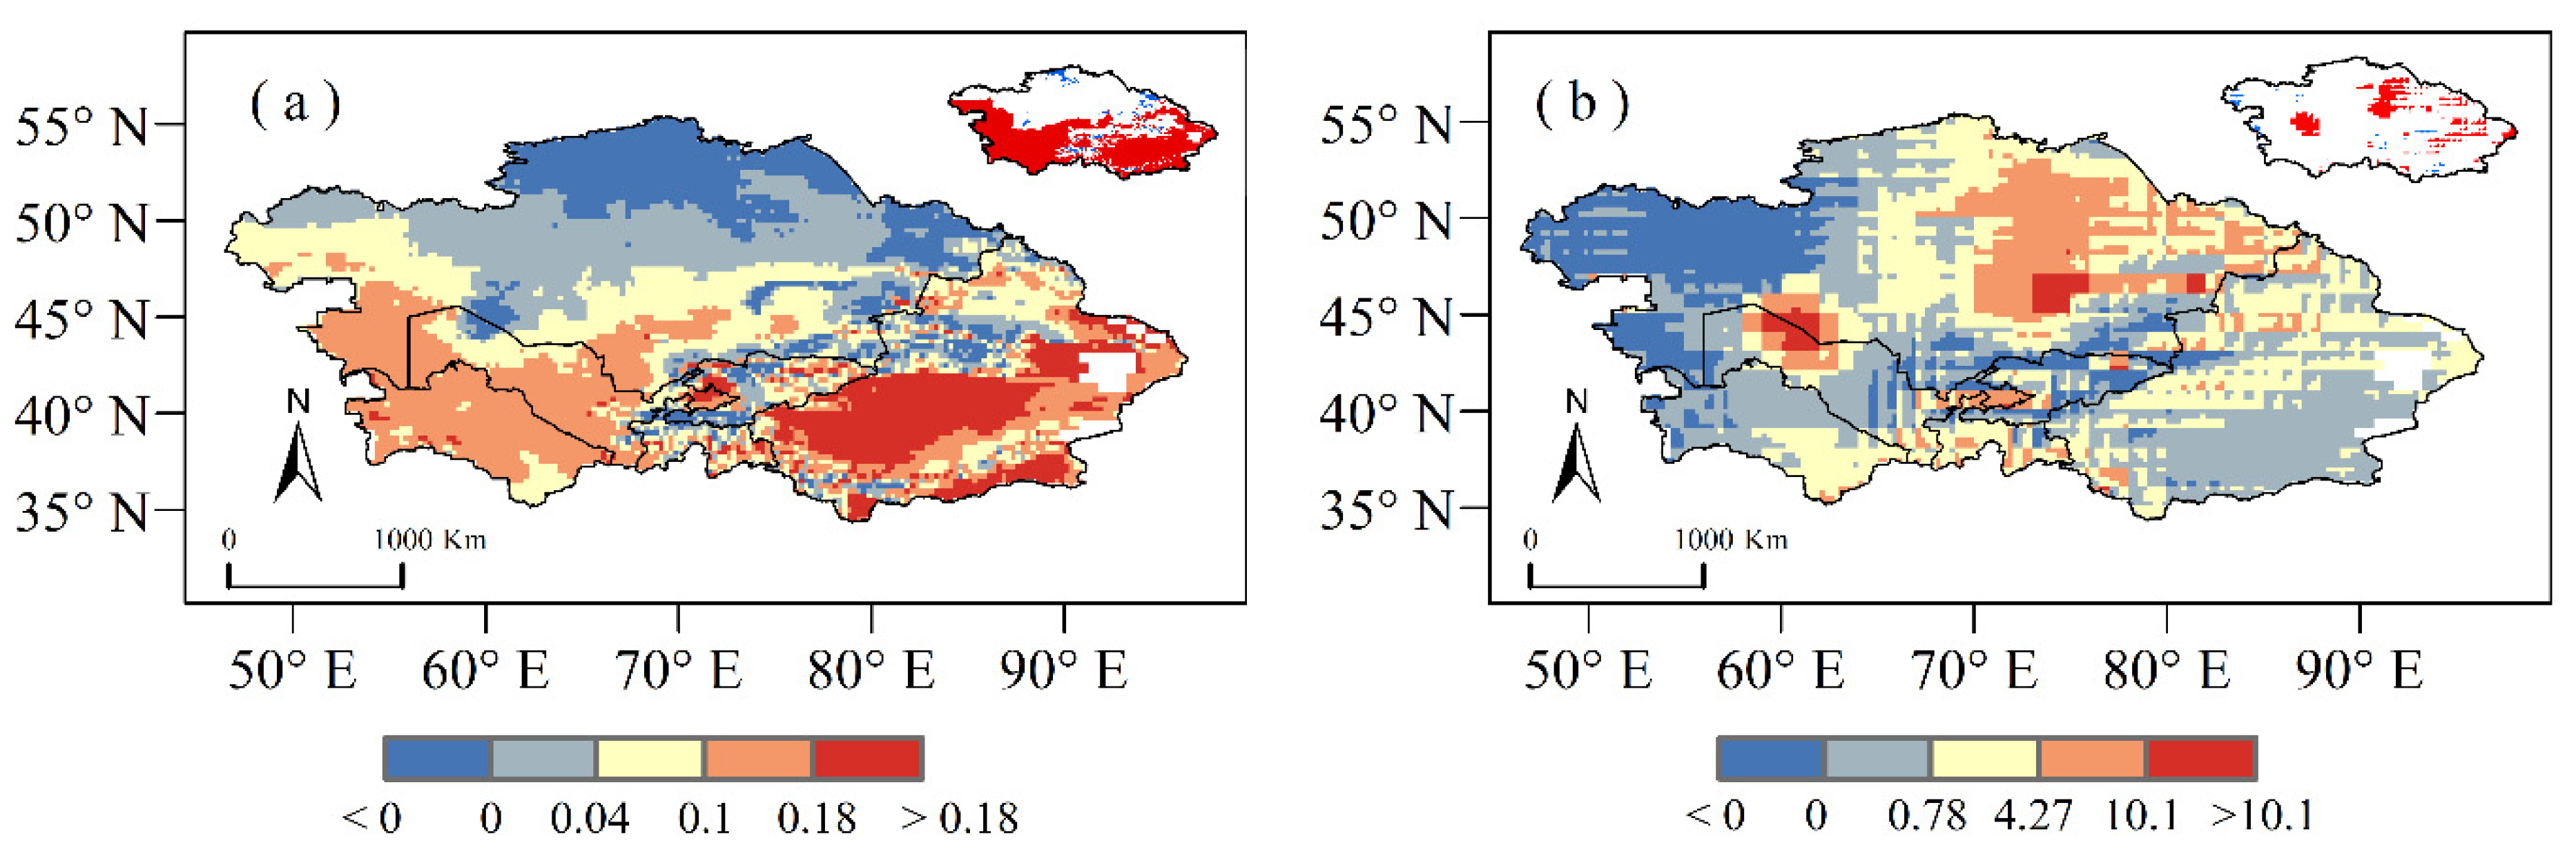
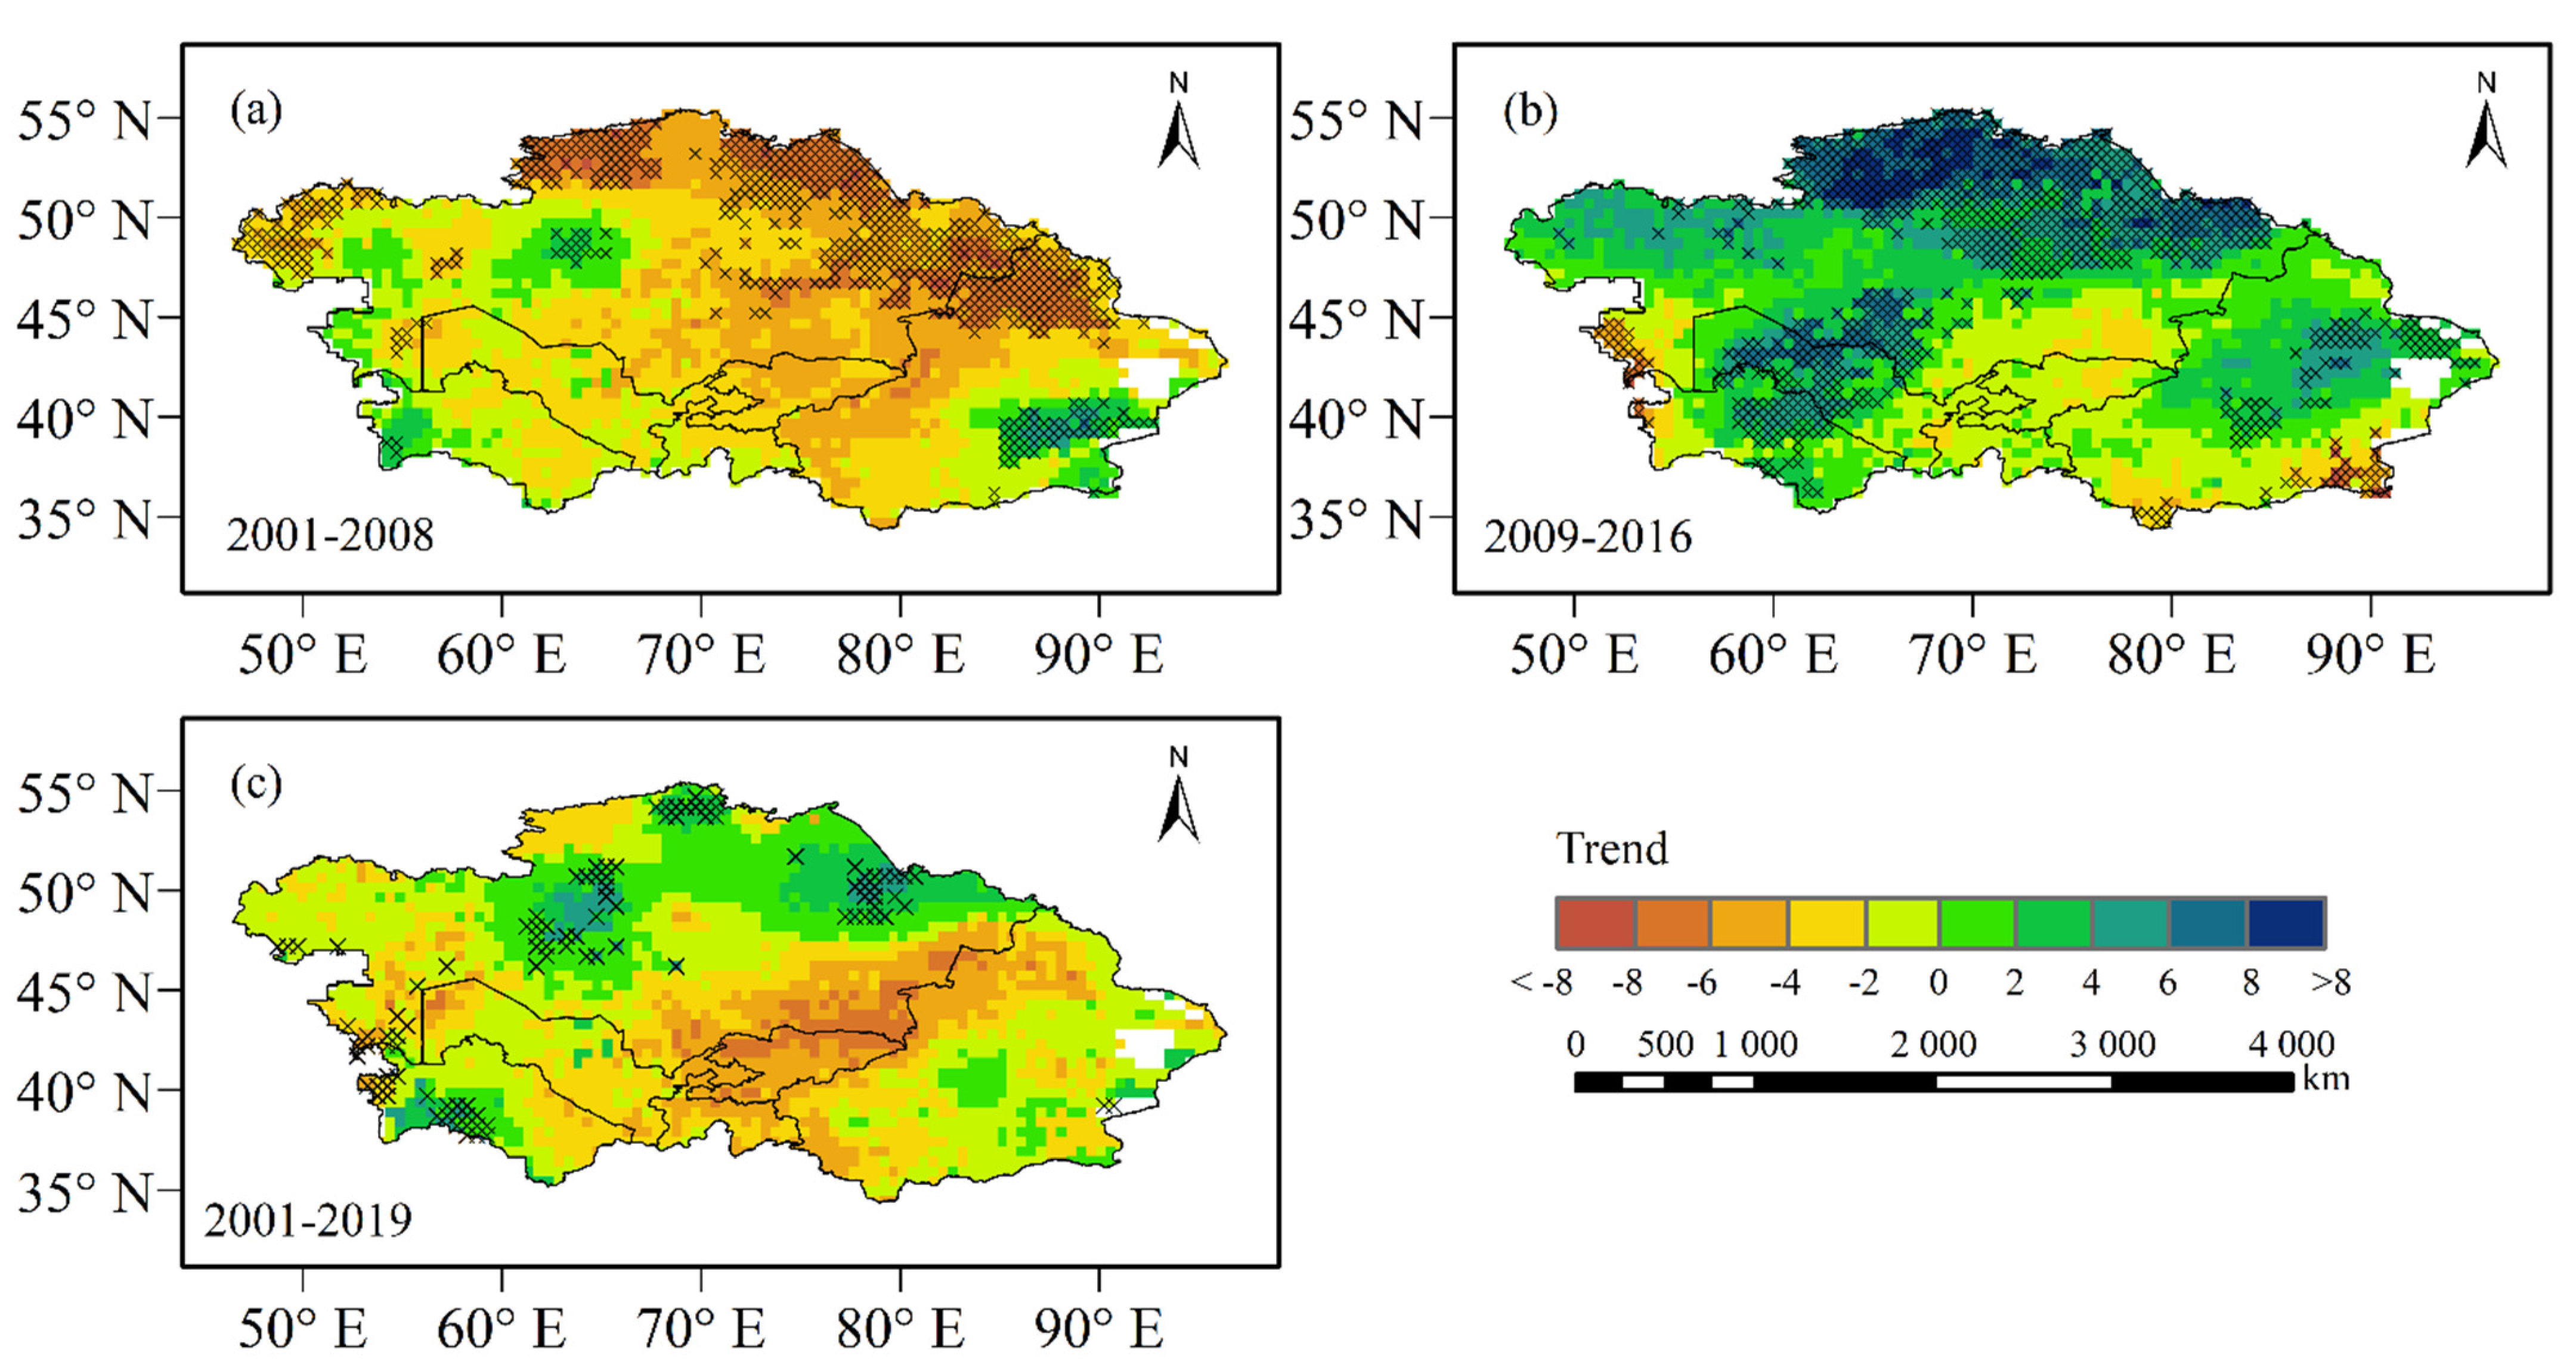
In terms of the interannual variation, the annual NPP trend of Central Asia from 2001 to 2019 was not significant, the RH increased significantly, and the NEP decreased significantly. Spatially, areas where the NPP and RH increased significantly were larger than those where the NPP decreased significantly, and the areas where the NEP decreased significantly were larger than those where the NPP increased significantly. Regions where the NPP increased significantly were mainly in eastern and southern Central Asia. Regions where the NPP decreased significantly were mainly in the west. Regions where the RH increased significantly were concentrated in the west and southwest, and regions where the RH decreased almost passed the significance test. The areas where the NEP decreased significantly were mainly distributed in the west and south. The NEP showed a significant upward trend only in a small area.
(2)
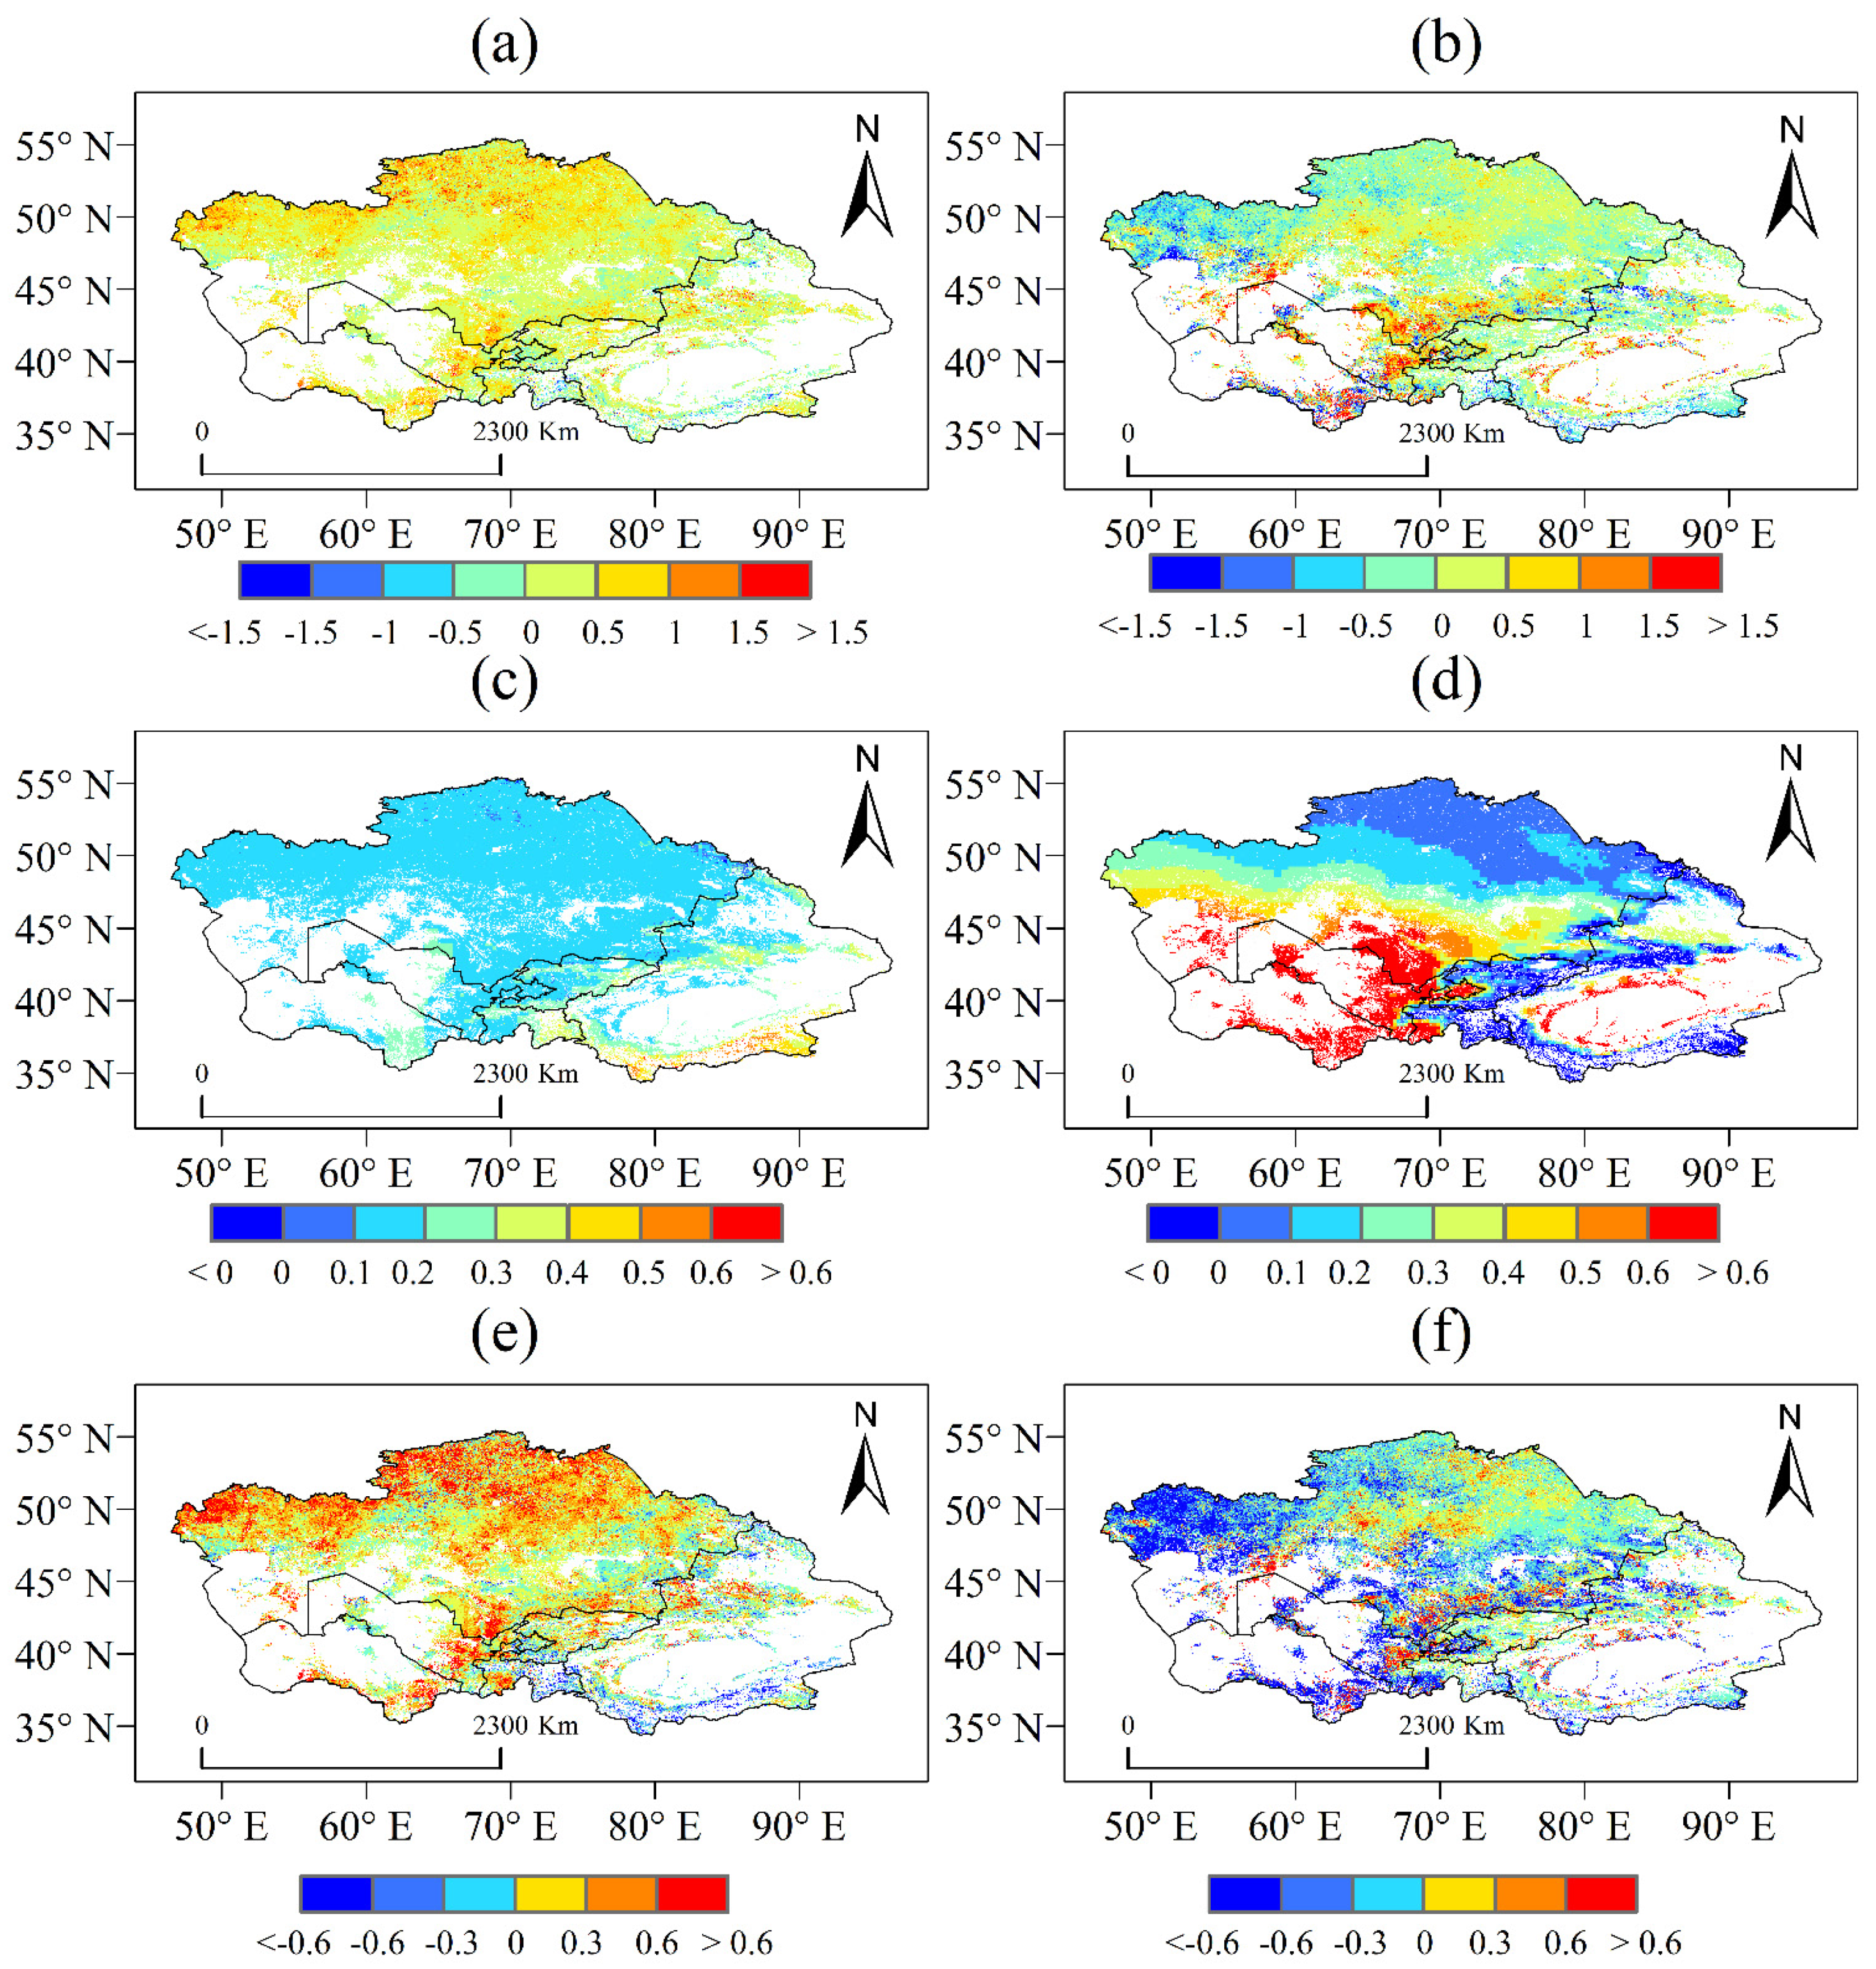
In terms of climate sensitivity, the NPP was more sensitive to precipitation, which increased with increasing precipitation in most regions. The RH was more sensitive to temperature and increased with increasing temperature. However, the NEP was more sensitive to temperature than precipitation and decreased with increasing temperature.
(3)
From 2001 to 2019, the contribution rate of temperature to the NEP was larger than that of precipitation, mainly manifested as the acceleration of soil respiration caused by the increasing temperature. A large amount of carbon was emitted to the atmosphere through soil respiration, resulting in the reduction of the carbon sink in the ecosystem.
(4)
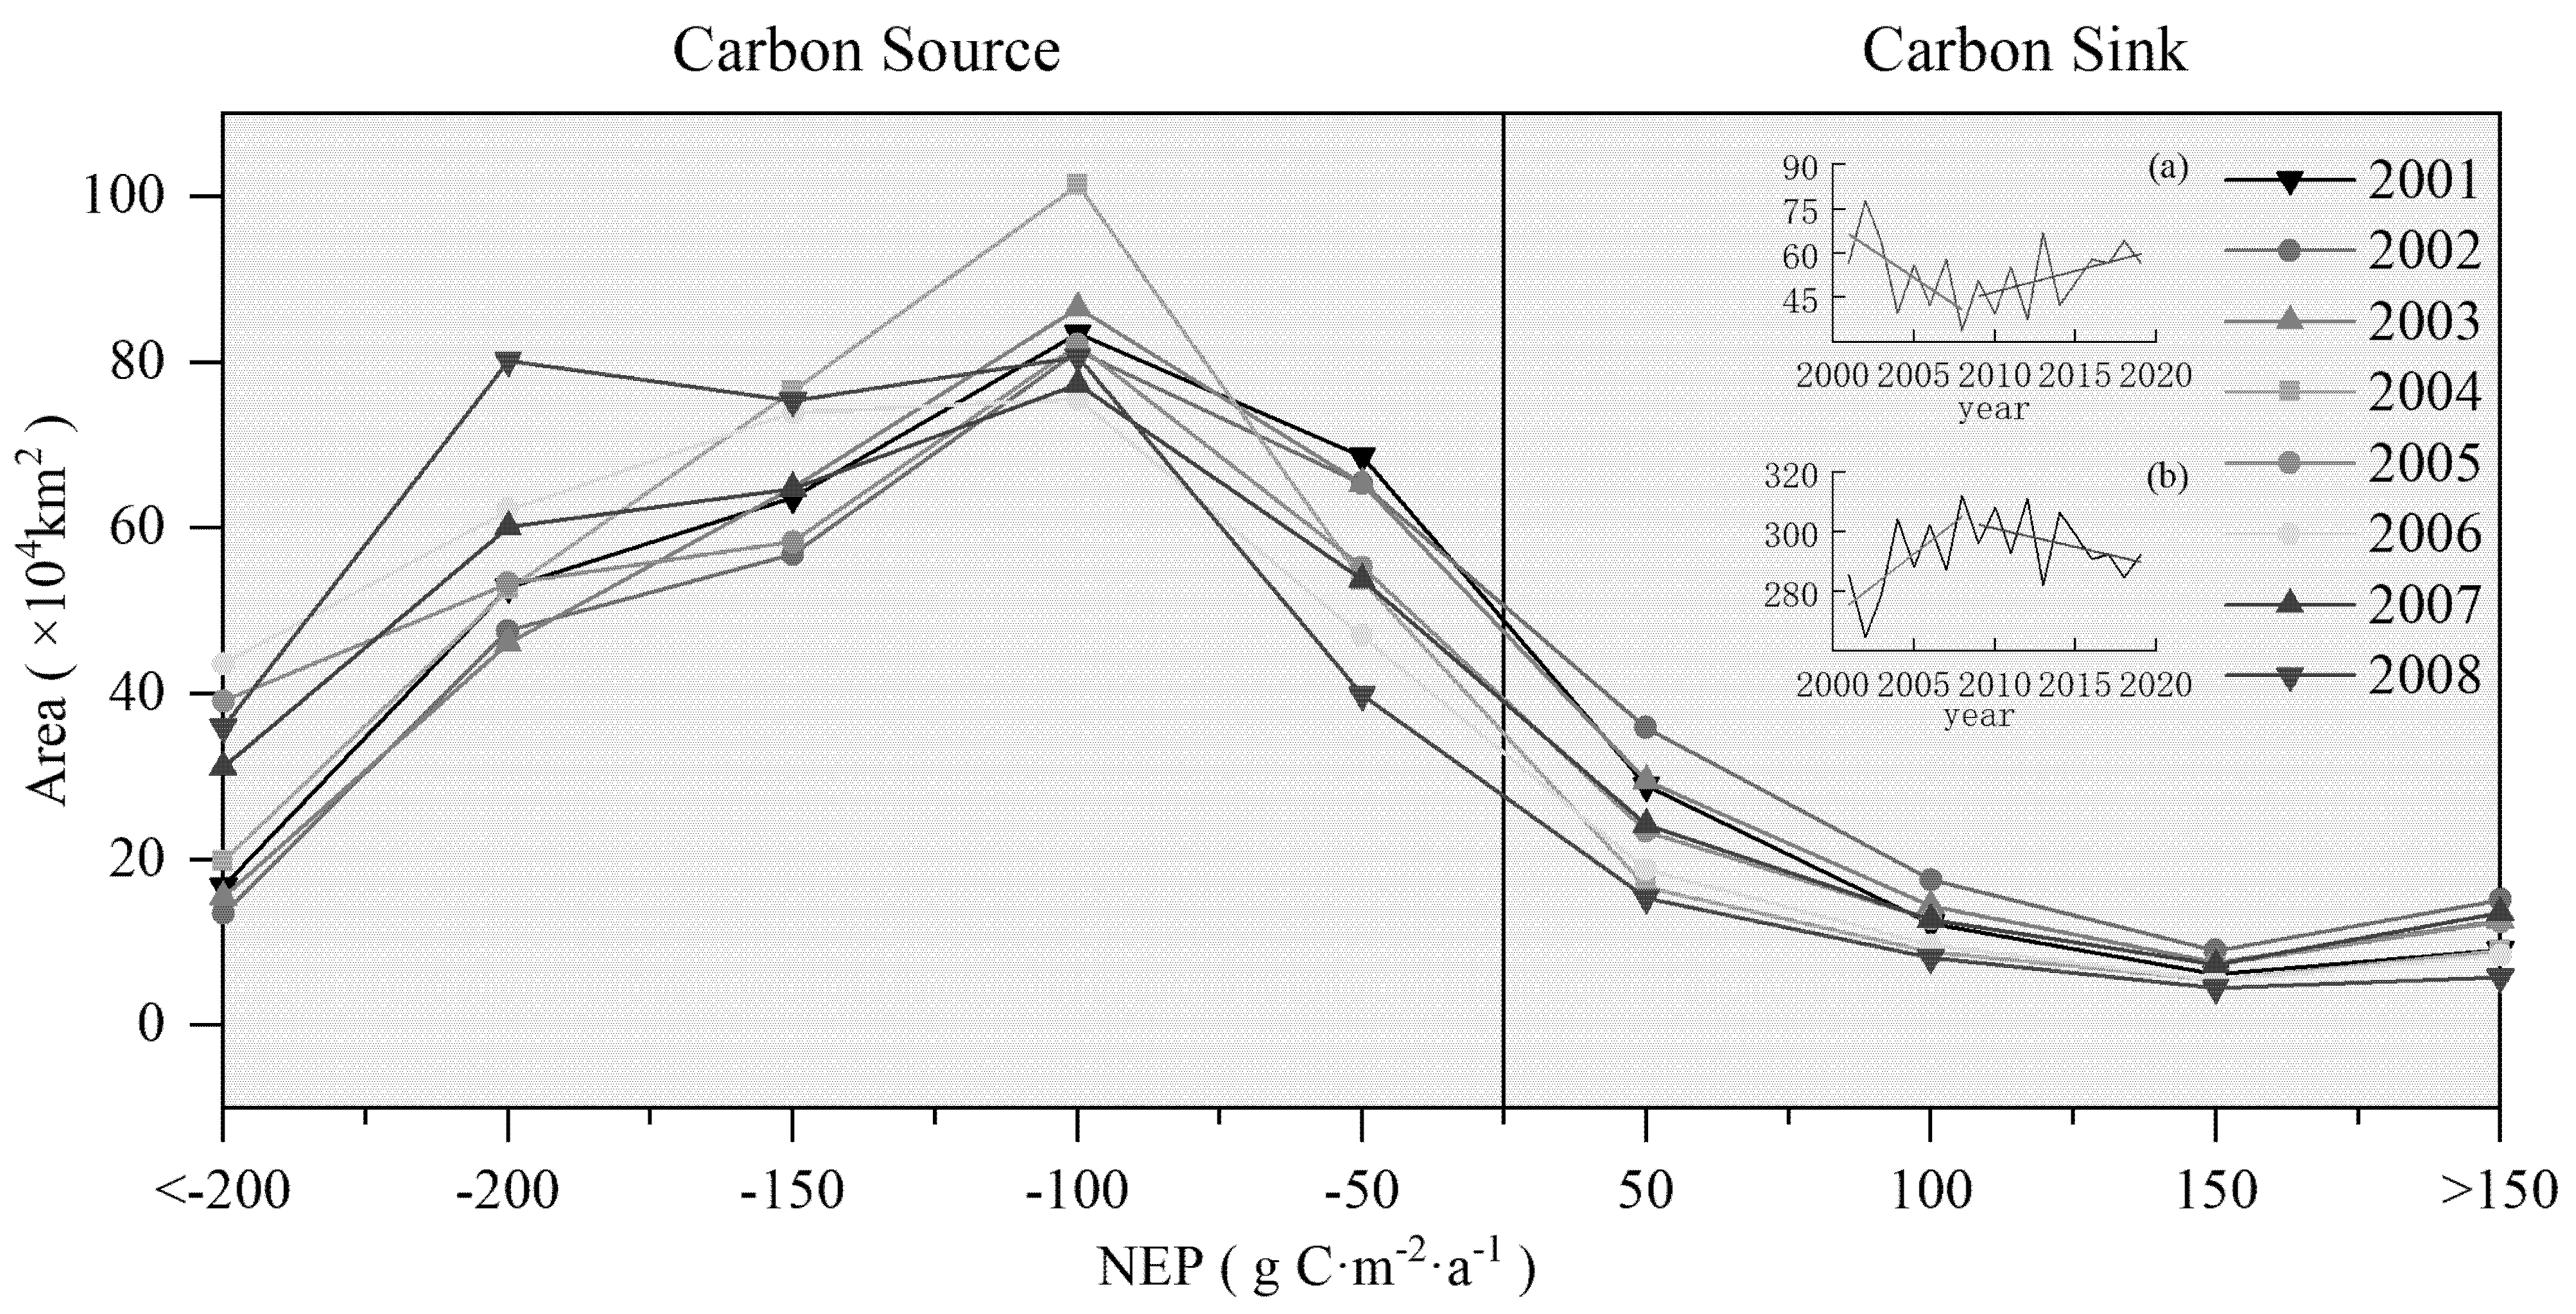
Drought also has an important impact on the carbon source/sink in Central Asia. Drought from 2001 to 2008 led to a significant increase in the area of carbon sources in Central Asia, with a weak carbon sink transforming into a carbon source and a weak carbon source transforming into a strong carbon source.

Author Contributions

All authors made significant contributions to this study. Conceptualization, X.H.; methodology, J.Z.; software, J.Z.; writing—original draft preparation, J.Z.; validation, H.H. and J.Z.; formal analysis, X.F. and Y.L.; writing—review and editing, J.Z.; project administration, X.H.; funding acquisition, X.H. All authors have read and agreed to the published version of the manuscript.

Funding

This study was supported by the Cross team project of CAS “Light of West China” Program (Grant No. E0284101) and the National Natural Science Foundation of China (U1903114).

Data Availability Statement

The GLDAS dataset was obtained from the NASA Global Land Data Assimilation System (GLDAS) Noah model (GLDAS_NOAH025_M_2.0). NDVI and vegetation photosynthetically active radiation data were obtained from https://lpdaacsvc.cr.usgs.gov/appeears/task/area (accessed on 9 September 2021). The Vegetation continuous fields data were obtained from https://lpdaacsvc.cr.usgs.gov/appeears/task/area (accessed on 9 September 2021).

Conflicts of Interest

The authors declare no conflict of interest.

References

  1. Alexander, L.; Allen, S.; Bindoff, N.; Breon, F.-M.; Church, J.; Cubasch, U.; Emori, S.; Forster, P.; Friedlingstein, P.; Gillett, N.; et al. Climate change 2013: The physical science basis, in contribution of Working Group I (WGI) to the Fifth Assessment Report (AR5) of the Intergovernmental Panel on Climate Change (IPCC). Science 2013, 129, 83–103. [Google Scholar]
  2. Hiltner, U.; Huth, A.; Hérault, B.; Holtmann, A.; Bräuning, A.; Fischer, R. Climate change alters the ability of neotropical forests to provide timber and sequester carbon. For. Ecol. Manag. 2021, 492, 119166. [Google Scholar] [CrossRef]
  3. Zhang, W.; Zhou, T.; Zou, L.; Zhang, L.; Chen, X. Reduced exposure to extreme precipitation from 0.5 °C less warming in global land monsoon regions. Nat. Commun. 2018, 9, 3153. [Google Scholar] [CrossRef] [Green Version]
  4. Zhang, L.; Wylie, B.K.; Ji, L.; Gilmanov, T.G.; Tieszen, L.L.; Howard, D.M. Upscaling carbon fluxes over the Great Plains grasslands: Sinks and sources. J. Geophys. Res. 2011, 116, 1–13. [Google Scholar]
  5. Li, Z.; Chen, Y.; Zhang, Q.; Li, Y. Spatial patterns of vegetation carbon sinks and sources under water constraint in Central Asia. J. Hydrol. 2020, 590, 125355. [Google Scholar] [CrossRef]
  6. Keenan, T.F.; Prentice, I.C.; Canadell, J.; Williams, C.A.; Wang, H.; Raupach, M.; Collatz, G.J. Recent pause in the growth rate of atmospheric CO2 due to enhanced terrestrial carbon uptake. Nat. Commun. 2016, 7, 13428. [Google Scholar] [CrossRef] [PubMed] [Green Version]
  7. Cui, E.; Bian, C.; Luo, Y.; Niu, S.; Wang, Y.; Xia, J. Spatial variations in terrestrial net ecosystem productivity and its local indicators. Biogeosciences 2020, 17, 6237–6246. [Google Scholar] [CrossRef]
  8. Hassan, Q.K.; Bourque, C.P.-A.; Meng, F.-R. Estimation of daytime net ecosystem CO2 exchange over balsam fir forests in eastern Canada: Combining averaged tower-based flux measurements with remotely sensed MODIS data. Can. J. Remote Sens. 2006, 32, 405–416. [Google Scholar] [CrossRef] [Green Version]
  9. Li, C.; Wang, Y.; Wu, X.; Cao, H.; Li, W.; Wu, T. Reducing human activity promotes environmental restoration in arid and semi-arid regions: A case study in Northwest China. Sci. Total Environ. 2021, 768. [Google Scholar] [CrossRef] [PubMed]
  10. Hashimoto, S.; Carvalhais, N.; Ito, A.; Migliavacca, M.; Nishina, K.; Reichstein, M. Global spatiotemporal distribution of soil respiration modeled using a global database. Biogeosciences 2015, 12, 4121–4132. [Google Scholar] [CrossRef] [Green Version]
  11. Mitchard, E.T.A. The tropical forest carbon cycle and climate change. Nature 2018, 559, 527–534. [Google Scholar] [CrossRef]
  12. Piao, S.; Ciais, P.; Friedlingstein, P.; Peylin, P.; Reichstein, M.; Luyssaert, S.; A Margolis, H.; Fang, J.; Barr, A.; Chen, A.; et al. Net carbon dioxide losses of northern ecosystems in response to autumn warming. Nature 2008, 451, 49–52. [Google Scholar] [CrossRef]
  13. Yang, Y.; Fang, J.; Ma, W.; Smith, P.; Mohammat, A.; Wang, S.; Wang, W. Soil carbon stock and its changes in northern China’s grasslands from 1980s to 2000s. Glob. Chang. Biol. 2010, 16, 3036–3047. [Google Scholar] [CrossRef]
  14. Yao, Y.; Li, Z.; Wang, T.; Chen, A.; Wang, X.; Du, M.; Jia, G.; Li, Y.; Li, H.; Luo, W.; et al. A new estimation of China’s net ecosystem productivity based on eddy covariance measurements and a model tree ensemble approach. Agric. For. Meteorol. 2018, 253, 84–93. [Google Scholar] [CrossRef]
  15. Cao, M.; Prince, S.D.; Li, K.; Tao, B.; Small, J.; Shao, X. Response of terrestrial carbon uptake to climate interannual variability in China. Glob. Chang. Biol. 2003, 9, 536–546. [Google Scholar] [CrossRef]
  16. Pei, Z.-Y.; Ouyang, H.; Zhou, C.-P.; Xu, X. Carbon Balance in an Alpine Steppe in the Qinghai-Tibet Plateau. J. Integr. Plant Biol. 2009, 51, 521–526. [Google Scholar] [CrossRef]
  17. Jie, G.; Ying, Z.; Caiyun, Q. Temporal and spatial distribution of net ecosystem productivity in the Bailongjiang Watershed of Gansu Province. Acta Ecol. Sin. 2017, 37, 5121–5128. [Google Scholar]
  18. Hu, Z.; Zhang, C.; Hu, Q.; Tian, H. Temperature Changes in Central Asia from 1979 to 2011 Based on Multiple Datasets. J. Clim. 2014, 27, 1143–1167. [Google Scholar] [CrossRef]
  19. Wu, L.; Ma, X.; Dou, X.; Zhu, J.; Zhao, C. Impacts of climate change on vegetation phenology and net primary productivity in arid Central Asia. Sci. Total Environ. 2021, 796, 149055. [Google Scholar] [CrossRef]
  20. Yao, J.; Chen, Y.; Chen, J.; Zhao, Y.; Tuoliewubieke, D.; Li, J.; Yang, L.; Mao, W. Intensification of extreme precipitation in arid Central Asia. J. Hydrol. 2021, 598, 125760. [Google Scholar] [CrossRef]
  21. Li, Z.; Chen, Y.; Fang, G.; Li, Y. Multivariate assessment and attribution of droughts in Central Asia. Sci. Rep. 2017, 7, 1–12. [Google Scholar] [CrossRef] [PubMed]
  22. Li, C.; Zhang, C.; Luo, G.; Chen, X.; Maisupova, B.; Madaminov, A.A.; Han, Q.; Djenbaev, B.M. Carbon stock and its responses to climate change in Central Asia. Glob. Chang. Biol. 2015, 21, 1951–1967. [Google Scholar] [CrossRef] [PubMed]
  23. Han, Q.; Luo, G.; Li, C.; Li, S. Response of Carbon Dynamics to Climate Change Varied among Different Vegetation Types in Central Asia. Sustainability 2018, 10, 3288. [Google Scholar] [CrossRef] [Green Version]
  24. Han, Q.; Luo, G.; Li, C.; Shakir, A.; Wu, M.; Saidov, A. Simulated grazing effects on carbon emission in Central Asia. Agric. For. Meteorol. 2016, 216, 203–214. [Google Scholar] [CrossRef]
  25. Han, Q.; Yan, L.; Li, C. Impact of climate change on grassland carbon cycling in Central Asia. Arid Land Geogr. 2018, 41, 1351–1357. [Google Scholar]
  26. Sala, O.E.; Jackson, R.B.; Mooney, H.A.; Howarth, R.W. Introduction. Methods in Ecosystem Science: Progress, Tradeoffs, and Limitations. In Methods in Ecosystem Science; Springer: New York, NY, USA, 2000; pp. 1–3. [Google Scholar]
  27. Potter, C.S.; Randerson, J.T.; Field, C.B.; Matson, P.A.; Vitousek, P.M.; Mooney, H.A.; Klooster, S.A. Terrestrial ecosystem production: A process model based on global satellite and surface data. Glob. Biogeochem. Cycles 1993, 7, 811–841. [Google Scholar] [CrossRef]
  28. Zhu, W.; Pan, Y.; He, H.; Yu, D.; Hu, H. Simulation of maximum light use efficiency for some typical vegetation types in China. Chin. Sci. Bull. 2006, 51, 457–463. [Google Scholar] [CrossRef]
  29. Jiang, W.; Yuan, L.; Wang, W.; Cao, R.; Zhang, Y.; Shen, W. Spatio-temporal analysis of vegetation variation in the Yellow River Basin. Ecol. Indic. 2015, 51, 117–126. [Google Scholar] [CrossRef]
  30. Pan, N.; Feng, X.; Fu, B.; Wang, S.; Ji, F.; Pan, S. Increasing global vegetation browning hidden in overall vegetation greening: Insights from time-varying trends. Remote Sens. Environ. 2018, 214, 59–72. [Google Scholar] [CrossRef]
  31. Li, Z.; Chen, Y.; Li, W.; Deng, H.; Fang, G. Potential impacts of climate change on vegetation dynamics in Central Asia. J. Geophys. Res. Atmos. 2015, 120, 12345–12356. [Google Scholar] [CrossRef]
  32. Dai, E.F.; Huang, Y.; Wu, Z.; Zhao, D.S. Analysis of spatio-temporal features of a carbon source/sink and its relationship to climatic factors in the Inner Mongolia grassland ecosystem. Acta Geogr. Sin. 2016, 26, 297–312. [Google Scholar] [CrossRef] [Green Version]
  33. Houghton, R.A. Revised estimates of the annual net flux of carbon to the atmosphere from changes in land use and land management 1850–2000. Tellus B Chem. Phys. Meteorol. 2016, 55, 378–390. [Google Scholar]
  34. Tang, Y.; Jia, C.; Wang, L.; Wen, X.; Wang, H. Solar energy dominates and soil water modulates net ecosystem productivity and evapotranspiration across multiple timescales in a subtropical coniferous plantation. Agric. For. Meteorol. 2021, 300, 108310. [Google Scholar] [CrossRef]
  35. Chen, B.; Zhang, X.; Tao, J.; Wu, J.; Wang, J.; Shi, P.; Zhang, Y.; Yu, C. The impact of climate change and anthropogenic activities on alpine grassland over the Qinghai-Tibet Plateau. Agric. For. Meteorol. 2014, 189–190, 11–18. [Google Scholar] [CrossRef]
  36. Matías, L.; Hidalgo-Galvez, M.D.; Cambrollé, J.; Domínguez, M.T.; Pérez-Ramos, I.M. How will forecasted warming and drought affect soil respiration in savannah ecosystems? The role of tree canopy and grazing legacy. Agric. For. Meteorol. 2021, 304–305, 108425. [Google Scholar] [CrossRef]
  37. Chen, D.; Zhang, C.; Wu, J.; Zhou, L.; Lin, Y.; Fu, S. Subtropical plantations are large carbon sinks: Evidence from two monoculture plantations in South China. Agric. For. Meteorol. 2011, 151, 1214–1225. [Google Scholar] [CrossRef]
  38. Neumann, M.; Zhao, M.; Kindermann, G.; Hasenauer, H. Comparing MODIS Net Primary Production Estimates with Terrestrial National Forest Inventory Data in Austria. Remote Sens. 2015, 7, 3878–3906. [Google Scholar] [CrossRef] [Green Version]
  39. Wei, L. Spatiotemporal Change Research of Ecosystems Productivity in Regions of Central Asia Based on Improved BEPS Model 2019; Henan Polytechnic University: Jiaozuo, China, 2019. [Google Scholar]
  40. Ferdush, J.; Paul, V. A review on the possible factors influencing soil inorganic carbon under elevated CO2. Catena 2021, 204. [Google Scholar] [CrossRef]
  41. De Keersmaecker, W.; Lhermitte, S.; Tits, L.; Honnay, O.; Somers, B.; Coppin, P. A model quantifying global vegetation resistance and resilience to short-term climate anomalies and their relationship with vegetation cover. Glob. Ecol. Biogeogr. 2015, 24, 539–548. [Google Scholar] [CrossRef]
  42. Zhou, P.; Liu, G.; Xue, S. Review of soil respiration and the impact factors on grassland ecosystem. Acta Prataculturae Sin. 2009, 18, 184–193. [Google Scholar]
  43. Kou, D.; Ma, W.; Ding, J.; Zhang, B.; Fang, K.; Hu, H.; Yu, J.; Wang, T.; Qin, S.; Zhao, X.; et al. Dryland soils in northern China sequester carbon during the early 2000s warming hiatus period. Funct. Ecol. 2018, 32, 1620–1630. [Google Scholar] [CrossRef]
  44. Dalal, R.C.; Thornton, C.M.; Allen, D.E.; Kopittke, P.M. A study over 33 years shows that carbon and nitrogen stocks in a subtropical soil are increasing under native vegetation in a changing climate. Sci. Total Environ. 2021, 772, 145019. [Google Scholar] [CrossRef]
  45. Cramer, W.; Bondeau, A.; Woodward, F.I.; Prentice, I.C.; Betts, R.A.; Brovkin, V.; Cox, P.M.; Fisher, V.; Foley, J.A.; Friend, A.D.; et al. Global response of terrestrial ecosystem structure and function to CO2 and climate change: Results from six dynamic global vegetation models. Glob. Chang. Biol. 2001, 7, 357–373. [Google Scholar] [CrossRef] [Green Version]
  46. Zhou, L.; Wang, Y.; Jia, Q.; Zhou, G. Increasing temperature shortened the carbon uptake period and decreased the cumulative net ecosystem productivity in a maize cropland in Northeast China. Field Crops Res. 2021, 267, 108150. [Google Scholar] [CrossRef]
  47. Lloyd, J.; Taylor, J. On the Temperature Dependence of Soil Respiration. Funct. Ecol. 1994, 8, 315–323. [Google Scholar] [CrossRef]
  48. Zhang, J.; Wang, F. Regional Temperature Response in Central Asia to National Committed Emission Reductions. Int. J. Environ. Res. Public Health 2019, 16, 2661. [Google Scholar] [CrossRef] [Green Version]
Figure 1. Distribution of the fractions of tree cover (a), non-tree vegetation (b), and bare cover (c). Land cover types in Central Asia (d).
Remotesensing 13 04449 g001
Figure 2. Inter-annual changes in the vegetation net primary productivity (NPP), soil heterotrophic respiration (RH), and net ecosystem productivity (NEP) in Central Asia from 2001 to 2019.
Remotesensing 13 04449 g002
Figure 3. Spatial distribution of the (a) vegetation net primary productivity (NPP), (c) soil heterotrophic respiration (RH), and (e) net ecosystem productivity (NEP) in Central Asia. Multi-year trends of the (b) NPP, (d) RH, and (f) NEP; shaded areas in the inset maps to the upper right represent areas that passed the significance test (red denotes a significant increase and blue denotes a significant decrease).
Remotesensing 13 04449 g003
Figure 4. Sensitivity coefficients of the vegetation net primary productivity (NPP) to (a) precipitation and (b) temperature. Sensitivity coefficients of the soil heterotrophic respiration (RH) to (c) precipitation and (d) temperature. Sensitivity coefficients of the net ecosystem productivity (NEP) to (e) precipitation and (f) temperature.
Remotesensing 13 04449 g004
Figure 5. Interannual variation trend and significance test results of the (a) temperature and (b) precipitation in Central Asia from 2001 to 2019.
Remotesensing 13 04449 g005
Figure 6. Contribution rates of the (a) precipitation and (b) temperature to the net ecosystem productivity (NEP) interannual variation from 2001 to 2019. (c) Difference between the contribution rates of precipitation and temperature from 2001 to 2019.
Remotesensing 13 04449 g006
Figure 7. Multiyear change trend of the Palmer Drought Severity Index (PDSI): (a) 2001 to 2008, (b) 2009 to 2016, and (c) 2001 to 2019.
Remotesensing 13 04449 g007
Figure 8. Annual net ecosystem productivity (NEP) area distribution in Central Asia from 2001 to 2008. (a) Area of the change in the carbon sink from 2001 to 2019 and (b) area of the change in the carbon source from 2001 to 2019. The red line is the slope for 2001 to 2008 and the blue line is the slope for 2009 to 2019.
Remotesensing 13 04449 g008
Figure 9. Relationship between the net primary productivity (NPP) (y-axis) of CASA and the NPP (x-axis) of the MOD17 model (a). Relationship between the estimation of the soil respiration data from the empirical model (y-axis) and observation data (x-axis) from the Fukang Desert Ecosystem in Xinjiang (b). ** means passing the significance test with a confidence of 99%. Contribution rates of different vegetation types to the net ecosystem productivity (NEP) of the Central Asian ecosystem (c).
Remotesensing 13 04449 g009
Figure 10. (a) Vegetation net primary productivity (NPP), (b) soil heterotrophic respiration (RH), and (c) net ecosystem productivity (NEP) as a function of the fractions of tree cover, non-tree cover, and non-vegetation pixels.
Remotesensing 13 04449 g010
Publisher’s Note: MDPI stays neutral with regard to jurisdictional claims in published maps and institutional affiliations.

