Abstract
A novel coronavirus, COVID-19, appeared at the beginning of 2020 and within a few months spread worldwide. The COVID-19 pandemic had some of its greatest impacts on social, economic and religious activities. This study focused on the application of daily nighttime light (NTL) data (VNP46A2) to measure the spatiotemporal impact of the COVID-19 pandemic on the human lifestyle in Saudi Arabia at the national, province and governorate levels as well as on selected cities and sites. The results show that NTL brightness was reduced in all the pandemic periods in 2020 compared with a pre-pandemic period in 2019, and this was consistent with the socioeconomic results. An early pandemic period showed the greatest effects on the human lifestyle due to the closure of mosques and the implementation of a curfew. A slight improvement in the NTL intensity was observed in later pandemic periods, which represented Ramadan and Eid Alfiter days when Muslims usually increase the light of their houses. Closures of the two holy mosques in Makkah and Madinah affected the human lifestyle in these holy cities as well as that of Umrah pilgrims inside Saudi Arabia and abroad. The findings of this study confirm that the social and cultural context of each country must be taken into account when interpreting COVID-19 impacts, and that analysis of difference in nighttime lights is sensitive to these factors. In Saudi Arabia, the origin of Islam and one of the main sources of global energy, the preventive measures taken not only affected Saudi society; impacts spread further and reached the entire Islamic society and other societies, too.
Keywords:
Saudi Arabia; Holy Mosque; Prophet’s Mosque; VIIRS DNB; NTL; COVID-19 pandemic; human lifestyle 1. Introduction
The year 2020 will long be remembered for the economic and social impacts of the COVID-19 global pandemic. According to the World Bank [1], the world gross domestic product (GDP) reduced by 3.5% in 2020, and by the end of 2021, is expected to grow 5.6%. Moreover, global trade fell about 16% in 2020 and is anticipated to increase by 8.3% in 2021. In addition, the World Health Organization (WHO), on 5 September 2021, reported 221 million confirmed COVID-19 cases and 4.5 million deaths across the world. The pandemic has also impacted religious freedoms: for example, the Saudi government restricted the number of Hajj pilgrims in 2020 and 2021 to 10,000 and 60,000, respectively, in comparison with 2.4 million in 2019 [2,3]. Some researchers have highlighted how global society has not faced an emergency crisis and challenge like COVID-19 for a century [4,5]. In comparison with severe acute respiratory syndrome (SARS) and Middle East respiratory syndrome (MERS), the COVID-19 virus is characterized by its ease of transmission [6]. Thus, within a short period, COVID-19 spread through whole countries. Many governments worldwide implemented extensive measures to slow down transmission of the virus, including closure of schools, non-essential stores, and religious and social centers, along with city lockdowns and curfews.
Various studies have measured, evaluated and predicted the impact of the COVID-19 crisis from a wide range of environmental and socioeconomic perspectives such as epidemiology [7,8,9,10,11], air pollution [12,13,14,15], economic growth [5,16,17,18], tourism [2,19,20,21], electricity consumption [22,23,24] and human activities [25,26,27,28,29].
Nighttime light (NTL) data, a source of information on anthropogenic lighting, have been widely used for different socioeconomic applications [30,31] such as mapping urban areas [32,33], mapping impervious surfaces [34,35], for population estimation [36,37], quantifying electricity consumption [38,39] and modelling the gross domestic product (GDP) [40]. NTL data also have the ability to provide insights into human mobility and behavior [26]. Therefore, it is proposed that it should be possible to identify, analyze and monitor people’s reactions to the COVID-19 preventative measures in almost real-time (i.e., on a daily basis) and at a low cost using NTL data.
Elvidge et al. [25] measured the impact of COVID-19 on human activities at the prefectural level and some highly populated cities in China using NTL data and found that 82% of the inhabitants were living in dimmed (decrease in NTL brightness) areas in February 2020, compared with 62% living in brightened (increase in NTL brightness) areas in March 2019. Moreover, most of the prefectural units showed a decline in NTL intensity during the COVID-19 pandemic compared with the pre-pandemic period [25]. A similar study was presented by Ghosh et al. [5] in India at the district level as well as some major cities. However, two pandemic periods were analyzed instead of one. Ghosh and colleagues demonstrated human mobility from the city core to the outskirts as well as a decline in traffic volume, particularly in Delhi, during the COVID-19 measures [5]. Yin et al. [29] evaluated the recovery of city activities of 17 regions in China by analyzing pre-pandemic, during-pandemic and post-pandemic NTL imagery and concluded that the recovery of the regions was varied. On the other hand, Shao et al. [28] focused on work resumption in Wuhan, China at the city and district levels and concluded that NTL brightness increased after lifting the lockdown at different levels for central and suburban districts, indicating a slight return to pre-pandemic social and economic life [28]. Similar findings were reported by Lan et al. [27]. Xu et al. [41] analyzed the lockdown due to COVID-19 in 20 global megacities using nighttime satellite sensor data and found an overall decrease in the NTL brightness with different percentages after the lockdown. Moreover, Asian cities were most affected by the COVID-19 pandemic compared with cities in Europe, Africa, North America and South America [41].
All the above studies interpreted the impacts of COVID-19 in terms of a set of specific socioeconomic factors affecting each country. However, aspects of religious life have a huge impact on activity patterns, and have not been measured yet. One of the most significant measures taken by most countries was preventing people from visiting places of worship to reduce the spread of the COVID-19 virus. This research focuses on Saudi Arabia because it features different socioeconomic characteristics that have not yet been investigated. Saudi Arabia and other countries closed their mosques [42] due to the COVID-19 pandemic, affecting the second pillar of Islam, performing prayer. Although prayer is permitted at home, it is considered much better to pray in a mosque with a group of people according to the Islamic faith [43,44]. Moreover, the COVID-19 pandemic period covered Ramadan, the most important month for Muslims [43], and Muslims usually go to mosques to pray Taraweeh. These are special prayers in Ramadan after the evening prayer (Isha). As a consequence, the COVID-19 pandemic also affected the fourth pillar of Islam, fasting during Ramadan. This study is the first to shed light on the impact of COVID-19-preventive measures on human activities in areas associated with this unique cultural and economic context.
The Ministry of Health in Saudi Arabia announced the registration of the first case of COVID-19 on 2 March 2020 (07.07.1441), from a citizen who came from Iran through the Kingdom of Bahrain. The Saudi government had taken proactive and sensitive steps, such as suspending Umrah for pilgrims coming from abroad on 26 February 2020 (02.07.1441), prior to the appearance of COVID-19 in the country, and followed these with further preventative measures. This study aims to measure the impact of the COVID-19 pandemic on the human lifestyle in Saudi Arabia at the national, provincial and governorate administrative levels, as well as in some selected cities and sites, using the Black Marble NTL data product (VNP46A2). Specifically, the following research questioned are addressed:
- Is it possible to measure the impact of the COVID-19 pandemic by analyzing nighttime lights?
- Is there an observable disparity in the impact of the COVID-19 pandemic at different spatial scales?
- What is the impact of the COVID-19 pandemic on areas characterized by different socioeconomic conditions?
- To what extent do different COVID-19 preventative measures affect human activities?
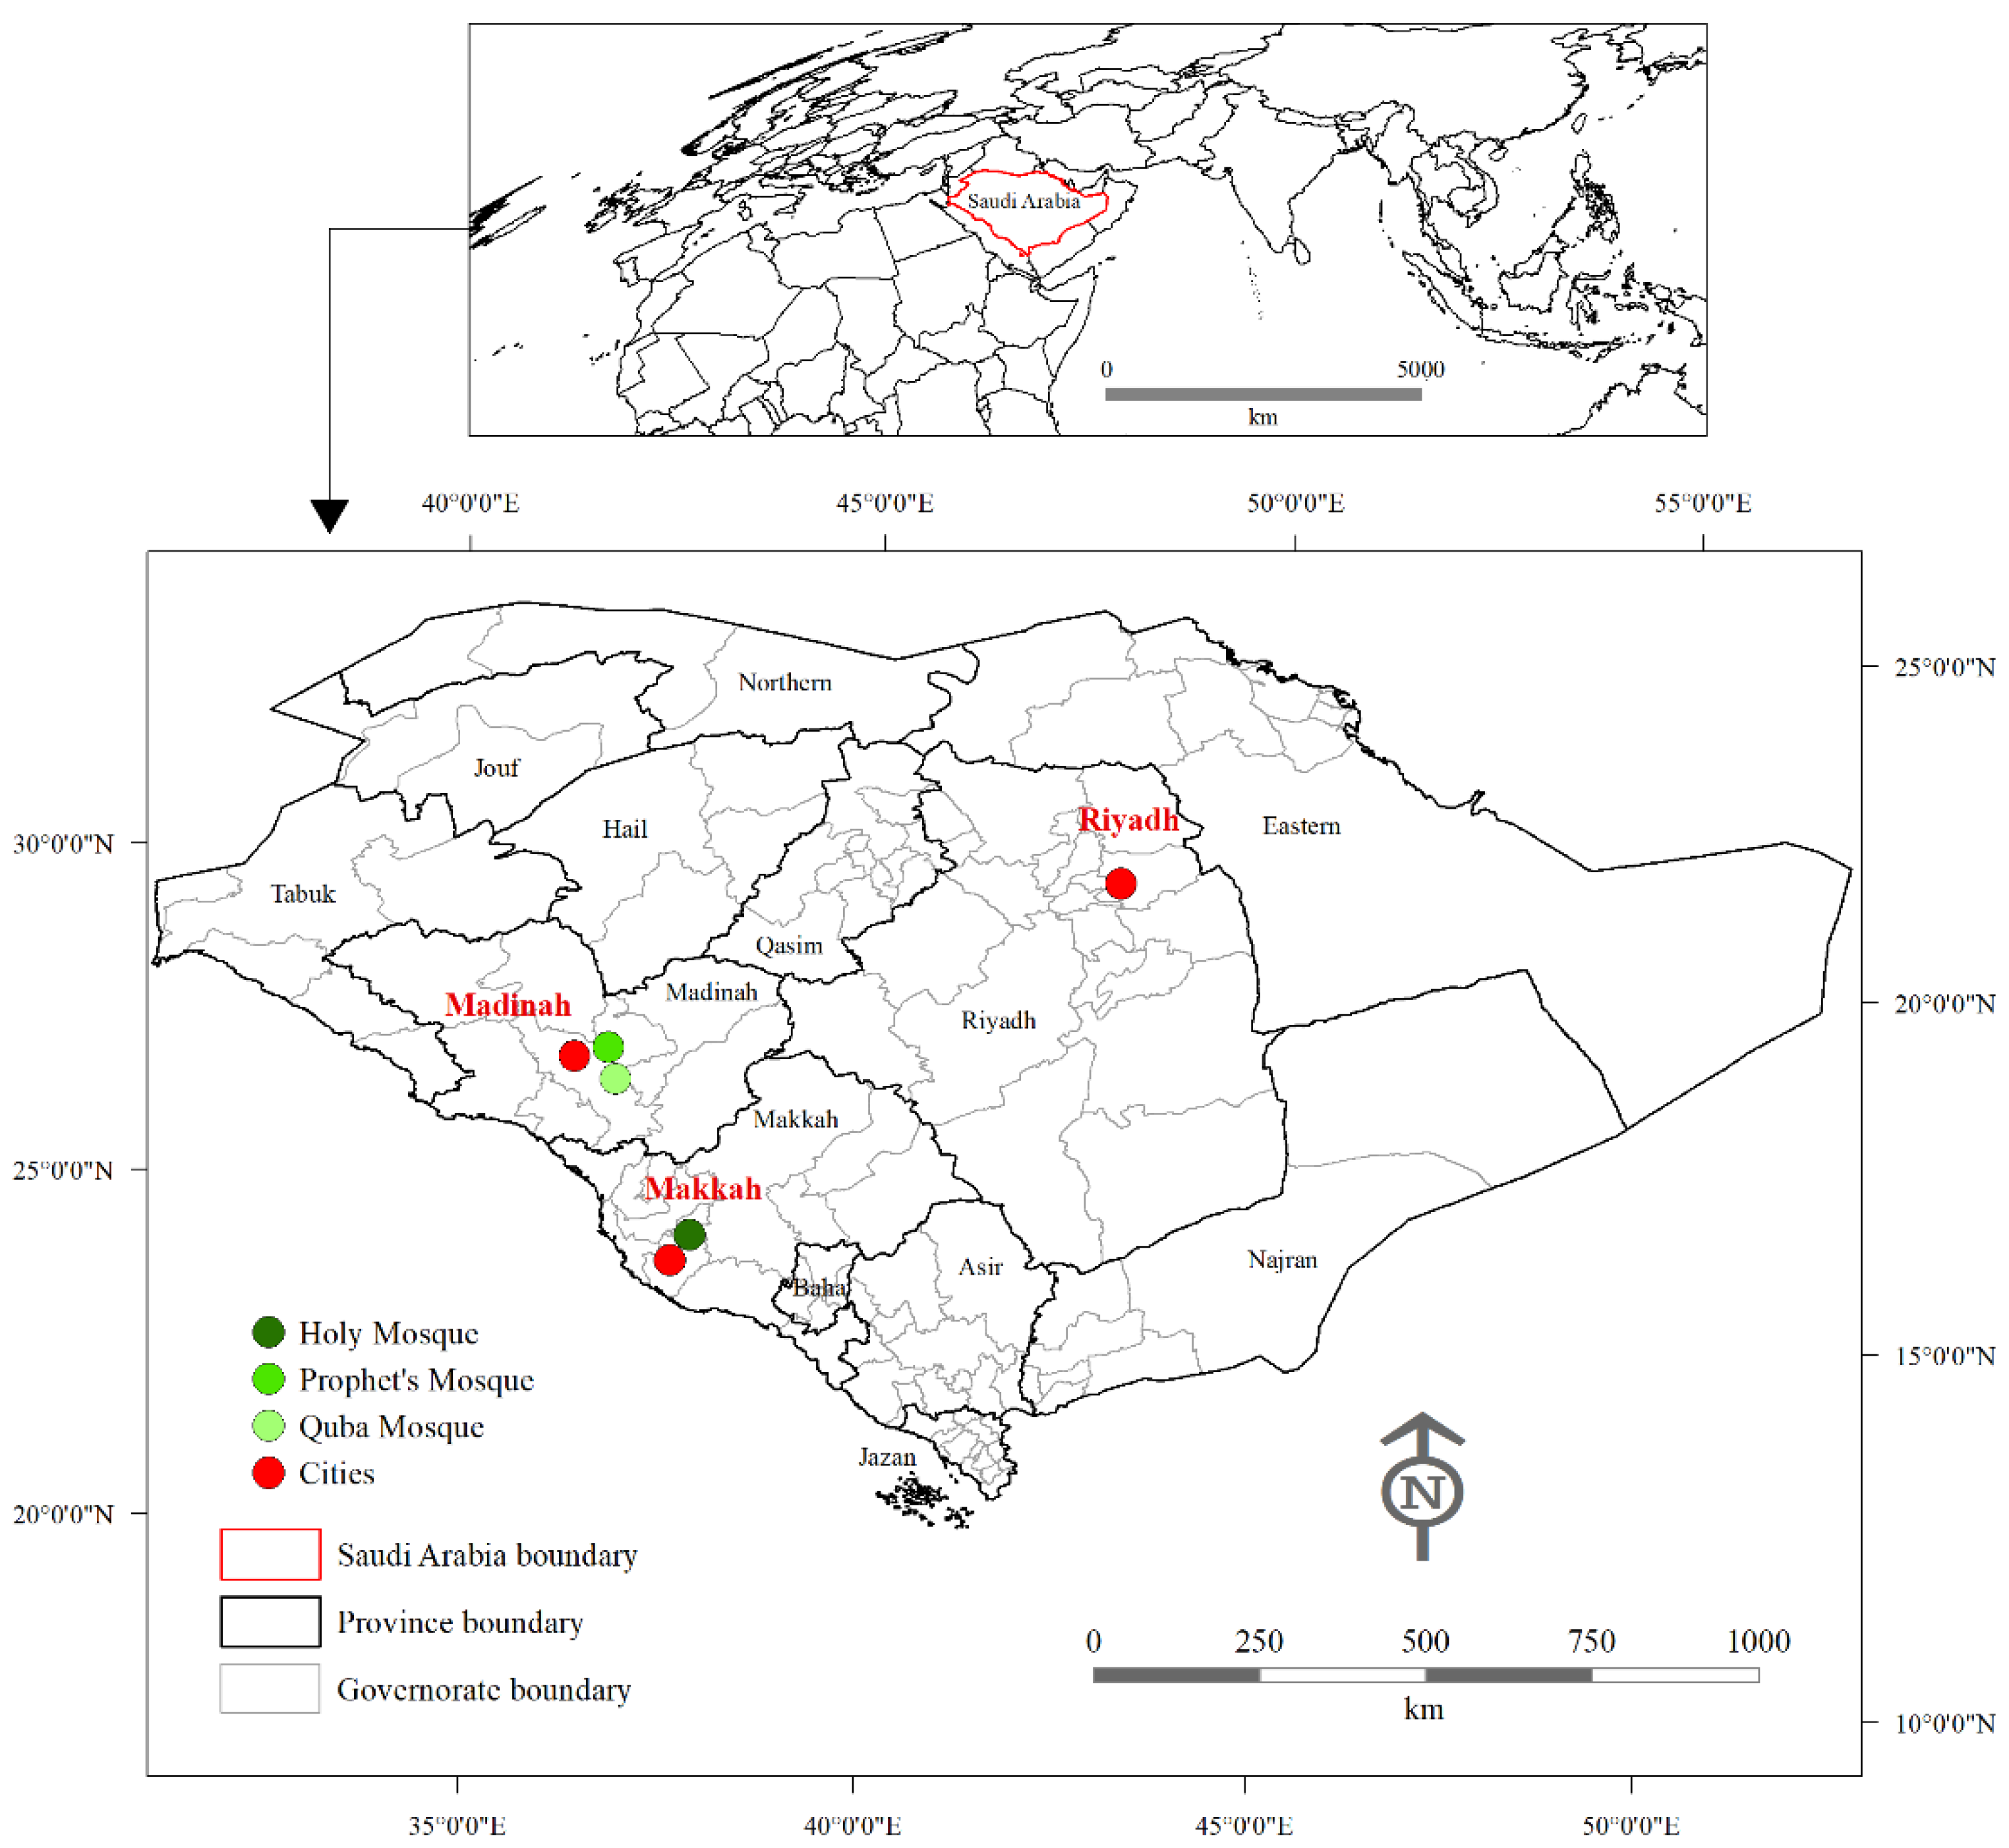
Saudi Arabia is well-suited to addressing these questions because it (1) is home to the world’s most important sites to Muslims, including the first house of worship, Holy Mosque, Prophet’s Mosque and Quba Mosque [45,46], (2) is one of the most important countries for oil production and export [47] and (3) has recently hosted a series of national and international social, cultural, entertainment and sporting events throughout the country [46,48]. Thus, this research can be used as a reference for pandemic impacts in Islamic countries, giving it a wider application.
2. Materials and Methods
2.1. Study Area
The Kingdom of Saudi Arabia is located in the southwestern corner of the continent of Asia and in the middle of the Arabian Peninsula (Figure 1). It is one of the largest oil-producing countries and is bordered by two of the most important maritime oil routes, the Arabian Gulf from the east and Red Sea from the west. The country consists of 118 governorates, grouped into 13 provinces. Saudi Arabia has a prestigious religious position amongst Muslims because Islam originated in this land. In addition, it includes Kaaba, the first house built on Earth to worship Allah, the Holy Mosque, Prophet’s Mosque and Quba Mosque. Therefore, it is the focus of attention for Muslims for Hajj, Umrah and Ziarah (usually Umrah or Hajj pilgrims visit the Prophet’s Mosque). For example, 1.9 million [3] pilgrims from abroad came to Saudi Arabia for Hajj and 7.5 million [49] for Umrah in 2019. Saudi Arabia thus holds an important political and religious position, playing a geopolitical role at the regional and global level, which was potentially of relevance to the spread of the COVID-19 pandemic.
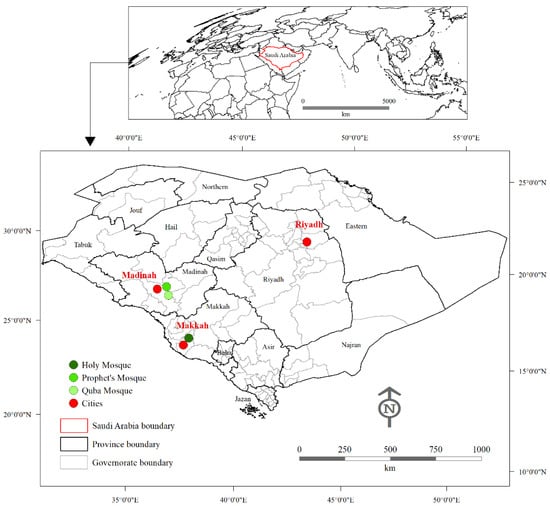
Figure 1.
Location of Saudi Arabia and its provinces and governorates.
2.2. Dataset
The Suomi National Polar-Orbiting Partnership (SNPP) Visible Infrared Imaging Radiometer Suite (VIIRS) includes a Day-Night Band (DNB) sensor that records daily images of the Earth’s surface of nocturnal visible and near-infrared (NIR) light [50,51]. The VIIRS/DNB features a spatial resolution of 500 m and a radiometric resolution of 16 bits, with a broad wavelength of 500 to 900 nm that improves the capability to detect the light from anthropogenic phenomena such as buildings, factories, cars and streetlamps [31]. The VNP46A2 dataset is the second of two nighttime light products available in the recently released Black Marble suite of products that implements the current state of-the-art NTL imagery [51]. The precursor to this dataset, known as VNP46A1 data, records daily at-sensor top of atmosphere (TOA) measurements of surface radiance and requires processing to compensate for noise and atmospheric artefacts. The VNP46A2 dataset, by contrast, is a post-processed version representing the daily gap-filled DNB radiance values with correction for bidirectional reflectance distribution function effects due to lunar illumination and airglow reflections from the atmosphere [31,51]. This study utilized the VNP46A2 to monitor changes in the human lifestyle due to the COVID-19 pandemic.
Saudi Arabia’s General Authority for Statistics (GAS) is entrusted with the implementation of statistical work, as well as collecting statistical information from other Saudi agencies. Socioeconomic statistical data, including those on the Hajj and Umrah pilgrims, oil exports, non-oil exports, gross domestic product (GDP) and unemployment rates, were obtained from the GAS website (https://www.stats.gov.sa/) (accessed on 17 July 2020).
Population data were derived from the WorldPop datasets (https://www.worldpop.org/) (accessed on 25 September 2020). This product utilizes a random forest-based dasymetric approach to produce raster population grids with a 100-m spatial resolution [52].
2.3. Saudi Arabia COVID-19 Measures
The Saudi government took a set of preventive measures to preserve the health of people in the country and limit the spread of COVID-19. These measures are listed in Table 1 and consist of five periods: a pre-pandemic period (P0) and four pandemic periods (P1, P2, P3 and P4). The Ministry of the Interior imposed a list of penalties to ensure the compliance of citizens and residents with the preventative measures taken to combat the pandemic. Examples of fines included: 10,000 SR ($2,600) for family gatherings and violating the curfew, 15,000 SR ($4,000) for non-family gatherings and 100,000 SR ($27,000) for COVID-19 patients who broke home isolation.

Table 1.
Preventive measures implemented by the Saudi government.
2.4. Data Processing
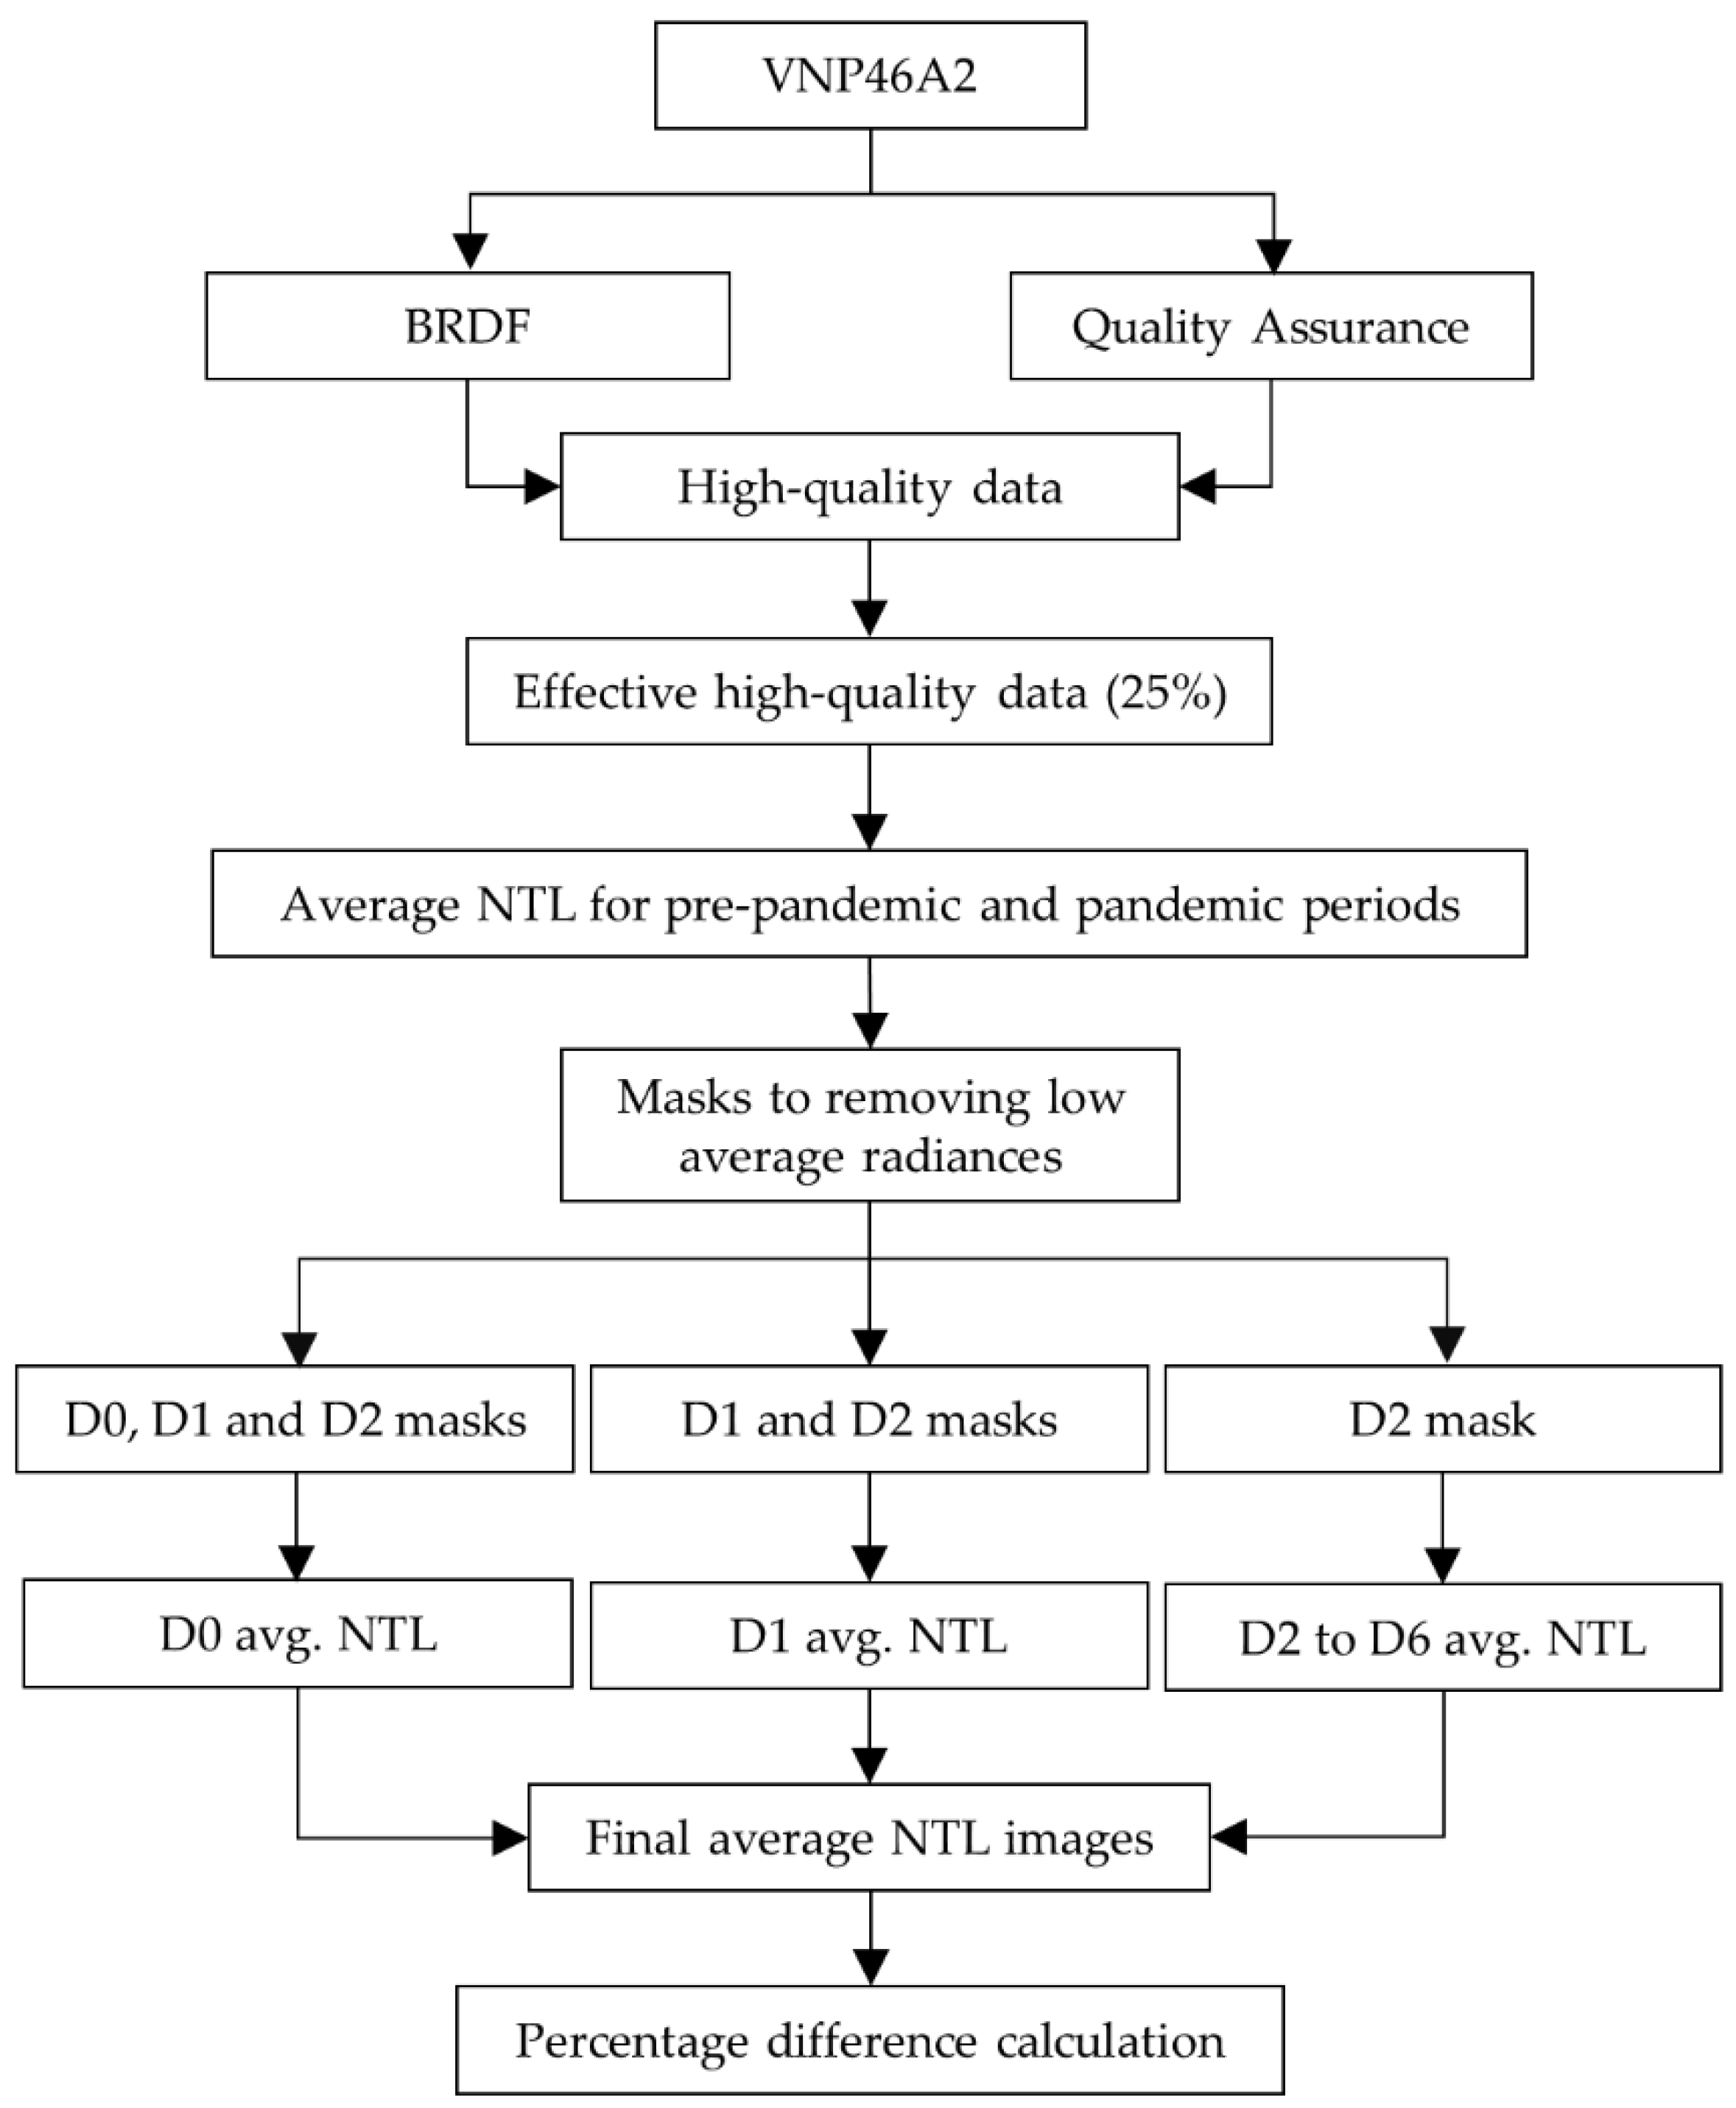
In this research, we utilized multiple NTL daily images. Each individual NTL image was processed to derive a compatible high-quality set of NTL image pixels for the purpose of comparison between pre-pandemic and multiple pandemic periods. The processing (Figure 2) was conducted at the pixel level and can be summarized in three steps: (i) high-quality data, (ii) low brightness intensity and (iii) percentage difference calculation.
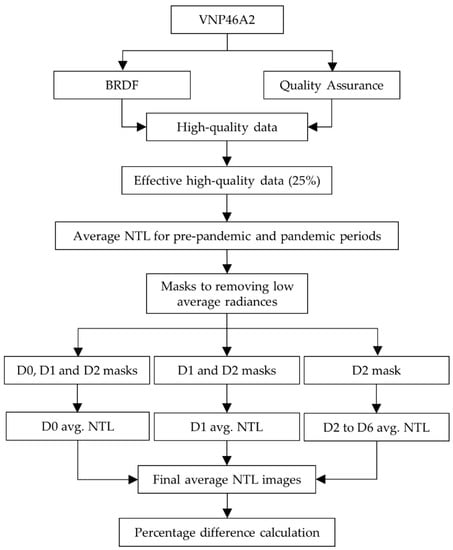
Figure 2.
Flowchart of the analytical process.
High-quality data: The daily NTL data are affected by multiple atmospheric phenomena such as clouds, moonlight, aerosols and snow [51], which decrease, increase or exclude artificial light sources, as well as blurring the spatial heterogeneity [53]. Thus, they cannot be utilized directly for socioeconomic applications. This issue was addressed by using the DNB BRDF layer, filtered using the mandatory quality assurance (QA) flags. The QA layer provides information about the reliability of the NTL data estimates using the indices of 00 (high-quality), 01 (good-quality), 02 (poor-quality) and 255 (no retrieval) [51]. In this research, for each individual day, a binary mask was produced to retrieve only the high-quality grid cells. Moreover, effective high-quality grid cells [41] were produced by using only those high-quality grid cells that accounted for more than 25% (a quarter) of the total date ranges, and then the mean was computed for each period. The same threshold was used by Xu et al. (2021 [41]).
Low brightness intensity: Uninhabitable areas such as vegetation and bare land cover have low mean radiances. The low mean values of the uninhabitable areas are a source of uncertainty because when they are summed over large administrative units (e.g., province or governorate levels), they can produce biased mean radiances. Therefore, through an empirical examination [54] of the study area, starting with a small radiance value (1.0 nWcm−2sr−1) and ending with a radiance value of 15 nWcm−2sr−1, a radiance of 10 nWcm−2sr−1 was selected as an optimum threshold for excluding uninhabitable grid cells. Thus, three binary masks were produced based on D0, D1 and D2 mean NTL images (Figure 2). The assumption of the mask processing was that (i) uninhabitable pixels at a later time (i.e., February 2020) were also uninhabitable pixels at an earlier time (i.e., February 2019) during the pre-pandemic period, and (ii) uninhabitable pixels prior to the pandemic were also uninhabitable during the pandemic. Therefore, the D0, D1 and D2 masks were overlaid and used to exclude uninhabitable pixels in the D0 mean NTL image, while the D1 and D2 masks were overlaid and utilized to exclude the uninhabitable pixels in the D1 mean NTL image. Then, the D2 mask was used to remove the uninhabitable pixels from the D2, D3, D4, D5 and D6 mean NTL images (Figure 2).
Percentage difference calculation: After applying the different masks to each period, the NTL data were projected using the Albers Equal Area projection [36]. Then, the total mean radiances were calculated at the national-level, province-level and governorate-level boundaries. The percentage difference of the NTL brightness was computed as:
where is the percentage difference of the NTL brightness (national, province or governorate zones) and TARNTLi and REFNTLi are the sum mean radiances for the target and reference NTL date ranges for the ith zone, respectively. Positive PD values indicate increases and negative values denote decreases in the NTL brightness.
3. Results
3.1. Change of NTL Intensity at the National and Provincial Levels
Controlling the COVID-19 pandemic in Saudi Arabia required people to abide by the preventive measures imposed by the government such as reducing their movements, meetings and activities. Percentage differences were calculated between a pair (reference and target) of NTL datasets from the pre-pandemic and pandemic periods to analyze changes in the human lifestyle in Saudi Arabia.
Figure 3 shows the percentage difference in NTL brightness in Saudi Arabia for the five periods. P0, the pre-pandemic period, was used as a benchmark for comparison with the different pandemic periods. The value at P0 means the percentage difference of the NTL brightness in the pre-pandemic period (2019) between the mean reference (D0) and mean target (D1) date ranges, whereas the values of P1 to P4 reflect the percentage differences of the NTL brightness in the pandemic periods (2020) between the mean reference (D2) and mean targets (D3 to D6), respectively. It can be noted that the NTL brightness significantly decreased during the pandemic periods in 2020 compared with the pre-pandemic period in 2019 as a result of the implementation of COVID-19 preventive measures (Table 1). For example, NTL brightness decline by −2.6% in the P1 pandemic period and then further declined to −14%, −12% and −19% in pandemic periods P2, P3 and P4, respectively.
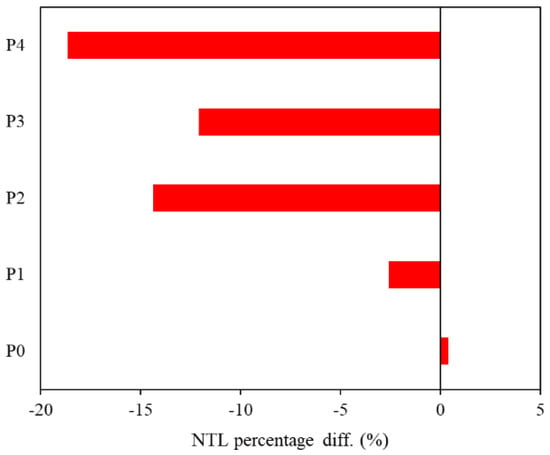
Figure 3.
Percentage difference of the NTL radiance for different periods at the national level in Saudi Arabia.
Table 2 provides statistical information about certain socioeconomic indicators (oil exports, non-oil exports, GDP and unemployment rate) during the pre-pandemic (2019) and pandemic (2020) periods at the national level for Saudi Arabia. Compared with 2019, all the socioeconomic indicators declined in 2020. For example, oil exports in Q1 2020 decreased by −22% (149,950 million riyals compared with 192,026 million riyals in Q1 2019), followed by a sharp decline of −63% in Q2 2020 compared with Q2 2019. The other socioeconomic indictors have the same downward trend with different percentages except for the unemployment rate, which was slightly higher in Q1 2019 for Saudi and non-Saudi workers (12.52% and 0.61%) compared with Q1 2020 (11.78% and 0.54%), respectively. However, the Saudi unemployment rate increased to 15.45% in Q2 2020 with an increase of 3.15% and 3.67% compared with Q2 2019 and Q1 2020, respectively.
Table 2.
Socioeconomic information during the pre-pandemic (2019) and pandemic (2020) periods at the national level in Saudi Arabia.
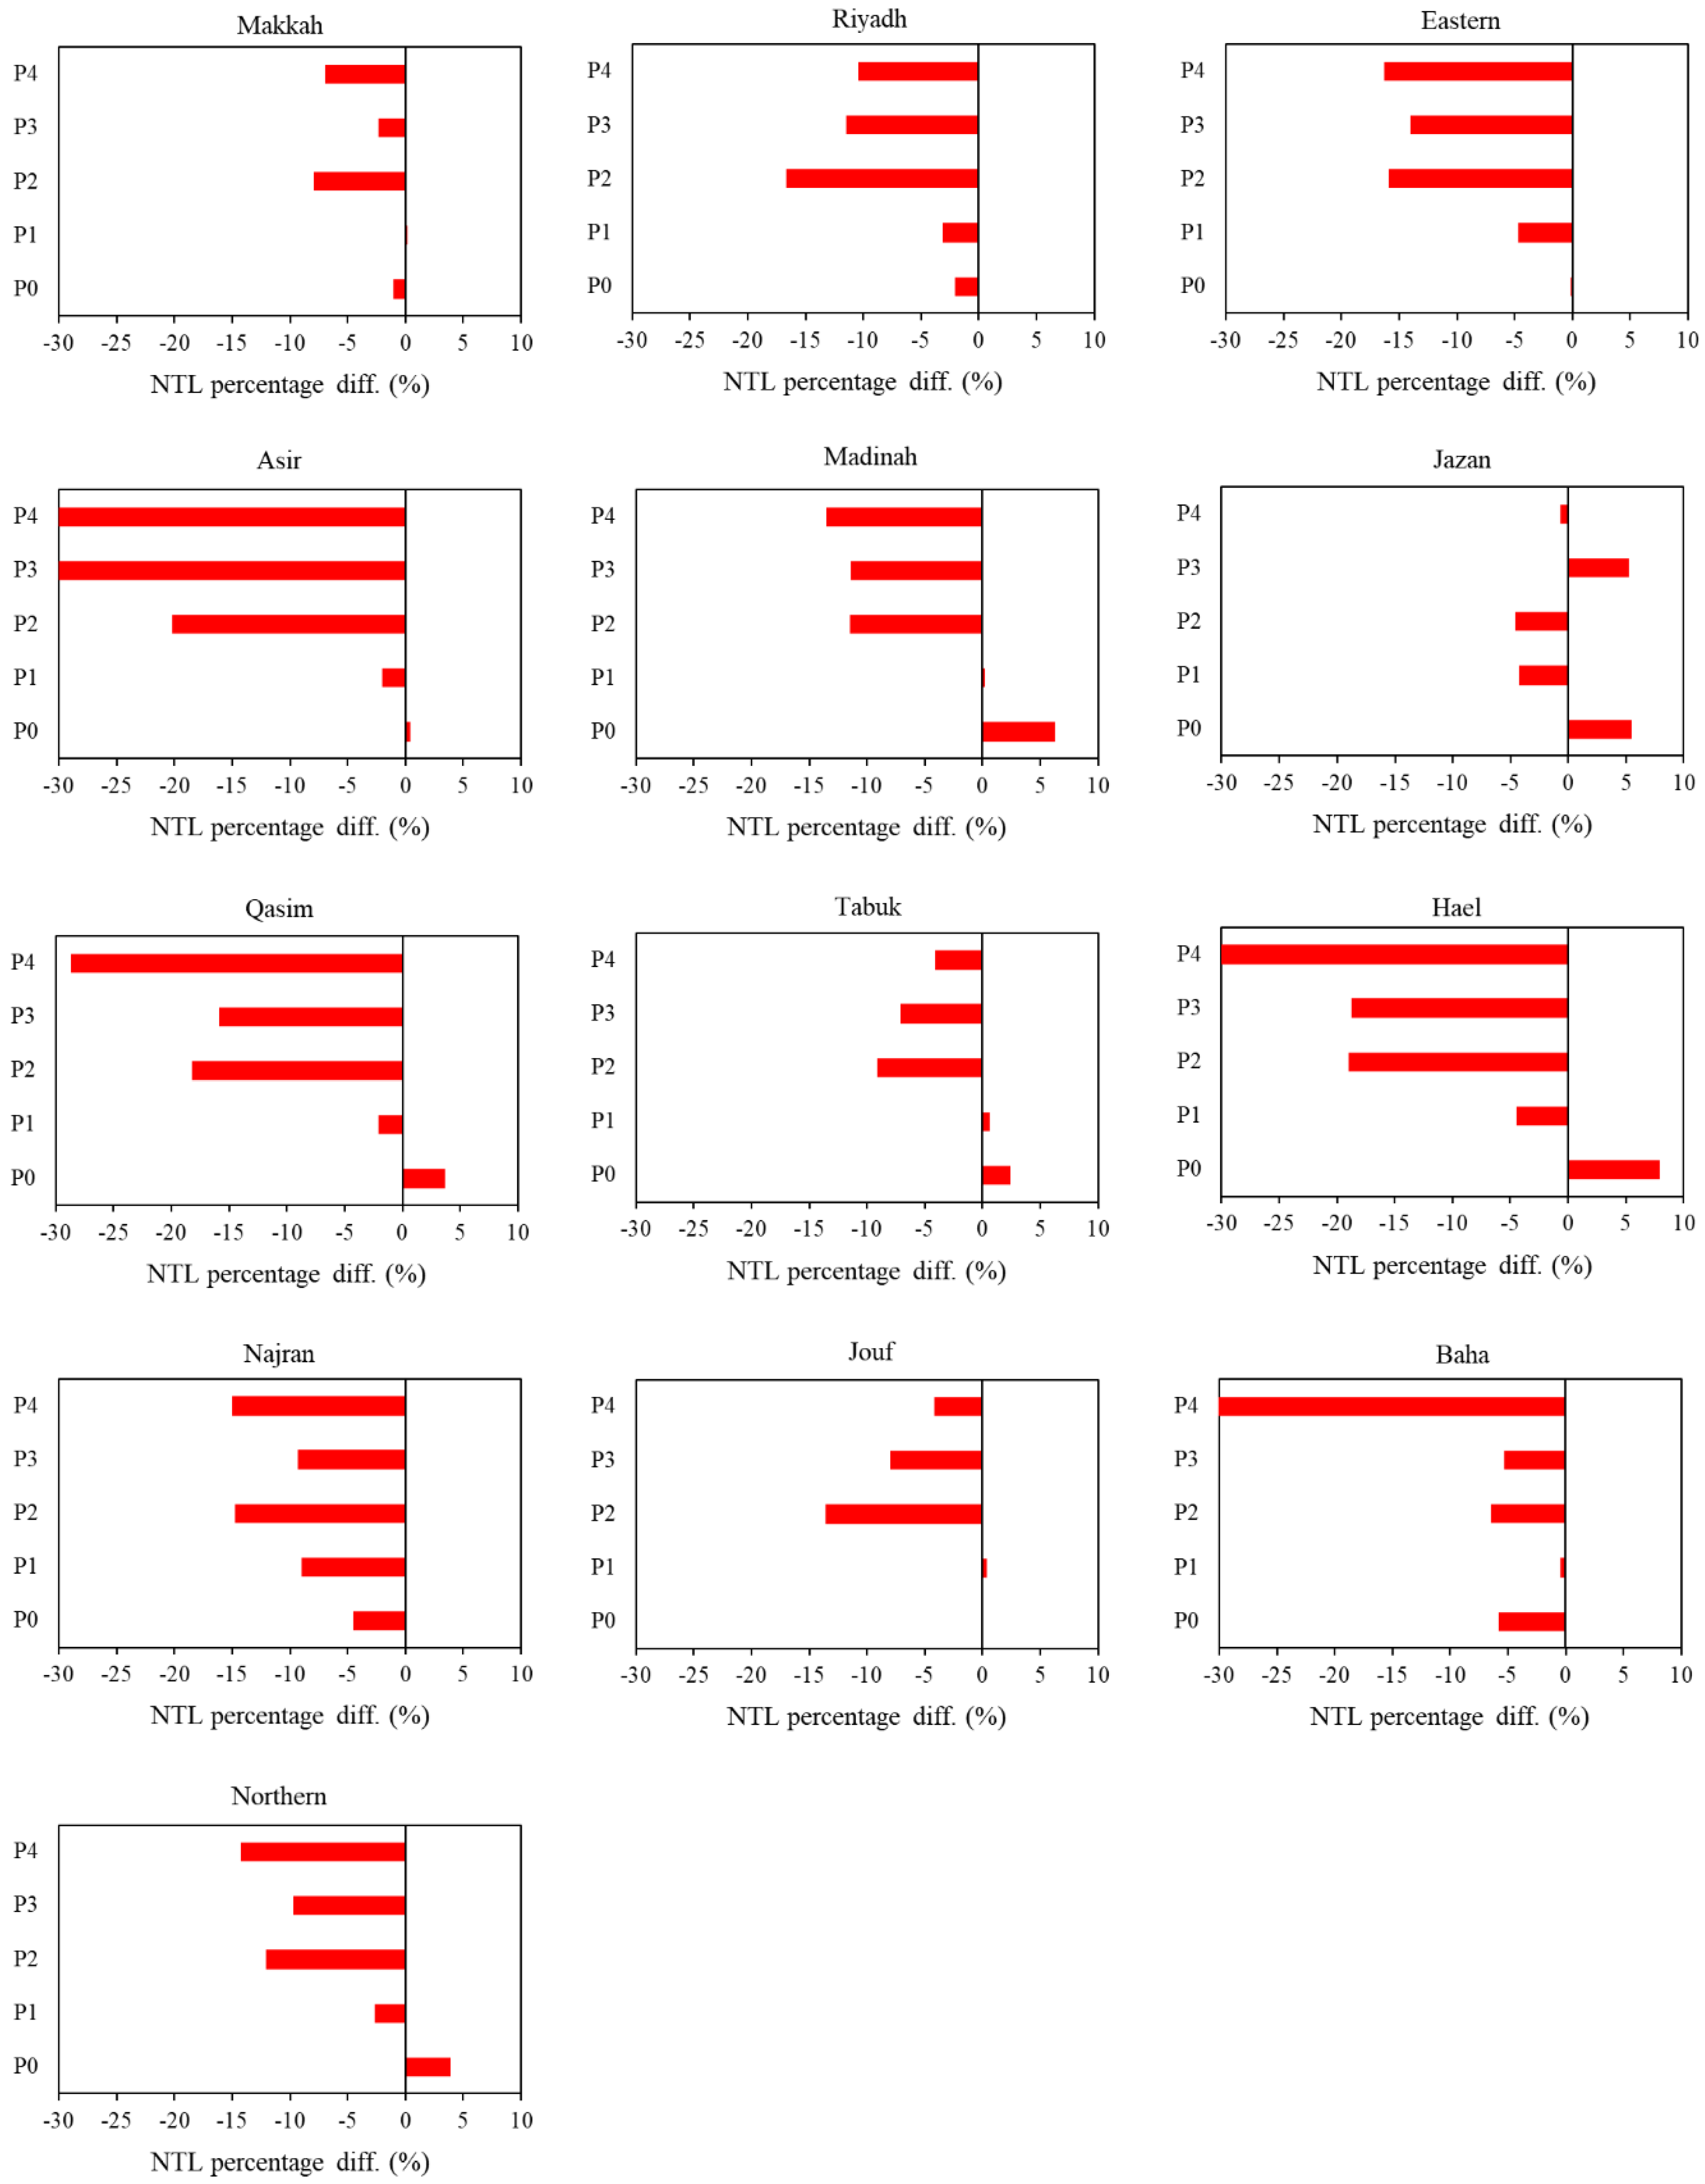
Figure 4 shows the percentage differences in NTL intensity for the 13 administrative provinces in Saudi Arabia. Overall, there is a remarkable fluctuation in the NTL brightness between the different pandemic periods at the provincial level. However, most of the pandemic periods reported negative values (decrease in NTL brightness). The NTL percentage differences are consistent for most of the different provinces, particularly in the P2 and P4 pandemic periods, which produced the largest decrease in NTL brightness compared with the other pandemic periods.
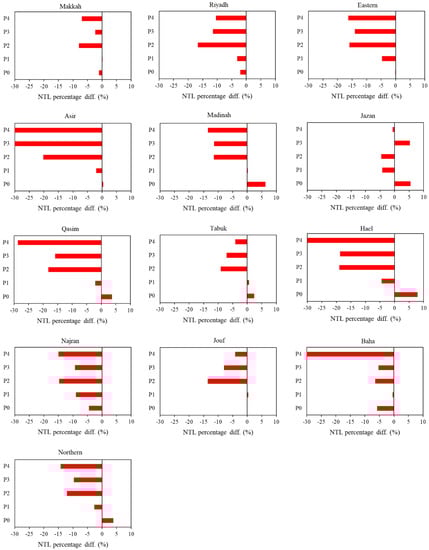
Figure 4.
NTL percentage differences for the different periods at the provincial level in Saudi Arabia.
The percentage differences for highly populated provinces such as Makkah, Riyadh and Eastern show similar patterns of NTL intensity change. For example, the NTL percentage difference for Riyadh province in the P1 pandemic period was −3%, dramatically decreasing by −17%, −12% and −10% in the P2, P3 and P4 pandemic periods, respectively. On the other hand, different patterns were found in the provinces with medium-sized populations such as Asir, Madinah, Jazan and Qasim. In Madinah province, the NTL percentage values of the P3 (−11%) and P4 (−14%) pandemic periods were smaller than those in Jazan province (P3 = 5% and P4 = −1%). Asir and Baha, tourist provinces, reported the largest decreases in NTL intensity in the P4 pandemic period, with values of −56% and −53%, respectively, compared with the other provinces.
3.2. Change of NTL Intensity at the Governorate Level
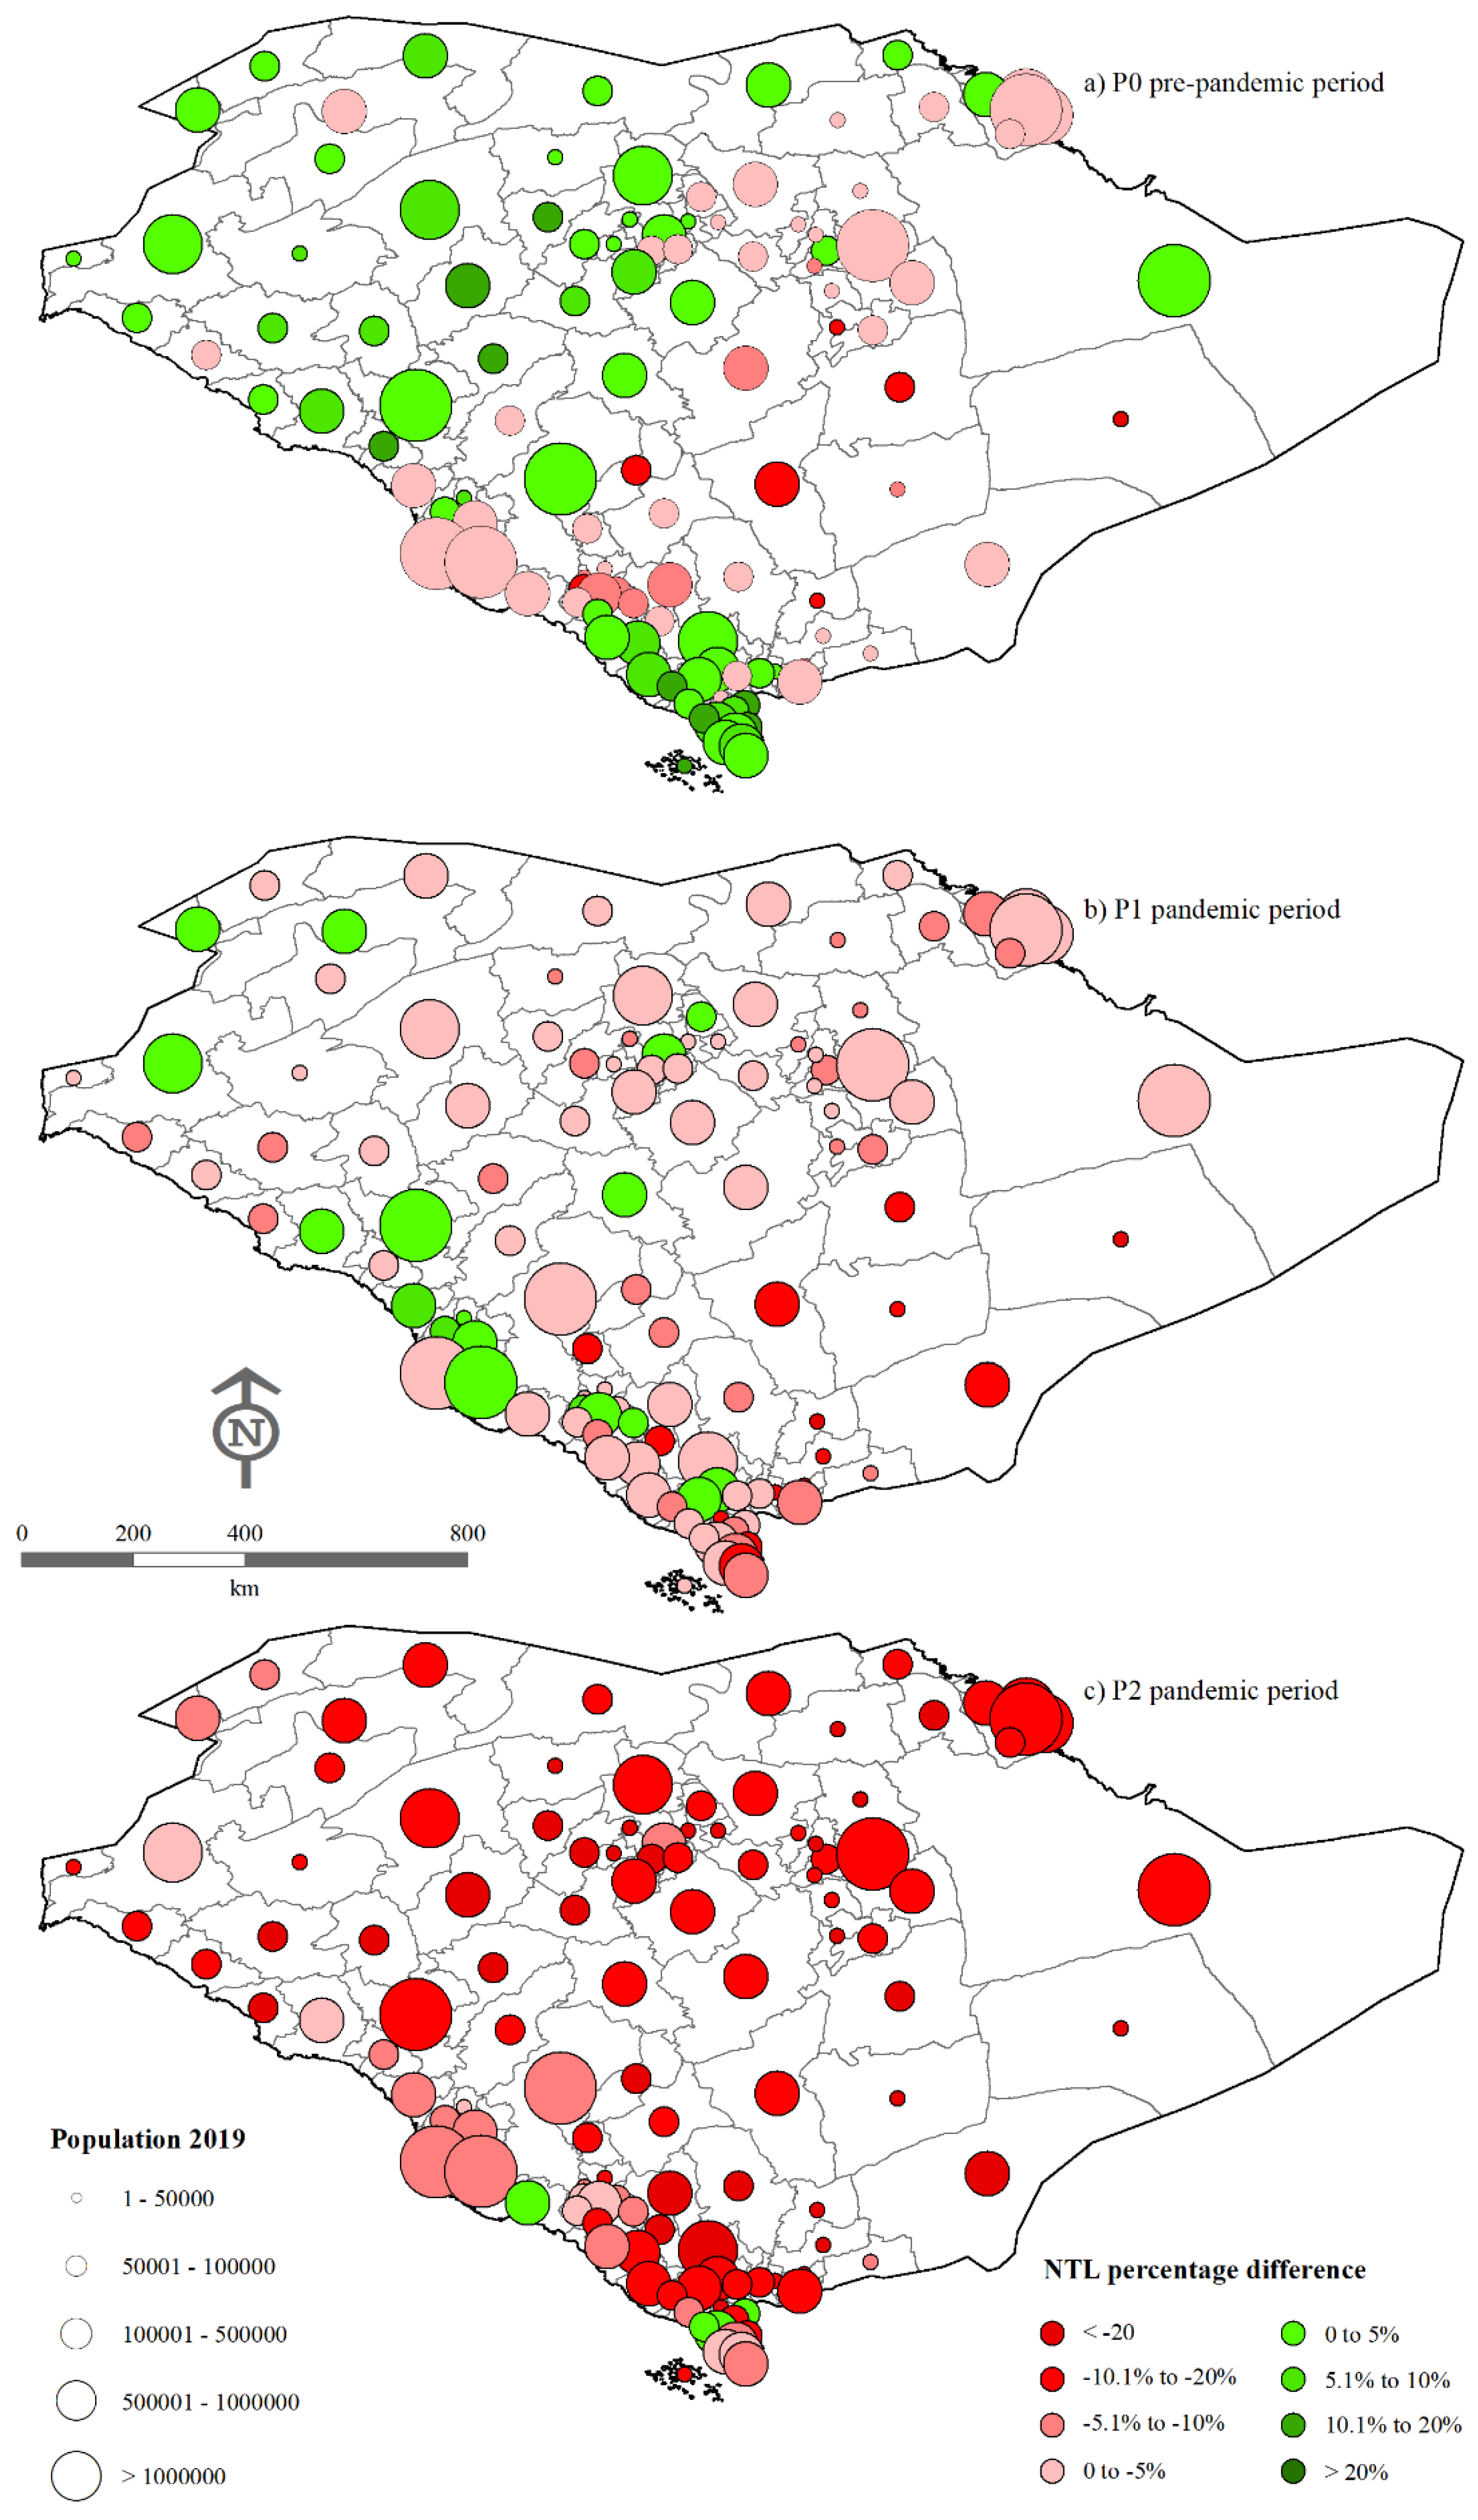
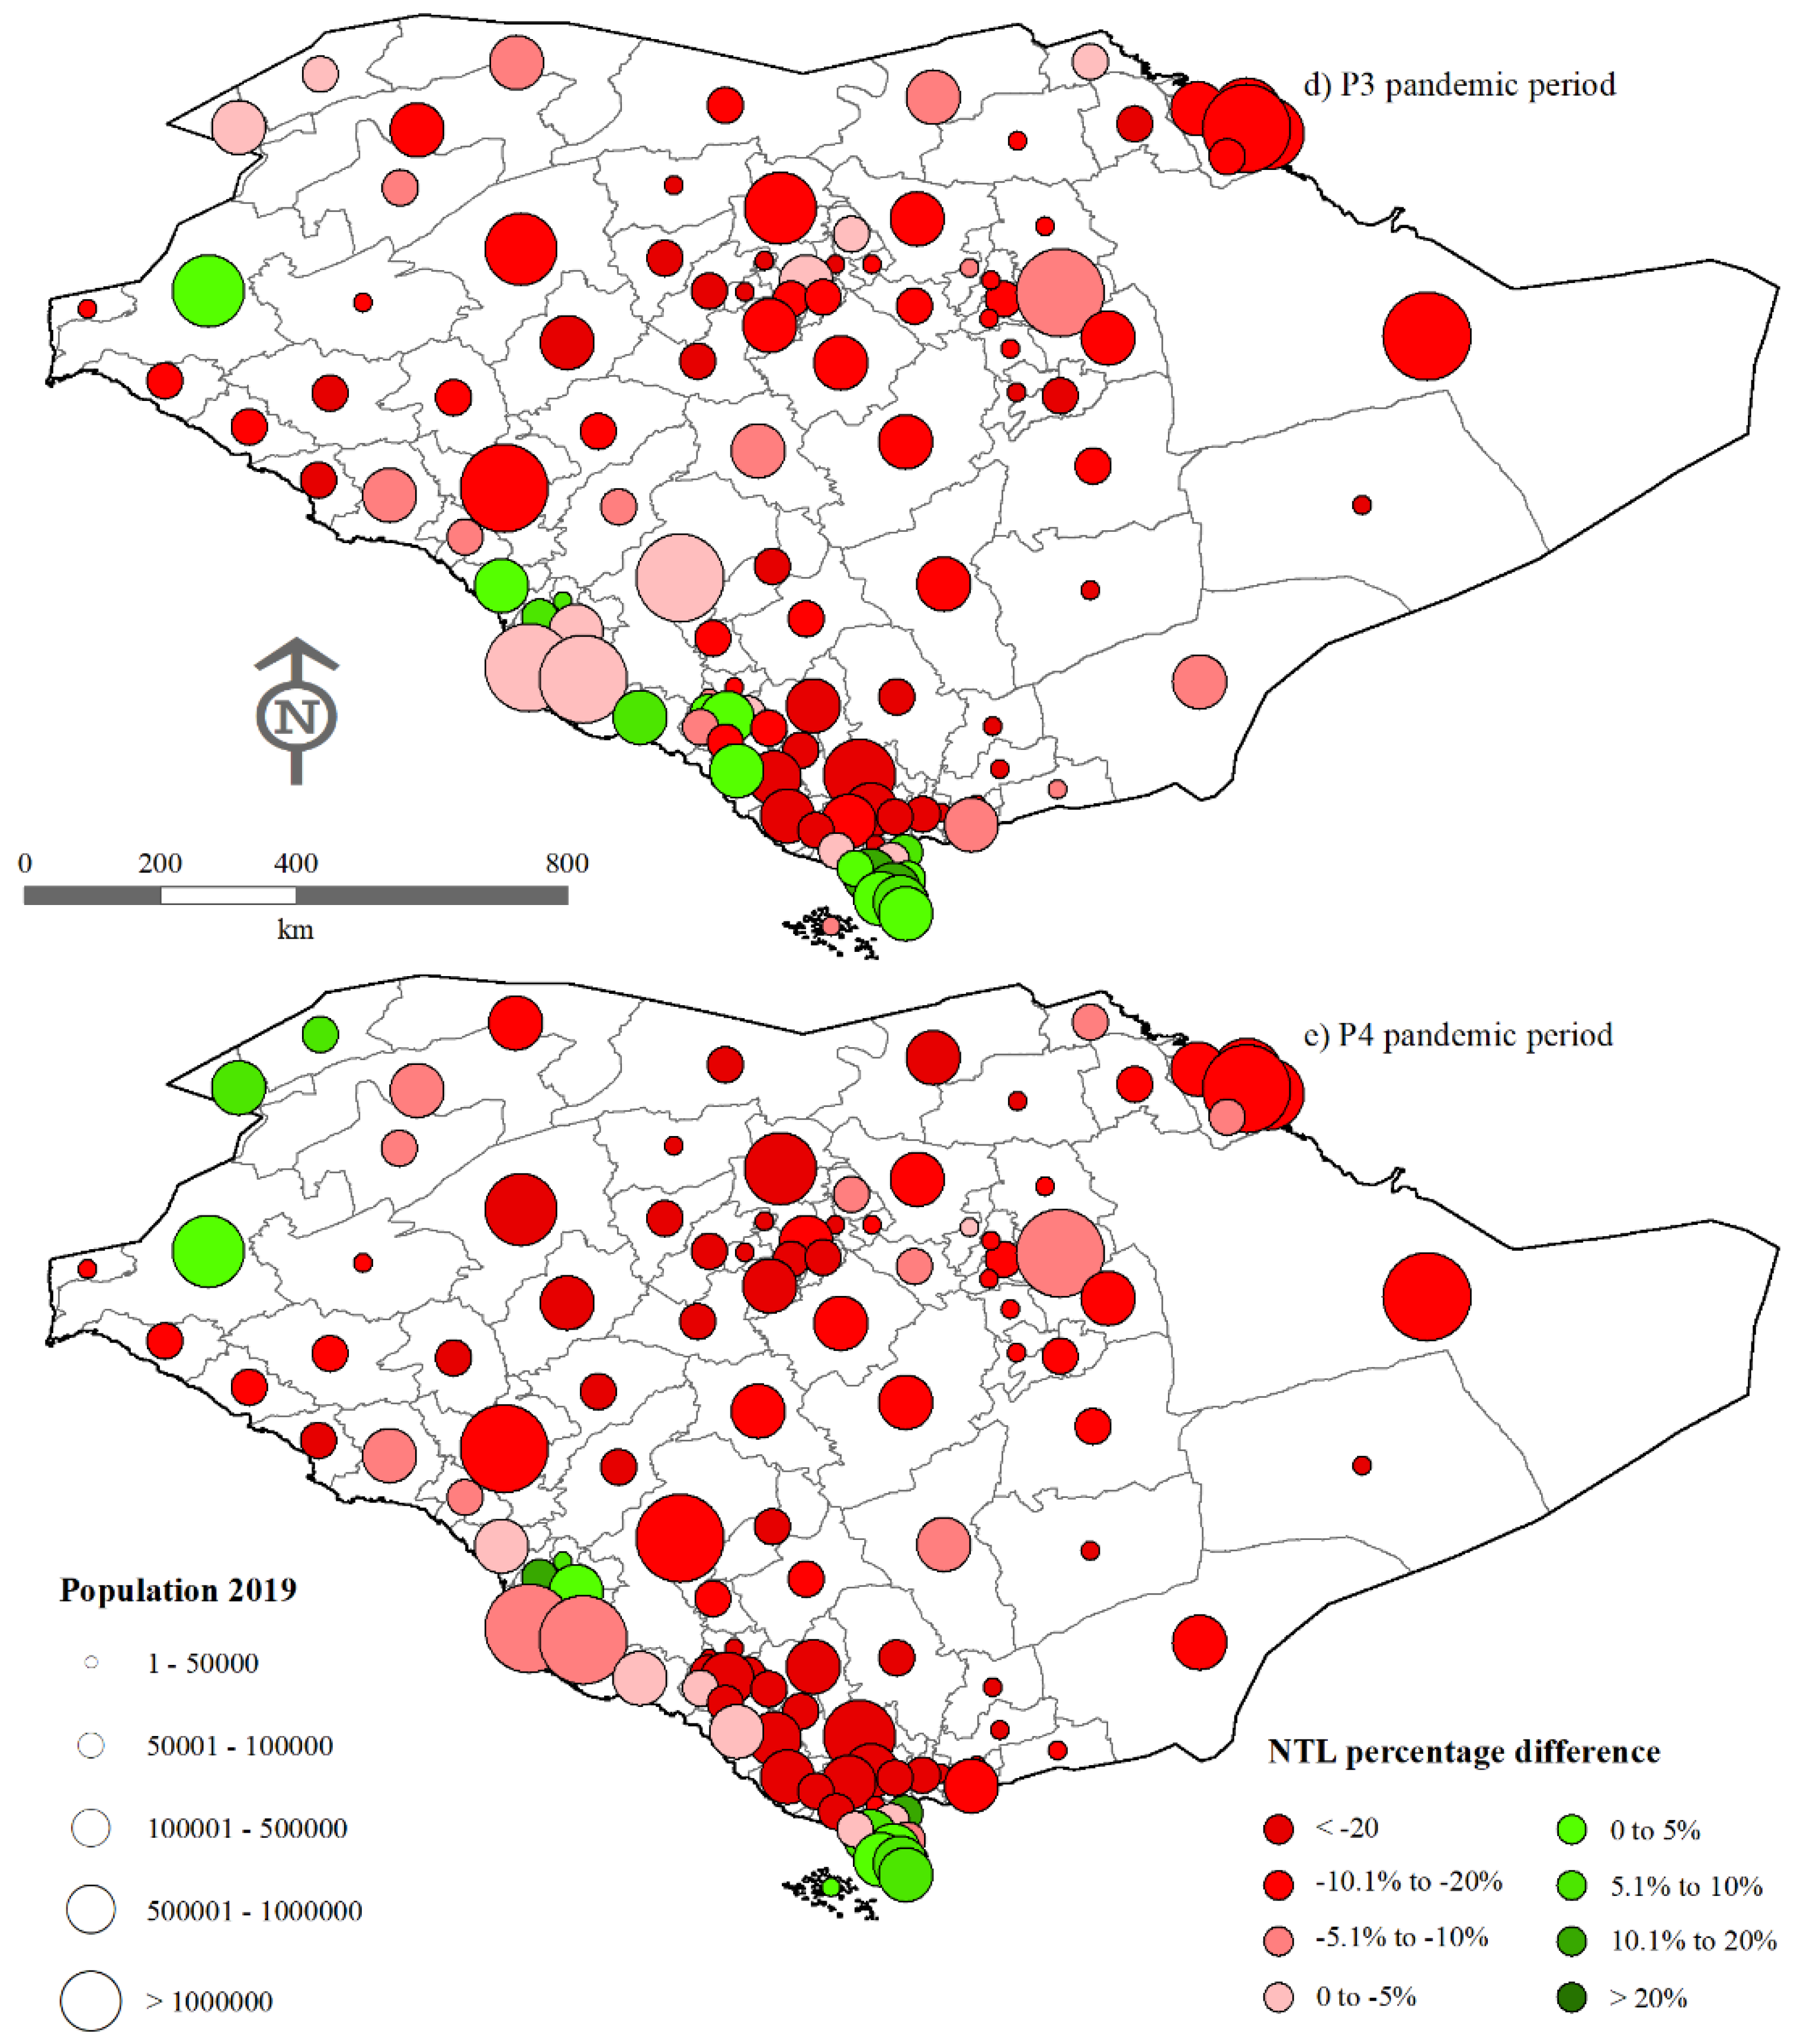
Five maps were produced (Figure 5) to spatially observe the impacts of the COVID-19 measures for reducing NTL intensity with reference to population counts at the governorate level in Saudi Arabia. The percentage differences of NTL brightness between the mean reference and mean target date ranges were classified into nine categories. Increases in the NTL brightness were color-coded by levels of green intensity and decreases by levels of red intensity. The size of the circle symbol is proportional to the population size, grouped into five classes.

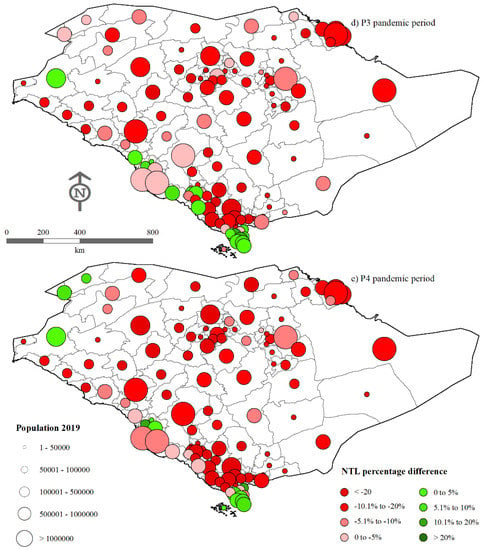
Figure 5.
Percentage difference in NTL brightness for the (a) P0 pre-pandemic, (b) P1 pandemic, (c) P2 pandemic, (d) P3 pandemic and (e) P4 pandemic periods at the governorate level in Saudi Arabia.
In the pre-pandemic map (Figure 5a), a few of the highly populated governorates (Makkah, Jeddah, Riyadh and Dammam) in the eastern, central and western parts of Saudi Arabia are represented by very light-red circles, indicating that there was a slight decrease in NTL values (0 to −5%) between the D0 and D1 date ranges in the pre-pandemic period (P0). On the other hand, green circles are dominant in the other governorates, suggesting an increase in NTL brightness in the same period. In contrast, in the P1 pandemic map (Figure 5b), very light-red and light-red circles are prevalent across Saudi Arabia and cover some of the heavily populated and most of the medium- and low-populated governorates. Interestingly, Makkah and Madinah, religious governorates in the western part of Saudi Arabia, demonstrate a 0 to 5% increase in the NTL level in the P1 pandemic period. In contrast, the P2 pandemic period (Figure 5c) is characterized by significant decreases in the NTL radiance values in the majority of governorates. The P3 and P4 pandemic maps (Figure 5d,e) have similar patterns of NTL percentage differences. Most of the governorates are predominantly red and dark-red, while a few governorates with medium-to-low population sizes in the north, west and south are associated with positive values (green color), suggesting increases of NTL radiance in the P3 and P4 pandemic periods.
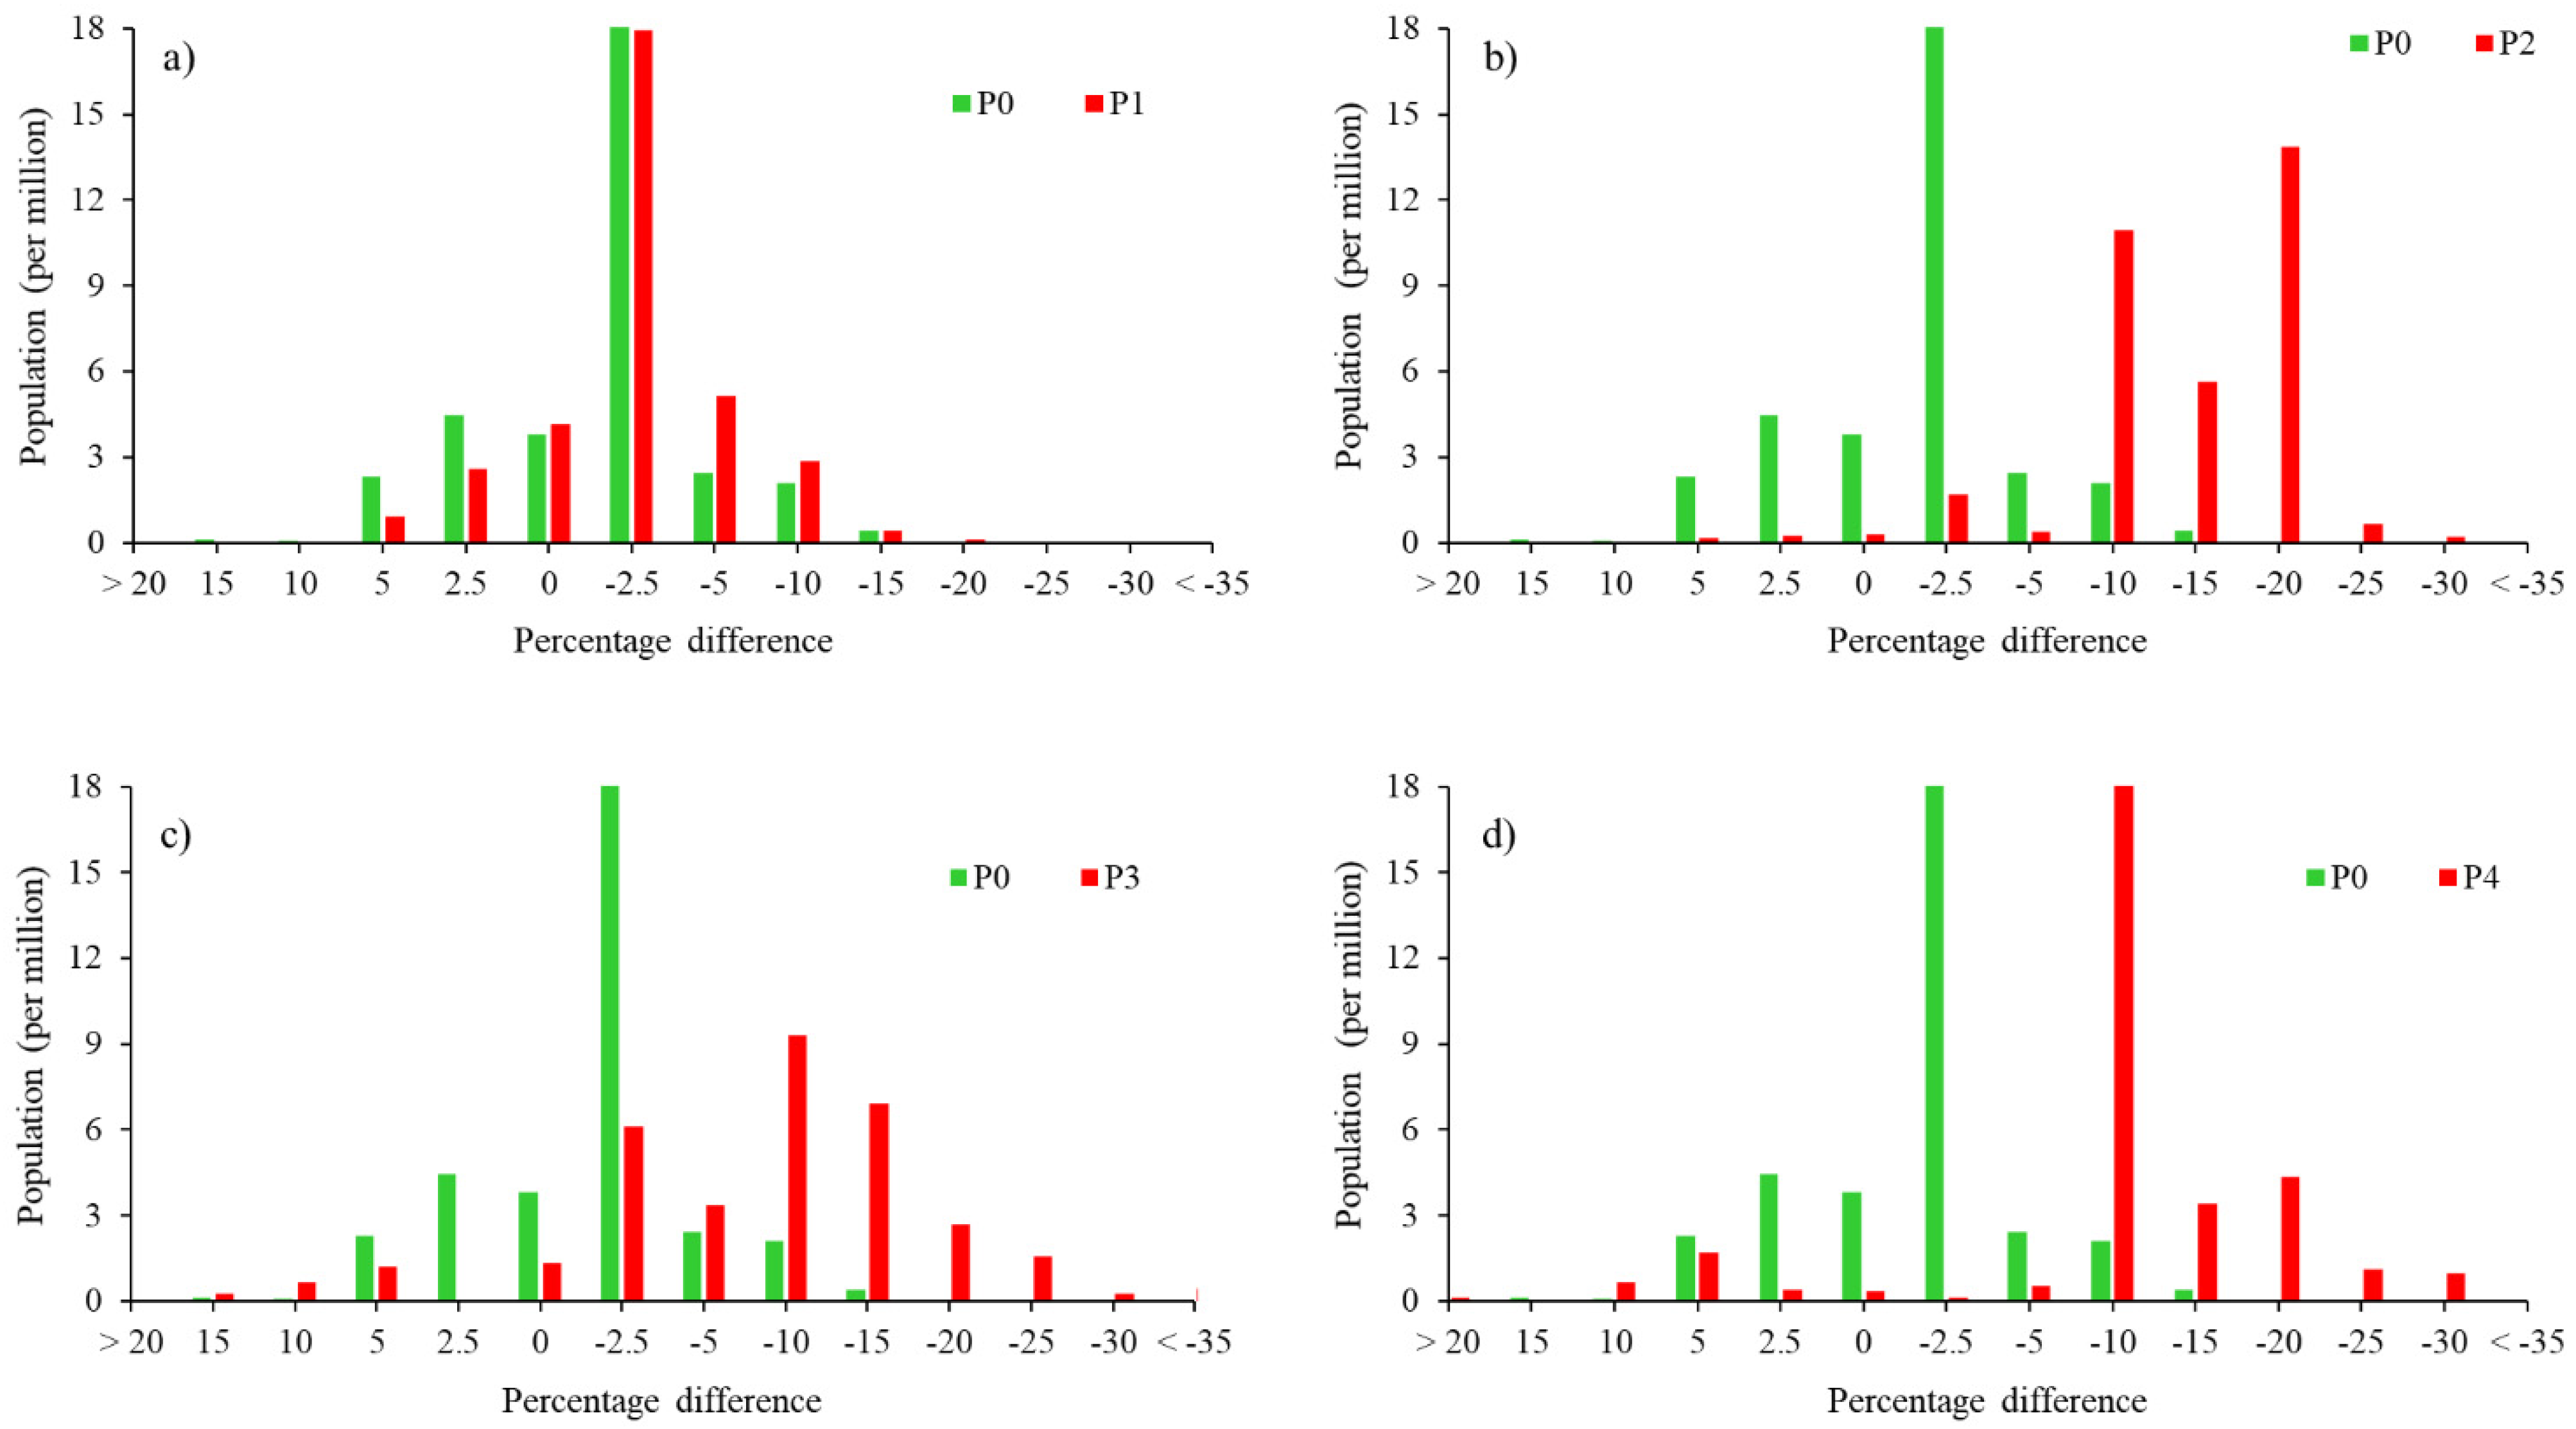
The percentage differences in NTL radiance and population numbers were further analyzed at the governorate level to produce a population-NTL distribution histogram to visualize the size of the population affected by the COVID-19 pandemic. Figure 6 shows the distribution of population size (Y-axis in million) against the NTL percentage differences (X-axis) for the pre-pandemic period (green bars) and the different pandemic periods (red bars). A very distinct point can be observed in the pre-pandemic period (P0), which is that about 46% (15.7 million) of the population resides in governorates with a decrease of between 0 and −2.5% in artificial lights. This point was investigated in more detail and it was found that 92% of the 15.7 million people were living in governorates associated with NTL percentage decreases ranging between 0 and −1.5%. The slight decrease could be due to social activities and festivities that were held in the P0 period.
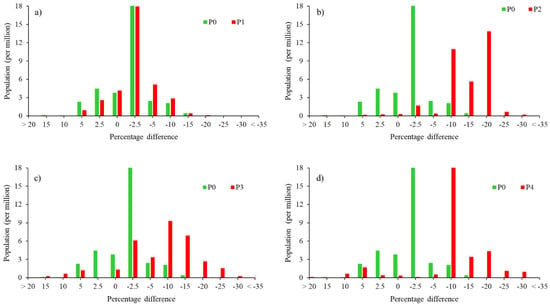
Figure 6.
Population (2019) histograms of the (a) first, (b) second, (c) third and (d) fourth pandemic periods in 2020 (red bars) versus the pre-pandemic period in 2019 (green bars).
In the P1 pandemic period (Figure 6a), it can be observed that 10.4 million inhabitants lived in governorates with a reduction in lights of between −5% and −35% compared with 4.7 million inhabitants in the pre-pandemic period. A clear shift of population size can be noted in the P2 (Figure 6b), P3 (Figure 6c) and P4 (Figure 6d) pandemic periods in comparison with the pre-pandemic period (P0). For example, in the pre-pandemic period, the majority (86%) of people lived in lit governorates (≥−2.5%) compared with 93%, 65% and 90% of inhabitants living in dimmed governorates (≤−10%) in the P2, P3 and P4 pandemic periods, respectively.
3.3. Changes in NTL Intensity at the City Level
Following recommendations presented by the Ministry of Health, the Saudi government announced more preventive measures on 26 March 2020 (02.08.1441) to limit the spread of COVID-19, particularly for the cities of Makkah, Madinah and Riyadh. For example, people were not allowed to enter or leave these cities, and curfew hours were extended to start from 15:00 (instead of 19:00) until 6:00.
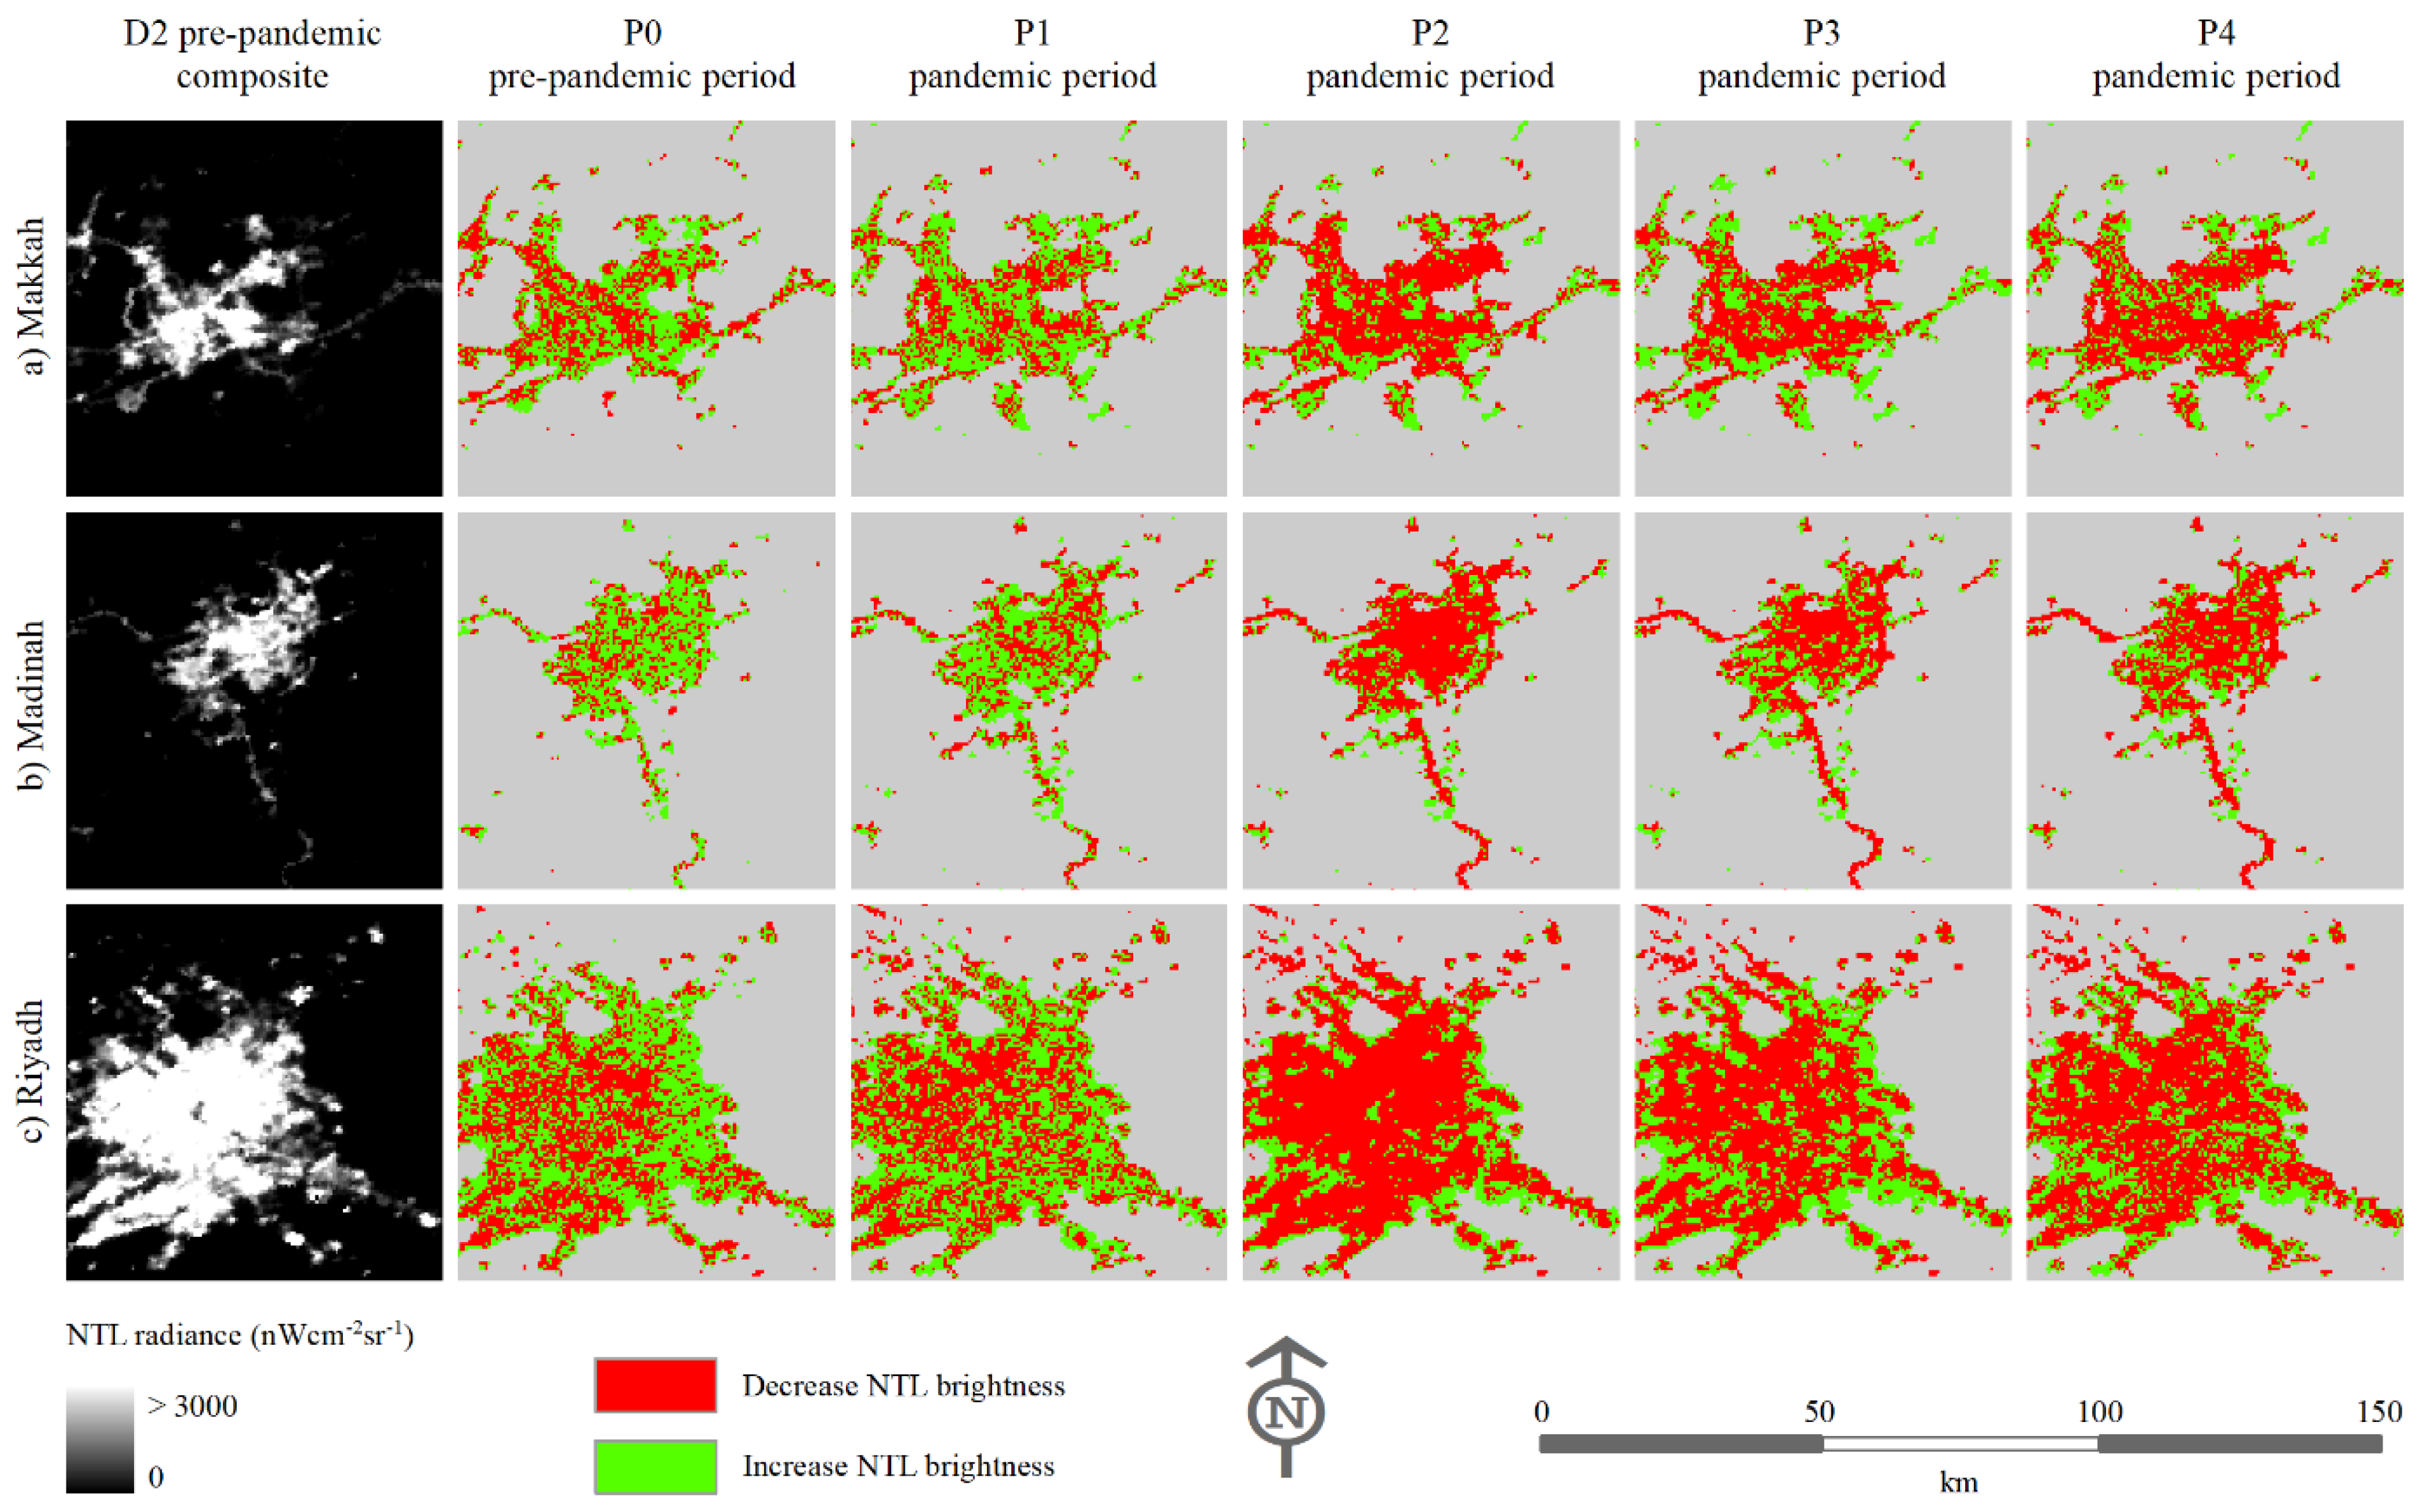
NTL brightness within the urban area of these three cities was further examined to measure the impact of the lockdown caused by the COVID-19 crisis. Figure 7 shows the NTL changes in these cities during the different pandemic periods. The green and red colors indicate increases and decreases in the NTL brightness, respectively. The NTL composite image of D2 is added in Figure 7 to visually display the NTL data in 2020 prior to the COVID-19 pandemic. Generally, it can be noted that the lockdown measure had more spatial impacts in Makkah, Madinah and Riyadh in the P2 pandemic period compared with the P3 and P4 pandemic periods. Moreover, the pre-pandemic (P0) and pandemic (P1) periods showed similar spatial patterns of dimming and brightening of NTL pixels.

Figure 7.
Light difference of (a) Makkah, (b) Madinah and (c) Riyadh prior to and during COVID-19 crisis.
Lit (green color) pixels spread in the P1 pandemic period and then dimmed in the P2, P3 and P4 pandemic periods. Moreover, an interesting phenomenon was that some peripheral areas of the three cities where NTL brightness declined (red color) in the P2 pandemic period, become more luminous in the P3 (Ramadan) and P4 (Eid Alfiter days) pandemic periods.
Table 3 shows the percentage differences of NTL brightness at the city level prior to and during the COVID-19 crisis. A substantial reduction in NTL brightness can be observed in Madinah (Figure 7b), especially in the P2 and P4 pandemic periods, which is compatible with the results in Table 3, where the lights increased by 4.4% in the pre-pandemic period (P0) and dramatically decreased by −16% and −14% in the P2 and P4 pandemic periods, respectively. Moreover, Madinah and Riyadh witnessed greater declines in brightness during the P3 (−12% and −8%, respectively) pandemic period than Makkah (−5%). The results of the P2 pandemic period in Table 3 confirm that this period was the most affected by the COVID-19 crisis, as is also shown in Figure 7.
Table 3.
NTL percentage differences for the pre-pandemic and pandemic periods in Makkah, Madinah and Riyadh.
3.4. Change of NTL Intensity at the Site Level (Important Mosques)
There are four mosques that Muslims believe Allah honored and distinguished from other mosques: (1) the Holy Mosque, (2) the Prophet’s Mosque, (3) Al-Aqsa Mosque and (4) Quba Mosque [43]. Three are located in Saudi Arabia (Figure 1), with the exception of Al-Aqsa Mosque, which is located in Palestine. These mosques represent exceptionally important foci for human movement, and were impacted dramatically during the different periods of the pandemic measures. They are also indicative of the way in which the pandemic may have impacted sites of global and national cultural importance in other countries. It is, therefore, interesting to understand how these changes were reflected in differences in NTL.
- The Holy Mosque is located in the center of Makkah and is the largest mosque in the world. The Kaaba is located inside the Holy Mosque and it is the greatest and holiest house on Earth for Muslims. This is the location that all Muslims must face in their prayers. The mosque is able to accommodate two million worshippers as well as 100,000 persons circumambulating around the Kaaba per hour [55]. A prayer in the Holy Mosque is considered equivalent to 100,000 prayers in comparison with any other mosque [43], presenting a massive motivation to Muslims to travel to Makkah.
- The Prophet’s Mosque is located in the center of Madinah city and has a capacity of one million worshippers. A prayer in the Prophet’s Mosque is considered equivalent to 1000 prayers compared with any other mosque [43]. The mosque contains the Holy Rawdah (a garden), a small area located between the Prophet pulpit and Aisha’s room, with a total area of 400 m2. Most Muslims prefer to pray and stay in this area.
- Quba Mosque is the first mosque built in Islam, located in the south of Madinah and built by the Prophet Mohammed. It has a capacity of 20,000 worshippers. The reward for praying in this mosque is considered similar to the reward of Umrah based on specific conditions [43].
The Saudi government has supported the efforts of countries and international organizations, especially the WHO, to control and eliminate the spread of the COVID-19 pandemic, by implementing unprecedented preventative measures such as temporarily suspending Umrah and closing mosques, especially the holy mosques in Makkah and Madinah.
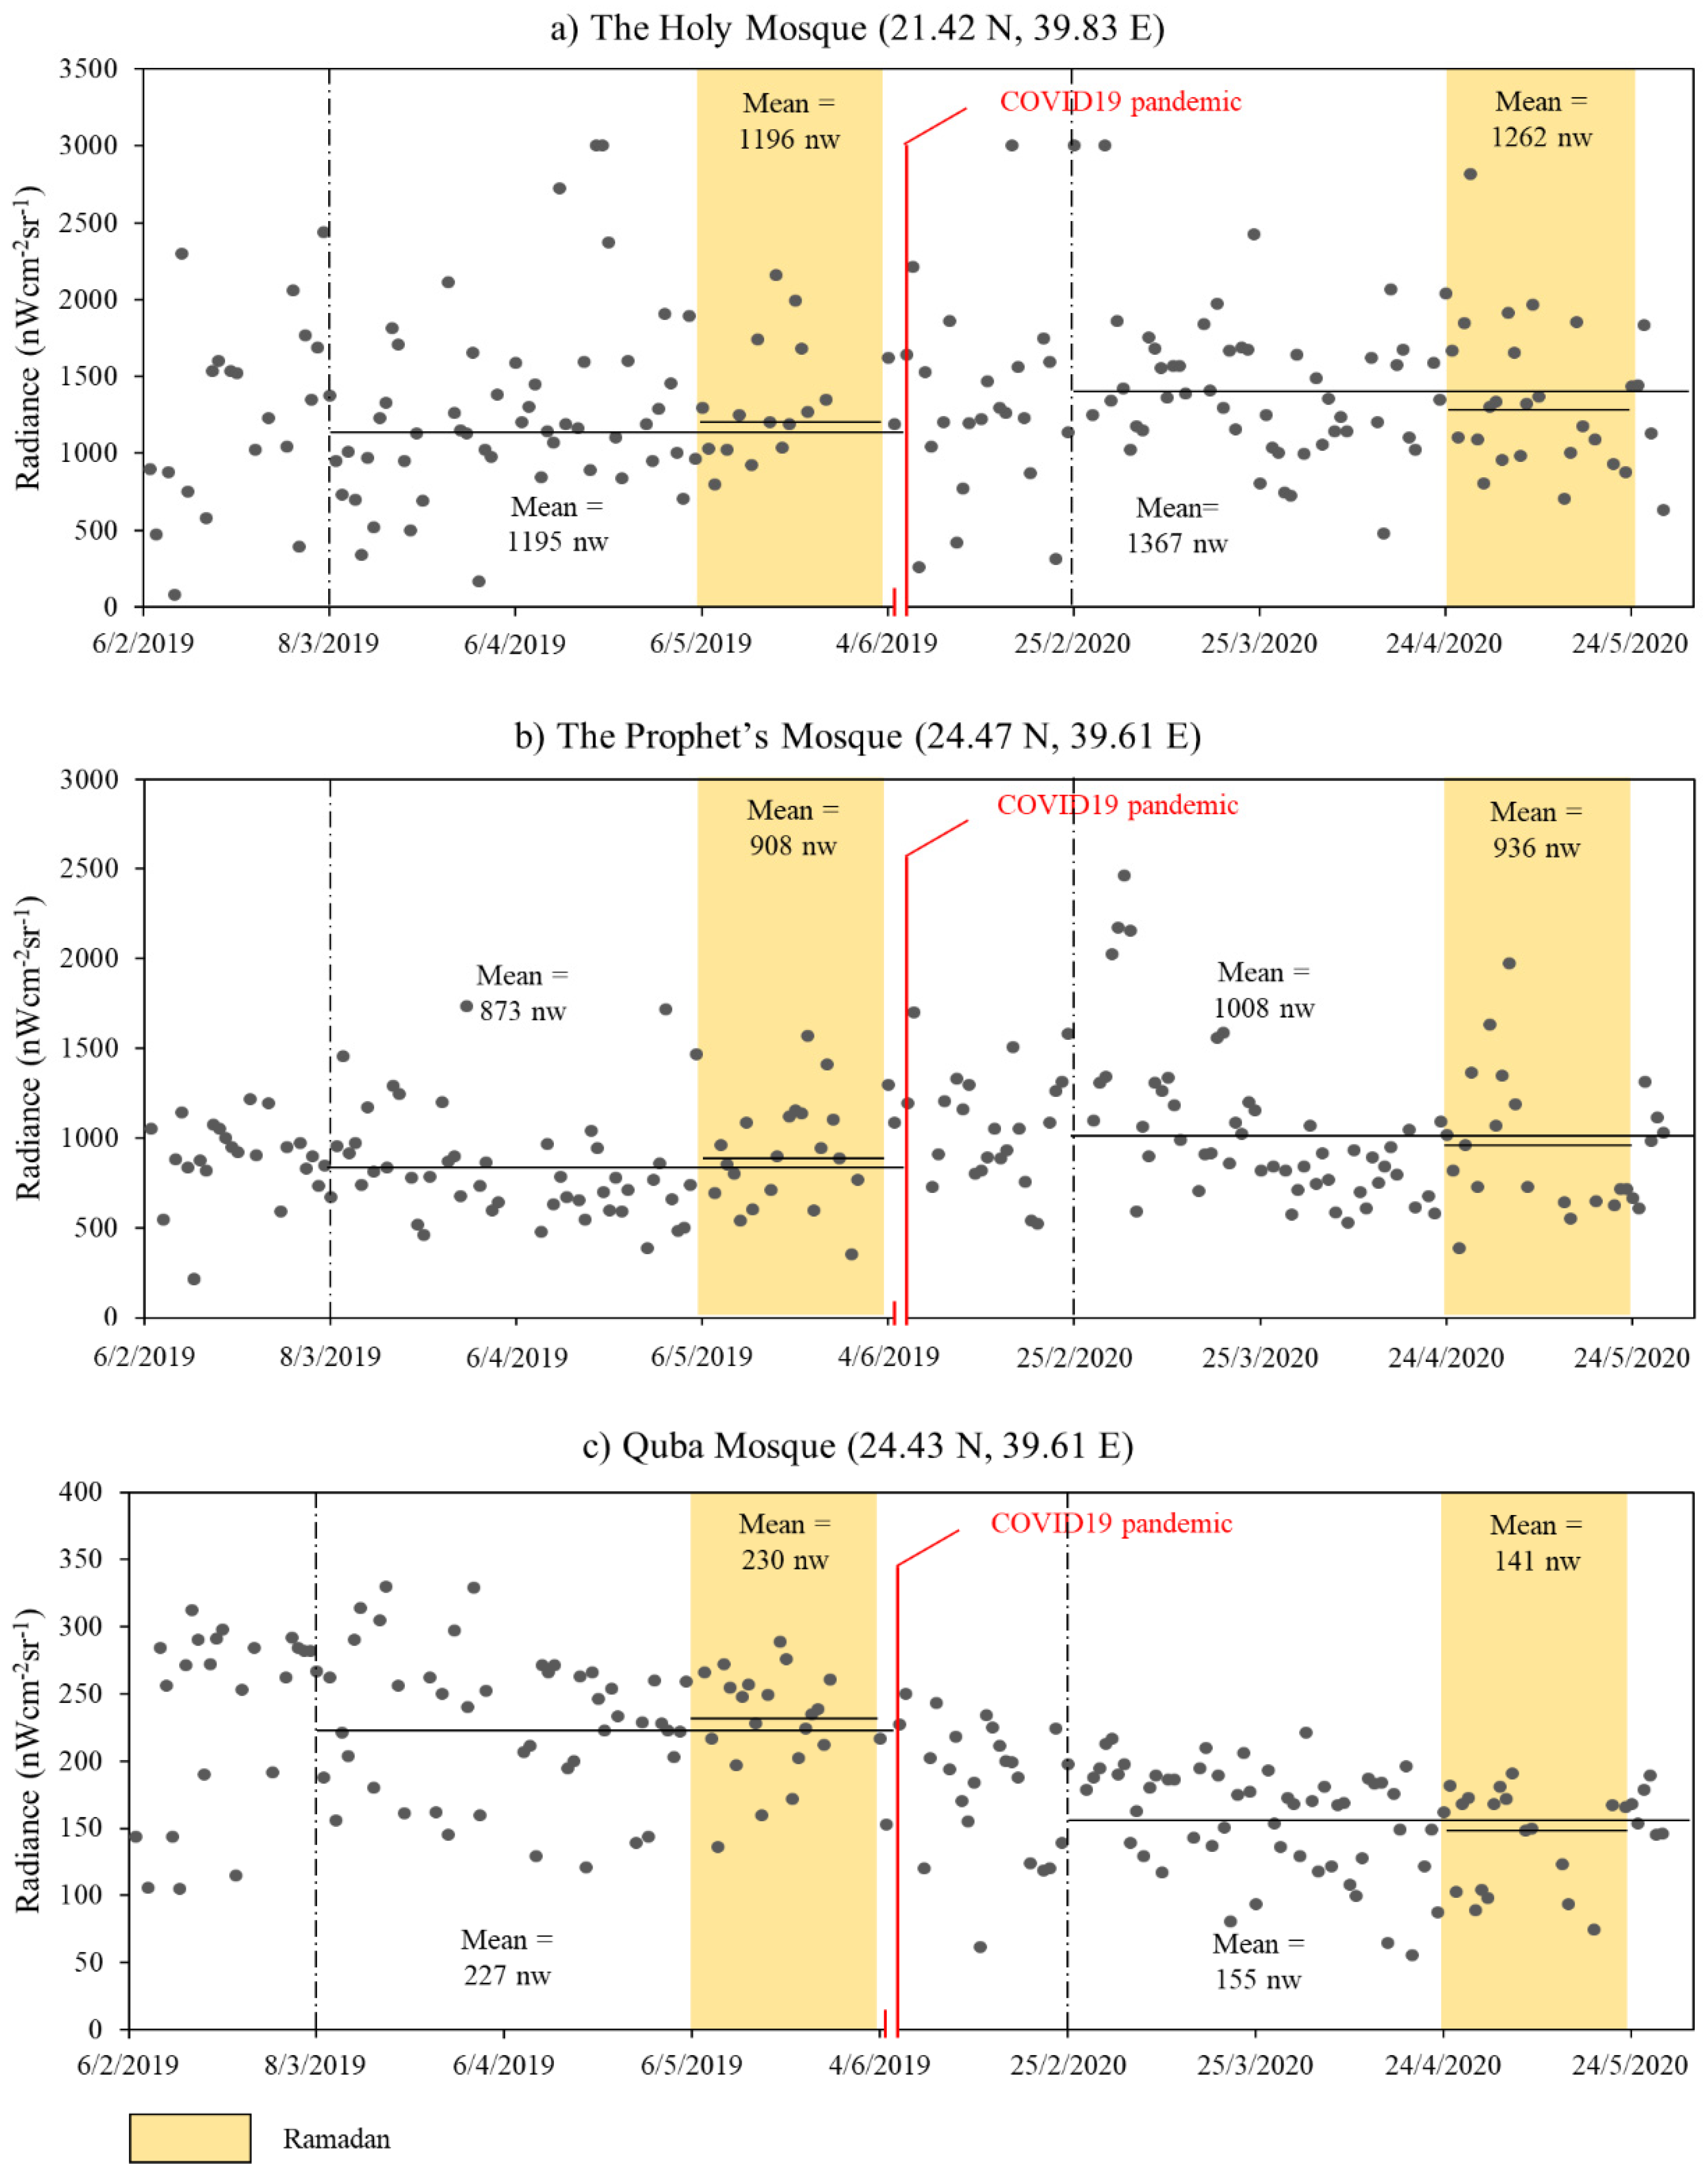
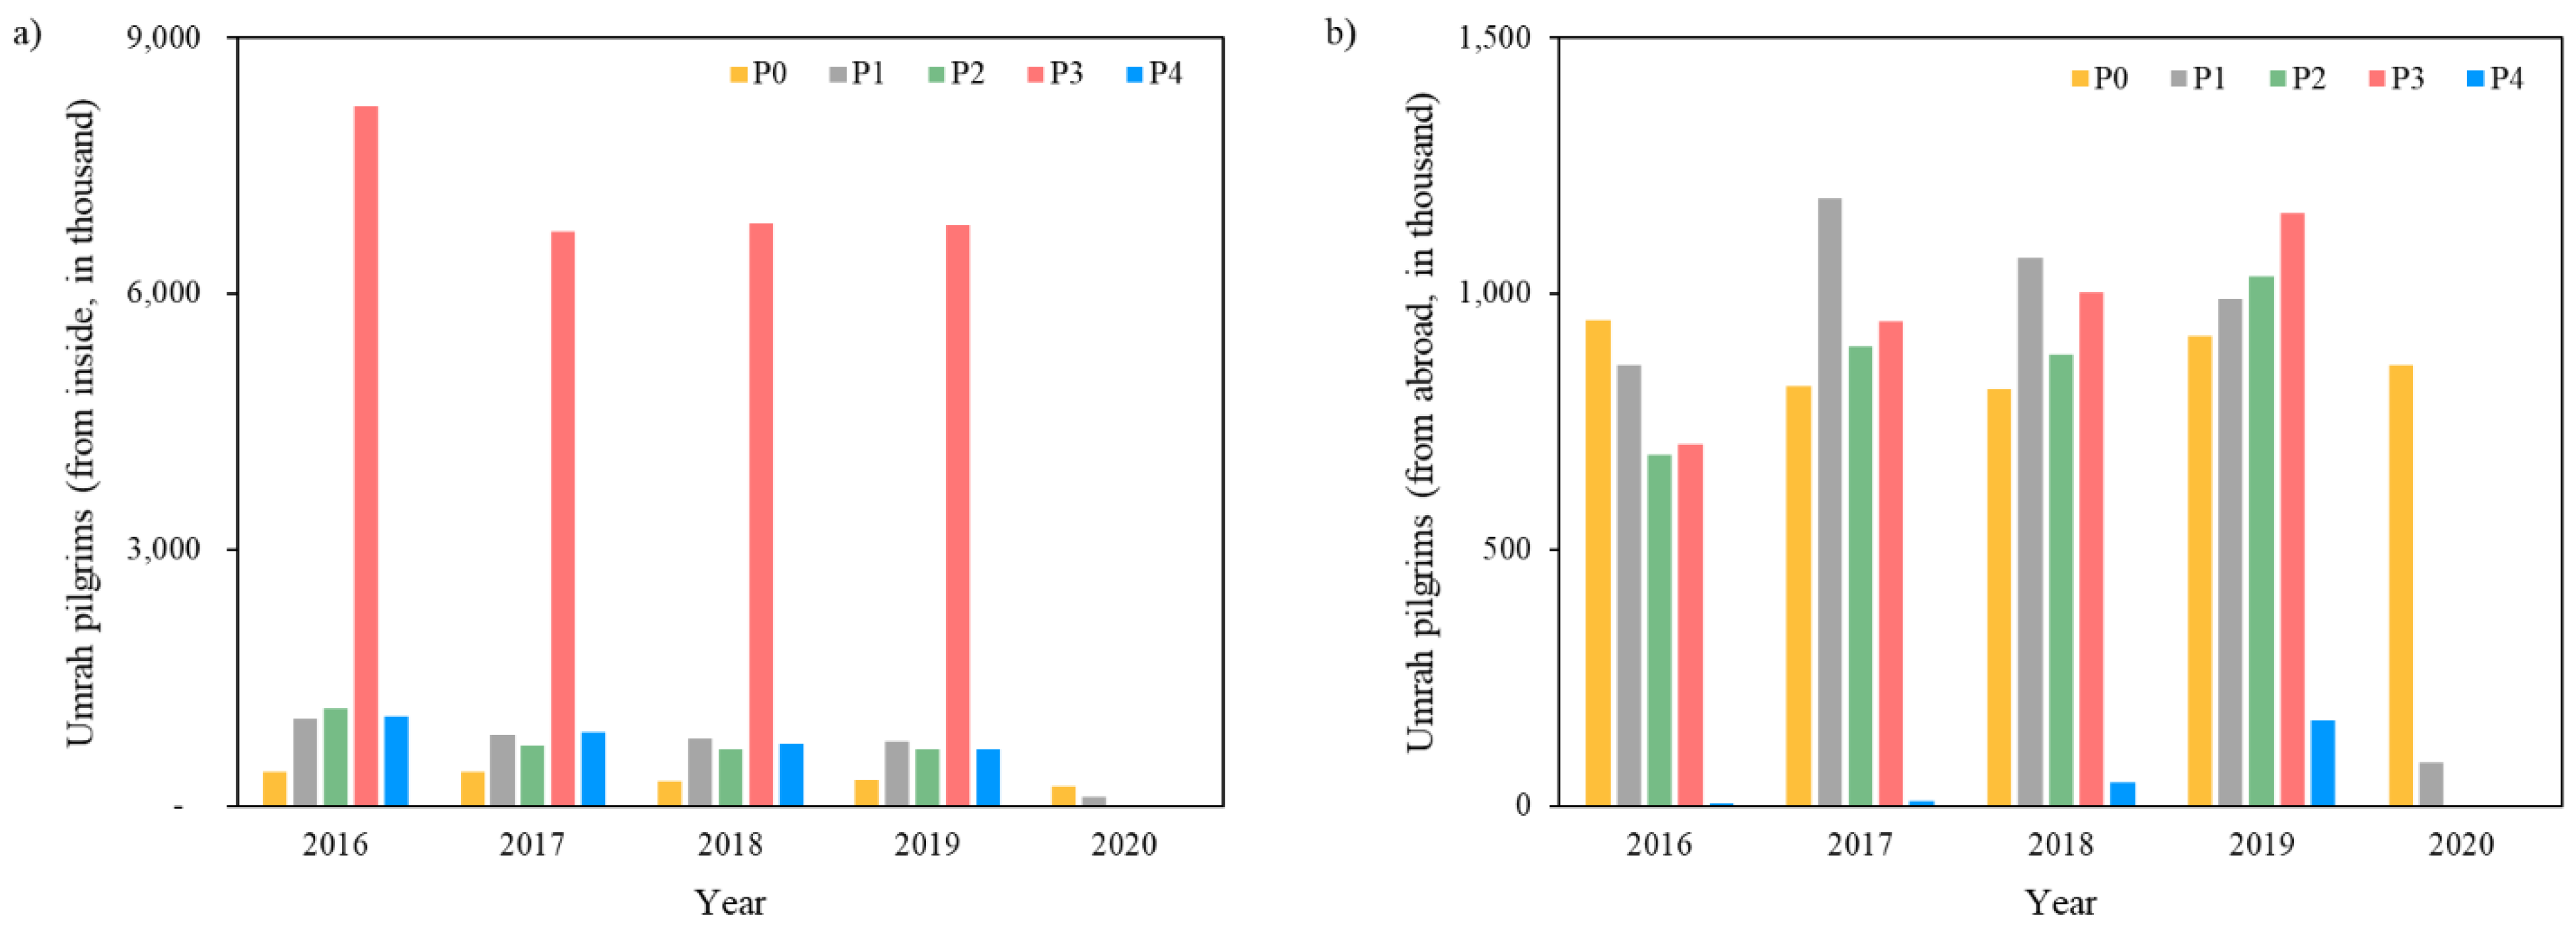
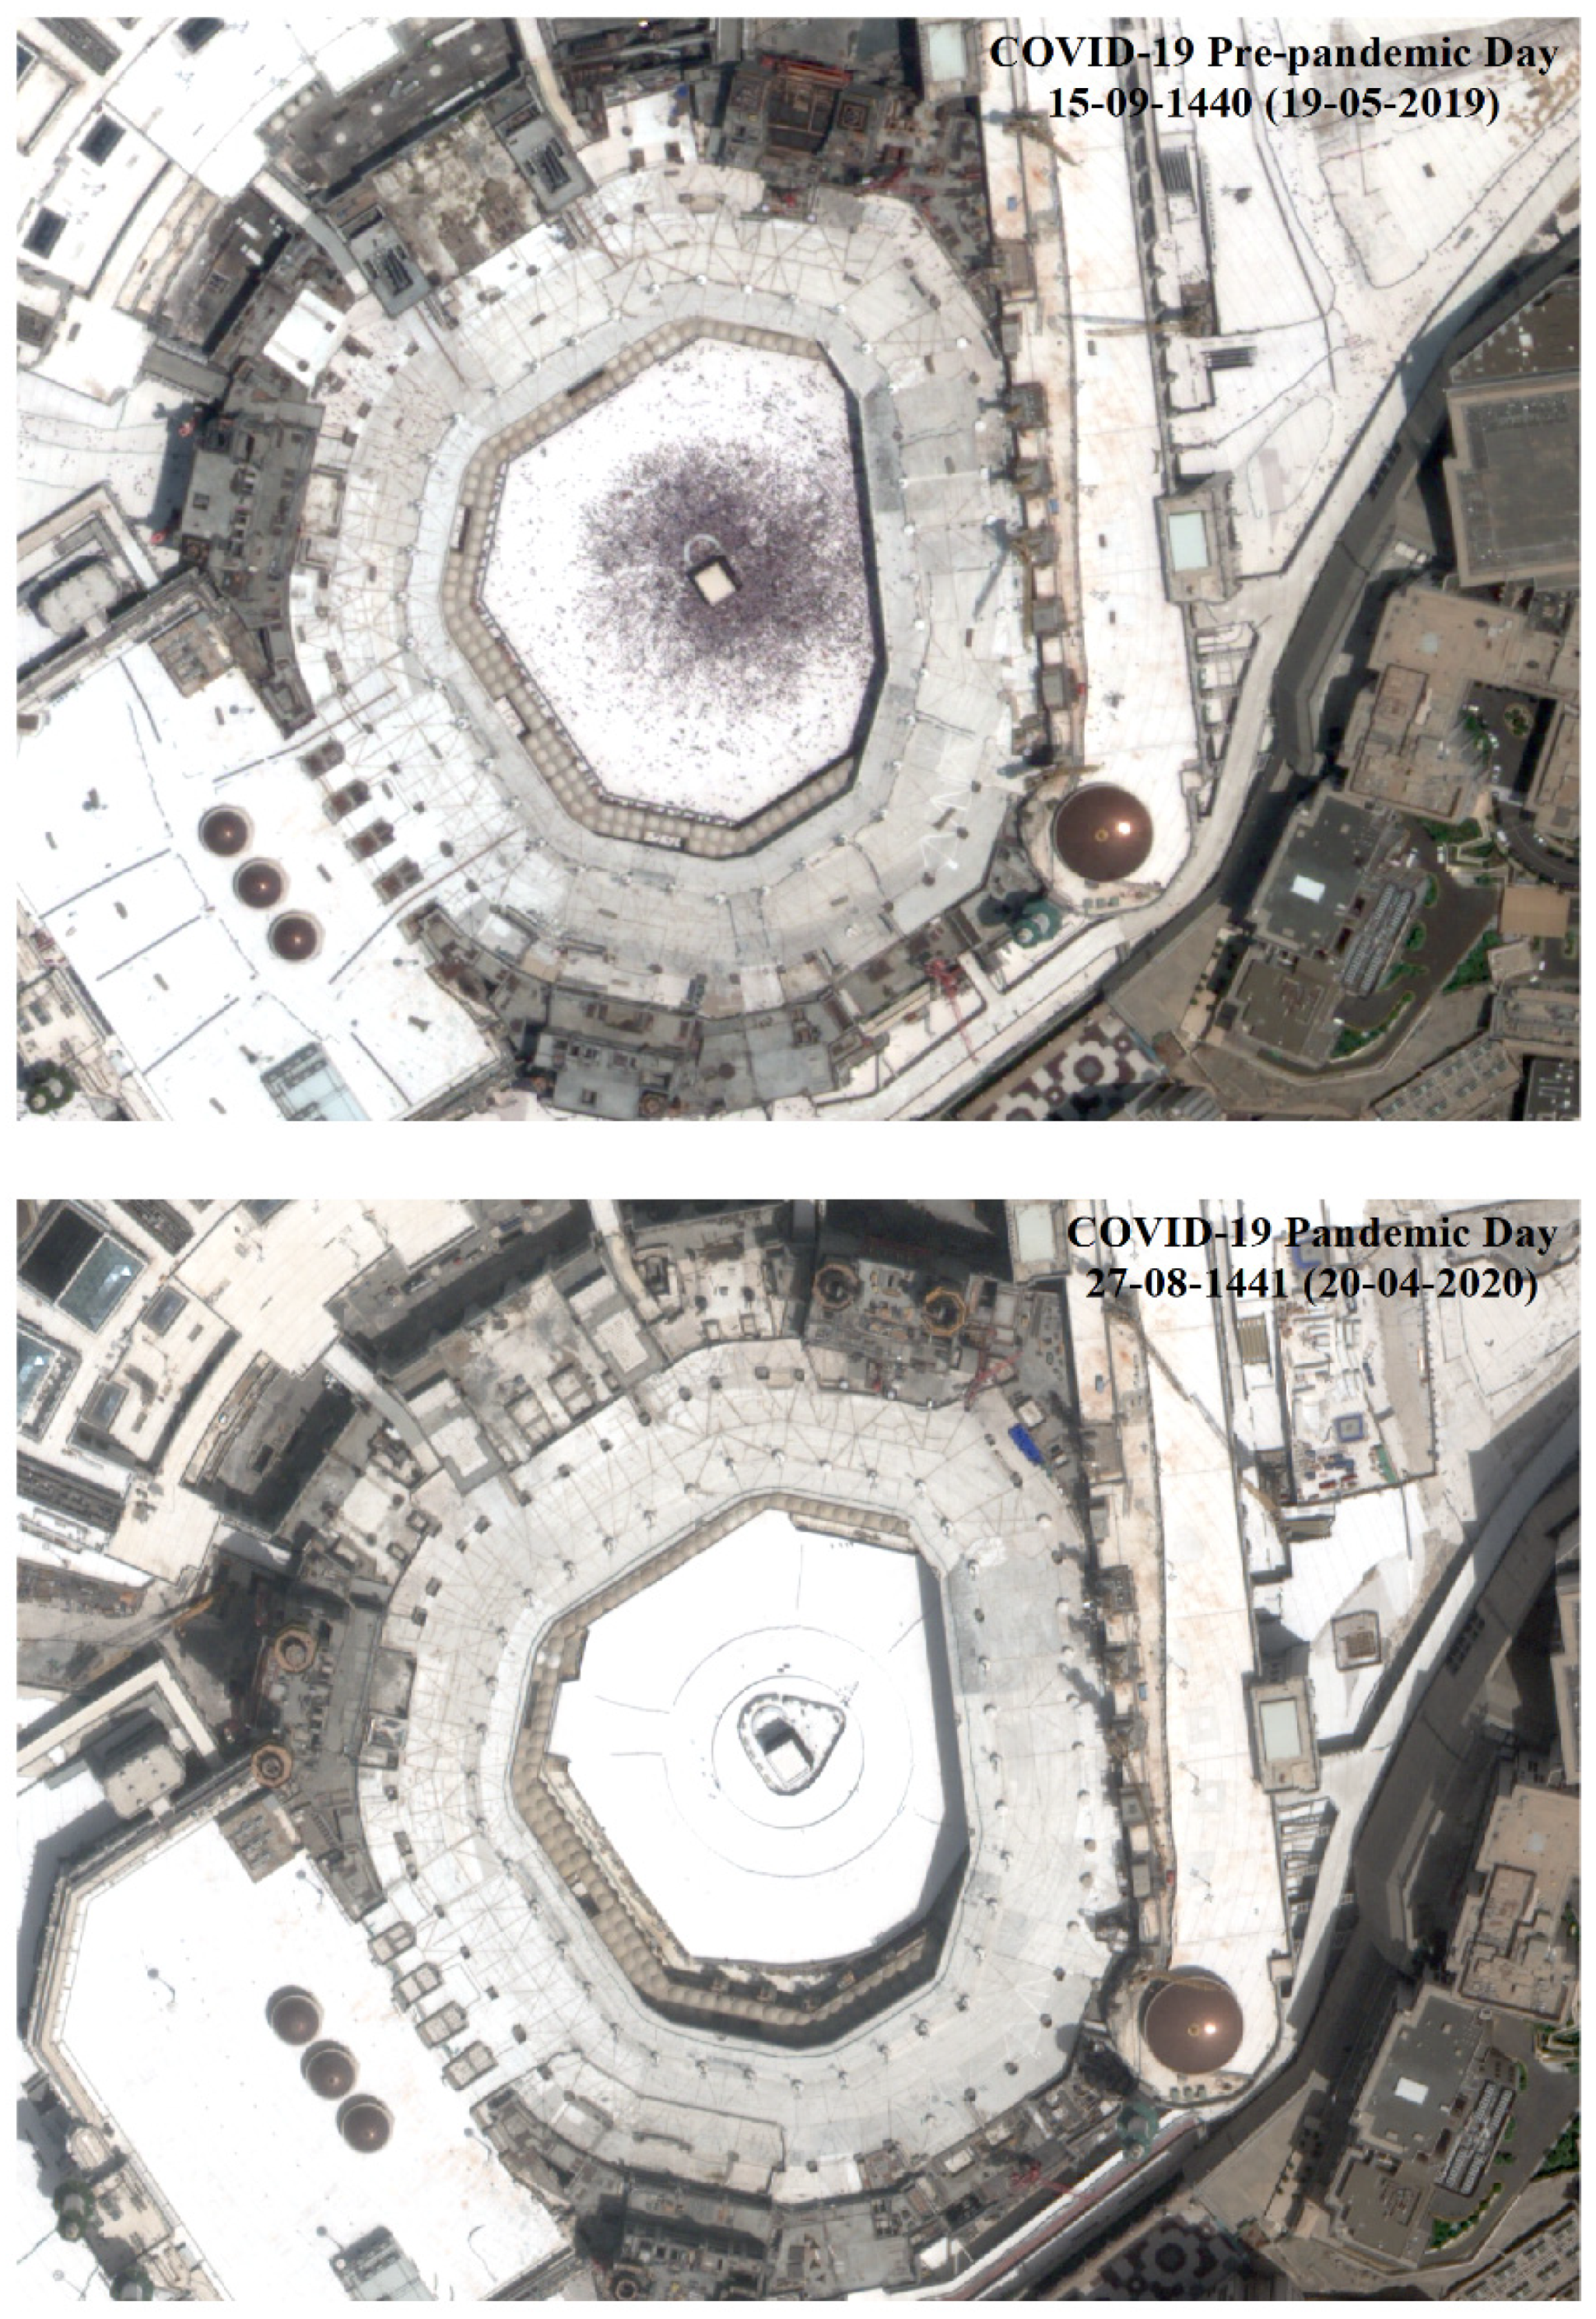
Figure 8 shows the NTL temporal profiles during the pre-pandemic and pandemic periods for the three holy mosques in Saudi Arabia. The daily NTL images were overlaid with Landsat data, (acquired in 2020) and then by visual observation, those NTL pixels with areas more than 40% covered by mosque sites were selected as target pixels. The Holy Mosque, Prophet’s Mosque and Quba Mosque were covered by two, one and one NTL pixels, respectively, and in the case of two pixels, the mean was computed. It can be seen that the NTL radiance of the Holy Mosque (Figure 8a) ranged from 160 to 2700 nWcm−2sr−1 prior to the COVID-19 crisis, compared with 250 to 3000 nWcm−2sr−1 during the COVID-19 crisis. In general, the mean radiances of the NTL data in the pandemic date ranges (D3, D4 and D5) were larger than the pre-pandemic equivalent dates. For example, the mean NTL radiance of Ramadan prior to the COVID-19 crisis was 1196 nWcm−2sr−1 and this increased slightly to 1262 nWcm−2sr−1 during the crisis, indicating that there was no negative effect in terms of the NTL brightness. However, there was a massive impact on worshipers and Umrah pilgrims of the closure of the Holy Mosque as well as the suspension of Umrah. This is confirmed by Figure 9a,b, where the numbers of Umrah pilgrims in 2020 (pandemic year) declined by 100% in Ramadan for both domestic and foreign pilgrims compared with 2019, with 6.7 and 1.1 million domestic and foreign pilgrims, respectively. Figure 10 shows two WorldView-3 satellite sensor images, with a spatial resolution of 31 cm, of the Holy Mosque prior to and during the COVID-19 crisis. This was the first time for 41 years, since the 1979 incident when more than 200 armed men seized the Holy Mosque and it was closed for 14 days, that the Holy Mosque and courtyard of Kaaba were completely devoid of worshipers and pilgrims.
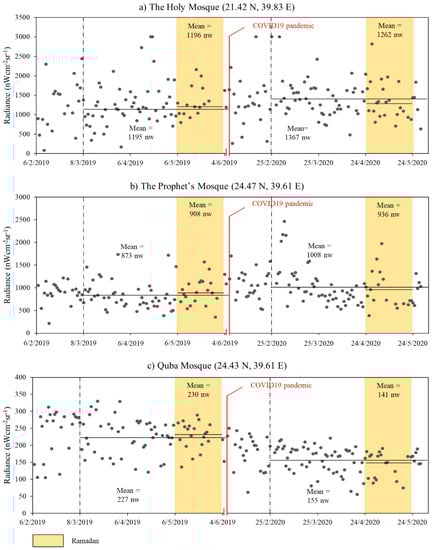
Figure 8.
Temporal profiles of NTL radiance at (a) the Holy Mosque, (b) the Prophet’s Mosque and (c) Quba Mosque.
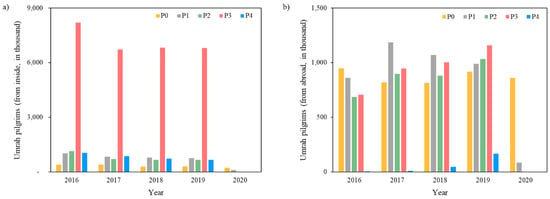
Figure 9.
Number of Umrah pilgrims from (a) inside Saudi Arabia and (b) outside of Saudi Arabia for the different periods (Source: GAS (2021b).
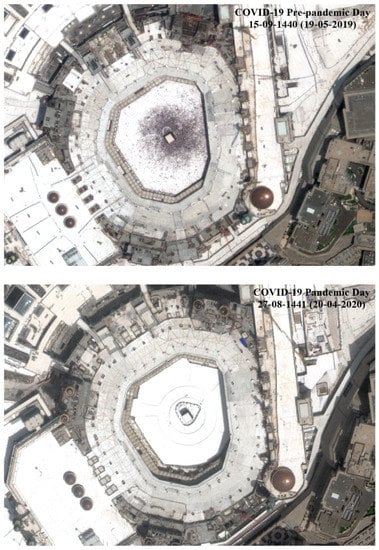
Figure 10.
WorldView-3 satellite sensor images of the Holy Mosque prior to (top) and during (bottom) the COVID-19 crisis.
It is clear that the pattern of the Holy Mosque is similar to that of The Prophet’s Mosque (Figure 8b). Again, the NTL brightness does not appear to be affected by the COVID-19 crisis. However, the number of visitors and worshipers at The Prophet’s Mosque reduced to zero following the announcement of the closure of the holy mosques. On the other hand, the pattern is completely different in Quba Mosque (Figure 8c), where the mean NTL radiance decreased by 32% during the pandemic date ranges in comparison with the same pre-pandemic dates. Similarly, Ramadan brought a decline of 39% in the NTL brightness during the COVID-19 pandemic in relation to the same month before the crisis.
4. Discussion
NTL products have been widely used as an effective and representative input for environmental and socioeconomic impact assessment [25,30,31]. The COVID-19 pandemic affected most aspects of life across the world [4,5,28]. Unfortunately, the COVID-19 pandemic coincided with Ramadan, resulting in a substantial impact on religious rituals in Muslim countries. This research is the first to utilize NTL brightness data to evaluate the impact of the COVID-19 crisis on the Islamic community in normal and religious periods. A detailed analysis was conducted in Saudi Arabia, at spatial scales from the national to the site-specific.
The analysis was based on computing the percentage difference of multiple NTL composite images prior to and during the COVID-19 pandemic. NTL data are influenced by climatic factors [51]. Therefore, to ensure data consistency and reliability, all NTL pixels, coded as high-quality values for more than 25% of the total target period, were averaged. In addition, different masks were applied to remove the uninhabitable NTL pixels. Overall, the percentage difference in NTL brightness for Saudi Arabia for the different pandemic periods at the different administrative levels, as well as for selected cities, decreased by varying levels. The declines in NTL intensity at the national level in the P2 (−14%) and P3 (−12%) pandemic periods were in agreement with the observed socioeconomic indicators. For example, the second quarter (Q2) in Table 2, equivalent to the P2 and P3 pandemic periods, produced the smallest values for oil exports, non-oil exports and GDP, and the largest unemployment rate due to the consequences of COVID-19, represented by the cessation of various means of transportation and the closure of workplaces. Yet, equivalent economic data are not available at the subnational level for direct comparison with the spatial distribution of the decreases in NTL.
It is obvious that the preventive measures (Table 1) taken in the P1 period of the COVID-19 pandemic had limited impact on human activities at all administrative levels as well as for the selected cities. For example, the percentage difference in NTL brightness at the national level was a −2.6% decrease, and at the province level, ranged between −9% to 0.6%. This implies that residents were still carrying out many of their daily activities in spite of the closures of malls and most workplaces. On the other hand, human activity was much more significantly affected in the P2 pandemic period, with NTL intensity decreasing by −14% at the national level, varying between −5% (i.e., Jazan) to −20% (i.e., Asir) at the provincial level, with a typical −10% to −20% decrease at the governorate level (represented by the red circles in Figure 5c). This was certainly a result of the implementation of the national curfew (from 19:00 to 6:00), closures of mosques and the penalties imposed by the Ministry of the Interior for violators. Moreover, variations in NTL brightness due to the COVID-19 crisis between and within the spatial units examined provide a clue as to the different socioeconomic characteristics of the study area.
In contrast, a slight increase was observed in the NTL intensity in the P3 and P4 periods of the COVID-19 crisis compared to the P2 period. For example, 32 million people (Figure 6b) lived in governorates where lighting dimmed (≤−10%) in the P2 pandemic period, and this number decreased by −31% (22 million people) and −4% (31 million people) in the P3 (Figure 6c) and P4 (Figure 6d) pandemic periods, respectively. Similarly, some highly-populated governorates are shown in red and dark-red colors in the P2 pandemic periods (Figure 5c), and turn into very light-red and light-red colors in the P3 (Figure 5d) and P4 (Figure 5e) pandemic periods. The slight increase in NTL brightness was expected because these two periods are Ramadan and the Eid Alfiter days, respectively. During these periods, Muslims often decorate their houses, light lanterns and hang lights on the walls.
Due to the increase in the number of COVID-19 cases in some of the most populous cities (Makkah, Madinah and Riyadh), the Saudi government took the decision to close those cities. Of all the pandemic periods, P2 produced the biggest decrease in the NTL intensity, spread widely throughout all three cities, resulting from the curfew, closure of mosques and list of sanctions. The same measures continued in the P3 and P4 pandemic periods. However, some dimmed areas in the P2 pandemic period brightened in the P3 and P4 periods, particularly on the outskirts of the cities (Figure 7). This was because most of the private and commercial Istirahats, spacious one floor buildings including rooms, green spaces, trees, swimming pool, children’s games areas and a soccer field, are located on the outskirts, suggesting that during Ramadan and Eid Alfiter, some people spent time there instead of staying in their own houses. Closure of the mosques and the suspension of Umrah was the main cause of the dimming of lights across Makkah and Madinah. Interestingly, Madinah (a religious city) was affected more than Riyadh (a capital and economic city) in the P3 and P4 pandemic periods, respectively, suggesting that city identity is an important lens through which to understand the impact of the COVID-19 crisis.
It is useful to compare our findings with Wuhan over the first three pandemic periods. Shao et al. [28] reported decreases in NTL brightness in the first three pandemic periods in Wuhan, with values of −7%, −0.5% and −9%, respectively, whereas this study showed changes of 3%, −7% and −5% (Makkah), 2%, −16% and −12% (Madinah) and −2%, −16% and −8% (Riyadh), respectively. This suggests that the impact of COVID-19 varies from place to place as a result of the different cultural, social, economic and religious characteristics.
According to the WHO [56], the main mode of transmission of the COVID-19 virus is through respiratory droplets between people who are in close contact with each other. Moreover, a droplet is most likely to be transferred when the distance between people is less than 1 m. Human gatherings that take place such as religious rites, festivals, sporting events and parties often constitute hotspots for virus transmission between people, and this leads to the spread of the virus over a large scale. Thus, the holy mosques as well as other mosques in Saudi Arabia were closed for 75 days, and this reduced the number of pilgrims and worshipers to zero in the P2, P3 and P4 pandemic periods (Figure 9a,b). The Holy Mosque image (Figure 10) during the COVID-19 pandemic is, for Muslims, the saddest and harshest picture of the year 2020, and it acts as a visual reminder of the impact of COVID-19 on the global Islamic community.
One of the most interesting points in this research is that the NTL brightness of the Holy Mosque and Prophet’s Mosque sites was not quantitatively affected during the COVID-19 crisis, as shown in Figure 8. The reason could be that the five daily prayers in the Holy Mosque and the Prophet’s Mosque are broadcast live by television on most satellite channels around the world. The Saudi government understands the pain of Muslims when they see the Holy Kaaba empty of pilgrims and worshipers. Therefore, the levels of illumination of the holy mosques remained the same throughout the COVID-19 crisis, even in the absence of pilgrims and worshipers, to avoid the culturally unbearable sight of the Holy Kaaba and the Holy Mosque empty and dark. This was not the case for Quba Mosque, which may be because prayers in this mosque are not broadcast. Importantly, behavioral changes due to COVID-19 altered some long-established relationships between NTL and the presence of the population. These changes are societally specific and it is not year clear which of them might endure for the medium-to-long term.
Four research questions were presented earlier and we can now answer these questions. This study confirmed the usefulness of daily nighttime lights in quantifying the spatiotemporal impacts of the human lifestyle due to the COVID-19 pandemic (RQ 1). In addition, examination of the impact of COVID-19 at different administrative units revealed an overall decrease of the NTL brightness with different values between and within the administrative units (RQ2). The results of this research demonstrated how places are characterized by unique geographical, environmental, social, religious and economic characteristics, even within the same country. These factors must be considered when analyzing the impact of the COVID-19 pandemic on human lifestyles (RQ 3). Moreover, preventive measures such as the curfew and closure of the mosques influenced human activities more than the closure of malls and workplaces. A preventive measure such as closing holy sites affects human activities at the local, national and global levels (RQ 4).
The method developed for this research was based on freely accessible NTL and gridded population data, and thus, it can be adopted in other regions. VIIRS/DNB features such as their temporal (daily since 2012), radiometric (16 bits) and spatial (500 m) resolutions, as well as the improvement in terms of climatic correction, allow easy, timely and efficient use for the analysis and monitoring of spatial phenomena in comparison with statistical or field survey datasets. However, the application of NTL data in this research had some limitations. Firstly, the blooming effect allows lights to extend from populated areas to unpopulated areas. For example, some bare land within built-up areas appeared well-lit due to blooming effects. Secondly, the number of effective, high-quality grid cells is different for each period, which this may cause uncertainty when calculating the sum mean radiance. For example, a lower sum mean radiance may be caused by insufficient effective, high-quality grid cells. Lastly, areas that are occasionally cloudy will make the use of NTL data, or the derivation of effective, high-quality grid cells, more challenging. As revealed in this research, there are situations in which pandemic impacts on human activity are not directly observable through socioeconomic data sources, which may be restricted to national or regional scales, and which are rarely available for time periods that correspond well with changes in pandemic restrictions. Despite the limitations listed here, this research demonstrated the potential of NTL to capture pandemic impacts at a fine spatial resolution, which can be matched to specific periods of the pandemic. Many unique aspects of Islamic society studied here were revealed by the NTL analysis, which suggests that a similar approach could indeed yield valuable insights when applied to different societies, though that was beyond the scope of the present paper.
5. Conclusions
During the first and second quarters of 2020, most people around the world were affected by the COVID-19 pandemic. As a result of the rapid spread of COVID-19 around the world, Saudi Arabia, home to the greatest number of Muslim holy sites, implemented measures prior to the first confirmed case of COVID-19 in the country such as suspending Umrah for Muslims from abroad. After the first recorded case of COVID-19 in the country, the government imposed a set of preventive restrictions to control the virus and prevent its spread. These measures inevitably affected religious, economic and social aspects of the country. This research carried out a detailed spatiotemporal analysis of the effect of COVID-19 on human activities at multiple spatial scales in Saudi Arabia.
The research findings demonstrate that the application of daily nighttime light data is valuable for studying dynamic changes in the human lifestyle resulting from the COVID-19 crisis. In general, the impact on human activities caused by the COVID-19 crisis at the national, provincial and governorate levels was similar to that at the city level. In addition, it is clear that there was a reduction in the percentage difference of the NTL brightness during the pandemic periods with different degrees, which was due to (1) the different preventive measures that were applied by the Saudi government, and (2) the different cultural and socioeconomic factors between places. The human lifestyle was moderately affected in the P1 pandemic period. However, implementation of a national curfew and closure of the mosques were the most impactful measures on human activities in Saudi Arabia. The NTL data findings aligned with the results of the socioeconomic analysis. In Ramadan and Eid Alfiter, the NTL brightness increased in comparison with P2, the most affected pandemic period, as Muslims usually, in these periods, light up their homes inside and outside. It is clear that preventive measures such as closure of the Holy Mosque and Prophet’s Mosque due to the COVID-19 crisis directly affected the human lifestyle in Saudi Arabia, and thus, indirectly affected Muslims around the world. This study has also demonstrated that there have been changes in the relationship between population presence and NTL, which require societally-specific interpretation.
This type of research is important for decision-makers to assess the effect of preventive measures due to COVID-19 on human lifestyles, and thus, give them the opportunity to draw up future plans and policies to deal with similar pandemics with minimal impacts on human lifestyles. Further studies could, therefore, extend the periods to assess post-pandemic recovery in these same environmental, economic, social and religious conditions. In addition, geospatial data such as those relating to the traffic volumes, electricity consumption, public transit, internet payments, social media and telecommunications may be useful, with the VIIRS/DNB data, to accurately measure the impact of the COVID-19 pandemic on the human lifestyle.
Author Contributions
Conceptualization, methodology, data curation, formal analysis, investigation, methodology, writing—original draft, M.A.; investigation, methodology, writing—review & editing, S.M., N.D., A.A., P.M.A. and D.J.M. All authors have read and agreed to the published version of the manuscript.
Funding
This research received no external funding.
Acknowledgments
The authors acknowledge support from the King Abdulaziz City for Science and Technology (KACST). The authors thank Tareq Alahmadi for his help regarding Islamic culture.
Conflicts of Interest
The authors declare no conflict of interest.
References
- World Bank. Global Economic Prospects; World Bank: Washington, DC, USA, 2021. [Google Scholar]
- El-Gohary, H. Coronavirus and Halal Tourism and Hospitality Industry: Is It a Journey to the Unknown? Sustainability 2020, 12, 9260. [Google Scholar] [CrossRef]
- GAS. Hajj Statistics in 2021. Available online: https://www.stats.gov.sa/ (accessed on 25 August 2021).
- Chakraborty, I.; Maity, P. COVID-19 outbreak: Migration, effects on society, global environment and prevention. Sci. Total Environ. 2020, 728, 138882. [Google Scholar] [CrossRef] [PubMed]
- Ghosh, T.; Elvidge, C.D.; Hsu, F.-C.; Zhizhin, M.; Bazilian, M. The Dimming of Lights in India during the COVID-19 Pandemic. Remote Sens. 2020, 12, 3289. [Google Scholar] [CrossRef]
- Tomar, A.; Gupta, N. Prediction for the spread of COVID-19 in India and effectiveness of preventive measures. Sci. Total Environ. 2020, 728, 138762. [Google Scholar] [CrossRef] [PubMed]
- Sujath, R.; Chatterjee, J.M.; Hassanien, A.E. A machine learning forecasting model for COVID-19 pandemic in India. Stoch. Environ. Res. Risk Assess. 2020, 34, 959–972. [Google Scholar] [CrossRef] [PubMed]
- Roosa, K.; Lee, Y.; Luo, R.; Kirpich, A.; Rothenberg, R.; Hyman, J.; Yan, P.; Chowell, G.b. Real-time forecasts of the COVID-19 epidemic in China from February 5th to February 24th, 2020. Infect. Dis. Model. 2020, 5, 256–263. [Google Scholar] [CrossRef]
- Mansour, S.; Al Kindi, A.; Al-Said, A.; Al-Said, A.; Atkinson, P. Sociodemographic determinants of COVID-19 incidence rates in Oman: Geospatial modelling using multiscale geographically weighted regression (MGWR). Sustain. Cities Soc. 2021, 65, 102627. [Google Scholar] [CrossRef]
- Moein, S.; Nickaeen, N.; Roointan, A.; Borhani, N.; Heidary, Z.; Javanmard, S.H.; Ghaisari, J.; Gheisari, Y. Inefficiency of SIR models in forecasting COVID-19 epidemic: A case study of Isfahan. Sci. Rep. 2021, 11, 4725. [Google Scholar]
- Ren, H.; Zhao, L.; Zhang, A.; Song, L.; Liao, Y.; Lu, W.; Cui, C. Early forecasting of the potential risk zones of COVID-19 in China’s megacities. Sci. Total Environ. 2020, 729, 138995. [Google Scholar] [CrossRef]
- Anil, I.; Alagha, O. The impact of COVID-19 lockdown on the air quality of Eastern Province, Saudi Arabia. Air Qual. Atmos. Health 2021, 14, 117–128. [Google Scholar] [CrossRef]
- Liu, Q.; Harris, J.T.; Chiu, L.S.; Sun, D.; Houser, P.R.; Yu, M.; Duffy, D.Q.; Little, M.M.; Yang, C. Spatiotemporal impacts of COVID-19 on air pollution in California, USA. Sci. Total Environ. 2021, 750, 141592. [Google Scholar] [CrossRef]
- Magazzino, C.; Mele, M.; Sarkodie, S.A. The nexus between COVID-19 deaths, air pollution and economic growth in New York state: Evidence from Deep Machine Learning. J. Environ. Manag. 2021, 286, 112241. [Google Scholar] [CrossRef] [PubMed]
- Morsy, E.; Habeebullah, T.M.; Othman, A. Assessing the air quality of megacities during the COVID-19 pandemic lockdown: A case study from Makkah City, Saudi Arabia. Arab. J. Geosci. 2021, 14, 1–12. [Google Scholar] [CrossRef]
- Bai, H.M.; Zaid, A.; Catrin, S.; Ahmed, K.; Ahmed, A. The socio-economic implications of the coronavirus pandemic (COVID-19): A review. Int. J. Surg. 2020, 8, 8–17. [Google Scholar]
- Aljadani, A.; Toumi, H.; Toumi, S.; Hsini, M.; Jallali, B. Investigation of the N-shaped environmental Kuznets curve for COVID-19 mitigation in the KSA. Environ. Sci. Pollut. Res. 2021, 28, 29681–29700. [Google Scholar] [CrossRef] [PubMed]
- Havrlant, D.; Darandary, A.; Muhsen, A. Early estimates of the impact of the COVID-19 pandemic on GDP: A case study of Saudi Arabia. Appl. Econ. 2021, 53, 1317–1325. [Google Scholar] [CrossRef]
- Foo, L.-P.; Chin, M.-Y.; Tan, K.-L.; Phuah, K.-T. The impact of COVID-19 on tourism industry in Malaysia. Curr. Issues Tour. 2020, 1–5. [Google Scholar] [CrossRef]
- Abbas, J.; Mubeen, R.; Iorember, P.T.; Raza, S.; Mamirkulova, G. Exploring the impact of COVID-19 on tourism: Transformational potential and implications for a sustainable recovery of the travel and leisure industry. Curr. Res. Behav. Sci. 2021, 2, 100033. [Google Scholar] [CrossRef]
- Anand, A.; Kim, D.-H. Pandemic induced changes in economic activity around African protected areas captured through night-time light data. Remote Sens. 2021, 13, 314. [Google Scholar] [CrossRef]
- Alkhraijah, M.; Alowaifeer, M.; Alsaleh, M.; Alfaris, A.; Molzahn, D.K. The Effects of Social Distancing on Electricity Demand Considering Temperature Dependency. Energies 2021, 14, 473. [Google Scholar] [CrossRef]
- Bahmanyar, A.; Estebsari, A.; Ernst, D. The impact of different COVID-19 containment measures on electricity consumption in Europe. Energy Res. Soc. Sci. 2020, 68, 101683. [Google Scholar] [CrossRef]
- Soava, G.; Mehedintu, A.; Sterpu, M.; Grecu, E. The impact of the COVID-19 pandemic on electricity consumption and economic growth in Romania. Energies 2021, 14, 2394. [Google Scholar] [CrossRef]
- Elvidge, C.D.; Ghosh, T.; Hsu, F.-C.; Zhizhin, M.; Bazilian, M. The Dimming of Lights in China during the COVID-19 Pandemic. Remote Sens. 2020, 12, 2851. [Google Scholar] [CrossRef]
- Liu, Q.; Sha, D.; Liu, W.; Houser, P.; Zhang, L.; Hou, R.; Lan, H.; Flynn, C.; Lu, M.; Hu, T. Spatiotemporal patterns of COVID-19 impact on human activities and environment in mainland China using nighttime light and air quality data. Remote Sens. 2020, 12, 1576. [Google Scholar] [CrossRef]
- Lan, T.; Shao, G.; Tang, L.; Xu, Z.; Zhu, W.; Liu, L. Quantifying spatiotemporal changes in human activities induced by COVID-19 pandemic using daily nighttime light data. IEEE J. Sel. Top. Appl. Earth Obs. Remote Sens. 2021, 14, 2740–2753. [Google Scholar] [CrossRef]
- Shao, Z.; Tang, Y.; Huang, X.; Li, D. Monitoring Work Resumption of Wuhan in the COVID-19 Epidemic Using Daily Nighttime Light. Photogramm. Eng. Remote Sens. 2021, 87, 195–204. [Google Scholar]
- Yin, R.; He, G.; Jiang, W.; Peng, Y.; Zhang, Z.; Li, M.; Gong, C. Night-Time Light Imagery Reveals China’s City Activity During the COVID-19 Pandemic Period in Early 2020. IEEE J. Sel. Top. Appl. Earth Obs. Remote Sens. 2021, 14, 5111–5122. [Google Scholar] [CrossRef]
- Huang, Q.; Yang, X.; Gao, B.; Yang, Y.; Zhao, Y. Application of DMSP/OLS nighttime light images: A meta-analysis and a systematic literature review. Remote Sens. 2014, 6, 6844–6866. [Google Scholar] [CrossRef] [Green Version]
- Zhao, M.; Zhou, Y.; Li, X.; Cao, W.; He, C.; Yu, B.; Li, X.; Elvidge, C.D.; Cheng, W.; Zhou, C. Applications of satellite remote sensing of nighttime light observations: Advances, challenges, and perspectives. Remote Sens. 2019, 11, 1971. [Google Scholar] [CrossRef] [Green Version]
- Alahmadi, M.; Atkinson, P.M. Three-fold urban expansion in Saudi Arabia from 1992 to 2013 observed using calibrated DMSP-OLS night-time lights imagery. Remote Sens. 2019, 11, 2266. [Google Scholar] [CrossRef] [Green Version]
- Hu, X.; Qian, Y.; Pickett, S.T.; Zhou, W. Urban mapping needs up-to-date approaches to provide diverse perspectives of current urbanization: A novel attempt to map urban areas with nighttime light data. Landsc. Urban Plan. 2020, 195, 103709. [Google Scholar] [CrossRef]
- Li, F.; Li, E.; Zhang, C.; Samat, A.; Liu, W.; Li, C.; Atkinson, P.M. Estimating artificial impervious surface percentage in Asia by fusing multi-temporal MODIS and VIIRS nighttime light data. Remote Sens. 2021, 13, 212. [Google Scholar] [CrossRef]
- Tang, Y.; Shao, Z.; Huang, X.; Cai, B. Mapping Impervious Surface Areas Using Time-Series Nighttime Light and MODIS Imagery. Remote Sens. 2021, 13, 1900. [Google Scholar] [CrossRef]
- Alahmadi, M.; Mansour, S.; Martin, D.; Atkinson, P. An Improved Index for Urban Population Distribution Mapping Based on Nighttime Lights (DMSP-OLS) Data: An Experiment in Riyadh Province, Saudi Arabia. Remote Sens. 2021, 13, 1171. [Google Scholar] [CrossRef]
- Lu, D.; Wang, Y.; Yang, Q.; Su, K.; Zhang, H.; Li, Y. Modeling spatiotemporal population changes by integrating DMSP-OLS and NPP-VIIRS nighttime light data in Chongqing, China. Remote Sens. 2021, 13, 284. [Google Scholar] [CrossRef]
- Lin, J.; Shi, W. Statistical correlation between monthly electric power consumption and VIIRS nighttime light. ISPRS Int. J. Geo-Inf. 2020, 9, 32. [Google Scholar] [CrossRef] [Green Version]
- Sun, Y.; Wang, S.; Zhang, X.; Chan, T.O.; Wu, W. Estimating local-scale domestic electricity energy consumption using demographic, nighttime light imagery and Twitter data. Energy 2021, 226, 120351. [Google Scholar] [CrossRef]
- Zhao, M.; Cheng, W.; Zhou, C.; Li, M.; Wang, N.; Liu, Q. GDP spatialization and economic differences in South China based on NPP-VIIRS nighttime light imagery. Remote Sens. 2017, 9, 673. [Google Scholar] [CrossRef] [Green Version]
- Xu, G.; Xiu, T.; Li, X.; Liang, X.; Jiao, L. Lockdown induced night-time light dynamics during the COVID-19 epidemic in global megacities. Int. J. Appl. Earth Obs. Geoinf. 2021, 102, 102421. [Google Scholar] [CrossRef]
- Ardiansyah, E.A. Critical Discourse Analysis on a Text “Friday Prayer at Home for Most but Some Risk Infection at Mosques” by the Al Jazeera English. Al-Tsaqafa J. Ilm. Perad. Islam 2020, 17, 58–66. [Google Scholar]
- Al-Bukhari, A.A. Sahih Bukhari, 1st ed.; Dar Ibn Katheer: Damascus, Syria, 2002. [Google Scholar]
- Zubar, M. Group Prayer When Epidemic Diseases Spread—A Comparative Jurisprudential Study. J. Al-Frahedis Arts 2021, 13, 197–211. [Google Scholar]
- Kushbayev, F. The social, economic and religious life of the city of Mecca before islam. Light Islam 2018, 2018, 3–7. [Google Scholar]
- Yezli, S.; Khan, A. COVID-19 social distancing in the Kingdom of Saudi Arabia: Bold measures in the face of political, economic, social and religious challenges. Travel Med. Infect. Dis. 2020, 37, 101692. [Google Scholar] [CrossRef] [PubMed]
- Hanieh, A. COVID-19 and global oil markets. Can. J. Dev. Stud./Rev. Can. D’études Dév. 2021, 42, 101–108. [Google Scholar] [CrossRef]
- Abu Alfotoh, M. Factors affecting strategic decision-making in the face of the Corona virus and its effects on limiting the spread of the virus: A case study of the Kingdom of Saudi Arabia. J. Econ. Political Sci. 2021, 22, 255–307. [Google Scholar] [CrossRef]
- GAS. Umrah Statistics in 2021. Available online: https://www.stats.gov.sa/ (accessed on 25 August 2021).
- Elvidge, C.D.; Baugh, K.; Zhizhin, M.; Hsu, F.C.; Ghosh, T. VIIRS night-time lights. Int. J. Remote Sens. 2017, 38, 5860–5879. [Google Scholar] [CrossRef]
- Román, M.O.; Wang, Z.; Sun, Q.; Kalb, V.; Miller, S.D.; Molthan, A.; Schultz, L.; Bell, J.; Stokes, E.C.; Pandey, B. NASA’s Black Marble nighttime lights product suite. Remote Sens. Environ. 2018, 210, 113–143. [Google Scholar] [CrossRef]
- Gaughan, A.E.; Stevens, F.R.; Linard, C.; Jia, P.; Tatem, A.J. High resolution population distribution maps for Southeast Asia in 2010 and 2015. PLoS ONE 2013, 8, e55882. [Google Scholar] [CrossRef]
- Baugh, K.; Hsu, F.-C.; Elvidge, C.D.; Zhizhin, M. Nighttime lights compositing using the VIIRS day-night band: Preliminary results. Proc. Asia-Pac. Adv. Netw. 2013, 35, 70–86. [Google Scholar] [CrossRef] [Green Version]
- Shi, K.; Yu, B.; Huang, Y.; Hu, Y.; Yin, B.; Chen, Z.; Chen, L.; Wu, J. Evaluating the ability of NPP-VIIRS nighttime light data to estimate the gross domestic product and the electric power consumption of China at multiple scales: A comparison with DMSP-OLS data. Remote Sens. 2014, 6, 1705–1724. [Google Scholar] [CrossRef] [Green Version]
- Alkhadim, M.; Gidado, K.; Painting, N. Risk management: The effect of FIST on perceived safety in crowded large space buildings. Saf. Sci. 2018, 108, 29–38. [Google Scholar] [CrossRef]
- World Health Organization (WHO). Modes of Transmission of Virus Causing COVID-19: Implications for IPC Precaution Recommendations: Scientific Brief, 27 March 2020; World Health Organization: Geneva, Switzerland, 2020. [Google Scholar]

Publisher’s Note: MDPI stays neutral with regard to jurisdictional claims in published maps and institutional affiliations. |
© 2021 by the authors. Licensee MDPI, Basel, Switzerland. This article is an open access article distributed under the terms and conditions of the Creative Commons Attribution (CC BY) license (https://creativecommons.org/licenses/by/4.0/).