Article

Monitoring Forest Health Using Hyperspectral Imagery: Does Feature Selection Improve the Performance of Machine-Learning Techniques?

1
GIScience Group, Department of Geography, Friedrich Schiller University Jena, Loebdergraben 32, 07743 Jena, Germany
2
NEIKER Tecnalia, 48160 Tecnalia, Spain
3
Department of Statistics, Ludwig-Maximilians-Universität München, Akademiestrasse 1/I, 80799 Munich, Germany
*
Author to whom correspondence should be addressed.
Remote Sens. 2021, 13(23), 4832; https://doi.org/10.3390/rs13234832
Submission received: 12 September 2021 / Revised: 15 November 2021 / Accepted: 23 November 2021 / Published: 28 November 2021
(This article belongs to the Special Issue Machine Learning Methods for Environmental Monitoring)

Abstract

:
This study analyzed highly correlated, feature-rich datasets from hyperspectral remote sensing data using multiple statistical and machine-learning methods. The effect of filter-based feature selection methods on predictive performance was compared. In addition, the effect of multiple expert-based and data-driven feature sets, derived from the reflectance data, was investigated. Defoliation of trees (%), derived from in situ measurements from fall 2016, was modeled as a function of reflectance. Variable importance was assessed using permutation-based feature importance. Overall, the support vector machine (SVM) outperformed other algorithms, such as random forest (RF), extreme gradient boosting (XGBoost), and lasso (L1) and ridge (L2) regressions by at least three percentage points. The combination of certain feature sets showed small increases in predictive performance, while no substantial differences between individual feature sets were observed. For some combinations of learners and feature sets, filter methods achieved better predictive performances than using no feature selection. Ensemble filters did not have a substantial impact on performance. The most important features were located around the red edge. Additional features in the near-infrared region (800–1000 nm) were also essential to achieve the overall best performances. Filter methods have the potential to be helpful in high-dimensional situations and are able to improve the interpretation of feature effects in fitted models, which is an essential constraint in environmental modeling studies. Nevertheless, more training data and replication in similar benchmarking studies are needed to be able to generalize the results.

Graphical Abstract

1. Introduction

The use of machine learning (ML) algorithms for analyzing remote sensing data has seen a huge increase in the last decade [1]. This coincided with the increased availability of remote sensing imagery, especially since the launch of the first Sentinel satellite in the year 2014. At the same time, the implementation and usability of learning algorithms has been greatly simplified with many contributions from the open-source community. Scientists can nowadays process large amounts of (environmental) information with relative ease using various learning algorithms. This makes it possible to easily extend benchmark comparison matrices of studies in a semi-automated way, possibly stumbling upon unexpected findings, such as process settings, that would not have been explored otherwise [2].
ML methods in combination with remote sensing data are used in many environmental fields, such as vegetation cover analysis and forest carbon storage mapping [3,4]. The ability to predict these environmental variables in unknown regions qualifies ML algorithms as a helpful tool for such environmental analyses. One aspect of this research field is to enhance the understanding of biotic and abiotic stress triggers, for example, by analyzing tree defoliation [5]. Defoliation is known to be a proxy for pathogen and insect damage [6]. While common symptoms are observable across species, some effects and their degree of severity are species-specific [7]. Defoliation has also been shown to increase predisposition of tree death from secondary biotic factors up to ten years after the actual defoliation event [8]. Other approaches for analyzing forest health include change detection [9] or describing the current health status of forests on a stand level [10].
Vegetation indices have shown the potential to provide valuable information when analyzing forest health [11,12]. Most vegetation indices were developed with the aim of being sensitive to changes in specific wavelength regions, serving proxies for underlying plant physiological processes. In some cases, indices developed for different purposes than the one to be analyzed (e.g., defoliation of pine trees) may help to explain complex underlying relationships that are not obvious at first. This emphasizes the need to extract as much information as possible from the available input data to generate promising features that can help in improving our understanding of the modeled relationship [13]. A less known index type that can be derived from spectral information is the normalized ratio index (NRI). In contrast to most vegetation indices, NRIs do not use an expert-based formula following environmental heuristics; instead, they make use of a data-driven feature engineering approach by combining (all possible) combinations of spectral bands [14]. When working with hyperspectral data, thousands of NRI features can be derived this way.
Even though ML algorithms are capable of handling highly correlated input variables, model fitting becomes computationally more demanding and model interpretation more challenging. Feature selection approaches can help to address this issue, reducing possible noise in the feature space, simplifying model interpretability, and possibly enhancing predictive performance [15]. Instead of using wrapper feature selection methods, which add a substantial overhead to a nested model optimization approach, especially for datasets with many features, this study focuses on (ensemble) filter methods, which can be directly integrated into the hyperparameter optimization step during model construction.
Overall, this study aims to show how high-dimensional datasets can be handled effectively with ML methods while still allowing the interpretation of the fitted models. The predictive power of non-linear methods and their ability to handle highly correlated predictors is combined with common and new approaches for assessing feature importance and feature effects. However, this study focuses mainly on investigating the effects of filter methods and feature set types on predictive performance rather than interpreting individual feature effects.
Considering these opportunities and challenges, the research questions of this study are as follows:
  • How do different feature selection methods influence the predictive performance of ML models of the defoliation of trees?
  • Do different (environmental) feature sets show differences in performance?
  • Can predictive performance be substantially improved by combining feature sets?
  • Which features are most important and how can these be interpreted in this context?
In recent years, various studies that have used hyperspectral data to analyze pest/fungi infections on trees have been published. Pinto et al. [16] successfully used hyperspectral imagery to characterize pest infections on peanut leaves using random forest, while Yu et al. [17] aimed to detect pine wilt disease in pine plots in China using vegetation indices derived from hyperspectral data. Other studies which applied hyperspectral data for forest health monitoring are [18,19,20]. Building upon these successful applications of hyperspectral remote sensing usage in the field of leaf and tree health monitoring, this work analyzes tree defoliation in northern Spain using airborne hyperspectral data. The methodology of this study uses ML methods in combination with feature selection and hyperparameter tuning. In addition, feature importance was analyzed. Incorporating the idea of creating data-driven NRIs, this study also discusses the practical problems of high dimensionality in environmental modeling [21,22].

2. Materials and Methods

2.1. Data and Study Area

Airborne hyperspectral data with a spatial resolution of one meter and 126 spectral bands were available for four Monterey Pine (Pinus radiata D. Don) plantations in northern Spain. The trees in the plots suffer from infections with pathogens such as Diplodia sapinea (Fr.) Fuckel, Fusarium circinatum Nirenberg & O’Donnell, Armillaria mellea (Vahl) P. Kumm, Heterobasidion annosum (Fr.) Bref, Lecanosticta acicola (Thüm) Syd., and Dothistroma septosporum (Dorogin) M. Morelet causing (among others) needle blight, pitch canker, and root diseases [23,24]. The first two fungi are mainly responsible for the foliation loss of the trees analyzed in this study [25]. In situ measurements of defoliation of trees (serving as a proxy for tree health) were collected by visual inspection by experts. Defoliation in percent was used as the response variable (Figure 1).
It is assumed that the fungi infect the trees through open wounds, possibly caused by previous hail damage [25]. The dieback of these trees, which are mainly used as timber, causes substantial economic losses [26].

2.1.1. In Situ Data

The Pinus radiata plots of this study, namely Laukiz1, Laukiz2, Luiando, and Oiartzun, are located in the northern part of the Basque Country (Figure 2). Oiartzun has the largest number of observations ( n = 559 trees), while Laukiz2 is the largest in area (1.44 ha). All plots besides Luiando are located within 100 km from the coast (Figure 2). A total of 1808 observations are available (Laukiz1: 559, Laukiz2: 451, Luiando: 301, Oiartzun: 497). Field surveys were conducted in September 2016 by experienced forest pathologists. Defoliation was measured in 5% steps through visual inspection with the help of a score card. For Laukiz2, values at three height levels (bottom, mid, and top) were available and averaged into an overall defoliation value, resulting in values that are not multiples of 5% (e.g., 8.33%). The magnitude of human observer errors in such surveys, including the present one, is not precisely known and has being discussed for many years [27]. Ref. [28] estimated human observer errors in defoliation surveys to range between 7% and 18%.

2.1.2. Hyperspectral Data

The airborne hyperspectral data were acquired by an AISA EAGLE-II sensor during two flight campaigns on 28 September and 5 October 2016 at noon. All preprocessing steps (geometric, radiometric, and atmospheric) were conducted by the Institut Cartografic i Geologic de Catalunya (ICGC). The first four bands were corrupted, leaving 122 bands with valid information. Additional metadata information is available in Table 1.

2.2. Derivation of Indices

To use the full potential of the hyperspectral data, all possible vegetation indices supported by the R package hsdar (89 in total) as well as all possible NRI combinations were calculated. NRIs follow the optimized multiple narrow-band reflectance (OMNBR) concept of data-driven information extraction from narrow-band indices of hyperspectral data [13,14]. While various index formulations, such as band ratios or normalized ratios, are available, indices involving the same bands are strongly correlated. Since the widely used NDVI index belongs to the group of normalized ratio indices (NRIs), which are implemented in the hsdar R package, we used the following normalized difference index (NDI) formula to combine all pairs of reflectances:
N R I i , j = b a n d i b a n d j b a n d i + b a n d j
where i and j are the respective band numbers.
To account for geometric offsets within the hyperspectral data, which were reported by ICGC to be potentially up to one meter, a buffer of one meter radius around the centroid of each tree was used when extracting the reflectance values. A pixel was considered to fall into a tree’s buffer zone if the centroid of the respective pixel was touched by the buffer. The pixel values within a buffer zone were averaged and formed the final reflectance value of a single tree, and they were used as the base information to derive all additional feature sets. In total, 121 122 2 = 7381 NRIs were calculated.

2.3. Feature Selection

High-dimensional, feature-rich datasets come with several challenges for both model fitting and evaluation:
  • Model fitting times increase.
  • Noise is possibly introduced into models by highly correlated variables [29].
  • Model interpretation and prediction become more challenging [29].
To reduce the feature space of a dataset, several conceptually differing approaches exist: wrapper methods, filters, penalization methods (lasso and ridge), and principal component analysis (PCA) [30,31,32,33]. In contrast to wrapper methods, filters have a much lower computational cost, and their tuning can be added to the hyperparameter optimization step. In addition, filters are less known than wrapper methods, and, in recent years, ensemble filters, which have shown promising results compared to single filter algorithms, were introduced [34]. These two points mainly led to the decision to focus on filter methods for this work and evaluate their effectiveness on highly correlated, high-dimensional datasets. Due to this focus, only this subgroup of feature selection methods is be introduced in greater detail in the following sections.

2.3.1. Filter Methods

The concept of filters originates from the idea of ranking features following a score calculated by an algorithm [32]. Some filter methods can only deal with specific types of variables (e.g., numeric or nominal). Filters only rank features; they do not decide which covariates to drop or keep [35]. The decision of which features to keep for model fitting can be integrated into the optimization phase during model fitting, along with hyperparameter tuning. Thus, the number of top-ranked features to be included in the model is treated as an additional hyperparameter of the model. This hyperparameter is tuned to optimize the model’s performance.
Beyond the use of individual filter methods to rank and select features, recent studies have shown that combining several filters by using statistical operations such as “minimum” or “mean” may enhance the predictive performance of the resulting models, especially when applied to multiple datasets [34,36]. This approach is referred to as “ensemble filtering” [37]. Ensemble filters align with the recent rise of the ensemble approach in ML, which uses the idea of stacking to combine the predictions of multiple models, aiming to enhance predictive performance [38,39,40]. In this work, the Borda ensemble filter was used [34]. Its overall feature order is determined by the sum of filter ranks of all individual filters in the ensemble.
Filter methods can be categorized based on three binary criteria: multivariate or univariate feature use, correlation or entropy-based importance weighting, and linear and non-linear filter methodology. Care needs to be taken to not weigh certain classes more than others in the ensemble, as, otherwise, the ranking will be biased. In this study, this was taken care of by checking the rank correlations (Spearman’s correlation) of the generated feature rankings of all methods against each other. If filter pairs showed a correlation of 0.9 or higher, only one of the two was included in the ensemble filter, selecting it at random.

2.3.2. Description of Used Filter Methods

Filter methods can be classified as follows (Table 2):
  • Univariate/multivariate (scoring based on a single variable/multiple variables).
  • Linear/non-linear (usage of linear/non-linear calculations).
  • Entropy/correlation (scoring based on derivations of entropy or correlation-based approaches).
The filter “Information Gain” in its original form is only defined for nominal response variables:
H ( C l a s s ) + H ( A t t r i b u t e ) H ( C l a s s , A t t r i b u t e )
where H is the conditional entropy of the response variable (class or Y) and the feature (attribute or X). H ( X ) is Shannon’s entropy [47] for a variable X, and H ( X , Y ) is a joint Shannon’s entropy for a variable X with a condition to Y. H ( X ) itself is defined as
H ( X ) = i = 1 n P ( x i ) log b P ( x i )
where b is the base of the logarithm used, most commonly 2.
In order to use this method with a numeric response (percentage defoliation of trees), the variable was discretized into equal bins n b i n = 10 and treated as a categorical variable.

2.4. Benchmarking Design

2.4.1. Algorithms

The following learners were used in this work:
  • Extreme gradient boosting (XGBoost);
  • Random forest (RF);
  • Penalized regression (with L1/lasso and L2/ridge penalties);
  • Support vector machine (SVM, radial basis function Kernel);
  • Featureless learner.
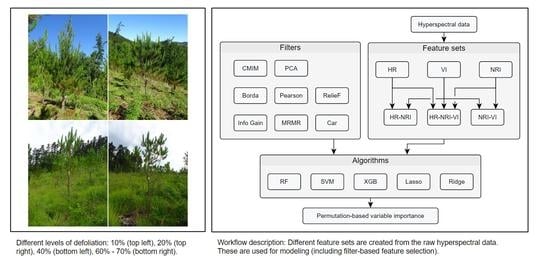
RF and SVM are well-established algorithms and widely used in environmental remote sensing. Extreme gradient boosting (commonly abbreviated as XGBoost) has shown promising results in benchmarking studies in recent years. Penalized regression is a statistical modeling technique capable of dealing with highly correlated covariates by penalizing the model coefficients [48]. Common penalties are “lasso” (L1) and “ridge” (L2). Ridge regression does not remove variables from the model (penalization to zero), but it shrinks them towards zero, keeping them in the model. A featureless learner was included for a baseline comparison.
In total, the benchmarking grid consisted of 156 experiments (6 feature sets × 3 ML algorithms × 8 feature-selection methods and for the L1/L2 models, 6 feature sets × 2 models. The selected hyperparameter settings are shown in Appendix A Table A1. All code and data are included in the research compendium of this study (https://doi.org/10.5281/zenodo.2635403 (accessed on 22 November 2021).

2.4.2. Feature Sets

Three feature sets were used in this study, each representing a different approach to feature engineering:
  • The raw hyperspectral band information (HR): no feature engineering;
  • Vegetation indices (vegetation index (VI)s): expert-based feature engineering;
  • Normalized ratio indices (NRIs): data-driven feature engineering.
The idea of splitting the features into different sets originated from the question of whether feature-engineered indices derived from reflectance values have a positive effect on model performance. Peña et al. 2017 [49] is an exemplary study that used this approach in a spectro-temporal setting. Benchmarking learners on these feature sets while keeping all other variables, such as model type, tuning strategy, and a partitioning method, fixed makes it possible to draw conclusions on their individual impact. Each feature set has distinct capabilities that differentiate it from the others. This can have both a positive and negative effect on the resulting performance, which is one question this study aims to explore. For example, feature set VI misses certain parts of the spectral range, as the chosen indices only use specific spectral bands. Feature set NRI will introduce highly correlated features, for which some algorithms may be more suitable than others.
In addition to these individual feature sets, the following combinations of feature sets were also compared:
  • HR + VI
  • HR + NRI;
  • HR + VI + NRI.
Some individual features were removed before using the datasets for modeling when being numerically equivalent to another feature based on the pairwise correlation being greater than 1 10 10 . This preprocessing step reduced the number of covariates for feature set VI to 86 (from 89). This decision was made to prevent numerical issues that may occur in the subsequent tuning, filtering, and model fitting steps when offering features with a pairwise correlation of (almost) one. The remaining features were then used as input for the filter-based feature selection within the CV.

2.4.3. Hyperparameter Optimization

Hyperparameters were tuned using model-based optimization (MBO) within a nested spatial cross-validation (CV) [50,51,52]. In MBO, first, n hyperparameter settings are randomly chosen from a user-defined search space. After these n settings have been evaluated, one new setting, which is evaluated next, is proposed by a fitted surrogate model (by default, a kriging method). This strategy continues until a user-defined stopping criterion is satisfied [53,54].
In this work, an initial design of 30 randomly drawn hyperparameter settings in combination with a stopping criterion of 70 iterations was used, resulting in a total budget of 100 evaluated hyperparameter settings per fold. The advantage of this tuning approach is a substantial reduction of the tuning budget that is required to find a setting close to the global optimization minimum. MBO may outperform methods that do not use information from previous iterations, such as random search or grid search [55]. Tuning ranges used in this work are shown in Table A1.
To optimize the number of features used for model fitting, the percentage of features was added as a hyperparameter during the optimization stage [51]. For PCA, the number of principal components was tuned. The RF hyperparameter m t r y was re-expressed as m t r y = p sel t , a function of the number of selected features, p sel . It was thus tuned on a logarithmic scale by varying t between 0 (i.e., m t r y = 1 ) and 0.5 (i.e., m t r y = p sel ). This was necessary to ensure that m t r y did not exceed the number of features available after optimizing the feature percentage during tuning.

2.4.4. Spatial Resampling

A spatial nested cross-validation on the plot level was chosen to account for spatial autocorrelation within the plots and assess model transferability to different plots [52,56]. The root mean square error (RMSE) was chosen as the error measure. Each plot served as one cross-validation fold, resulting in four iterations in total. The inner level of cross-validation for hyperparameter tuning also used plot-level cross-validation.

2.5. Feature Importance and Feature Effects

Estimating feature importance for datasets with highly correlated features is a challenging task for which numerous model-specific and model-agnostic approaches exist [48,57,58]. The strong correlations among features make it challenging to calculate an unbiased estimate for single features [59]. Methods such as partial dependence plots (PDP) or permutation-based approaches may produce unreliable estimates in such scenarios because unrealistic combinations of feature values are created [59]. The development of robust methods that enable an unbiased estimation of feature importance for highly correlated variables is subject to current research [60].
In this work, permutation-based feature importance was calculated to estimate feature importance or effects [61]. With the limitations in mind when applied to correlated features, the aim was to get a general overview of the feature importance of the hyperspectral bands while trying to avoid an over-interpretation of results. The best-performing algorithm on the HR task (i.e., SVM) was used for the feature importance calculation.
To facilitate interpretation, the ten most important indices of the best performing models using feature sets HR and VI were linked to the spectral regions of the hyperspectral data that went into their calculation. The aim was to visualize the most important features along the spectral curve of the plots to better understand which spectral regions were most important for the model.

2.6. Research Compendium

All tasks of this study were conducted using the open-source statistical programming language R [62]. A complete list of all R packages used in this study can be found in the linked repositories mentioned in the next paragraph. Due to space limitations, only selected packages with high impact on this work are explicitly cited.
The algorithm implementations of the following packages were used: xgboost [63] (extreme gradient boosting), kernlab [64] (support vector machine) and glmnet [65] (penalized regression). The filter implementations of the following packages were used: praznik [66] and FSelectorRcpp [67]. Package mlr [68] was used for all modeling related steps, and drake [69] was used for structuring the work and for reproducibility. This study is available as a research compendium on Zenodo (10.5281/zenodo.2635403, (accessed on 22 November 2021). Apart from the availability of code and manuscript sources, a static webpage is available at https://pat-s.github.io/2019-feature-selection (accessed on 22 November 2021) which includes additional side analyses that were carried out during the creation of this study.

3. Results

3.1. Principal Component Analysis of Feature Sets

PCA was used to assess the complexity of the three feature sets. Depending on the feature set, 95% of the variance is explained by two (HR), twelve (VI), and 42 (NRI) principal component (PC)s. HR features are therefore highly redundant, while the applied feature transformations enrich the data set, at least from an exploratory linear perspective.

3.2. Predictive Performance

Overall, the response variable “tree defoliation” could be modeled with an RMSE of 28 percentage points (p.p.) (Figure 3). SVM showed almost no differences in RMSE across feature sets whereas other learners (RF, SVM, XGBoost, lasso and ridge) differed up to five p.p. (Figure 3). SVM showed the best overall performance with a mean difference of around three p.p. to the next best model (XGBoost) (Table 3). Performance differences between test folds were large: Predicting on Luiando resulted in an RMSE of 9.0 p.p. for learner SVM (without filter) but up to 54.3 p.p. when testing on Laukiz2 (Table 4).
The combination of feature sets showed small increases in performance for some learners. XGBoost scored slightly better on the combined datasets HR-NRI, NRI-VI, and HR-NRI-VI compared to their standalone variants (NRI and VI) (Figure 3). However, the best performances for RF and XGBoost were scored on NRI and HR, respectively. RF showed a substantial performance increase when using only NRI compared to all other feature sets, whereas for XGBoost, the worst performances were associated with the VI- and NRI-only feature sets (Figure 3).
SVM combined with the “Information Gain” filter achieved the best overall performance (RMSE of 27.915 p.p.) (Table 5). Regressions with ridge (L2) and lasso (L1) penalties showed their best performances on the NRI feature set (Table 3). Combining feature sets for lasso and ridge did not help to increase performance, and while there was no substantial difference for lasso, the performance of ridge improved by around two percentage points. XGBoost showed very poor performances for some feature sets and fills the last ten places of the ranking (Table 6). Especially when combined with PCA, the algorithm was not able to achieve adequate performances.
The effects of filter methods on performance differed greatly between the algorithms: SVM showed no variation in performance across filters (Figure 4). The use of filters for RF resulted in a substantial increase in performance in all tasks, especially on the HR feature set where all filters showed an improved score compared to using no filter (Figure 4). XGBoost’s performance depended strongly on feature selection. In two out of six tasks (HR, VI), using no filter resulted in the worst performance. XGBoost showed the highest overall differences between filters for a single task—for feature set HR, the range is up to 13 p.p. (“CMIM” vs. “no filter”) (Figure 4).
When comparing the usage of filters against using no filter at all, there were no instances in which a non-filtered model scored a better performance than the best filtered one (Figure 4). For SVM, all filters and “no filter” achieved roughly the same performance on all tasks.
The Borda ensemble filter was not able to score the best performance in any learner/ filter setting (Figure 5). For RF and XGBoost, it most often ranked within the better half among all filters of a specific task.
The number of features selected during model optimization strongly varied across learners and plots. RF selected the least features of all three learners, and with the exception of Oiartzun, only one or two variables were selected. SVM used 210 features or more in all instances and selected between 16% (Laukiz1) and 81% (Oiartzun) of the features (Table 7). XGBoost also favored using several hundred features with the exception of Laukiz2, for which only 14 (0.96%) were selected.

3.3. Variable Importance

Permutation-Based Variable Importance

The most important features for datasets HR and VI showed an average decrease in RMSE of 1.06 p.p. (HR, B65) and 1.93 p.p. (VI, Vogelmann2) when permuted (Figure 6). For the HR dataset, most (i.e., six out of ten) relevant features clustered around the infrared region (920–1000 nm), while for VI, eight out of ten concentrate within the wavelength range of 700–750 nm (the so/called “red edge”). For HR, four features in the infrared region (920–1000 nm) were identified by the model to be most important, being associated with a mean decrease in RMSE of around 1 p.p. Overall, apart from the top five features, the vast majority of features showed only a small importance with average decreases in RMSE below 0.5 p.p.

4. Discussion

4.1. Predictive Performance

The best overall performance achieved in this study (SVM with the “Info Gain” filter, RMSE 27.915 p.p.) has to be seen in the light of model overfitting (see Section 4.2). Leaving out the performance on Laukiz2 when aggregating results, the mean RMSE would be around 19 p.p. However, leaving out a single plot would also change the prediction results for the other plots because the observations from Laukiz2 would not be available for model training. Due to the apparent presence of model overfitting in this study, it is suggested that more training data representing a greater variety of situations are needed. A model can only make robust predictions if it has learned relationships across the whole range of the response. Hence, care should be taken when predicting on the landscape scale using models fitted on this dataset due to their lack of generalizability caused by the limitations of the available training data. However, when inspecting the fold/level performances, it can be concluded that the models performed reasonably well, predicting defoliation greater than 50%, but they failed for lower levels. This applied to all learners of this study. In this study, the overall performance across all learners can be classified as “poor” given that only the SVM learner was able to substantially outperform the featureless learner (Table 3). It is worth noting that data quality issues may have affected model performances, as discussed below in detail (Section 4.5).

4.1.1. Model Differences

An interesting finding is the strength of the SVM algorithm when comparing its predictive performance to its competitors (Table 3). These cluster around a performance of 31 p.p., while SVM scored about 3 p.p. better than all other methods. However, we refrain from comparing these results (both relatively and absolute) to other studies since many study design points have an influence on the final result (optimization strategy, data characteristics, feature selection methods, etc.).
A potential limiting factor in this study could be the upper limit of 70 iterations used for the XGBoost algorithm (hyperparameter nrounds), especially for feature sets including NRIs (Table A1). This setting was a compromise between runtime and tuning space extension with the goal to work well for most feature sets. It may be recommendable to increase this upper limit to a value closer to the number of features in the dataset in order to be able to exploit the full potential of this hyperparameter.

4.1.2. Feature Set Differences

One objective of this study was to determine whether expert-based and data-driven feature engineering have a positive influence on model performance. With respect to Figure 3, no overall positive or negative pattern related to specific feature sets was found that would be valid across all models. The performance of RF and XGBoost on the VI feature set was around 4 to 6 p.p. lower than on others. One reason could be the lack of coverage in the wavelength range between 810 nm and 1000 nm (Figure 6). In addition, for all learners but SVM, a better performance was observed when NRI indices were included in the feature set (i.e., NRI-VI, HR-NRI, and HR-NRI-VI).

4.2. Performance vs. Plot Characteristics

The large differences in RMSE obtained on different test folds can be attributed to model overfitting (Table 4). An RMSE of 54.26 p.p. reveals the model’s inability to predict tree defoliation on this plot (Laukiz2). Laukiz2 differs highly in the distribution of the response variable defoliation compared to all other plots (Figure 1). In the prediction scenario for Laukiz2, the model was trained on data containing mostly medium-to-high defoliation values and only few low ones. This caused overfitting on the medium-to-high values, degrading the model’s predictive performance in other scenarios. When Laukiz2 was in the training set, the overall mean RMSE was reduced by up to 50% with single fold performances as good as 9 p.p. RMSE (with Luiando as test set).
There was also no clear pattern in the percentage of features selected based on hyperparameter tuning (Table 7). The optimal value for the number of features (interpreted as a percentage of available features), which are selected from the ranked filter results, is determined by the internal surrogate learner of the MBO tuning method using the results from the previous tuning iterations. Due to this iterative approach, MBO is in some ways able to evaluate how well a learning algorithm plays together with a certain amount of selected features and is subsequently able to adjust the number of variables to an optimal value. In general, considering SVM’s relative success, the use of at least a few hundred features from the combined feature set appears to be beneficial, or at least not harmful when the model’s built-in regularization is capable of dealing with the resulting high-dimensional situation.
Realizing early during hyperparameter optimization that only a few features are needed to reach adequate performances can reduce the overall computational runtime substantially. Hence, regardless of the potential advantage of using filters for increased predictive performance, these can have a strong positive effect on runtime, especially of models making use of hyperparameters that depend on the available number of features, such as RF with m t r y .
Ultimately, the results of Table 7 should be taken with care, as they rely on single model–filter combinations and are subject to random variation. More in-depth research is needed to investigate the effect of filters on criteria other than performance (such as runtime), leading to a multi-criteria optimization problem.

4.3. Feature Selection Methods

The usefulness of filters with respect to predictive performance in this study varied. While the performance of some models (up to 5 p.p. for RF and XGBoost) was improved by specific filters, some models achieved a poorer performance with filters than without them (Figure 4). There was no pattern of specific filters consistently resulting in better scores. Hence, it is recommended to test multiple filters in a study if it is intended to use filters. While filters can improve the performance of models, they may be more appealing based on other aspects than performance. Reducing variables can reduce computational efforts in high-dimensional scenarios and may enhance the interpretability of models. Filters are a lot cheaper to compute than wrapper methods, and the final feature subset selection can be integrated as an additional hyperparameter into the model optimization stage.
Models that used the Borda ensemble method in this study did not perform better on average than models that used a single filter or no filter at all. Ensemble methods have higher stability and robustness than single ones and have shown promising results in [34]. Hence, their expected main advantage is stable performances across datasets with varying characteristics. Single filter methods might yield better model performances on certain datasets but fail on others. The fact that this study used multiple feature sets but only one dataset and tested many single filters could be a potential explanation of why, in all cases, a single filter outperformed the ensemble filter. However, studies that use ensemble filters are still rare, and these are usually not compared against single filters [70]. In summary, in this study, Borda did not perform better than a randomly selected filter method. More case studies applying ensemble filter methods are needed to verify this finding. Nevertheless, ensemble filters can be a promising addition to an ML feature selection portfolio.
PCA, acting as a filter method, more often showed less than optimal results, especially for algorithms RF and XGBoost. XGBoost in particular had substantial problems when using PCA as a filter method and accounted for four of the six worst results (Table 6). However, PCA was able to reduce model fitting times substantially across all algorithms. Depending on the use case, PCA can be an interesting option to reduce dimensionality while keeping runtime low. However, information about the total number of features used by the model is lost when applying this technique. Since filter scores only need to be calculated once for a given dataset in a benchmark setting, the runtime advantage of a PCA vs. filter methods might in fact be negligible in practice.

4.4. Linking Feature Importance to Spectral Characteristics

Unsurprisingly, the most important features for both HR and VI datasets were identified around the red edge of the spectra, specifically in the range of 680 nm to 750 nm.
This area has the highest ability to distinguish between reflectances related to a high density/high foliage density and thus the health status of vegetation and its respective counterpart [71]. However, four out of ten of the most important features of dataset HR are located between 920 nm and 1000 nm. Looking at the spectral curves of the plots, apparent reflectance differences can be observed in this spectral range—especially for plot Oiartzun—which might explain why these features were considered important by the model.
A possible explanation for the poor performances of most models scored on the VI dataset compared to all other feature sets could be the lack of features covering the area between 850 nm and 1000 nm (Figure 6). The majority of VI features covers the range between 550–800 nm. Only one index (PWI) covers information in the range beyond 900 nm.

4.5. Data Quality

Environmental datasets always come with some constraints that can have potential influence on the modeling process and its outcome. Finding a suitable approach to extract the remote sensing information from each tree was a complex process. Due to the reported geometric offset of up to one meter within the hyperspectral data, the risk of assigning a value to an observation that would actually refer to a different, possibly non-tree, pixel was reasonably high. It was concluded that using a buffer radius of one meter can be a good compromise between the inclusion of information from too many surrounding trees and an under-coverage of the tree crown. With the chosen radius, we are confident that we were able to map individual tree crowns while accounting for a possible geometric offset. This results in all cases in four contributing pixels (=four square meters) for the extraction of hyperspectral information for a given tree. Even though no results showing the influence of different buffer values on the extraction were provided, it is hypothesized that the relationships between features would not change substantially, leading to almost identical model results. Instead of using a buffer to extract the hyperspectral information, segmentation could have been considered. However, this method would have required more effort for no clear added value in our view and would have moved the focus of this manuscript more to data preprocessing and away from feature selection methods.
Trees located within grid cells on the border of a plot are a notable exception where the exact number of pixels contributing to the observation’s feature value may be reduced since the image was cropped to the plot’s extent. Cropping was applied to avoid the accidental inclusion of background data such as forest roads. However, this effect was deemed to be of negligible importance.
The available hyperspectral data covered a wavelength between 400 nm and 1000 nm. Hence, the spectral range of the shortwave infrared (SWIR) region is not covered in this study. Given that this range is often used in forest health studies [72], e.g., when calculating the normalized difference moisture index (NDMI) index [73], this marks a clear limitation of the dataset at hand.
The dataset consists of in situ data collected during September 2016, which was matched against remote sensing data acquired at the end of September 2016. A multi-temporal dataset consisting of in situ data from different phenology stages would possibly improve the achieved model performances. However, this would also require the costly acquisition of hyperspectral data of these additional timestamps.
The R package hsdar was used for the calculation of vegetation indices [74]. All indices that could be calculated with the given spectral range of the data (400–1000 nm) were used. This means that even though Table A2 lists all indices available in the package, not all listed indices were used in this study. Although this selection included a large number of indices, some possibly helpful indices might have been missed due to the restriction of the hyperspectral data.
Overall, the magnitude of uncertainty introduced by the mentioned effects during index derivation cannot be quantified. Such limitations and uncertainties apply to most environmental studies and cannot be completely avoided.

4.6. Practical Implications on Defoliation and Tree Health Mapping

Even though this work has a strong methodological focus by comparing different benchmark settings on highly correlated feature sets, implications on tree health should be briefly discussed in the following. Due to the outlined dataset issues in Section 4.5, which are mainly responsible for the resulting poor model performances, the trained models are not suited for practical use, e.g., to predict defoliation in unknown areas, due to the high mapping uncertainty. However, the general approach of utilizing hyperspectral data to classify the health status of trees partly led to promising results. For example, due to the narrow bandwidth of the hyperspectral sensor, small parts of the spectrum (mainly in the infrared region) were of higher importance to the models (e.g., see Figure 6), meaning that they helped the models to distinguish between low and high tree defoliation. If spatial offset errors of the image data and possible background noise can be reduced (possibly by making use of image segmentation), we believe that model performances could be substantially enhanced. Such improved models, starting around an RMSE of 20% and less, should be able to provide added value to support the long-term monitoring of forest health and early detection of fungi-affected tree plots. Nevertheless, overall the use of defoliation as a proxy for forest health should be critically reconsidered as it comes with various practical issues, starting from potential offsets during data collection, varying leaf density due to tree age, and differing effects between tree species, to name just a few.

4.7. Comparison to Other Studies

While most defoliation studies operate on the plot level using coarser resolution multispectral satellite data [10,75,76], there are also several recent studies using airborne or ground-based sensors at the tree level. Among these, refs. [77,78] used ground-level methods, such as airborne laser scanning (ALS) and light detection and ranging (LiDAR).
Studies focusing on tree-level defoliation mainly used ground-level methods, such as ALS or LiDAR [77,78]. Ref. [77] used ordinary least squares (OLS) regression methods while [78] retrieving information from ground-level RGB photos using convolutional neural networks (CNN). However, neither of them used spatial CV for model assessment, and [78] did not perform feature selection (FS). The authors of [79] used a partial least squares (PLS) model with high-resolution digital aerial photogrammetry (DAP) to predict cumulative defoliation caused by the spruce budworm. Study results indicated that spectral features were found to be most helpful for the model. Incorporating such features (both spectral and structural) could be a possible enhancement for future works. No studies were found to model defoliation caused by Diplodia sapinea (Fr.) Fuckel with remote sensing data, and most studies focused on describing the tree conditions based on local sampling [80,81].
The field of (hyperspectral) remote sensing has had a strong focus on using RF for modeling in recent years [82]. However, in high-dimensional scenarios, tuning the parameter m t r y becomes computationally expensive. To account for this and the high dimensionality in general, studies used feature selection approaches, such as semi-supervised feature extraction [83], wrapper methods [84,85,86], PCA, and adjusted feature selection [87]. In general, applying feature selection methods on hyperspectral datasets has shown to be effective, regardless of the method used [88,89]. However, no studies were found that made explicit use of filter methods in combination with hyperparameter tuning in the field of (hyperspectral) remote sensing. Potential reasons for this absence could be an easier programmatic access to wrapper methods and a higher general awareness of these compared to filter methods. Applying the filter-based feature selection methodology shown in this study and its related code provided in the research compendium might be a helpful reference for future studies using hyperspectral remote sensing data.
When looking for remote sensing studies that compare multiple models, it turned out that these often operate in a low-dimensional predictor space [90] or use wrapper methods explicitly [86].
Refs. [91,92] are more similar in their methodology but focus on a different response variable (woody cover). Ref. [91] used machine learning with ALS data to study dieback of trees in eucalyptus forests. A grid search was used for hyperparameter tuning and forward feature selection (FFS) for variable selection. Ref. [92] analyzed woody cover in South Africa using a spatial CV and FS approach [93] with an RF classifier. Ref. [94] shows a similar setup; they used hyperspectral vegetation indices and a nested CV approach for performance estimation, and they estimated variable importance targeting woody biomass as the response. In the results, lasso showed the best performance among the chosen methods. However, the authors did not optimize the hyperparameters of RF, which makes a fair comparison problematic since the other models used internal optimization. The discussion section of [94] lists additional studies that made use of shrinkage models for high-dimensional remote sensing modeling.
In summary, no studies could be found that used filter methods for FS or made use of NRI indices in their work and had a relation to tree health. This might relate to the fact that most environmental datasets are not high dimensional. In fact, many studies use fewer than ten features, and issues related to correlations are often solved manually instead of relying on an automated approach. These manual approaches might suffer from subjectivity and may limit the reproducibility of results.
Other fields (e.g., bioinformatics) encounter high-dimensional datasets more often. Hence, more studies using (filter-based) feature selection approaches can be found in this field [95,96]. However, bioinformatics differs conceptually in many ways from environmental modeling, and, therefore, no greater focus was put into comparing studies of this field. The availability of high-dimensional feature sets will increase in the future due to higher temporal and spectral resolutions of sensors. In addition, a high-spatial resolution comes with the possibility of calculating many textural features. Hence, the ability to deal with high-dimensional datasets becomes more important, and unbiased robust approaches are needed. We hope that this work and its methodology raise awareness about the application of filter methods to tackle high-dimensional problems in the environmental modeling field.

5. Conclusions

This study analyzed the effectiveness of filter-based feature selection in improving various machine-learning models of defoliation of trees in northern Spain based on hyperspectral remote-sensing data. Substantial differences in performance occurred depending on which feature selection and machine learning methods were combined. SVM showed the most robust behavior across all highly correlated datasets and was able to predict the response variable of this study substantially better than other methods.
Filter methods were able to improve the predictive performance on datasets in some instances, although there was no clear and systematic pattern. Their effectiveness depends on the algorithm and the dataset characteristics. Ensemble filter methods did not show a substantial improvement over individual filter methods in this study.
The addition of derived feature sets was, in most cases, able to improve predictive performance. In contrast, feature sets that focused on only a small fraction of the available spectral range (i.e., dataset VI) showed a worse performance than the ones that covered a wider range (400–1000 nm; HR, NRI). NRIs can be seen as a valuable addition to the optimization of predictive performance in the remote sensing of vegetation.
Features along the red-edge wavelength region were most important for models during prediction. With respect to dedicated vegetation indices, all versions of the Vogelmann index were seen as the most important indices for the best performing SVM model. This matches well with the actual purpose of these indices—they were invented to detect defoliation on sugar maple trees (Acer saccharum Marsh.) caused by pear thrips (Taeniothrips inconsequens Uzel) [97]. However, assessing feature importance for highly correlated features remains a challenging task. Results might be biased and should be taken with care to avoid overgeneralizing from individual studies.
Finally, the potential of predicting defoliation with the given study design was rather limited with respect to the average RMSE of 28 p.p. scored by the best performing model. More training data covering a wider range of defoliation values in a larger number of forest plantations are needed to train better models that can create more robust predictions.

Author Contributions

Conceptualization, P.S. and A.B.; data curation, P.S. and E.I.; formal analysis, P.S., J.C., B.B. and A.B.; funding acquisition, A.B.; investigation, P.S.; methodology, P.S., J.M., J.C. and B.B.; project administration, A.B.; resources, E.I.; software, P.S.; supervision, B.B. and A.B.; validation, P.S. and A.B.; visualization, P.S.; writing—original draft, P.S.; Writing—review and editing, J.M., J.C. and A.B. All authors have read and agreed to the published version of the manuscript.

Funding

This work was funded by the EU LIFE Healthy Forest project (LIFE14 ENV/ES/000179) and the German Scholars Organization/Carl Zeiss Foundation.

Data Availability Statement

The data presented in this study are openly available in Zenodo at https://doi.org/10.5281/zenodo.2635403 (accessed on 22 November 2021).

Acknowledgments

We acknowledge support by the German Research Foundation and the Open Access Publication Fund of the Thueringer Universitaets- und Landesbibliothek Jena Projekt-Nr. 433052568.

Conflicts of Interest

The authors declare no conflict of interest. The funders had no role in the design of the study; in the collection, analyses, or interpretation of data; in the writing of the manuscript; or in the decision to publish the results.

Abbreviations

The following abbreviations are used in this manuscript:
AGBabove-ground biomass
ALEaccumulated local effects
ALSairborne laser scanning
ANNartificial neural network
AUROCarea under the receiver operating characteristics curve
BRTboosted regression trees
CARTclassification and regression trees
CNNconvolutional neural networks
CVcross-validation
DAPdigital aerial photogrammetry
ENMenvironmental niche modeling
FFSforward feature selection
FPRfalse positive rate
FSfeature selection
GAMgeneralized additive model
GBMgradient boosting machine
GLMgeneralized linear model
ICGCInstitut Cartografic i Geologic de Catalunya
IQRinterquartile range
LiDARlight detection and ranging
LOWESSlocally weighted scatter plot smoothing
MARSmultivariate adaptive regression splines
MBOmodel-based optimization
MEMmaximum entropy model
MLmachine learning
NDIInormalized difference infrared index
NDMInormalized difference moisture index
NIRnear-infrared
NRInormalized ratio index
OLSordinary least squares
OMNBRoptimized multiple narrow-band reflectance
PCAprincipal component analysis
PDPpartial dependence plots
PISRpotential incoming solar radiation
PLSpartial least-squares
POVproportion of variance explained
RBFradial basis function
RFrandom forest
RMSEroot mean square error
RRridge regression
RSSresidual sum of squares
SARsynthetic aperture radar
SDMspecies distribution modeling
SMBOsequential-based model optimization
SVMsupport vector machine
TPRtrue positive rate
VIvegetation index
XGBoostextreme gradient boosting

Appendix A

Appendix A.1

Figure A1. Spearman correlations of NRI feature rankings obtained with different filters. Filter names refer to the nomenclature used by the mlr R package. Underscores in names divide the terminology into their upstream R package and the actual filter name.
Remotesensing 13 04832 g0a1

Appendix A.2

Table A1. Hyperparameter ranges and types for each model. Hyperparameter notations from the respective R packages are shown.
Model
(Package)
HyperparameterTypeStartEndDefault
RF
(ranger)
x t r y dbl00.5-
min.node.sizeint1101
sample.fractiondbl0.20.91
SVM
(kernlab)
Cdbl 2 10 2 10 1
σ dbl 2 5 2 5 1
XGBoost
(xgboost)
nroundsint1070-
colsample_bytreedbl0.611
subsampledbl0.611
max_depthint3156
gammaint0.05100
etadbl0.110.3
min_child_weightint171

Appendix A.3

Table A2. List of available vegetation indices in the hsdar package.
NameFormulaReference 
Boochs D 703 [98]
Boochs2 D 720 [98]
CAI 0.5 × ( R 2000 + R 2200 ) R 2100 [99]
CARI a = ( R 700 R 550 ) / 150 [100]
b = R 550 ( a × 550 )
R 700 × | ( a × 670 + R 670 + b ) R 670 × ( a 2 + 1 ) | 0.5
Carter R 695 / R 420 [101]
Carter2 R 695 / R 760 [101]
Carter3 R 605 / R 760 [101]
Carter4 R 710 / R 760 [101]
Carter5 R 695 / R 670 [101]
Carter6 R 550 [101]
CI R 675 × R 690 / R 683 2 [102]
CI 2 R 760 / R 700 1 [103]
ClAInt 600   nm 735   nm R [104]
CRI1 1 / R 515 1 / R 550 [103]
CRI2 1 / R 515 1 / R 770 [103]
CRI3 1 / R 515 1 / R 550 × R 770 [103]
CRI4 1 / R 515 1 / R 700 × R 770 [103]
D1 D 730 / D 706 [102]
D2 D 705 / D 722 [102]
Datt ( R 850 R 710 ) / ( R 850 R 680 ) [105]
Datt2 R 850 / R 710 [105]
Datt3 D 754 / D 704 [105]
Datt4 R 672 / ( R 550 × R 708 ) [106]
Datt5 R 672 / R 550 [106]
Datt6 ( R 860 ) / ( R 550 × R 708 ) [106]
Datt7 ( R 860 R 2218 ) / ( R 860 R 1928 ) [107]
Datt8 ( R 860 R 1788 ) / ( R 860 R 1928 ) [107]
DD ( R 749 R 720 ) ( R 701 R 672 ) [108]
DDn 2 × ( R 710 R 660 R 760 ) [109]
DPI ( D 688 D 710 ) / D 697 2 [102]
DWSI1 R 80 / R 1660 [110]
DWSI2 R 1660 / R 550 [110]
DWSI3 R 1660 / R 680 [110]
DWSI4 R 550 / R 680 [110]
DWSI5 ( R 800 + R 550 ) / ( R 1660 + R 680 ) [110]
EGFN ( max ( D 650 : 750 ) max ( D 500 : 550 ) ) ( max ( D 650 : 750 ) + max ( D 500 : 550 ) ) [111]
EGFR max ( D 650 : 750 ) / max ( D 500 : 550 ) [111]
EVI 2.5 × ( R 800 R 670 ) ( R 800 ( 6 × R 670 ) ( 7.5 × R 475 ) + 1 ) [112]
GDVI ( R 800 n R 680 n ) / ( R 800 n + R 680 n ) [113]
GI R 554 / R 677 [114]
Gitelson 1 / R 700 [115]
Gitelson2 ( R 750 R 800 / R 695 R 740 ) 1 [103]
GMI1 R 750 / R 550 [103]
GMI2 R 750 / R 700 [103]
Green NDVI R 800 R 550 R 800 + R 550 [116]
LWVI_1 ( R 1094 R 983 ) ( R 1094 + R 983 ) [117]
LWVI_2 R 1094 R 1205 R 1094 + R 1205 [117]
Maccioni R 780 R 710 ) R 780 R 680 [118]
MCARI ( ( R 700 R 670 ) 0.2 × ( R 700 R 550 ) ) × ( R 700 / R 670 ) [119]
MCARI2 ( ( R 750 R 705 ) 0.2 × ( R 750 R 550 ) ) × ( R 750 / R 705 ) [120]
mND705 ( R 750 R 705 ) R 750 + R 705 2 × R 445 [121]
mNDVI ( R 800 R 680 ) R 800 + R 680 2 × R 445 [121]
MPRI R 515 R 530 R 515 + R 530 [122]
MSAVI 0.5 × ( ( 2 × R 800 + 1 ) 2 8 × ( R 800 R 670 ) ) 0.5 [123]
MSI R 1600 R 817 [124]
mSR R 800 R 445 R 680 R 445 [121]
mSR2 ( R 750 / R 705 ) 1 R 750 / R 705 + 1 ) 0.5 [125]
mSR705 R 750 R 445 R 705 R 445 [121]
MTCI R 754 R 709 R 709 R 681 [126]
MTVI 1.2 × ( 1.2 × ( R 800 R 550 ) 2.5 × ( R 670 R 550 ) ) [127]
NDLI l o g ( 1 / R 1754 ) l o g ( 1 / R 1680 ) l o g ( 1 / R 1754 ) + l o g ( 1 / R 1680 ) [128]
NDNI l o g ( 1 / R 1510 ) l o g ( 1 / R 1680 ) l o g ( 1 / R 1510 ) + l o g ( 1 / R 1680 ) [128]
NDVI R 800 R 680 R 800 + R 680 [129]
NDVI2 R 750 R 705 R 750 + R 705 [130]
NDVI3 R 682 R 553 R 682 + R 553 [131]
NDWI R 860 R 1240 R 860 + R 1240 [73]
NPCI R 680 R 430 R 680 + R 430 [111]
OSAVI ( 1 + 0.16 ) × ( R 800 R 670 ) R 800 + R 670 + 0.16 [132]
OSAVI2 ( 1 + 0.16 ) × ( R 750 R 705 ) R 750 + R 705 + 0.16 ) [120]
PARS R 746 R 513 [133]
PRI R 531 R 570 R 531 + R 570 [134]
PRI_norm P R I × ( 1 ) R D V I × R 700 / R 670 [135]
PRI ∗ CI2 P R I C I 2 [136]
PSRI R 678 R 500 R 750 [137]
PSSR R 800 R 635 [138]
PSND R 800 R 470 R 800 R 470 [138]
PWI R 900 R 970 [139]
RDVI R 800 R 670 R 800 + R 670 [140]
REP_LERed-edge position through linear extrapolation [141]
REP_Li R r e = R 670 + R 780 2 [142]
700 + 40 × ( R r e R 700 ) ( R 740 R 700 ) )
SAVI ( 1 + L ) × ( R 800 R 670 ) ( R 800 + R 670 + L ) [143]
SIPI R 800 R 445 R 800 R 680 [144]
SPVI 0.4 × 3.7 × ( R 800 R 670 ) 1.2 × ( ( R 530 R 670 ) 2 ) 0.5 [145]
SR R 800 R 680 [146]
SR1 R 750 R 700 [147]
SR2 R 752 R 690 [147]
SR3 R 750 R 550 [147]
SR4 R 700 R 670 [148]
SR5 R 675 R 700 [133]
SR6 R 750 R 710 [149]
SR7 R 440 R 690 [150]
SR8 R 515 R 550 [151]
SRPI R 430 R 680 [144]
SRWI R 850 R 1240    [102]
Sum_Dr1 i = 626 795 D 1 i    [152]
Sum_Dr2 i = 680 780 D 1 i [153]
SWIR FI R 2133 2 R 2225 × R 2209 3 [154]
SWIR LI 3.87 × ( R 2210 R 2090 ) 27.51 × ( R 2280 R 2090 ) 0.2 [155]
SWIR SI 41.59 × ( R 2210 R 2090 ) + 1.24 × ( R 2280 R 2090 ) + 0.64 [155]
SWIR VI 37.72 × ( R 2210 R 2090 ) + 6.27 × ( R 2280 R 2090 ) + 0.57 [155]
TCARI 3 ( ( R 700 R 670 ) 0.2 × R 700 R 550 ) × ( R 700 / R 670 ) ) [127]
TCARI/OSAVITCARI/OSAVI [127]
TCARI2 3 × ( ( R 750 R 705 ) 0.2 × ( R 750 R 550 ) × ( R 750 / R 705 ) ) [120]
TCARI2/OSAVI2TCARI2/OSAVI2 [120]
TGI 0.5 ( 190 ( R 670 R 550 ) 120 ( R 670 R 480 ) ) [156]
TVI 0.5 × ( 120 × ( R 750 R 550 ) 200 × ( R 670 R 550 ) ) [157]
Vogelmann R 740 R 720 [97]
Vogelmann2 R 734 R 747 R 715 + R 726 [97]
Vogelmann3 D 715 D 705 [97]
Vogelmann4 R 734 R 747 R 715 + R 720 [97]

Appendix A.4

The following information was provided by the Institut Carogràfic i Geològic de Catalunya, which was in charge of image acquisition and data preprocessing.
The AISA EAGLE-II sensor was used for airborne image acquisition with a field of view of 37.7 °. Its spectral resolution is 2.4 nm and ranges from 400 nm to 1000 nm.
The conversion of digital numbers (DN) to spectral radiance was made using software designed for the instrument. Images were originally scaled in 12 bits but were radiometrically calibrated to 16 bits, reserving the highest value (65,535) for null values. The procedure was applied to the 23 previously selected images. Finally, the geometric and atmospheric corrections were applied to the images.
The aim of this procedure was to reduce the positional errors of the images. The cartographic reference system in use was EPSG 25830. Positioning was achieved by coupling an Applanix POS AV 410 system to the sensor, integrating GPS and IMU systems. The system provides geographic coordinates of the terrain and relative coordinates of the aircraft (attitude) at each scanned line. Additionally a DSM from GeoEuskadi with a spatial resolution of 1 m was used. The orthorectified hyperspectral images were compared to orthoimages (1:5000) from GeoEuskadi. This comparison was used as the base to calculate RMSE, which was below the ground sampling distance in the across and along track directions.
The radiance measured by an instrument depends on the illumination geometry and the reflective properties of the observed surface. Radiation may be absorbed or scattered (Rayleigh and Mie scattering). Scattering is responsible for the adjacency effect, i.e., radiation coming from neighbors’ areas to the target pixel. The MODTRAN algorithm was used to model the effect of the atmosphere on the radiation. To represent the aerosols of the study area, the rural model was used. In addition, optical thickness was estimated on pixels with a high vegetation cover. Columnar water vapor was estimated by a linear regression ratio where the spectral radiance of each pixel at the band of the maximum water absorption (906 nm) is compared to its theoretical value in the absence of absorption. Nonetheless, this technique is unreliable in the presence of a spectral resolution as in this case. To resolve this, the water vapor parameter was selected manually according to the smoothness observed on the reflectance peak at 960 nm. This was combined with a mid-latitude summer atmosphere model. The output of this procedure was reflectance from the target pixel scaled between 0 and 10,000.
The image acquisitions were originally attempted during one day (29 October 2016). Due to the variable meteorological conditions, some stands had to be imaged one day later.

References

  1. Lary, D.J.; Alavi, A.H.; Gandomi, A.H.; Walker, A.L. Machine Learning in Geosciences and Remote Sensing. Geosci. Front. 2016, 7, 3–10. [Google Scholar] [CrossRef] [Green Version]
  2. Ma, Y.; Wu, H.; Wang, L.; Huang, B.; Ranjan, R.; Zomaya, A.; Jie, W. Remote Sensing Big Data Computing: Challenges and Opportunities. Future Gener. Comput. Syst. 2015, 51, 47–60. [Google Scholar] [CrossRef] [Green Version]
  3. Mascaro, J.; Asner, G.P.; Knapp, D.E.; Kennedy-Bowdoin, T.; Martin, R.E.; Anderson, C.; Higgins, M.; Chadwick, K.D. A Tale of Two “Forests”: Random Forest Machine Learning Aids Tropical Forest Carbon Mapping. PLoS ONE 2014, 9, e85993. [Google Scholar] [CrossRef]
  4. Urban, M.; Berger, C.; Mudau, T.E.; Heckel, K.; Truckenbrodt, J.; Onyango Odipo, V.; Smit, I.P.J.; Schmullius, C. Surface Moisture and Vegetation Cover Analysis for Drought Monitoring in the Southern Kruger National Park Using Sentinel-1, Sentinel-2, and Landsat-8. Remote Sens. 2018, 10, 1482. [Google Scholar] [CrossRef] [Green Version]
  5. Hawryło, P.; Bednarz, B.; Wezyk, P.; Szostak, M. Estimating Defoliation of Scots Pine Stands Using Machine Learning Methods and Vegetation Indices of Sentinel-2. Eur. J. Remote Sens. 2018, 51, 194–204. [Google Scholar] [CrossRef] [Green Version]
  6. Pollastrini, M.; Feducci, M.; Bonal, D.; Fotelli, M.; Gessler, A.; Grossiord, C.; Guyot, V.; Jactel, H.; Nguyen, D.; Radoglou, K.; et al. Physiological Significance of Forest Tree Defoliation: Results from a Survey in a Mixed Forest in Tuscany (Central Italy). For. Ecol. Manag. 2016, 361, 170–178. [Google Scholar] [CrossRef]
  7. Gottardini, E.; Cristofolini, F.; Cristofori, A.; Pollastrini, M.; Camin, F.; Ferretti, M. A Multi-Proxy Approach Reveals Common and Species-Specific Features Associated with Tree Defoliation in Broadleaved Species. For. Ecol. Manag. 2020, 467, 118151. [Google Scholar] [CrossRef]
  8. Oliva, J.; Stenlid, J.; Grönkvist-Wichmann, L.; Wahlström, K.; Jonsson, M.; Drobyshev, I.; Stenström, E. Pathogen-Induced Defoliation of Pinus Sylvestris Leads to Tree Decline and Death from Secondary Biotic Factors. For. Ecol. Manag. 2016, 379, 273–280. [Google Scholar] [CrossRef]
  9. Zhang, K.; Thapa, B.; Ross, M.; Gann, D. Remote Sensing of Seasonal Changes and Disturbances in Mangrove Forest: A Case Study from South Florida. Ecosphere 2016, 7, e01366. [Google Scholar] [CrossRef] [Green Version]
  10. Townsend, P.A.; Singh, A.; Foster, J.R.; Rehberg, N.J.; Kingdon, C.C.; Eshleman, K.N.; Seagle, S.W. A General Landsat Model to Predict Canopy Defoliation in Broadleaf Deciduous Forests. Remote Sens. Environ. 2012, 119, 255–265. [Google Scholar] [CrossRef]
  11. Jiang, Y.; Wang, T.; de Bie, C.A.J.M.; Skidmore, A.K.; Liu, X.; Song, S.; Zhang, L.; Wang, J.; Shao, X. Satellite-Derived Vegetation Indices Contribute Significantly to the Prediction of Epiphyllous Liverworts. Ecol. Indic. 2014, 38, 72–80. [Google Scholar] [CrossRef]
  12. Adamczyk, J.; Osberger, A. Red-Edge Vegetation Indices for Detecting and Assessing Disturbances in Norway Spruce Dominated Mountain Forests. Int. J. Appl. Earth Obs. Geoinf. 2015, 37, 90–99. [Google Scholar] [CrossRef]
  13. Thenkabail, P.S.; Lyon, J.G.; Huete, A. (Eds.) Hyperspectral Indices and Image Classifications for Agriculture and Vegetation; CRC Press: Boca Raton, FL, USA, 2018. [Google Scholar] [CrossRef]
  14. Thenkabail, P.S.; Smith, R.B.; De Pauw, E. Hyperspectral Vegetation Indices and Their Relationships with Agricultural Crop Characteristics. Remote Sens. Environ. 2000, 71, 158–182. [Google Scholar] [CrossRef]
  15. Cai, J.; Luo, J.; Wang, S.; Yang, S. Feature Selection in Machine Learning: A New Perspective. Neurocomputing 2018, 300, 70–79. [Google Scholar] [CrossRef]
  16. Pinto, J.; Powell, S.; Peterson, R.; Rosalen, D.; Fernandes, O. Detection of Defoliation Injury in Peanut with Hyperspectral Proximal Remote Sensing. Remote Sens. 2020, 12, 3828. [Google Scholar] [CrossRef]
  17. Yu, R.; Ren, L.; Luo, Y. Early Detection of Pine Wilt Disease in Pinus Tabuliformis in North China Using a Field Portable Spectrometer and UAV-Based Hyperspectral Imagery. For. Ecosyst. 2021, 8, 44. [Google Scholar] [CrossRef]
  18. Lin, H.; Yan, E.; Wang, G.; Song, R. Analysis of Hyperspectral Bands for the Health Diagnosis of Tree Species. In Proceedings of the 2014 Third International Workshop on Earth Observation and Remote Sensing Applications (EORSA), Changsha, China, 11–14 June 2014; pp. 448–451. [Google Scholar] [CrossRef]
  19. Kayet, N.; Pathak, K.; Chakrabarty, A.; Singh, C.P.; Chowdary, V.M.; Kumar, S.; Sahoo, S. Forest Health Assessment for Geo-Environmental Planning and Management in Hilltop Mining Areas Using Hyperion and Landsat Data. Ecol. Indic. 2019, 106, 105471. [Google Scholar] [CrossRef]
  20. Dash, J.P.; Watt, M.S.; Pearse, G.D.; Heaphy, M.; Dungey, H.S. Assessing Very High Resolution UAV Imagery for Monitoring Forest Health during a Simulated Disease Outbreak. ISPRS J. Photogramm. Remote Sens. 2017, 131, 1–14. [Google Scholar] [CrossRef]
  21. Trunk, G.V. A Problem of Dimensionality: A Simple Example. IEEE Trans. Pattern Anal. Mach. Intell. 1979, PAMI-1, 306–307. [Google Scholar] [CrossRef]
  22. Xu, H.; Caramanis, C.; Mannor, S. Statistical Optimization in High Dimensions. Oper. Res. 2016, 64, 958–979. [Google Scholar] [CrossRef] [Green Version]
  23. Mesanza, N.; Iturritxa, E.; Patten, C.L. Native Rhizobacteria as Biocontrol Agents of Heterobasidion Annosum s.s. and Armillaria Mellea Infection of Pinus Radiata. Biol. Control 2016, 101, 8–16. [Google Scholar] [CrossRef]
  24. Iturritxa, E.; Trask, T.; Mesanza, N.; Raposo, R.; Elvira-Recuenco, M.; Patten, C.L. Biocontrol of Fusarium Circinatum Infection of Young Pinus Radiata Trees. Forests 2017, 8, 32. [Google Scholar] [CrossRef] [Green Version]
  25. Iturritxa, E.; Mesanza, N.; Brenning, A. Spatial Analysis of the Risk of Major Forest Diseases in Monterey Pine Plantations. Plant Pathol. 2014, 64, 880–889. [Google Scholar] [CrossRef]
  26. Ganley, R.J.; Watt, M.S.; Manning, L.; Iturritxa, E. A Global Climatic Risk Assessment of Pitch Canker Disease. Can. J. For. Res. 2009, 39, 2246–2256. [Google Scholar] [CrossRef]
  27. Innes, J. Methods to Estimate Forest Health. Silva Fenn. 1993, 27. [Google Scholar] [CrossRef] [Green Version]
  28. MacLean, D.A.; Lidstone, R.G. Defoliation by Spruce Budworm: Estimation by Ocular and Shoot-Count Methods and Variability among Branches, Trees, and Stands. Can. J. For. Res. 1982, 12, 582–594. [Google Scholar] [CrossRef]
  29. Johnstone, I.M.; Titterington, D.M. Statistical Challenges of High-Dimensional Data. Philos. Trans. R. Soc. A Math. Phys. Eng. Sci. 2009, 367, 4237–4253. [Google Scholar] [CrossRef] [Green Version]
  30. Bommert, A.; Sun, X.; Bischl, B.; Rahnenführer, J.; Lang, M. Benchmark for Filter Methods for Feature Selection in High-Dimensional Classification Data. Comput. Stat. Data Anal. 2020, 143, 106839. [Google Scholar] [CrossRef]
  31. Das, S. Filters, Wrappers and a Boosting-Based Hybrid for Feature Selection; ICML, Citeseer: University Park, PA, USA, 2001. [Google Scholar]
  32. Guyon, I.; Elisseeff, A. An Introduction to Variable and Feature Selection. J. Mach. Learn. Res. 2003, 3, 1157–1182. [Google Scholar]
  33. Jolliffe, I.; Cadima, J. Principal Component Analysis: A Review and Recent Developments. Philos. Trans. R. Soc. A Math. Phys. Eng. Sci. 2016, 374, 20150202. [Google Scholar] [CrossRef]
  34. Drotár, P.; Šimoňák, S.; Pietriková, E.; Chovanec, M.; Chovancová, E.; Ádám, N.; Szabó, C.; Baláž, A.; Biňas, M. Comparison of Filter Techniques for Two-Step Feature Selection. Comput. Inform. 2017, 36, 597–617. [Google Scholar] [CrossRef]
  35. Drotár, P.; Gazda, J.; Smékal, Z. An Experimental Comparison of Feature Selection Methods on Two-Class Biomedical Datasets. Comput. Biol. Med. 2015, 66, 1–10. [Google Scholar] [CrossRef]
  36. Abeel, T.; Helleputte, T.; Van de Peer, Y.; Dupont, P.; Saeys, Y. Robust Biomarker Identification for Cancer Diagnosis with Ensemble Feature Selection Methods. Bioinformatics 2010, 26, 392–398. [Google Scholar] [CrossRef]
  37. Dietterich, T.G. Ensemble Methods in Machine Learning. In Proceedings of the First International Workshop on Multiple Classifier Systems, Cagliari, Italy, 21–23 June 2000; Springer: Berlin/Heidelberg, Germany, 2000; pp. 1–15. [Google Scholar]
  38. Polikar, R. Ensemble Learning. In Ensemble Machine Learning: Methods and Applications; Zhang, C., Ma, Y., Eds.; Springer: Boston, MA, USA, 2012; pp. 1–34. [Google Scholar] [CrossRef]
  39. Feurer, M.; Klein, A.; Eggensperger, K.; Springenberg, J.; Blum, M.; Hutter, F. Efficient and Robust Automated Machine Learning. In Advances in Neural Information Processing Systems 28; Cortes, C., Lawrence, N.D., Lee, D.D., Sugiyama, M., Garnett, R., Eds.; Curran Associates, Inc.: Nice, France, 2015; pp. 2962–2970. [Google Scholar]
  40. Bolón-Canedo, V.; Alonso-Betanzos, A. Ensembles for Feature Selection: A Review and Future Trends. Inf. Fusion 2019, 52, 1–12. [Google Scholar] [CrossRef]
  41. Pearson, K. LIII. On Lines and Planes of Closest Fit to Systems of Points in Space. Lond. Edinb. Dublin Philos. Mag. J. Sci. 1901, 2, 559–572. [Google Scholar] [CrossRef] [Green Version]
  42. Quinlan, J.R. Induction of Decision Trees. Mach. Learn. 1986, 1, 81–106. [Google Scholar] [CrossRef] [Green Version]
  43. Zhao, X.M. Maximum Relevance/Minimum Redundancy (MRMR). In Encyclopedia of Systems Biology; Dubitzky, W., Wolkenhauer, O., Cho, K.H., Yokota, H., Eds.; Springer: New York, NY, USA, 2013; pp. 1191–1192. [Google Scholar] [CrossRef]
  44. Zuber, V.; Strimmer, K. High-Dimensional Regression and Variable Selection Using CAR Scores. Stat. Appl. Genet. Mol. Biol. 2011, 10, 1–27. [Google Scholar] [CrossRef] [Green Version]
  45. Kira, K.; Rendell, L.A. The Feature Selection Problem: Traditional Methods and a New Algorithm. In Proceedings of the Tenth National Conference on Artificial Intelligence, San Jose, CA, USA, 12–16 July 1992; AAAI Press: Menlo Park, CA, USA, 1992; pp. 129–134. [Google Scholar]
  46. Fleuret, F. Fast Binary Feature Selection with Conditional Mutual Information. J. Mach. Learn. Res. 2004, 5, 1531–1555. [Google Scholar]
  47. Shannon, C.E. A Mathematical Theory of Communication. Bell Syst. Tech. J. 1948, 27, 379–423. [Google Scholar] [CrossRef] [Green Version]
  48. Hastie, T.; Friedman, J.; Tibshirani, R. The Elements of Statistical Learning; Springer: New York, NY, USA, 2001. [Google Scholar] [CrossRef]
  49. Peña, M.; Liao, R.; Brenning, A. Using Spectrotemporal Indices to Improve the Fruit-Tree Crop Classification Accuracy. ISPRS J. Photogramm. Remote Sens. 2017, 128, 158–169. [Google Scholar] [CrossRef]
  50. Bischl, B.; Richter, J.; Bossek, J.; Horn, D.; Thomas, J.; Lang, M. mlrMBO: A Modular Framework for Model-Based Optimization of Expensive Black-Box Functions. arXiv 2017, arXiv:1703.03373. [Google Scholar]
  51. Binder, M.; Moosbauer, J.; Thomas, J.; Bischl, B. Multi-Objective Hyperparameter Tuning and Feature Selection Using Filter Ensembles. arXiv 2020, arXiv:1912.12912. [Google Scholar]
  52. Schratz, P.; Muenchow, J.; Iturritxa, E.; Richter, J.; Brenning, A. Hyperparameter Tuning and Performance Assessment of Statistical and Machine-Learning Algorithms Using Spatial Data. Ecol. Model. 2019, 406, 109–120. [Google Scholar] [CrossRef] [Green Version]
  53. Hutter, F.; Hoos, H.H.; Leyton-Brown, K. Sequential Model-Based Optimization for General Algorithm Configuration; Lecture Notes in Computer Science; Springer: Berlin/Heidelberg, Germany, 2011; pp. 507–523. [Google Scholar] [CrossRef] [Green Version]
  54. Jones, D.R.; Schonlau, M.; Welch, W.J. Efficient Global Optimization of Expensive Black-Box Functions. J. Glob. Optim. 1998, 13, 455–492. [Google Scholar] [CrossRef]
  55. Bergstra, J.; Bengio, Y. Random Search for Hyper-Parameter Optimization. J. Mach. Learn. Res. 2012, 13, 281–305. [Google Scholar]
  56. Brenning, A. Spatial Cross-Validation and Bootstrap for the Assessment of Prediction Rules in Remote Sensing: The R Package Sperrorest. In Proceedings of the 2012 IEEE International Geoscience and Remote Sensing Symposium, Munich, Germany, 22–27 July 2012; R Package Version 2.1.0. IEEE: Toulouse, France, 2012. [Google Scholar] [CrossRef]
  57. Friedman, J.H. Greedy Function Approximation: A Gradient Boosting Machine. Ann. Stat. 2001, 29, 1189–1232. [Google Scholar] [CrossRef]
  58. Greenwell, B.M.; Boehmke, B.C.; McCarthy, A.J. A Simple and Effective Model-Based Variable Importance Measure. arXiv 2018, arXiv:1805.04755. [Google Scholar]
  59. Molnar, C. Interpretable Machine Learning—A Guide for Making Black Box Models Explainable; Self-Published: Munich, Germany, 2019. [Google Scholar]
  60. Brenning, A. Transforming Feature Space to Interpret Machine Learning Models. arXiv 2021, arXiv:2104.04295. [Google Scholar]
  61. Apley, D.W.; Zhu, J. Visualizing the Effects of Predictor Variables in Black Box Supervised Learning Models. arXiv 2019, arXiv:1612.08468. [Google Scholar] [CrossRef]
  62. R Core Team. R: A Language and Environment for Statistical Computing; R Core Team: Vienna, Austria, 2019. [Google Scholar]
  63. Chen, T.; Guestrin, C. XGBoost: A Scalable Tree Boosting System. In Proceedings of the 22nd ACM SIGKDD International Conference on Knowledge Discovery and Data Mining, KDD ’16, San Francisco, CA, USA, 13–17 August 2016; ACM: New York, NY, USA, 2016; pp. 785–794. [Google Scholar] [CrossRef] [Green Version]
  64. Karatzoglou, A.; Smola, A.; Hornik, K.; Zeileis, A. Kernlab—An S4 Package for Kernel Methods in R. J. Stat. Softw. 2004, 11, 1–20. [Google Scholar] [CrossRef] [Green Version]
  65. Friedman, J.; Hastie, T.; Tibshirani, R. Regularization Paths for Generalized Linear Models via Coordinate Descent. J. Stat. Softw. 2010, 33, 1–22. [Google Scholar] [CrossRef] [PubMed] [Green Version]
  66. Kursa, M.B. Praznik: Collection of Information-Based Feature Selection Filters; R Package Vignette: Madison, WI, USA, 2018. [Google Scholar]
  67. Zawadzki, Z.; Kosinski, M. FSelectorRcpp: ‘Rcpp’ Implementation of ‘FSelector’ Entropy-Based Feature Selection Algorithms with a Sparse Matrix Support; R Package Vignette: Madison, WI, USA, 2019. [Google Scholar]
  68. Bischl, B.; Lang, M.; Kotthoff, L.; Schiffner, J.; Richter, J.; Studerus, E.; Casalicchio, G.; Jones, Z.M. mlr: Machine learning in R. J. Mach. Learn. Res. 2016, 17, 1–5. [Google Scholar]
  69. Landau, W.M. The drake R Package: A Pipeline Toolkit for Reproducibility and High-Performance Computing. J. Open Source Softw. 2018, 3, 550. [Google Scholar] [CrossRef]
  70. Ghosh, M.; Adhikary, S.; Ghosh, K.K.; Sardar, A.; Begum, S.; Sarkar, R. Genetic Algorithm Based Cancerous Gene Identification from Microarray Data Using Ensemble of Filter Methods. Med. Biol. Eng. Comput. 2019, 57, 159–176. [Google Scholar] [CrossRef] [PubMed]
  71. Horler, D.N.H.; Dockray, M.; Barber, J. The Red Edge of Plant Leaf Reflectance. Int. J. Remote Sens. 1983, 4, 273–288. [Google Scholar] [CrossRef]
  72. Hais, M.; Hellebrandová, K.N.; Šrámek, V. Potential of Landsat Spectral Indices in Regard to the Detection of Forest Health Changes Due to Drought Effects. J. For. Sci. 2019, 65, 70–78. [Google Scholar] [CrossRef] [Green Version]
  73. Gao, B.C. NDWI—A Normalized Difference Water Index for Remote Sensing of Vegetation Liquid Water from Space. Remote Sens. Environ. 1996, 58, 257–266. [Google Scholar] [CrossRef]
  74. Lehnert, L.W.; Meyer, H.; Bendix, J. Hsdar: Manage, Analyse and Simulate Hyperspectral Data in R; R Package Vignette: Madison, WI, USA, 2016. [Google Scholar]
  75. de Beurs, K.M.; Townsend, P.A. Estimating the Effect of Gypsy Moth Defoliation Using MODIS. Remote Sens. Environ. 2008, 112, 3983–3990. [Google Scholar] [CrossRef]
  76. Rengarajan, R.; Schott, J.R. Modeling Forest Defoliation Using Simulated BRDF and Assessing Its Effect on Reflectance and Sensor Reaching Radiance. In Remote Sensing and Modeling of Ecosystems for Sustainability XIII; International Society for Optics and Photonics: San Diego, CA, USA, 2016; Volume 9975, p. 997503. [Google Scholar] [CrossRef]
  77. Meng, R.; Dennison, P.E.; Zhao, F.; Shendryk, I.; Rickert, A.; Hanavan, R.P.; Cook, B.D.; Serbin, S.P. Mapping Canopy Defoliation by Herbivorous Insects at the Individual Tree Level Using Bi-Temporal Airborne Imaging Spectroscopy and LiDAR Measurements. Remote Sens. Environ. 2018, 215, 170–183. [Google Scholar] [CrossRef]
  78. Kälin, U.; Lang, N.; Hug, C.; Gessler, A.; Wegner, J.D. Defoliation Estimation of Forest Trees from Ground-Level Images. Remote Sens. Environ. 2019, 223, 143–153. [Google Scholar] [CrossRef]
  79. Goodbody, T.R.H.; Coops, N.C.; Hermosilla, T.; Tompalski, P.; McCartney, G.; MacLean, D.A. Digital Aerial Photogrammetry for Assessing Cumulative Spruce Budworm Defoliation and Enhancing Forest Inventories at a Landscape-Level. ISPRS J. Photogramm. Remote Sens. 2018, 142, 1–11. [Google Scholar] [CrossRef]
  80. Hlebarska, S.; Georgieva, M. Distribution of the invasive pathogen Diplodia sapinea on Pinus spp. in Bulgaria. In Proceedings of the 90 Years Forest Research Institute—For the Society and Nature, Sofia, Bulgaria, 24–26 October 2018; pp. 61–70. [Google Scholar]
  81. Kaya, A.G.A.; Yeltekin, Ş.; Lehtijarvi, T.D.; Lehtijarvi, A.; Woodward, S. Severity of Diplodia Shoot Blight (Caused by Diplodia Sapinea) Was Greatest on Pinus Sylvestris and Pinus Nigra in a Plantation Containing Five Pine Species. Phytopathol. Mediterr. 2019, 58, 249–259. [Google Scholar]
  82. Belgiu, M.; Drăguţ, L. Random Forest in Remote Sensing: A Review of Applications and Future Directions. ISPRS J. Photogramm. Remote Sens. 2016, 114, 24–31. [Google Scholar] [CrossRef]
  83. Xia, J.; Liao, W.; Chanussot, J.; Du, P.; Song, G.; Philips, W. Improving Random Forest with Ensemble of Features and Semisupervised Feature Extraction. IEEE Geosci. Remote Sens. Lett. 2015, 12, 1471–1475. [Google Scholar] [CrossRef]
  84. Fassnacht, F.E.; Neumann, C.; Förster, M.; Buddenbaum, H.; Ghosh, A.; Clasen, A.; Joshi, P.K.; Koch, B. Comparison of Feature Reduction Algorithms for Classifying Tree Species With Hyperspectral Data on Three Central European Test Sites. IEEE J. Sel. Top. Appl. Earth Obs. Remote Sens. 2014, 7, 2547–2561. [Google Scholar] [CrossRef]
  85. Feng, J.; Jiao, L.; Liu, F.; Sun, T.; Zhang, X. Unsupervised Feature Selection Based on Maximum Information and Minimum Redundancy for Hyperspectral Images. Pattern Recognit. 2016, 51, 295–309. [Google Scholar] [CrossRef]
  86. Georganos, S.; Grippa, T.; Vanhuysse, S.; Lennert, M.; Shimoni, M.; Kalogirou, S.; Wolff, E. Less Is More: Optimizing Classification Performance through Feature Selection in a Very-High-Resolution Remote Sensing Object-Based Urban Application. GISci. Remote Sens. 2018, 55, 221–242. [Google Scholar] [CrossRef]
  87. Rochac, J.F.R.; Zhang, N. Feature Extraction in Hyperspectral Imaging Using Adaptive Feature Selection Approach. In Proceedings of the 2016 Eighth International Conference on Advanced Computational Intelligence (ICACI), Chiang Mai, Thailand, 14–16 February 2016; pp. 36–40. [Google Scholar] [CrossRef]
  88. Pal, M.; Foody, G.M. Feature Selection for Classification of Hyperspectral Data by SVM. IEEE Trans. Geosci. Remote Sens. 2010, 48, 2297–2307. [Google Scholar] [CrossRef] [Green Version]
  89. Keller, S.; Braun, A.C.; Hinz, S.; Weinmann, M. Investigation of the Impact of Dimensionality Reduction and Feature Selection on the Classification of Hyperspectral EnMAP Data. In Proceedings of the 2016 8th Workshop on Hyperspectral Image and Signal Processing: Evolution in Remote Sensing (WHISPERS), Los Angeles, CA, USA, 21–24 August 2016; pp. 1–5. [Google Scholar] [CrossRef]
  90. Xu, S.; Zhao, Q.; Yin, K.; Zhang, F.; Liu, D.; Yang, G. Combining Random Forest and Support Vector Machines for Object-Based Rural-Land-Cover Classification Using High Spatial Resolution Imagery. J. Appl. Remote Sens. 2019, 13, 014521. [Google Scholar] [CrossRef]
  91. Shendryk, I.; Broich, M.; Tulbure, M.G.; McGrath, A.; Keith, D.; Alexandrov, S.V. Mapping Individual Tree Health Using Full-Waveform Airborne Laser Scans and Imaging Spectroscopy: A Case Study for a Floodplain Eucalypt Forest. Remote Sens. Environ. 2016, 187, 202–217. [Google Scholar] [CrossRef]
  92. Ludwig, M.; Morgenthal, T.; Detsch, F.; Higginbottom, T.P.; Lezama Valdes, M.; Nauß, T.; Meyer, H. Machine Learning and Multi-Sensor Based Modelling of Woody Vegetation in the Molopo Area, South Africa. Remote Sens. Environ. 2019, 222, 195–203. [Google Scholar] [CrossRef]
  93. Meyer, H.; Reudenbach, C.; Hengl, T.; Katurji, M.; Nauss, T. Improving Performance of Spatio-Temporal Machine Learning Models Using Forward Feature Selection and Target-Oriented Validation. Environ. Model. Softw. 2018, 101, 1–9. [Google Scholar] [CrossRef]
  94. Zandler, H.; Brenning, A.; Samimi, C. Quantifying Dwarf Shrub Biomass in an Arid Environment: Comparing Empirical Methods in a High Dimensional Setting. Remote Sens. Environ. 2015, 158, 140–155. [Google Scholar] [CrossRef]
  95. Guo, Y.; Chung, F.L.; Li, G.; Zhang, L. Multi-Label Bioinformatics Data Classification with Ensemble Embedded Feature Selection. IEEE Access 2019, 7, 103863–103875. [Google Scholar] [CrossRef]
  96. Radovic, M.; Ghalwash, M.; Filipovic, N.; Obradovic, Z. Minimum Redundancy Maximum Relevance Feature Selection Approach for Temporal Gene Expression Data. BMC Bioinform. 2017, 18, 9. [Google Scholar] [CrossRef] [PubMed] [Green Version]
  97. Vogelmann, J.E.; Rock, B.N.; Moss, D.M. Red Edge Spectral Measurements from Sugar Maple Leaves. Int. J. Remote Sens. 1993, 14, 1563–1575. [Google Scholar] [CrossRef]
  98. Boochs, F.; Kupfer, G.; Dockter, K.; Kühbauch, W. Shape of the Red Edge as Vitality Indicator for Plants. Int. J. Remote Sens. 1990, 11, 1741–1753. [Google Scholar] [CrossRef]
  99. Nagler, P.L.; Inoue, Y.; Glenn, E.P.; Russ, A.L.; Daughtry, C.S.T. Cellulose Absorption Index (CAI) to Quantify Mixed Soil–Plant Litter Scenes. Remote Sens. Environ. 2003, 87, 310–325. [Google Scholar] [CrossRef]
  100. Walthall, C.L.; Daughtry, C.S.T.; Chappelle, E.W.; Mcmurtrey, J.E.; Kim, M.S. The Use of High Spectral Resolution Bands for Estimating Absorbed Photosynthetically Active Radiation (A Par); NASA Gov: Washington, DC, USA, 1994.
  101. Carter, G.A. Ratios of Leaf Reflectances in Narrow Wavebands as Indicators of Plant Stress. Int. J. Remote Sens. 1994, 15, 697–703. [Google Scholar] [CrossRef]
  102. Zarco-Tejada, P.J.; Pushnik, J.C.; Dobrowski, S.; Ustin, S.L. Steady-State Chlorophyll a Fluorescence Detection from Canopy Derivative Reflectance and Double-Peak Red-Edge Effects. Remote Sens. Environ. 2003, 84, 283–294. [Google Scholar] [CrossRef]
  103. Gitelson, A.A.; Gritz, Y.; Merzlyak, M.N. Relationships between Leaf Chlorophyll Content and Spectral Reflectance and Algorithms for Non-Destructive Chlorophyll Assessment in Higher Plant Leaves. J. Plant Physiol. 2003, 160, 271–282. [Google Scholar] [CrossRef]
  104. Oppelt, N.; Mauser, W. Hyperspectral Monitoring of Physiological Parameters of Wheat during a Vegetation Period Using AVIS Data. Int. J. Remote Sens. 2004, 25, 145–159. [Google Scholar] [CrossRef]
  105. Datt, B. Visible/near Infrared Reflectance and Chlorophyll Content in Eucalyptus Leaves. Int. J. Remote Sens. 1999, 20, 2741–2759. [Google Scholar] [CrossRef]
  106. Datt, B. Remote Sensing of Chlorophyll a, Chlorophyll b, Chlorophyll A+b, and Total Carotenoid Content in Eucalyptus Leaves. Remote Sens. Environ. 1998, 66, 111–121. [Google Scholar] [CrossRef]
  107. Datt, B. Remote Sensing of Water Content in Eucalyptus Leaves. Aust. J. Bot. 1999, 47, 909. [Google Scholar] [CrossRef]
  108. le Maire, G.; François, C.; Dufrêne, E. Towards Universal Broad Leaf Chlorophyll Indices Using PROSPECT Simulated Database and Hyperspectral Reflectance Measurements. Remote Sens. Environ. 2004, 89, 1–28. [Google Scholar] [CrossRef]
  109. Lemaire, G.; Francois, C.; Soudani, K.; Berveiller, D.; Pontailler, J.; Breda, N.; Genet, H.; Davi, H.; Dufrene, E. Calibration and Validation of Hyperspectral Indices for the Estimation of Broadleaved Forest Leaf Chlorophyll Content, Leaf Mass per Area, Leaf Area Index and Leaf Canopy Biomass. Remote Sens. Environ. 2008, 112, 3846–3864. [Google Scholar] [CrossRef]
  110. Apan, A.; Held, A.; Phinn, S.; Markley, J. Detecting Sugarcane `orange Rust’ Disease Using EO-1 Hyperion Hyperspectral Imagery. Int. J. Remote Sens. 2004, 25, 489–498. [Google Scholar] [CrossRef] [Green Version]
  111. Peñuelas, J.; Gamon, J.A.; Fredeen, A.L.; Merino, J.; Field, C.B. Reflectance Indices Associated with Physiological Changes in Nitrogen- and Water-Limited Sunflower Leaves. Remote Sens. Environ. 1994, 48, 135–146. [Google Scholar] [CrossRef]
  112. Huete, A.R.; Liu, H.Q.; Batchily, K.; van Leeuwen, W. A Comparison of Vegetation Indices over a Global Set of TM Images for EOS-MODIS. Remote Sens. Environ. 1997, 59, 440–451. [Google Scholar] [CrossRef]
  113. Wu, W. The Generalized Difference Vegetation Index (GDVI) for Dryland Characterization. Remote Sens. 2014, 6, 1211–1233. [Google Scholar] [CrossRef] [Green Version]
  114. Smith, R.C.G.; Adams, J.; Stephens, D.J.; Hick, P.T. Forecasting Wheat Yield in a Mediterranean-Type Environment from the NOAA Satellite. Aust. J. Agric. Res. 1995, 46, 113. [Google Scholar] [CrossRef]
  115. Gitelson, A.A.; Buschmann, C.; Lichtenthaler, H.K. The Chlorophyll Fluorescence Ratio F735/F700 as an Accurate Measure of the Chlorophyll Content in Plants. Remote Sens. Environ. 1999, 69, 296–302. [Google Scholar] [CrossRef]
  116. Gitelson, A.A.; Kaufman, Y.J.; Merzlyak, M.N. Use of a Green Channel in Remote Sensing of Global Vegetation from EOS-MODIS. Remote Sens. Environ. 1996, 58, 289–298. [Google Scholar] [CrossRef]
  117. Galvão, L.S.; Formaggio, A.R.; Tisot, D.A. Discrimination of Sugarcane Varieties in Southeastern Brazil with EO-1 Hyperion Data. Remote Sens. Environ. 2005, 94, 523–534. [Google Scholar] [CrossRef]
  118. Maccioni, A.; Agati, G.; Mazzinghi, P. New Vegetation Indices for Remote Measurement of Chlorophylls Based on Leaf Directional Reflectance Spectra. J. Photochem. Photobiol. B Biol. 2001, 61, 52–61. [Google Scholar] [CrossRef]
  119. Daughtry, C. Estimating Corn Leaf Chlorophyll Concentration from Leaf and Canopy Reflectance. Remote Sens. Environ. 2000, 74, 229–239. [Google Scholar] [CrossRef]
  120. Wu, C.; Niu, Z.; Tang, Q.; Huang, W. Estimating Chlorophyll Content from Hyperspectral Vegetation Indices: Modeling and Validation. Agric. For. Meteorol. 2008, 148, 1230–1241. [Google Scholar] [CrossRef]
  121. Sims, D.A.; Gamon, J.A. Relationships between Leaf Pigment Content and Spectral Reflectance across a Wide Range of Species, Leaf Structures and Developmental Stages. Remote Sens. Environ. 2002, 81, 337–354. [Google Scholar] [CrossRef]
  122. Hernández-Clemente, R.; Navarro-Cerrillo, R.M.; Suárez, L.; Morales, F.; Zarco-Tejada, P.J. Assessing Structural Effects on PRI for Stress Detection in Conifer Forests. Remote Sens. Environ. 2011, 115, 2360–2375. [Google Scholar] [CrossRef]
  123. Qi, J.; Chehbouni, A.; Huete, A.R.; Kerr, Y.H.; Sorooshian, S. A Modified Soil Adjusted Vegetation Index. Remote Sens. Environ. 1994, 48, 119–126. [Google Scholar] [CrossRef]
  124. Hunt, E.; Rock, B. Detection of Changes in Leaf Water Content Using Near- and Middle-Infrared Reflectances. Remote Sens. Environ. 1989, 30, 43–54. [Google Scholar] [CrossRef]
  125. Chen, J.M. Evaluation of Vegetation Indices and a Modified Simple Ratio for Boreal Applications. Can. J. Remote. Sens. 1996, 22, 229–242. [Google Scholar] [CrossRef]
  126. Dash, J.; Curran, P. Evaluation of the MERIS Terrestrial Chlorophyll Index (MTCI). Adv. Space Res. 2007, 39, 100–104. [Google Scholar] [CrossRef]
  127. Haboudane, D.; Miller, J.R.; Tremblay, N.; Zarco-Tejada, P.J.; Dextraze, L. Integrated Narrow-Band Vegetation Indices for Prediction of Crop Chlorophyll Content for Application to Precision Agriculture. Remote Sens. Environ. 2002, 81, 416–426. [Google Scholar] [CrossRef]
  128. Serrano, L.; Peñuelas, J.; Ustin, S.L. Remote Sensing of Nitrogen and Lignin in Mediterranean Vegetation from AVIRIS Data. Remote Sens. Environ. 2002, 81, 355–364. [Google Scholar] [CrossRef]
  129. Tucker, C.J. Red and Photographic Infrared Linear Combinations for Monitoring Vegetation. Remote Sens. Environ. 1979, 8, 127–150. [Google Scholar] [CrossRef] [Green Version]
  130. Gitelson, A.; Merzlyak, M.N. Quantitative Estimation of Chlorophyll-a Using Reflectance Spectra: Experiments with Autumn Chestnut and Maple Leaves. J. Photochem. Photobiol. B Biol. 1994, 22, 247–252. [Google Scholar] [CrossRef]
  131. Guanter, L.; Alonso, L.; Moreno, J. A Method for the Surface Reflectance Retrieval from PROBA/CHRIS Data over Land: Application to ESA SPARC Campaigns. IEEE Trans. Geosci. Remote Sens. 2005, 43, 2908–2917. [Google Scholar] [CrossRef]
  132. Rondeaux, G.; Steven, M.; Baret, F. Optimization of Soil-Adjusted Vegetation Indices. Remote Sens. Environ. 1996, 55, 95–107. [Google Scholar] [CrossRef]
  133. Chappelle, E.W.; Kim, M.S.; McMurtrey, J.E. Ratio Analysis of Reflectance Spectra (RARS): An Algorithm for the Remote Estimation of the Concentrations of Chlorophyll A, Chlorophyll B, and Carotenoids in Soybean Leaves. Remote Sens. Environ. 1992, 39, 239–247. [Google Scholar] [CrossRef]
  134. Gamon, J.; Peñuelas, J.; Field, C. A Narrow-Waveband Spectral Index That Tracks Diurnal Changes in Photosynthetic Efficiency. Remote Sens. Environ. 1992, 41, 35–44. [Google Scholar] [CrossRef]
  135. Zarco-Tejada, P.J.; González-Dugo, V.; Williams, L.E.; Suárez, L.; Berni, J.A.J.; Goldhamer, D.; Fereres, E. A PRI-Based Water Stress Index Combining Structural and Chlorophyll Effects: Assessment Using Diurnal Narrow-Band Airborne Imagery and the CWSI Thermal Index. Remote Sens. Environ. 2013, 138, 38–50. [Google Scholar] [CrossRef]
  136. Garrity, S.R.; Eitel, J.U.; Vierling, L.A. Disentangling the Relationships between Plant Pigments and the Photochemical Reflectance Index Reveals a New Approach for Remote Estimation of Carotenoid Content. Remote Sens. Environ. 2011, 115, 628–635. [Google Scholar] [CrossRef]
  137. Merzlyak, M.N.; Gitelson, A.A.; Chivkunova, O.B.; Rakitin, V.Y. Non-Destructive Optical Detection of Pigment Changes during Leaf Senescence and Fruit Ripening. Physiol. Plant. 1999, 106, 135–141. [Google Scholar] [CrossRef] [Green Version]
  138. Blackburn, G.A. Quantifying Chlorophylls and Caroteniods at Leaf and Canopy Scales. Remote Sens. Environ. 1998, 66, 273–285. [Google Scholar] [CrossRef]
  139. Penuelas, J.; Pinol, J.; Ogaya, R.; Filella, I. Estimation of Plant Water Concentration by the Reflectance Water Index WI (R900/R970). Int. J. Remote Sens. 1997, 18, 2869–2875. [Google Scholar] [CrossRef]
  140. Roujean, J.L.; Breon, F.M. Estimating PAR Absorbed by Vegetation from Bidirectional Reflectance Measurements. Remote Sens. Environ. 1995, 51, 375–384. [Google Scholar] [CrossRef]
  141. Cho, M.A.; Skidmore, A.K. A New Technique for Extracting the Red Edge Position from Hyperspectral Data: The Linear Extrapolation Method. Remote Sens. Environ. 2006, 101, 181–193. [Google Scholar] [CrossRef]
  142. Guyot, G.; Baret, F. Utilisation de La Haute Resolution Spectrale Pour Suivre l’etat Des Couverts Vegetaux. In Spectral Signatures of Objects in Remote Sensing; Guyenne, T.D., Hunt, J.J., Eds.; ESA Special Publication: Aussois, France, 1988; Volume 287, p. 279. [Google Scholar]
  143. Huete, A. A Soil-Adjusted Vegetation Index (SAVI). Remote Sens. Environ. 1988, 25, 295–309. [Google Scholar] [CrossRef]
  144. Penuelas, J.; Filella, I.; Lloret, P.; Munoz, F.; Vilaleliu, M. Reflectance Assessment of Mite Effects on Apple Trees. Int. J. Remote Sens. 1995, 16, 2727–2733. [Google Scholar] [CrossRef]
  145. Vincini, M.; Frazzi, E.; D’Alessio, P. Angular Dependence of Maize and Sugar Beet VIs from Directional CHRIS/Proba Data. In Proceedings of the 4th ESA CHRIS PROBA Workshop, Frascati, Italy, 19–21 September 2006; Volume 2006, pp. 19–21. [Google Scholar]
  146. Jordan, C.F. Derivation of Leaf-Area Index from Quality of Light on the Forest Floor. Ecology 1969, 50, 663–666. [Google Scholar] [CrossRef]
  147. Gitelson, A.A.; Merzlyak, M.N. Remote Estimation of Chlorophyll Content in Higher Plant Leaves. Int. J. Remote Sens. 1997, 18, 2691–2697. [Google Scholar] [CrossRef]
  148. McMurtrey, J.; Chappelle, E.; Kim, M.; Meisinger, J.; Corp, L. Distinguishing Nitrogen Fertilization Levels in Field Corn (Zea mays L.) with Actively Induced Fluorescence and Passive Reflectance Measurements. Remote Sens. Environ. 1994, 47, 36–44. [Google Scholar] [CrossRef]
  149. Zarco-Tejada, P.J.; Miller, J.R. Land Cover Mapping at BOREAS Using Red Edge Spectral Parameters from CASI Imagery. J. Geophys. Res. Atmos. 1999, 104, 27921–27933. [Google Scholar] [CrossRef]
  150. Lichtenthaler, H.; Lang, M.; Sowinska, M.; Heisel, F.; Miehé, J. Detection of Vegetation Stress via a New High Resolution Fluorescence Imaging System. J. Plant Physiol. 1996, 148, 599–612. [Google Scholar] [CrossRef]
  151. Hernández-Clemente, R.; Navarro-Cerrillo, R.M.; Zarco-Tejada, P.J. Carotenoid Content Estimation in a Heterogeneous Conifer Forest Using Narrow-Band Indices and PROSPECTDART Simulations. Remote Sens. Environ. 2012, 127, 298–315. [Google Scholar] [CrossRef]
  152. Elvidge, C.D.; Chen, Z. Comparison of Broad-Band and Narrow-Band Red and near-Infrared Vegetation Indices. Remote Sens. Environ. 1995, 54, 38–48. [Google Scholar] [CrossRef]
  153. Filella, I.; Penuelas, J. The Red Edge Position and Shape as Indicators of Plant Chlorophyll Content, Biomass and Hydric Status. Int. J. Remote Sens. 1994, 15, 1459–1470. [Google Scholar] [CrossRef]
  154. Levin, N.; Kidron, G.J.; Ben-Dor, E. Surface Properties of Stabilizing Coastal Dunes: Combining Spectral and Field Analyses. Sedimentology 2007, 54, 771–788. [Google Scholar] [CrossRef]
  155. Lobell, D.B.; Asner, G.P.; Law, B.E.; Treuhaft, R.N. Subpixel Canopy Cover Estimation of Coniferous Forests in Oregon Using SWIR Imaging Spectrometry. J. Geophys. Res. Atmos. 2001, 106, 5151–5160. [Google Scholar] [CrossRef] [Green Version]
  156. Hunt, E.R.; Doraiswamy, P.C.; McMurtrey, J.E.; Daughtry, C.S.; Perry, E.M.; Akhmedov, B. A Visible Band Index for Remote Sensing Leaf Chlorophyll Content at the Canopy Scale. Int. J. Appl. Earth Obs. Geoinf. 2013, 21, 103–112. [Google Scholar] [CrossRef] [Green Version]
  157. Broge, N.; Leblanc, E. Comparing Prediction Power and Stability of Broadband and Hyperspectral Vegetation Indices for Estimation of Green Leaf Area Index and Canopy Chlorophyll Density. Remote Sens. Environ. 2001, 76, 156–172. [Google Scholar] [CrossRef]
Figure 1. Response variable “defoliation of trees” for plots Laukiz1, Laukiz2, Luiando, and Oiartzun. n is the total number of trees in each plot, and x ¯ the mean defoliation. Values for Laukiz1, Luiando, and Oiartzun were observed in 5% intervals; for Laukiz2, defoliation was observed at multiple heights and then averaged, leading to smaller defoliation differences than 5%.
Remotesensing 13 04832 g001
Figure 2. Study area maps showing information about location, size, and spatial distribution of trees for all plots (Laukiz1, Laukiz2, Luiando, and Oiartzun). The background maps give a visual impression of the individual plot area but do not necessarily represent the plot’s state during data acquisition.
Remotesensing 13 04832 g002
Figure 3. Predictive performance in RMSE (p.p.) of models across tasks. Different feature sets are shown on the y-axis. Labels show the feature selection method (e.g., NF = no filter, Car = “Carscore”, Info Gain = “Information Gain”, Borda = “Borda”).
Remotesensing 13 04832 g003
Figure 4. Model performances in RMSE across all tasks, split up in facets, when using no filter method (blue dot) compared to any other filter method (red cross) for learners RF, SVM, and XGBoost (XG).
Remotesensing 13 04832 g004
Figure 5. Predictive performances in RMSE (p.p.) when using the Borda filter method (blue dot) compared to any other filter (red cross) for each learner across all tasks.
Remotesensing 13 04832 g005
Figure 6. Variable importance for feature sets HR and VI: Mean decrease in RMSE for one hundred feature permutations using the SVM learner. The wavelength range on the x-axis matches the range of the hyperspectral sensor (400–1000 nm). For each dataset, the ten most important features are highlighted as black dots and labeled by name. Gray dots represent features from importance rank 11 to last. The spectral signature (mean) of each plot was added as a reference on a normalized reflectance scale [0, 1] (secondary y-axis). VI features were decomposed into their individual formula parts, all instances being connected via dashed lines. Each VI feature is composed out of at least two instances.
Remotesensing 13 04832 g006
Table 1. Specifications of hyperspectral data.
CharacteristicValue
Geometric resolution1 m
Radiometric resolution12 bit
Spectral resolution126 bands (404.08–996.31 nm)
Correction:Radiometric, geometric, atmospheric
Table 2. List of filter methods used in this work, their categorization, and scientific reference.
NameGroupRef.
Linear correlation (Pearson)univariate, linear, correlation [41]
Information gainunivariate, non-linear, entropy [42]
Minimum redundancy, maximum relevancemultivariate, non-linear, entropy [43]
Carscoremultivariate, linear, correlation [44]
Reliefmultivariate, linear, entropy [45]
Conditional minimal information maximizationmultivariate, linear, entropy [46]
Table 3. The overall best individual learner performance across any task and filter method for RF, SVM, XGBoost, lasso, and ridge, sorted ascending by RMSE (p.p.) including the respective standard error (SE) of the cross-validation run. For extttregr.featureless, the task is not applicable and was therefore removed.
TaskModelFilterRMSESE
1NRI-VISVMInfo Gain27.91518.970
2NRIRFRelief30.84212.028
3HRXGBoostInfo Gain31.16515.025
4NRILasso-MBONo Filter31.16515.025
5NRIRidge-MBONo Filter31.16515.025
6-regr.featurelessNo Filter31.16515.025
Table 4. Test fold performances in RMSE (p.p.) for learner SVM on the HR dataset without using a filter, showcasing performance variance on the fold level. For each row, the model was trained on observations from all others plots but the given one and tested on the observations of the given plot.
RMSETest Plot
128.12Laukiz1
254.26Laukiz2
39.00Luiando
421.17Oiartzun
Table 5. Best ten results among all learner–task–filter combinations, sorted in decreasing order of RMSE (p.p.) and their respective standard error (SE).
TaskModelFilterRMSESE
1NRI-VISVMInfo Gain27.91518.970
2NRISVMCMIM28.04419.101
3VISVMRelief28.08219.140
4NRI-VISVMBorda28.10219.128
5HRSVMCMIM28.11919.123
6HRSVMMRMR28.11919.123
7VISVMInfo Gain28.12119.123
8NRISVMPCA28.12119.123
9HR-NRISVMPCA28.12119.123
10HR-NRI-VISVMPCA28.12119.123
Table 6. Worst ten results among all learner–task–filter combinations, sorted in decreasing order of RMSE (p.p.) and their respective standard error (SE).
TaskModelFilterRMSESE
1VIXGBoostNo Filter45.3666.672
2HRXGBoostNo Filter44.9825.378
3VIXGBoostPCA44.5398.187
4HRXGBoostPCA44.0326.183
5NRIXGBoostPCA43.4339.543
6HR-NRIXGBoostPCA43.2202.557
7HR-NRI-VIXGBoostPCA41.0769.862
8VIRFCMIM39.98010.144
9VIRFInfo Gain39.62310.616
10NRIXGBoostPearson39.49211.548
Table 7. Selected feature portions during tuning for the best performing learner–filter settings (SVM Relief, RF Relief, XGBoost CMIM) across folds for task HR-NRI-VI, sorted by plot name. “Features (#)” denotes the absolute number of features selected, and “Features (%)” refers to the percentage relative to the overall features available in the training sets for each plot (Laukiz1 = 1249, Laukiz2 = 1357, Luiando = 1507, Oiartzun = 1311). Results were estimated in a separate model tuning step, not within the main cross-validation comparison.
LearnerTest PlotFeatures (%)Features (#)
RF
Car
Laukiz10.002451/1249
Laukiz20.003591/1357
Luiando0.124482/1507
Oiartzun2.8035637/1311
SVM
Car
Laukiz116.76686210/1249
Laukiz240.77700554/1357
Luiando43.80604661/1507
Oiartzun81.232051065/1311
XGB
Borda
Laukiz179.54091994/1249
Laukiz20.9654514/1357
Luiando66.27871999/1507
Oiartzun41.89759550/1311
Publisher’s Note: MDPI stays neutral with regard to jurisdictional claims in published maps and institutional affiliations.

