Article

Multi-Dimensional Remote Sensing Analysis Documents Beaver-Induced Permafrost Degradation, Seward Peninsula, Alaska

1
Institute of Northern Engineering, University of Alaska Fairbanks, Fairbanks, AK 99775, USA
2
Geophysical Institute, University of Alaska Fairbanks, Fairbanks, AK 99775, USA
3
Jet Propulsion Laboratory, California Institute of Technology, Pasadena, CA 91109, USA
4
Department of Natural Resources and the Environment, University of Connecticut, Storrs, CT 06269, USA
*
Author to whom correspondence should be addressed.
Remote Sens. 2021, 13(23), 4863; https://doi.org/10.3390/rs13234863
Submission received: 3 November 2021 / Revised: 19 November 2021 / Accepted: 24 November 2021 / Published: 30 November 2021

Abstract

:
Beavers have established themselves as a key component of low arctic ecosystems over the past several decades. Beavers are widely recognized as ecosystem engineers, but their effects on permafrost-dominated landscapes in the Arctic remain unclear. In this study, we document the occurrence, reconstruct the timing, and highlight the effects of beaver activity on a small creek valley confined by ice-rich permafrost on the Seward Peninsula, Alaska using multi-dimensional remote sensing analysis of satellite (Landsat-8, Sentinel-2, Planet CubeSat, and DigitalGlobe Inc./MAXAR) and unmanned aircraft systems (UAS) imagery. Beaver activity along the study reach of Swan Lake Creek appeared between 2006 and 2011 with the construction of three dams. Between 2011 and 2017, beaver dam numbers increased, with the peak occurring in 2017 (n = 9). Between 2017 and 2019, the number of dams decreased (n = 6), while the average length of the dams increased from 20 to 33 m. Between 4 and 20 August 2019, following a nine-day period of record rainfall (>125 mm), the well-established dam system failed, triggering the formation of a beaver-induced permafrost degradation feature. During the decade of beaver occupation between 2011 and 2021, the creek valley widened from 33 to 180 m (~450% increase) and the length of the stream channel network increased from ~0.6 km to more than 1.9 km (220% increase) as a result of beaver engineering and beaver-induced permafrost degradation. Comparing vegetation (NDVI) and snow (NDSI) derived indices from Sentinel-2 time-series data acquired between 2017 and 2021 for the beaver-induced permafrost degradation feature and a nearby unaffected control site, showed that peak growing season NDVI was lowered by 23% and that it extended the length of the snow-cover period by 19 days following the permafrost disturbance. Our analysis of multi-dimensional remote sensing data highlights several unique aspects of beaver engineering impacts on ice-rich permafrost landscapes. Our detailed reconstruction of the beaver-induced permafrost degradation event may also prove useful for identifying degradation of ice-rich permafrost in optical time-series datasets across regional scales. Future field- and remote sensing-based observations of this site, and others like it, will provide valuable information for the NSF-funded Arctic Beaver Observation Network (A-BON) and the third phase of the NASA Arctic-Boreal Vulnerability Experiment (ABoVE) Field Campaign.

Graphical Abstract

1. Introduction

Rapid environmental change in the Arctic is being driven by warming air temperatures [1,2], increases in summer and winter precipitation [3,4,5], and feedbacks associated with sea-ice loss [6] and degrading near-surface permafrost [7,8]. Changes in vegetation [9,10,11,12], hydrology [13,14], fire regimes [15,16], and an increase in thermokarst and other thaw-related activity [17,18,19] have been widely observed in Arctic and Boreal regions during the last two decades. Recent and widespread environmental change in the Arctic is affecting ecosystems [13,20,21,22], the carbon cycle [23,24,25], infrastructure [26,27,28], socio-ecological systems that subsist on the numerous resources provided by Arctic lands and waters [29,30,31,32], and leading to a host of permafrost-region hazards [33]. However, feedbacks associated with the cumulative effects of changes occurring in physical, ecological, and social systems are difficult to quantify and remain an active field of study [34,35,36].
Beavers (Castor canadensis) and beaver engineering are at the intersection of ecological, physical, and social system changes in Arctic and Boreal regions over at least the last two centuries [37]. Rising demand for pelts increased trapping pressure in the late 1800s, nearly causing beavers to become extirpated in northern regions [38,39]. The increase of beaver populations following a cessation in over trapping is well documented, as they reoccupy their native lands and waters with both positive and negative effects [40,41,42]. Superimposed on this human-caused beaver population swing are climate driven changes in summer and winter habitats that are likely allowing beavers to extend their range into lowland Arctic regions (Figure 1); the only previous documented range extension since the Late Glacial occurred during the Early Holocene Warm Period [43,44], though there is scattered evidence of beavers in arctic tundra archeological sites in Alaska [45]. Tape et al. [46] recently presented the first comprehensive map of beaver ponds in Arctic Alaska based on very high resolution satellite (VHRS) imagery from ca. 2010 to ca. 2020, which indicated the presence of nearly 12,000 individual beaver ponds. A doubling of beaver ponds between 2000 and 2020 indicates the active pace at which beavers are occupying lowland arctic tundra landscapes (Figure 1). In regions with ice-rich permafrost, beavers have been shown to interact with the terrain to create a suite of landscape responses that may cause lake expansion and drainage, thaw slump initiation, thermoerosional gully formation, ice wedge degradation, thermokarst shore fen development, and likely development of taliks associated with water impoundment [44,47,48]. In a recent remote sensing study focused on the Baldwin Peninsula in northwestern Alaska, beavers were shown to be the dominant control in the surface water area changes of thermokarst lakes and drained lake basins between 2002 and 2019 [47].
Remote sensing is an important resource for observing, documenting, and better understanding landscape change from local, to regional, to Pan-Arctic scales [48,49]. In particular, remote sensing has emerged as one of the primary tools for advancing the field of thermokarst research, which is focused on the processes and landforms involving collapse of the land surface as a result of ground ice melt [50]. Rowland et al. [51] noted that, with the scale of questions and facets of landscape change in the Arctic today, “a particular focus must be placed on identifying existing and developing new remote-sensing technologies to detect near-surface and subsurface changes in the Arctic”. However, no one remote-sensing tool is particularly suited for detecting and observing the suite of landscape change scenarios associated with thawing permafrost landscapes [52]. The spatial and temporal rate at which permafrost degradation manifests itself; the spectral response of the land surface to thaw-induced perturbations; and the observationally limiting conditions caused by cloud-cover, short northern latitude summers, and variable ecological conditions requires the use of multiple remote-sensing platforms and novel image analysis techniques [49,53,54,55,56].
In this study, we reconstruct a beaver-induced permafrost degradation feature in the Swan Lake Creek drainage on the Seward Peninsula, Alaska using multi-dimensional remote sensing imagery and datasets (Figure 1). During pre-fieldwork planning in the summer of 2021, we discovered what we interpreted as a beaver-induced permafrost degradation feature in VHRS imagery. We visited the site on foot in early August 2021 and confirmed the presence of failed beaver dams, beaver chewed wood along strandlines released during a catastrophic flood, beaver lodges, and topographic relief indicative of ice-rich permafrost degradation (Figure 2). Our initial remote sensing observations and subsequent field reconnaissance to the site led to our interest in reconstructing the timing and events that led to the development of the beaver-induced permafrost degradation feature using multi-dimensional remote sensing analyses with varying spatial, temporal, and spectral characteristics as well as incorporation of digital surface model data. We combined data from remote sensing platforms with varying spatial and temporal resolutions that include Landsat-8, Sentinel-2, PlanetLabs Cubesats, ArcticDEM, DigitalGlobe Inc./MAXAR imagery, and a UAS to pinpoint the timing of the disturbance, assess the impact on multispectral indices, understand the impact on ice-rich permafrost terrain, and the likely processes involved in the formation of the fluvio-thermal erosion and thermokarst feature. We show that beaver engineering between 2006 and 2021 caused a systems-level response to a small tundra stream that promoted lateral expansion of the creek valley into an ice-rich permafrost hillslope and development of a diffuse network of stream channels expanding the area of potential beaver engineering in the future.

2. Materials and Methods
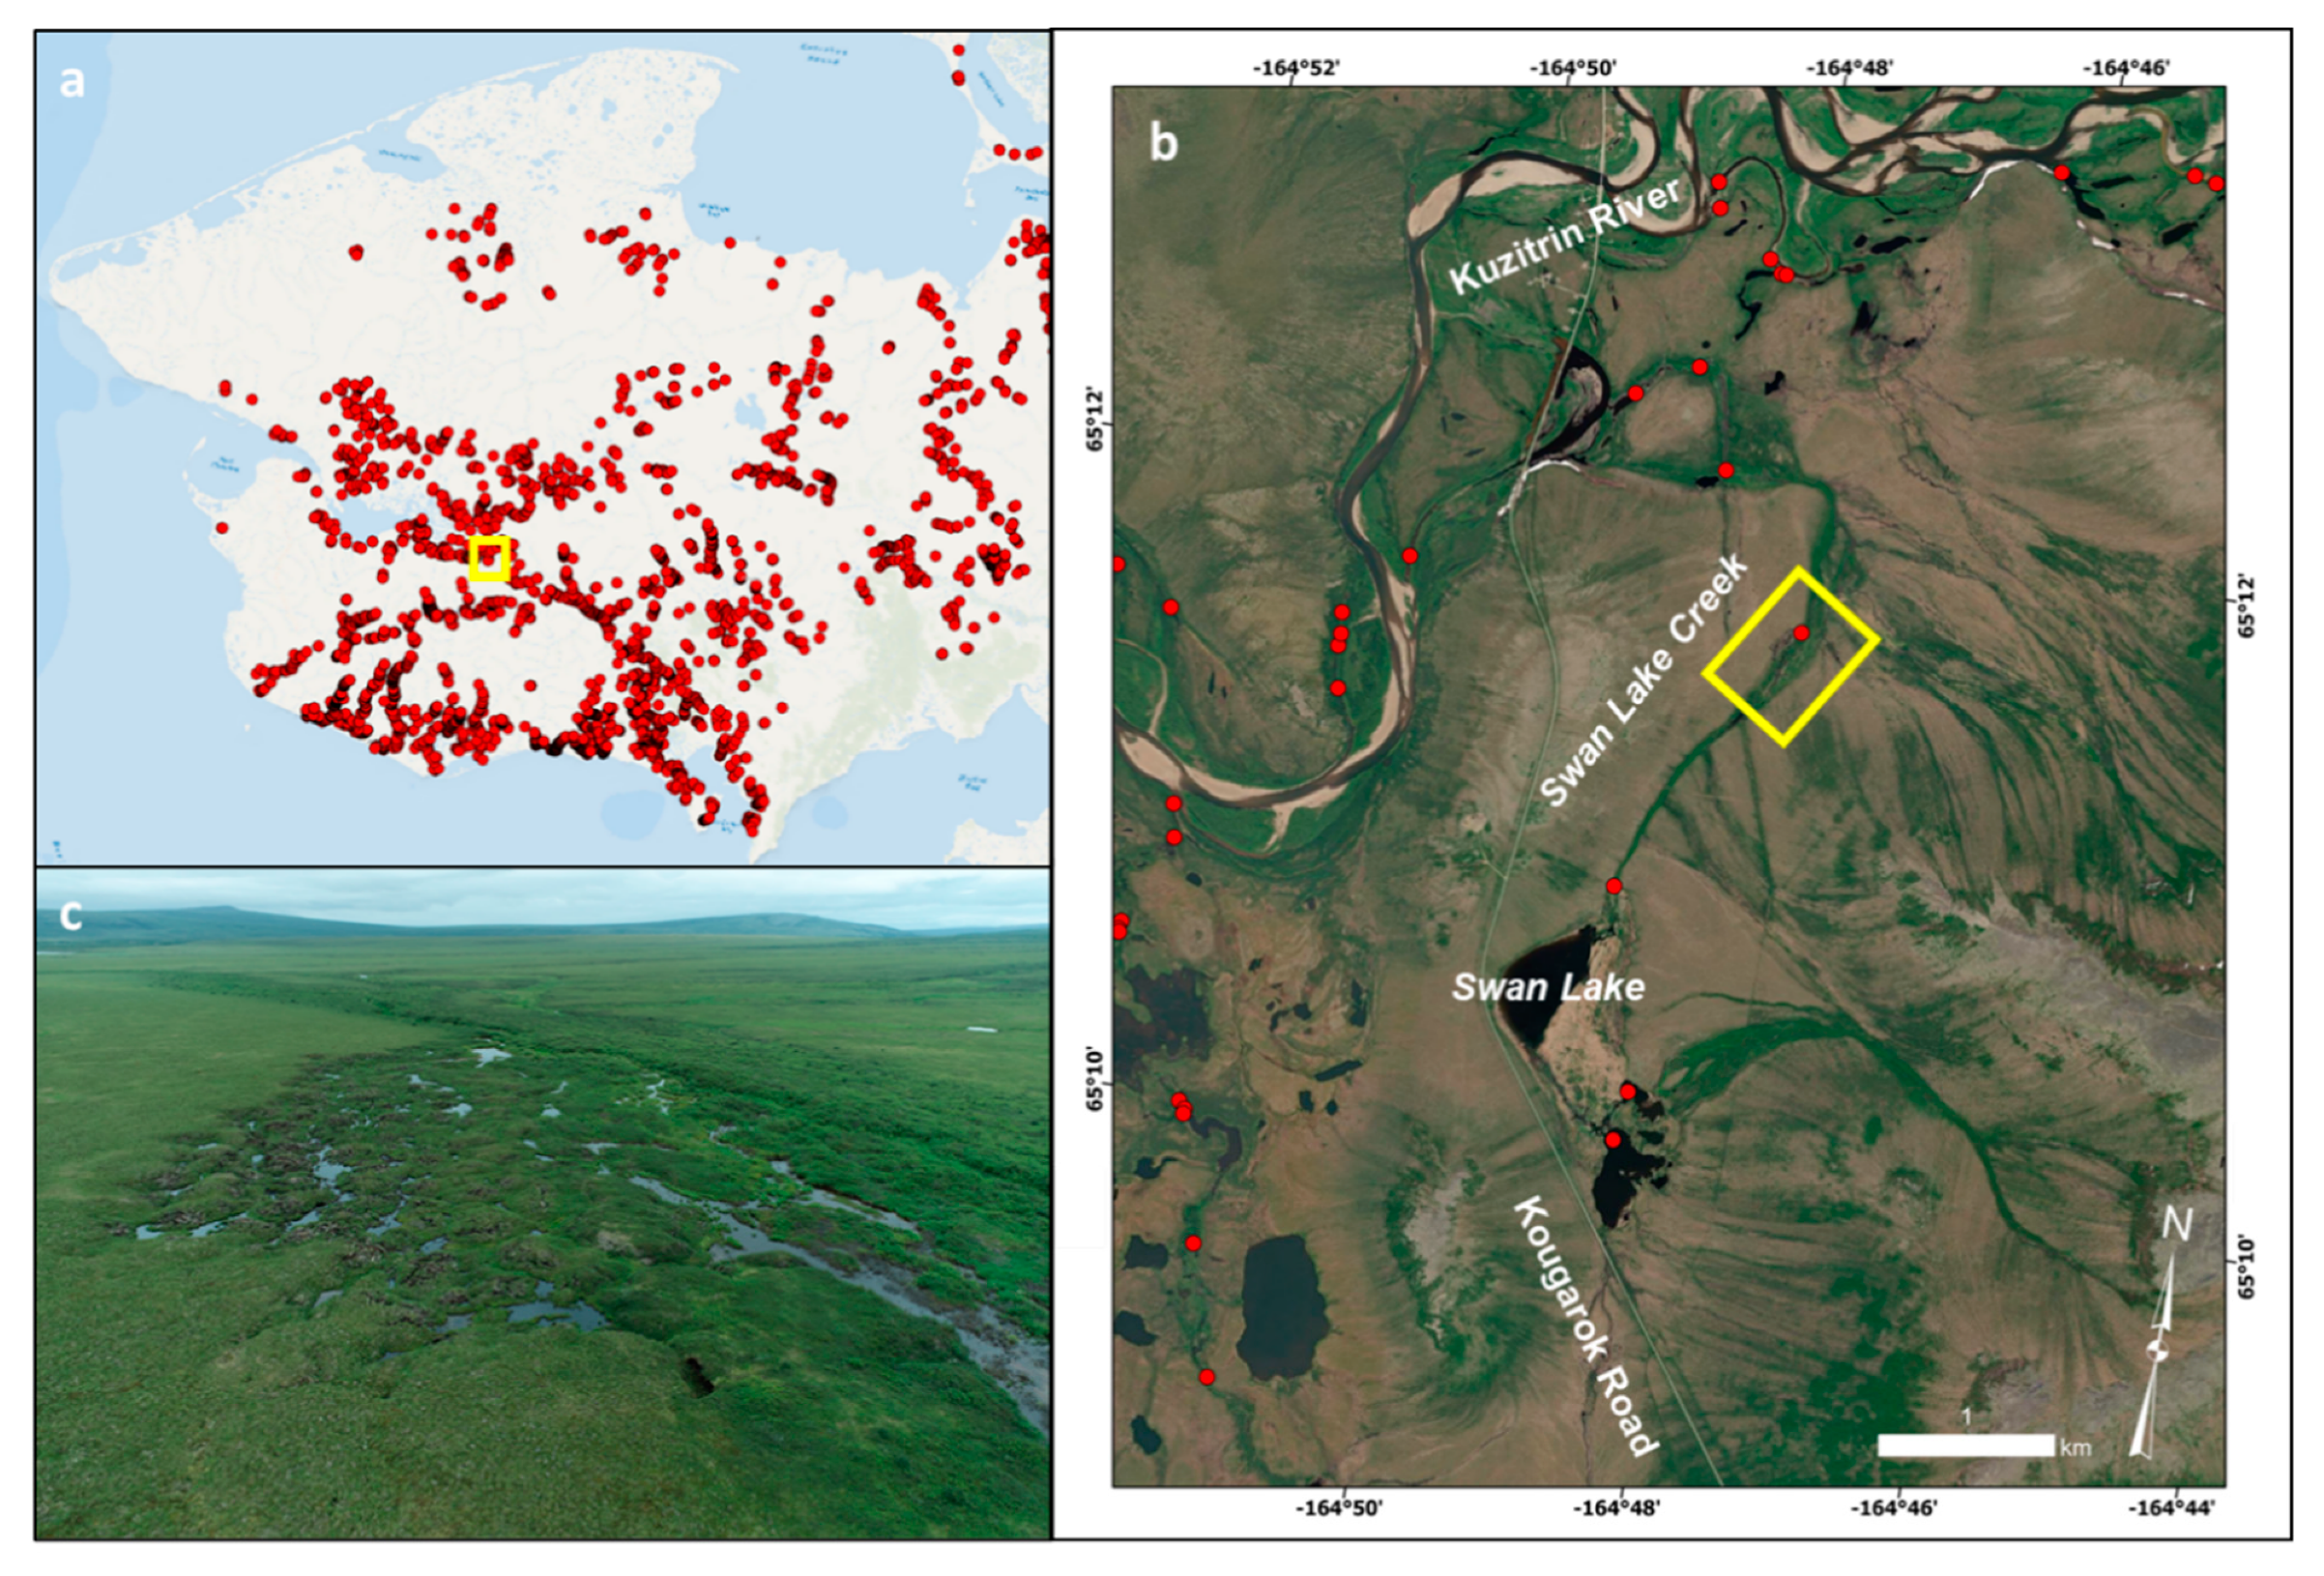
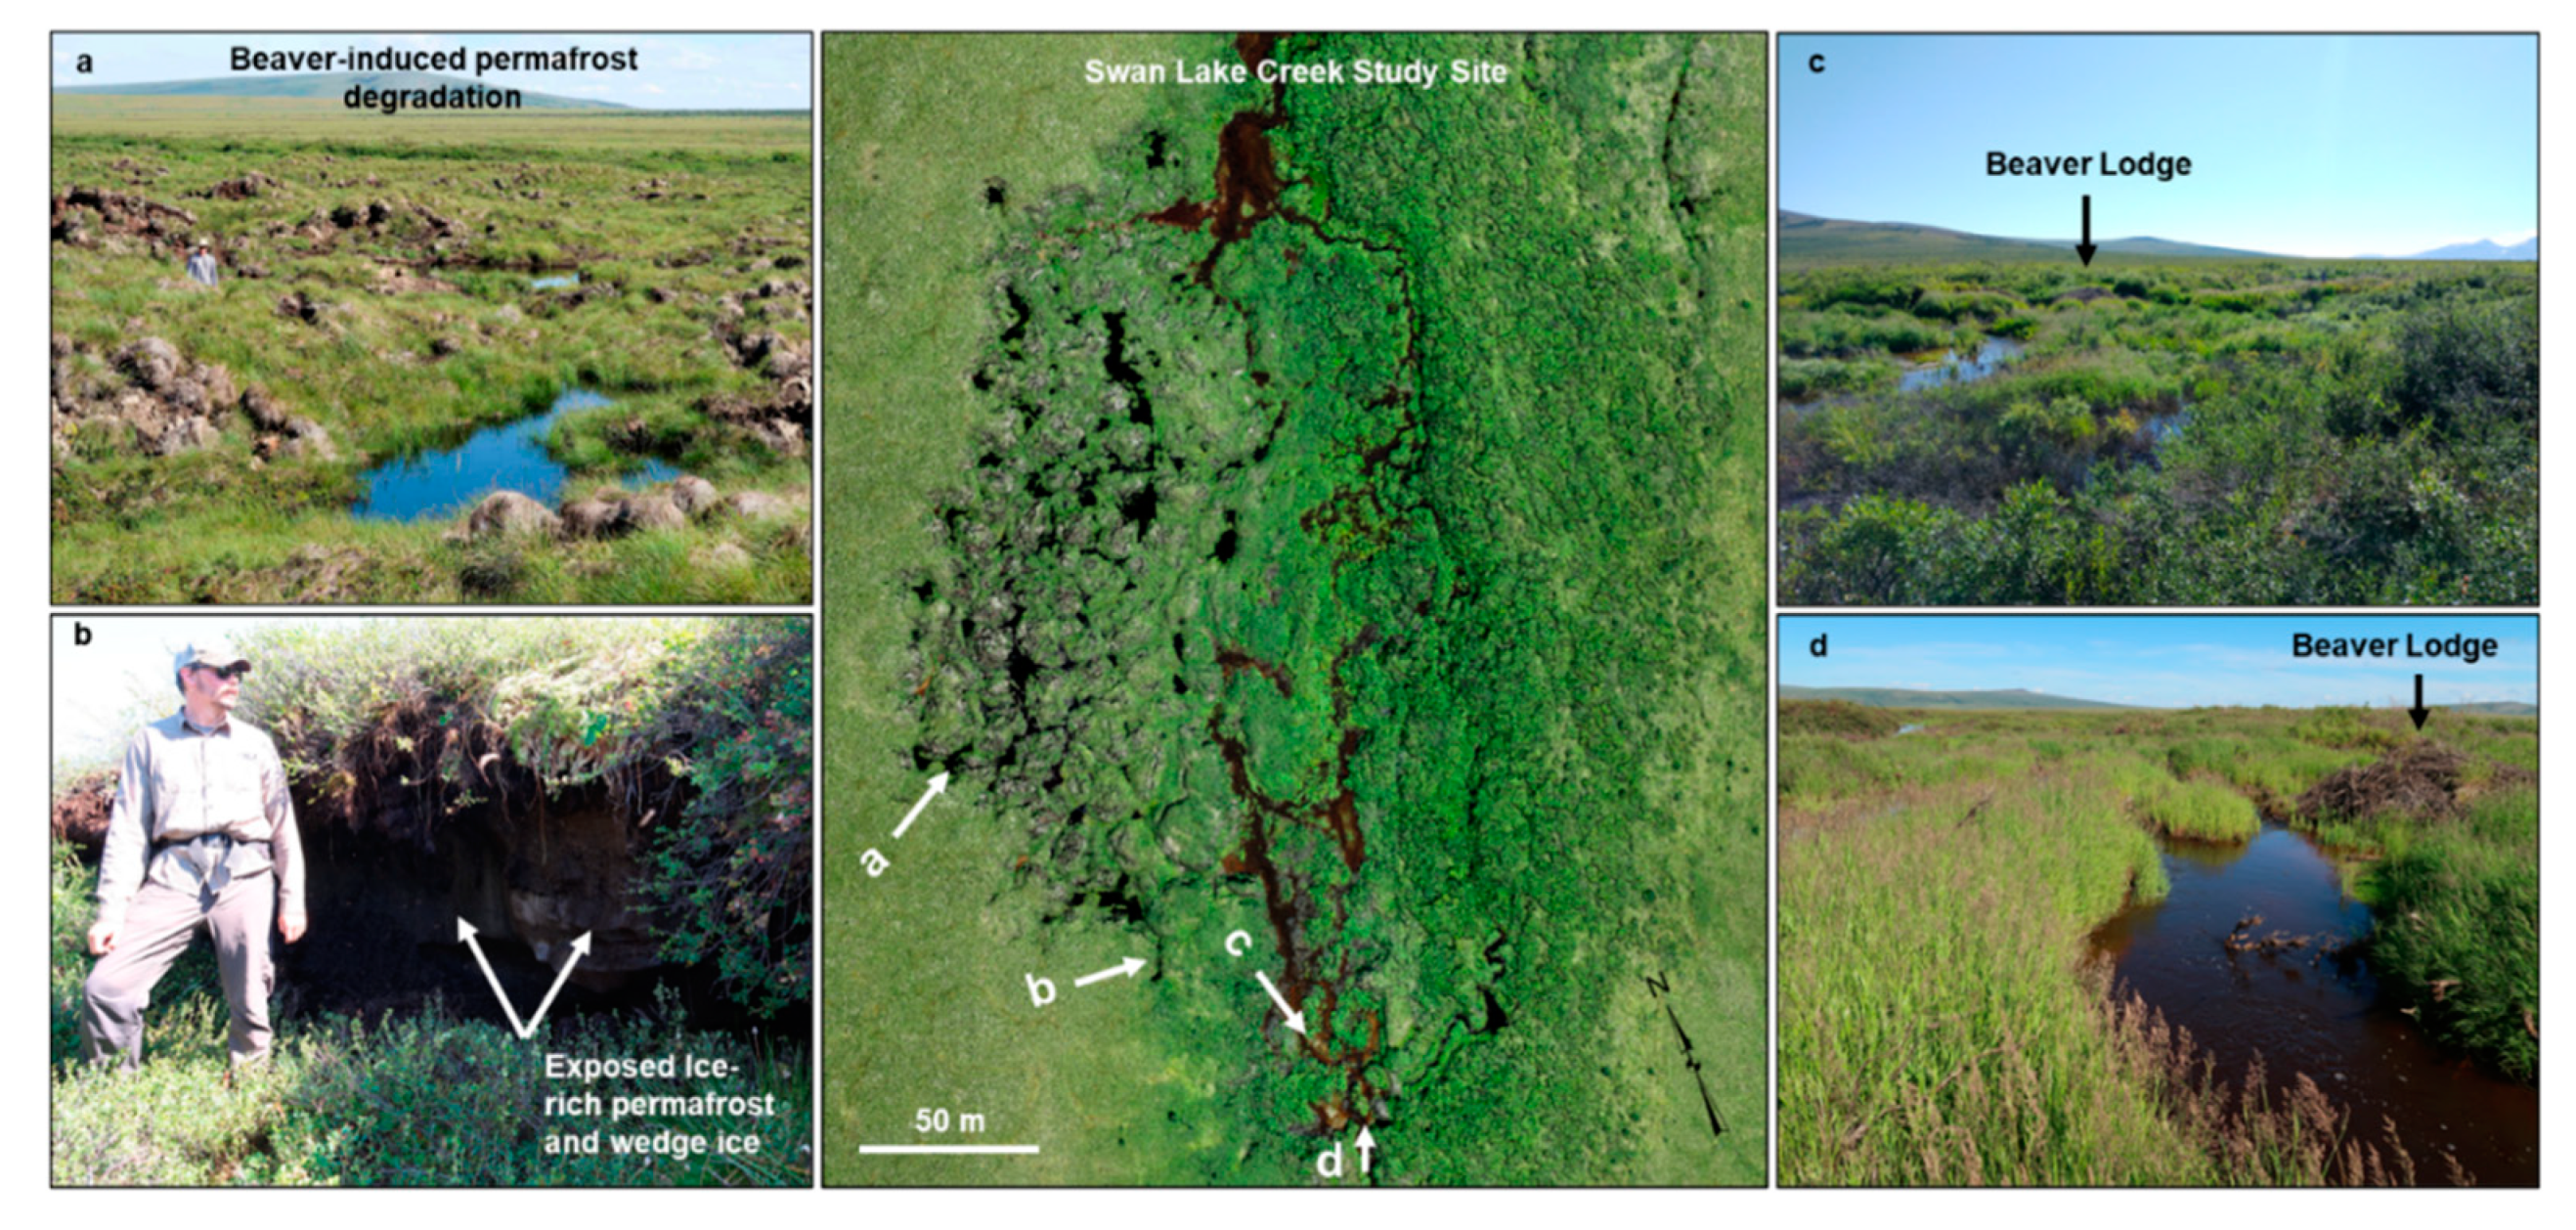
2.1. Study Area

The Seward Peninsula in northwestern Alaska covers a land area of approximately 65,000 km2. The mean annual air temperature ranges from −3 °C to −6 °C and the region typically receives between 200 and 500 mm of precipitation annually [57]. The Seward Peninsula primarily consists of tundra vegetation types that include erect dwarf-shrub and low-shrub tundra; tussock-sedge, dwarf-shrub, moss tundra; and sedge, moss, low-shrub wetland complexes [58]. The eastern and southcentral parts of the Seward Peninsula also contain scattered boreal forest tree stands and geothermal springs in the region [59]. The northern two-thirds of the region is within the continuous permafrost zone and the southern one-third represents the discontinuous permafrost zone [60]. There is high variability in the type of permafrost present on the Seward Peninsula with ice-rich permafrost terrain more common in the north and in the low-lying areas throughout the region [60]. The variability in permafrost ground-ice and local and regional topographic differences result in different vulnerabilities to lake, wetland, and hillslope permafrost degradation processes [61]. Nearly 5000 beaver ponds have been recently mapped in VHRS imagery from ca. 2010 to ca. 2020 on the entire Seward Peninsula, including a doubling of beaver ponds since 2000 (Figure 1a; [46]). The highest density of beaver ponds (~0.5 ponds/km2) occurs in the southcentral region of the Seward Peninsula [46].
The Swan Lake and Swan Lake Creek study area are centrally located in the dense and expanding footprint of beaver engineering on the Seward Peninsula (Figure 1). The site (65.194° N, 164.797° W) is adjacent to Kougarok Road which runs from the coast near Nome, Alaska, inland to the north for ~140 km. Prior to beaver arrival between 2006 and 2011, the Swan Lake Creek was a small, incised tundra stream draining an area of ~20 km2. The watershed contains a prominent drained lake basin, with several remnant lakes, and a moderate to steeply sloping hillside in its upper reaches.

2.2. Remote Sensing Observational Datasets

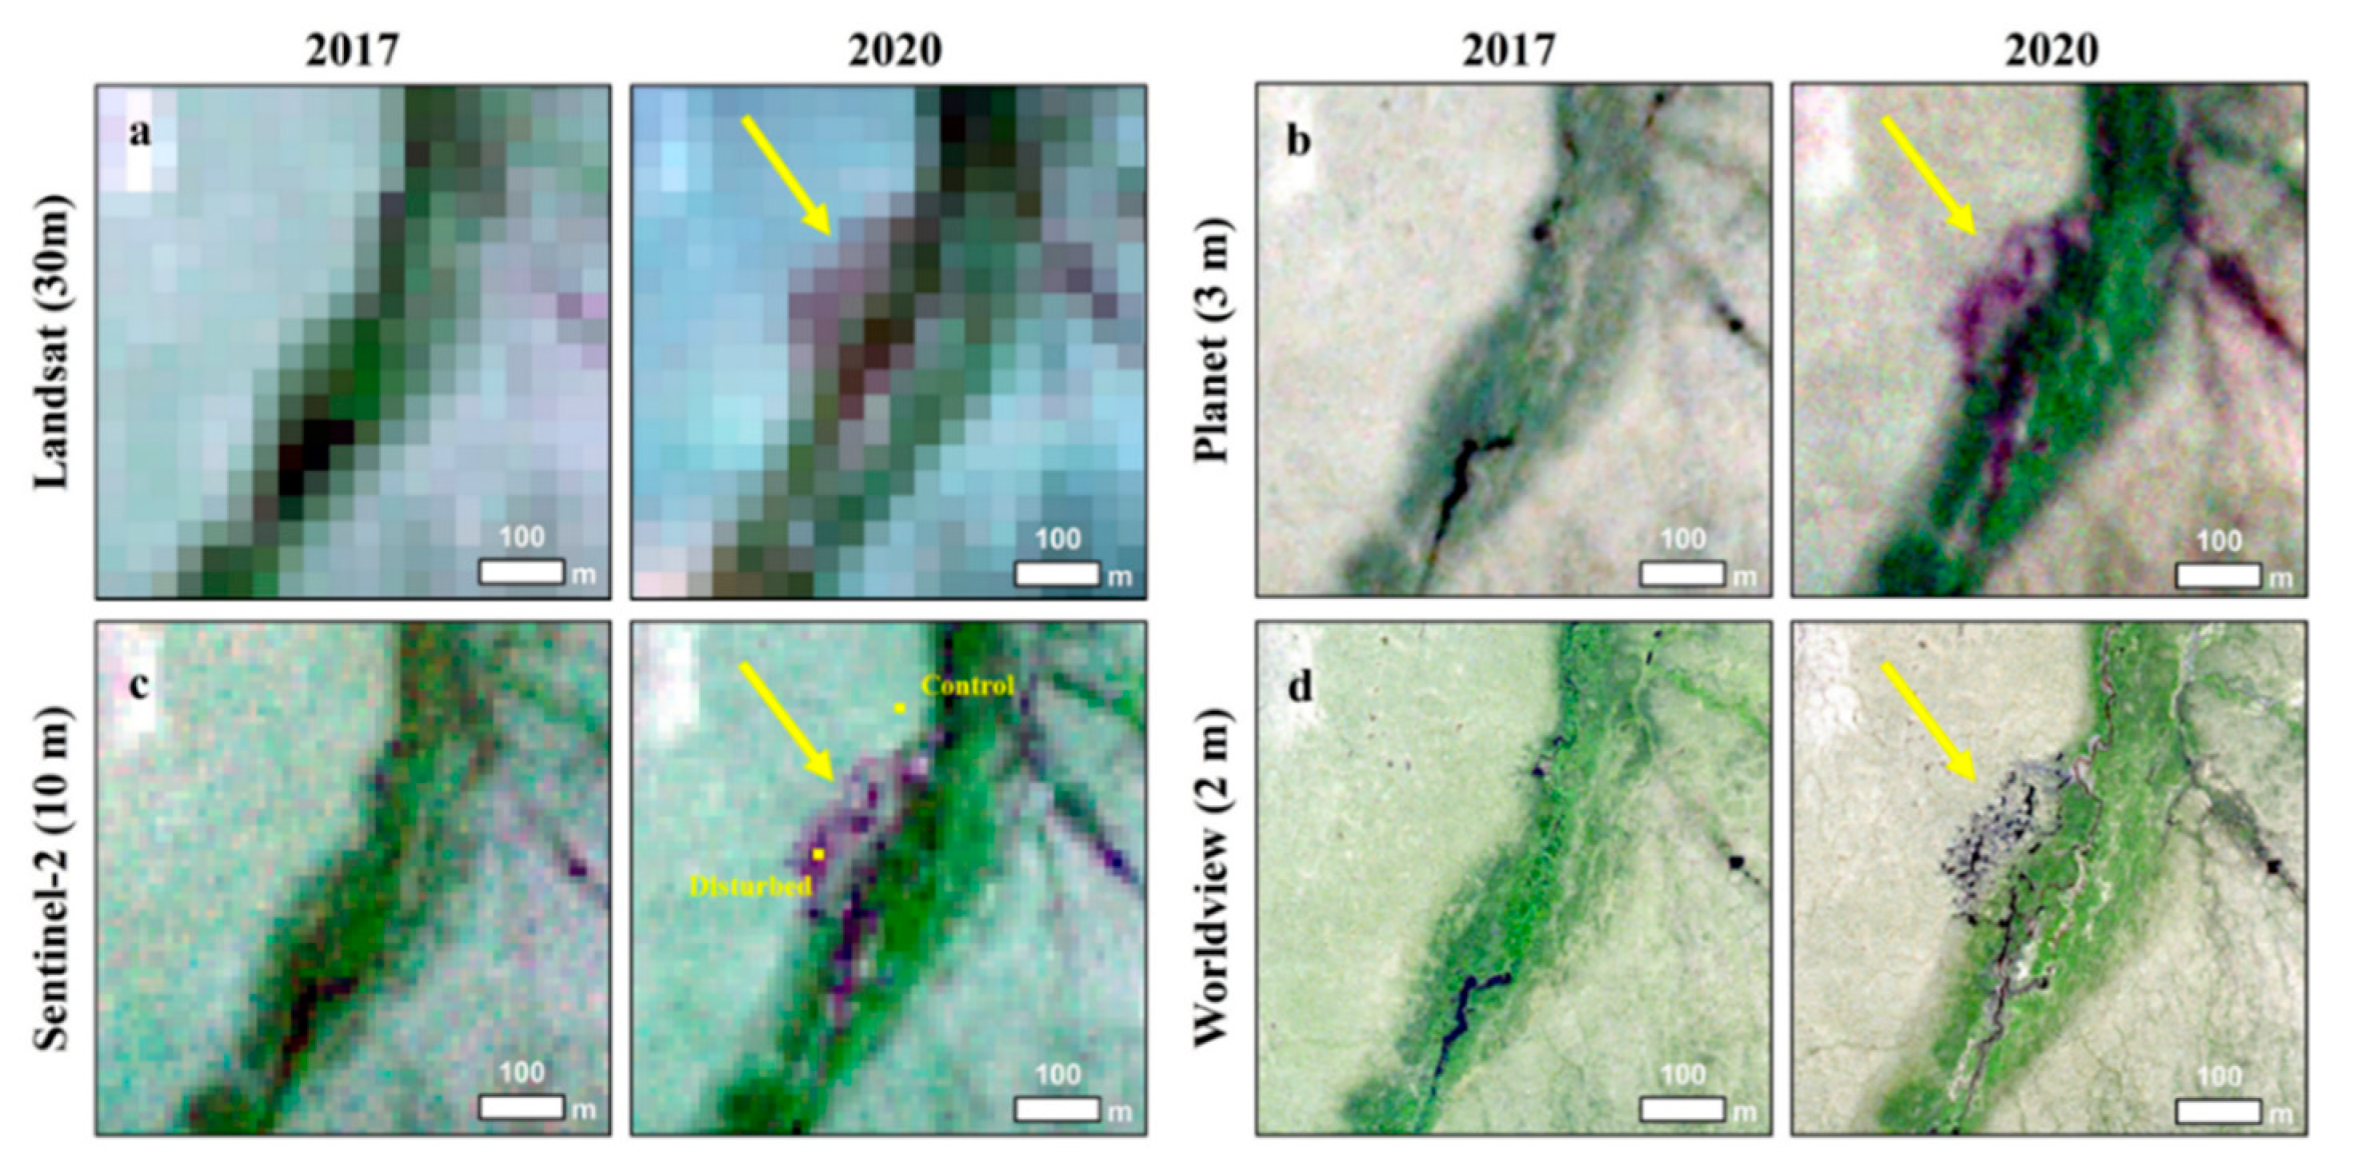
2.2.1. Multi-Resolution Optical Image Observations

Time series remote sensing data archives provide a valuable resource for reconstructing the timing of landscape disturbances. Our efforts focused on data derived from optical remote sensing resources with a spatial resolution of 30 m and finer for the time period of 2017–2021 (Table 1). We mined the entire archive of Landsat OLI (30 m) and Sentinel-2 (10 m) from 2017 to 2021 to reconstruct the formation of the beaver-induced permafrost degradation feature. Analysis of the 10–30 m resolution imagery provided a means of bracketing the formation of the feature based on the repeat cycle of the remote sensing platform and the presence of cloud-free conditions to constrain the timing in temporal bins of years to months. Visual observations based on the PlanetLabs, Inc. CubeSats archive was then used to further refine the timing of the disturbance event on time scales of days to weeks.

2.2.2. Reconstructing Beaver Activity

Beaver dams and the evolution of the stream channel network were mapped in the time series of commercial VHRS images from 2006 to 2021. Panchromatic imagery ranging from 0.5 to 1.0 m spatial resolution were acquired from the years 2006, 2011, 2014, 2015, 2017, 2019, 2020, and 2021. The imagery was orthorectified using the 2 arc-second resolution U.S. Geologic Survey National Elevation Dataset for Alaska and independent checks on the horizontal alignment of the image time series showed that the data were within +/− 4 m horizontally. This bias was removed by further rectifying each image to the 2021 image and then beaver dams and stream channels were manually mapped at a scale of 1:500 as vector line features in a GIS framework for each image in the time series [62].

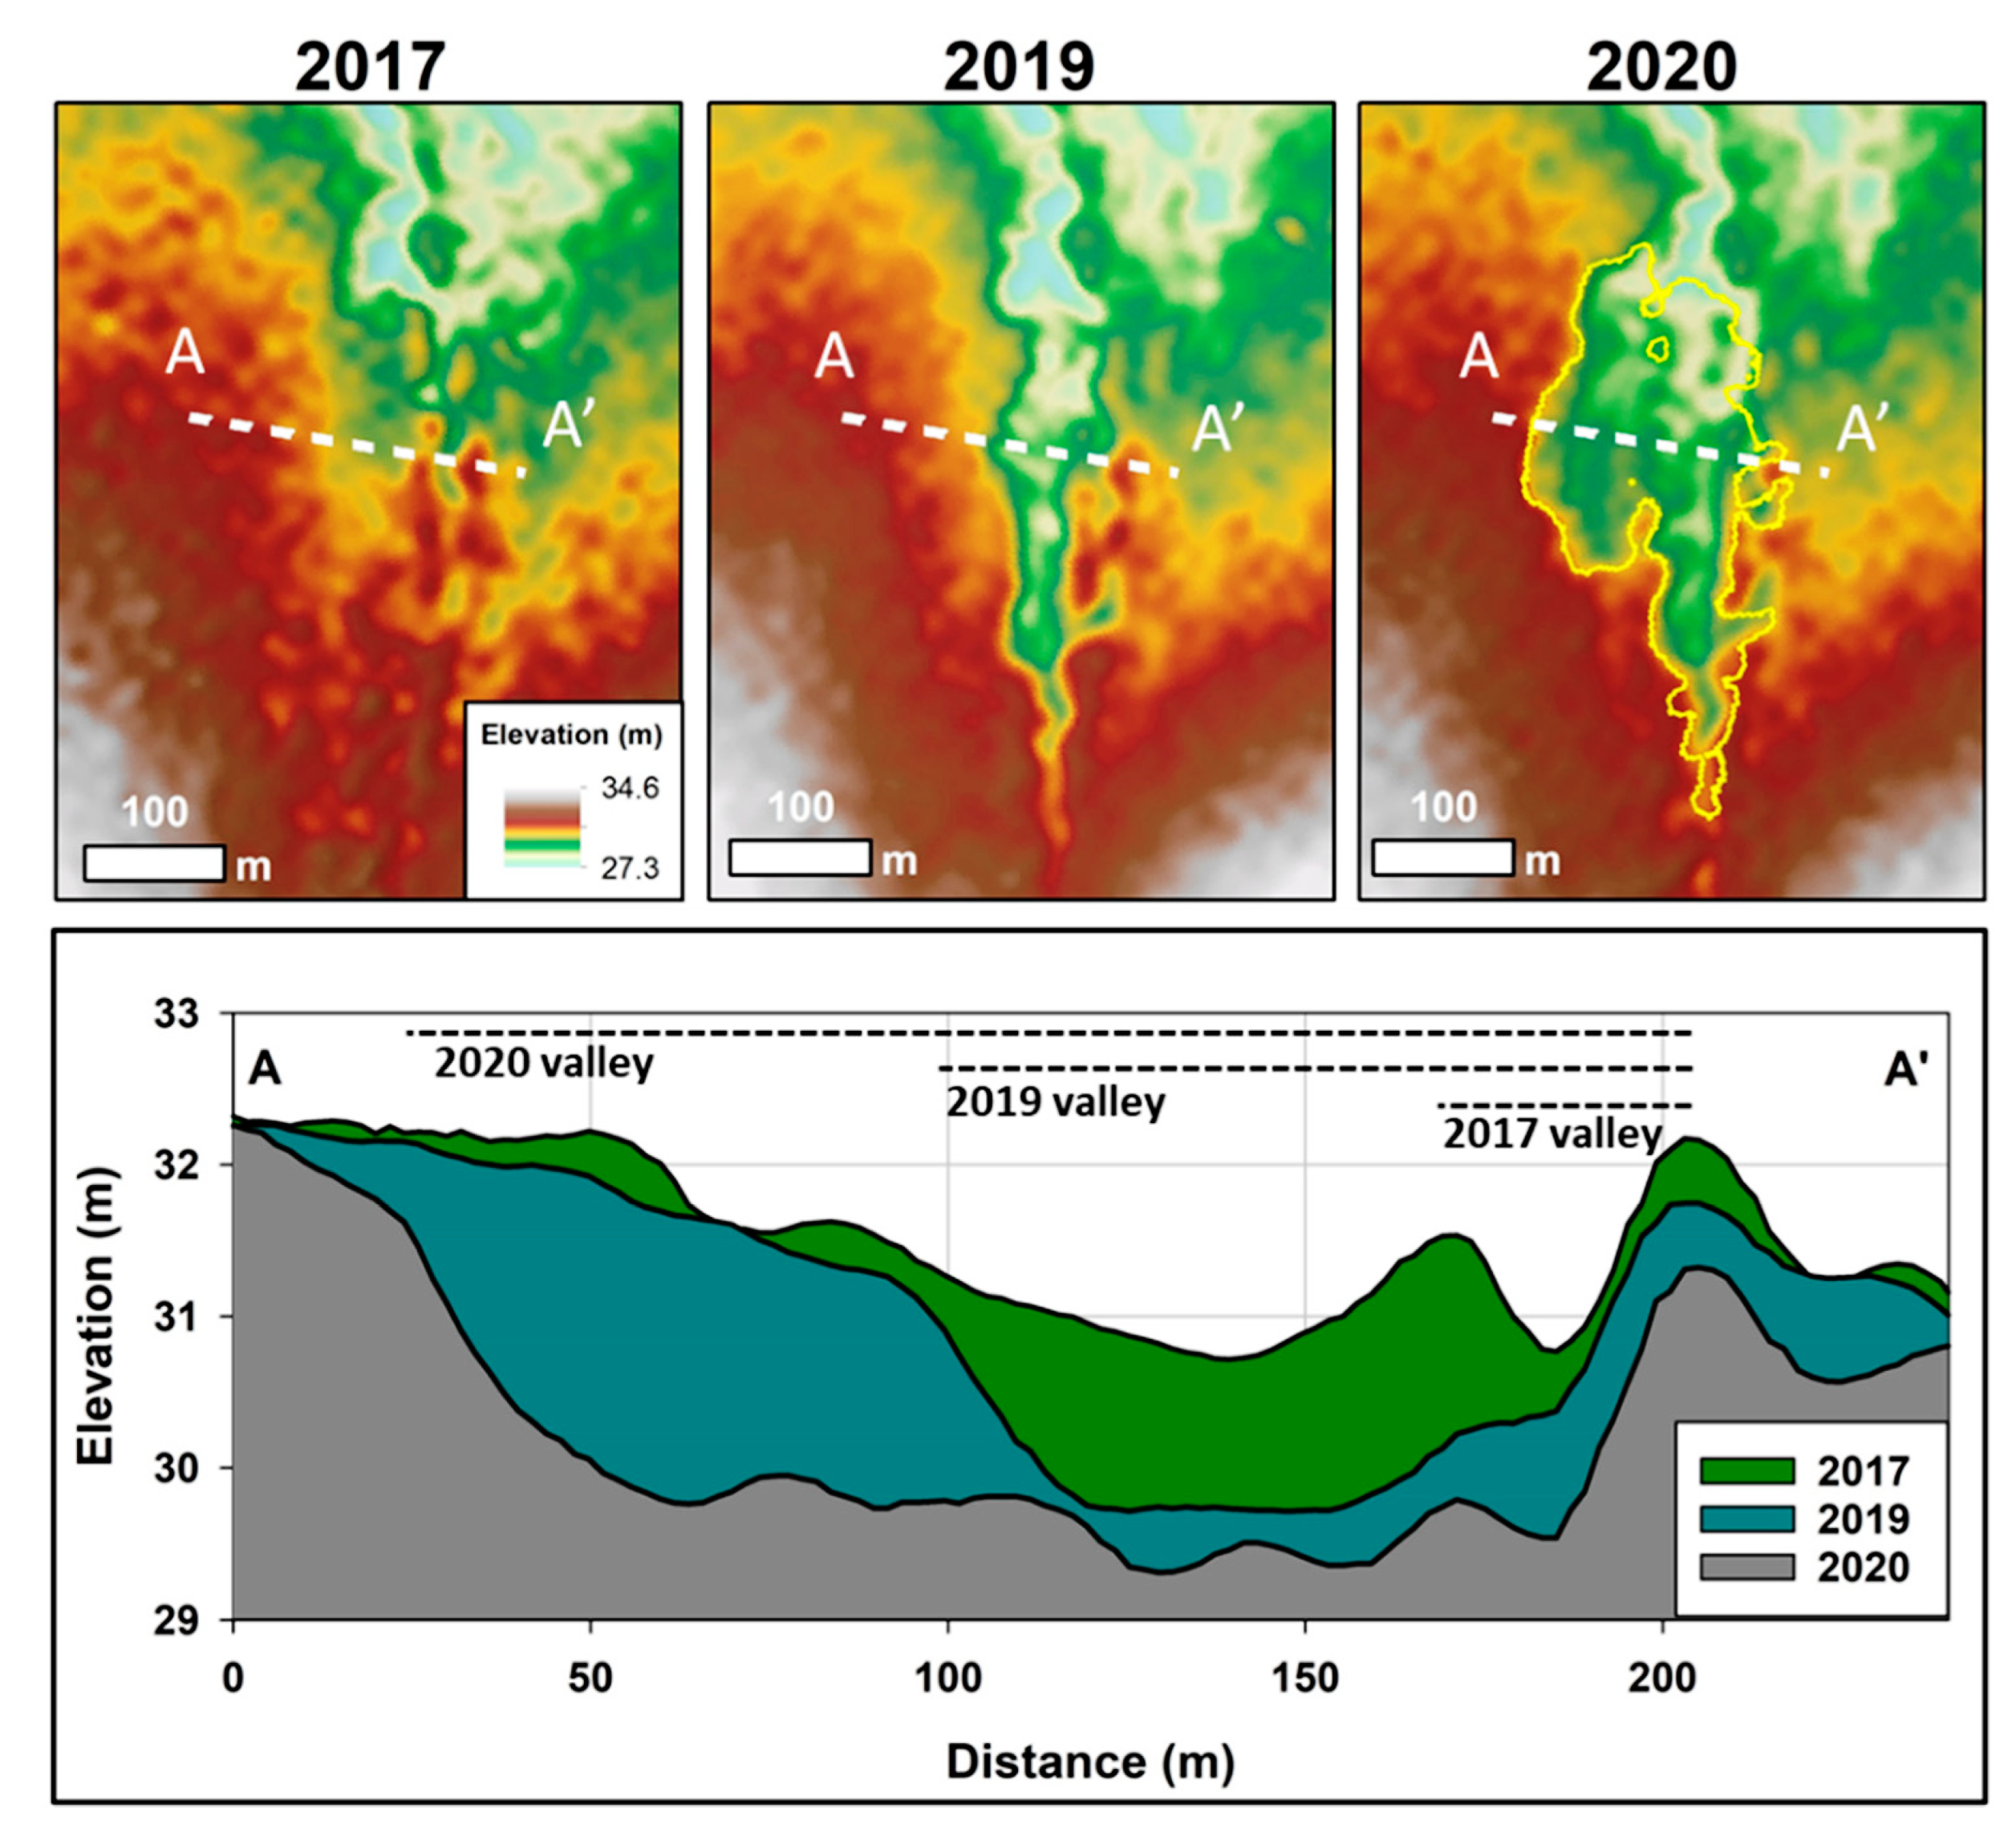
2.2.3. Measuring Topographic Change

We used a time series of digital surface model (DSM) data derived from the ArcticDEM project to assess the impact of beaver engineering on land surface elevation changes. ArcticDEM is a National Geospatial-Intelligence Agency (NGA)–National Science Foundation (NSF) public–private initiative to automatically produce a high-resolution, high quality, digital surface model (DSM) of the Arctic using optical stereo imagery, high-performance computing, and open-source photogrammetry software [63]. Suitable images were available for the Swan Lake Creek study site from 14 July 2017, 11 July 2019, and 8 June 2020. The data were provided with a vertical and horizontal accuracy of 6 and 4 m, respectively. To account for the vertical and horizontal differences in the datasets, identifiable landscape features were used to align the 2017 and 2019 images to the 2020 data with a horizontal accuracy of ~1.0 m and a vertical accuracy of ~0.5 m. The spatial resolution of the DSM products are 2 m and they allowed for the quantification of land surface elevation changes and the lateral expansion of the creek valley as a result of beaver engineering and permafrost degradation.

2.2.4. Multispectral Indices

Remote sensing data is a valuable tool for quantifying changes in vegetation and snow-cover over time [64,65]. Sentinel-2 imagery was used to create time series multi-spectral indices of NDVI and NDSI for a pixel located inside the disturbed area and an adjacent undisturbed pixel from 2017 to 2021. The Sentinel Hub EO Browser was used to search for cloud-free images available from 2017 to 2021 [66]. The “mark point of interest” function and the statistical info extractor was used in the browser to extract the time series of NDVI and NDSI data on a per-pixel-basis for the two locations. The data were further investigated manually to remove any cloud and shadow affected pixels. All cloud-free data points were plotted on an annual and seasonal basis and time-integrated data curves were developed using locally weighted regression in SigmaPlot13.

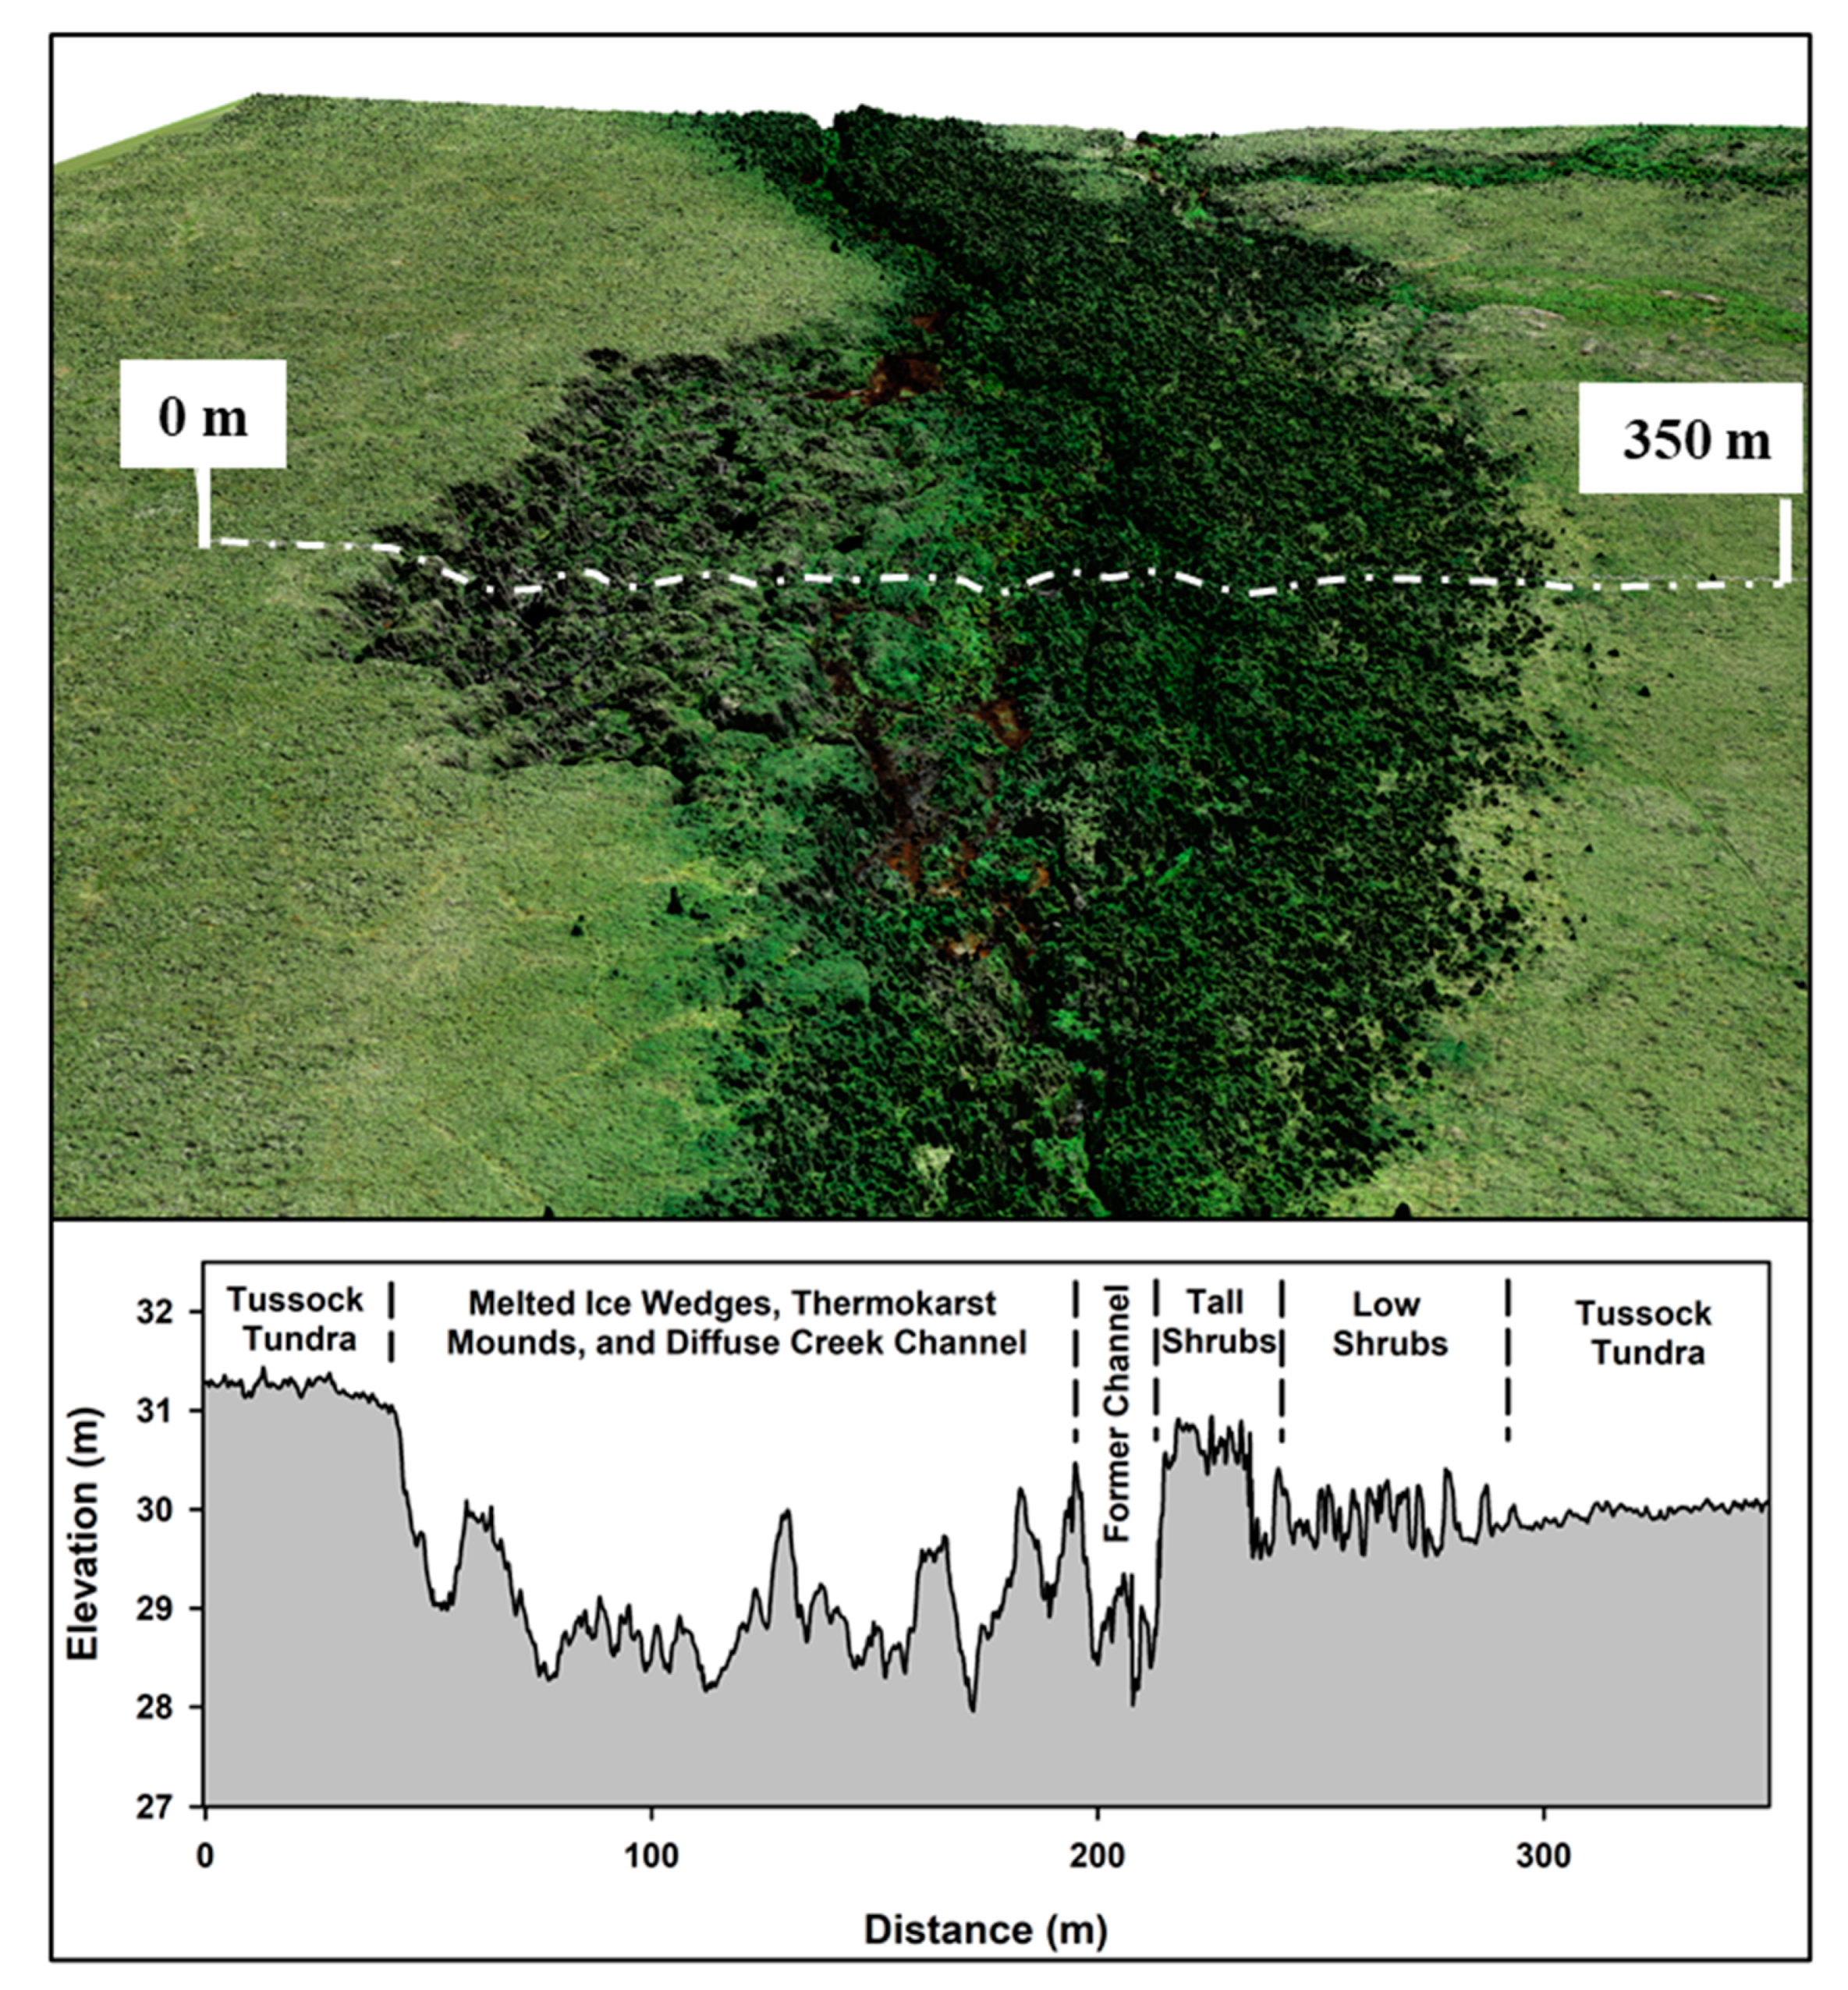
2.2.5. UAS Data Collection

A DJI P4RTK quadcopter and a DJI D-RTK 2 Mobile Station were used to acquire 759 images of the Swan Lake Creek study site on 6 August 2021. The UAS was flown at 100 m agl and flight speeds varied from 7–8 m/s. The frontlap and sidelap of the mission were set at 80% and 70%, respectively. All images were processed in the software Pix4D Mapper to produce an orthophoto mosaic and a digital surface model at spatial resolutions of 5 and 15 cm, respectively [62]. A Leica Viva differential GPS system provided ground control for the mission and the data were post-processed to WGS84 UTM Zone 3 North in Ellipsoid Heights. The data provide a more detailed assessment of the topographic relief associated with the beaver-induced permafrost degradation and a baseline with which to measure future change.

2.2.6. Summer Precipitation Data

We accessed daily precipitation data from the US National Weather Service station (USW00026617) in Nome, AK for the period 2006–2020 to represent the timing associated with beavers occupying the Swan Lake Creek drainage [67]. We analyzed daily precipitation data during the 2019 summer months of July and August and aggregated daily precipitation into weekly temporal bins for the entire 15-year record. We assessed the conditions in 2019 relative to the 15-year record and plotted data relative to the mean and standard deviation in weekly precipitation (2006–2020) to assess the occurrence of extreme precipitation events as a potential trigger for the beaver-induced permafrost degradation feature.

3. Results

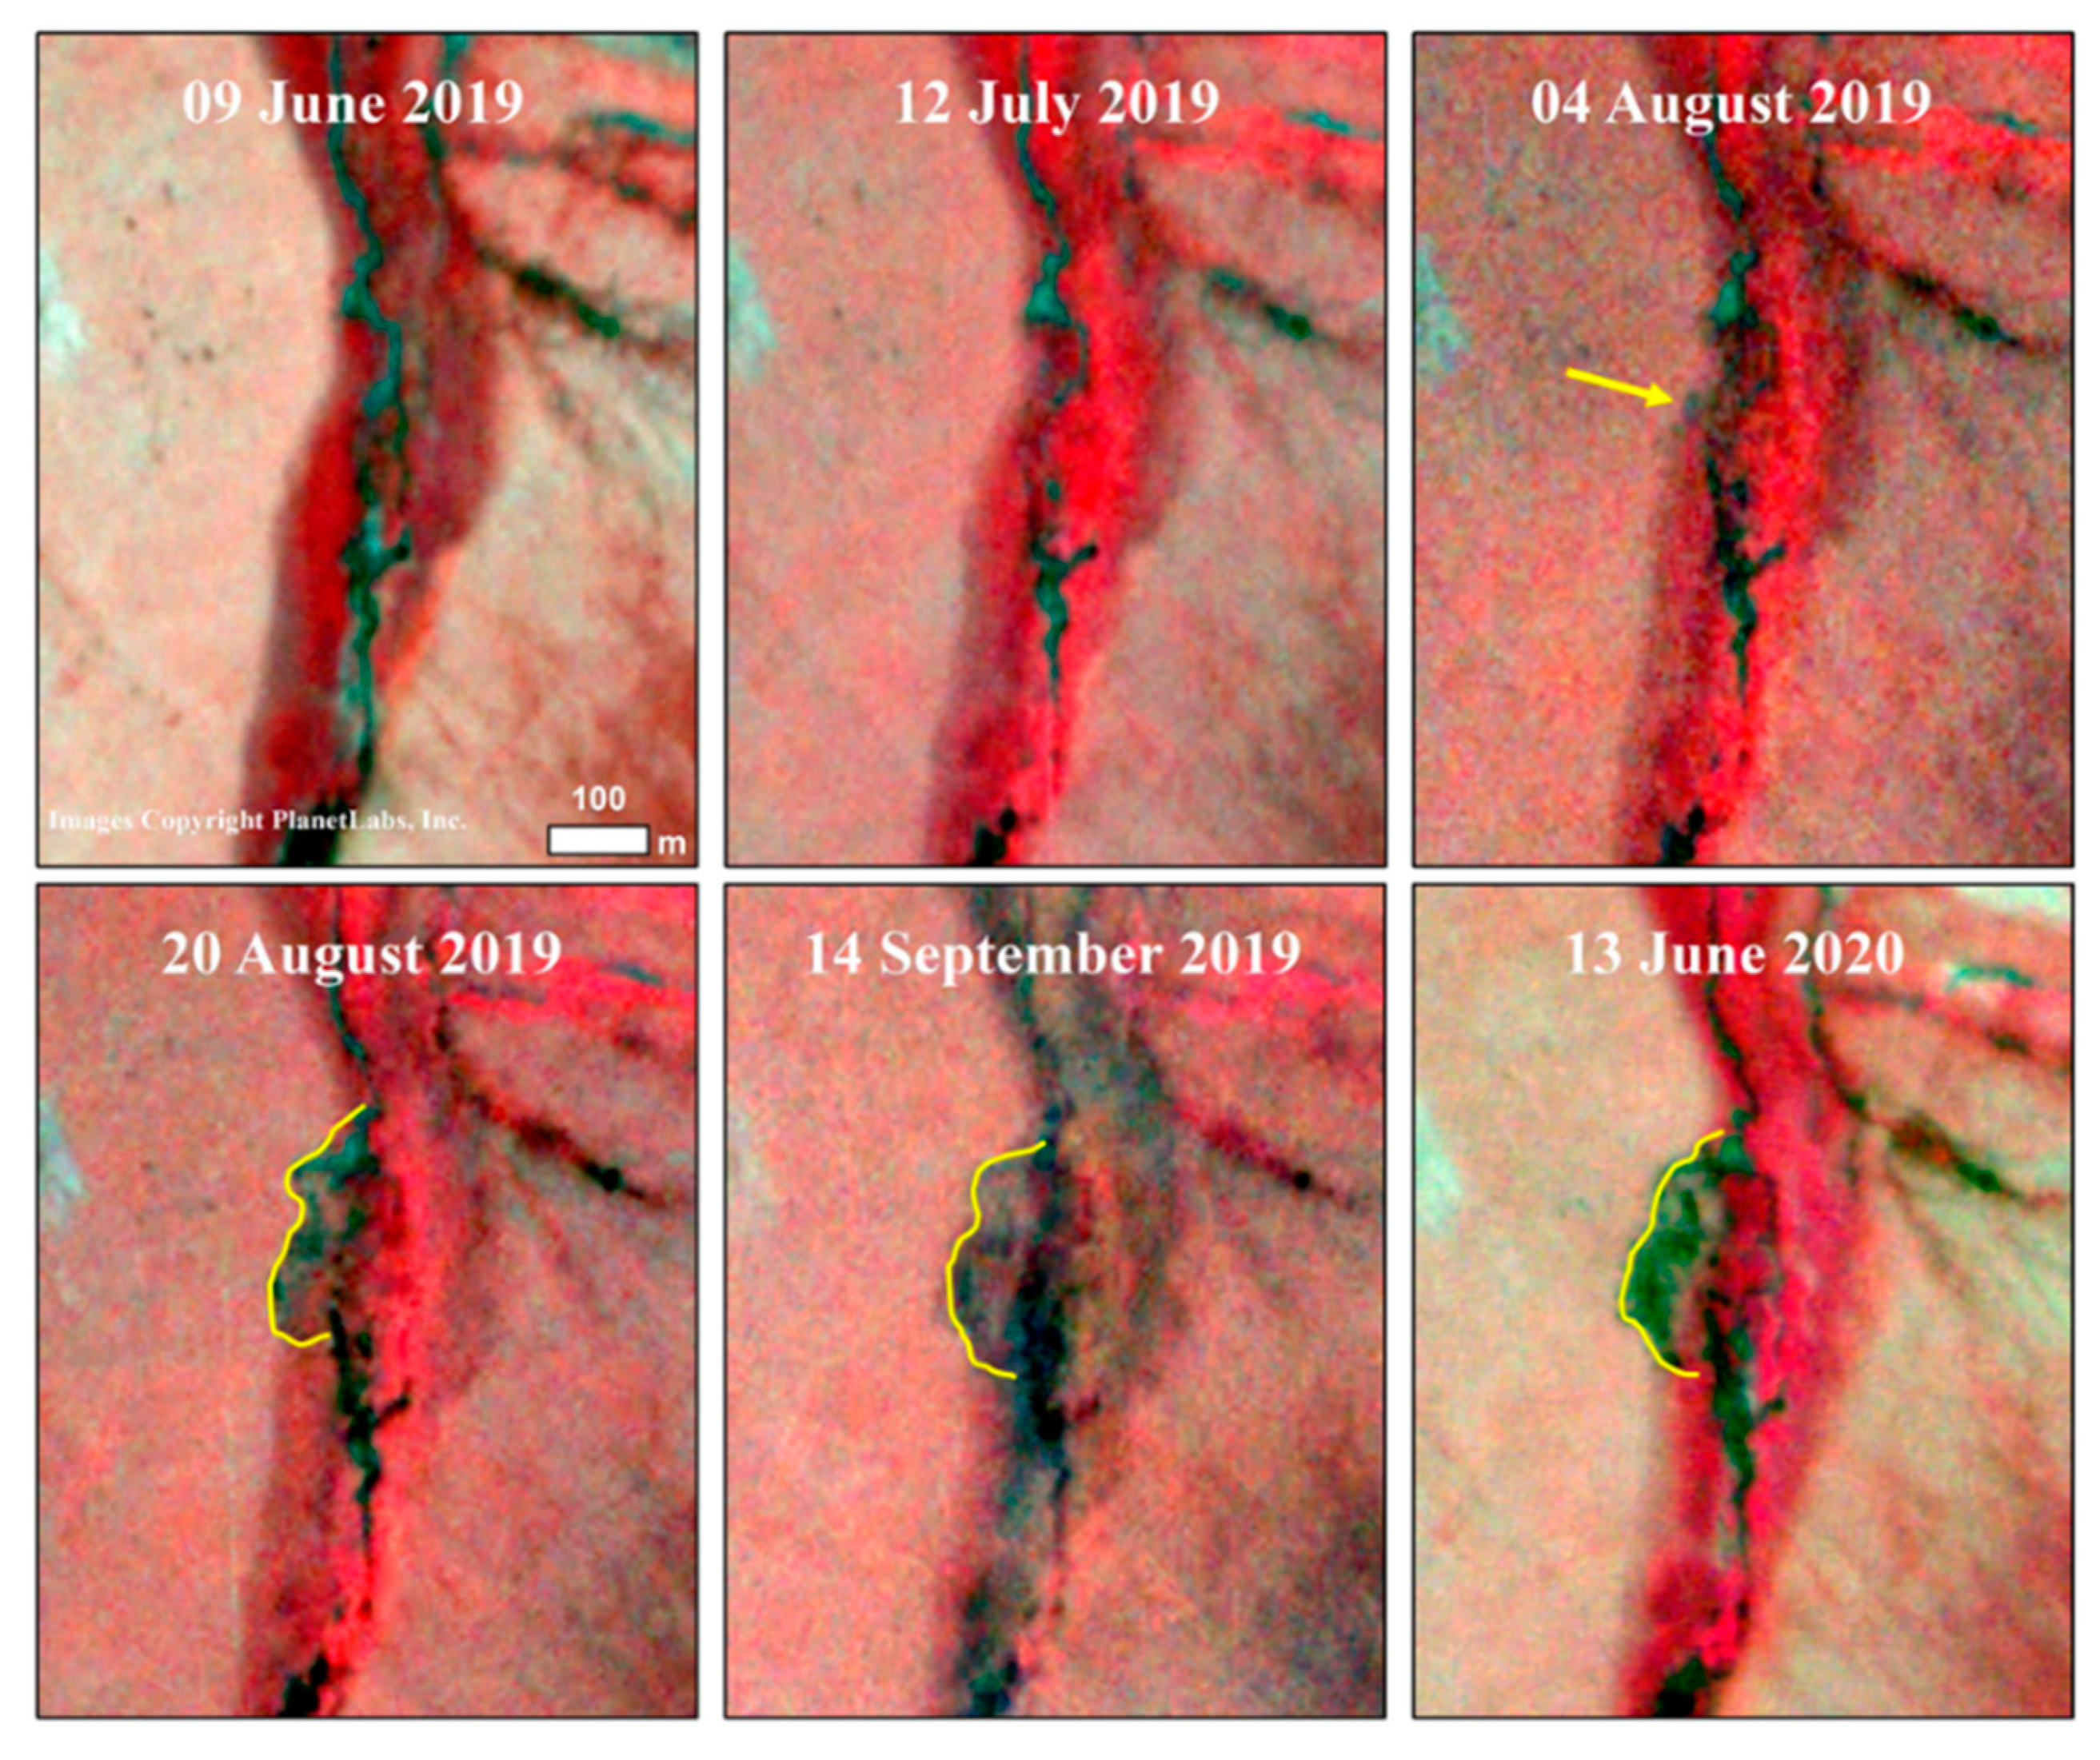
3.1. Timing of Beaver Activities

Analysis of multi-dimensional remote sensing data allowed for the detailed reconstruction of the timing and extent of beaver engineering and beaver-induced permafrost degradation in Swan Lake Creek, AK. The major disturbance event was bracketed to between 2017 and 2020 across four remote sensing platforms with varying spatial resolutions (Figure 3). Landsat OLI imagery provided a glimpse of the disturbance event but better refining the timing and extent of the disturbance was limited by long repeat acquisition intervals, pervasive cloud cover, and the relatively coarse resolution (30 m). The 17 cloud-free and snow-free Landsat OLI images between 2017 and 2020 bracketed the disturbance event to sometime after 9 July 2019 and before 2 June 2020. The increased spatial resolution and more frequent image acquisition repeat cycle of Sentinel-2 provided a more in-depth time series of observations for the permafrost degradation feature. There were 152 cloud-free and snow-free Sentinel-2 images available for the site between 2017 and 2020 that allowed us to better bracket the primary disturbance event to sometime during July and August of 2019.
Combining the higher spatial and temporal resolution observations from PlanetLabs Inc. imagery allowed for a more precise accounting of the event. The 3 m resolution PlanetLabs, Inc. imagery pinpointed the permafrost disturbance event to the roughly two-week period between 4 August 2019 and 20 August 2019 (Figure 4). The addition of the VHRS imagery from the DigitalGlobe, Inc. (Oakland, CA, USA)/Maxar constellation of satellites did not offer any further insight into the timing of the disturbance but it provided a detailed time series to reconstruct the beaver engineering that led to the disruptive event in 2019.
The more infrequent VHRS imagery, at ~0.5 m spatial resolution, provided the level of detail necessary for tracking beaver dam formation and disappearance between 2006 and 2021 (Figure 5). The first available image for the Swan Lake Creek study area is from 27 August 2006 and it showed that beavers had not yet begun to build dams in this portion of the drainage. Between 27 August 2006 and 27 July 2011, three beaver dams (mean length = 14.9 m) are visible in the VHRS imagery, representing the initial establishment of beavers in the stream reach (Figure 5). Between 27 July 2011 and 5 August 2014, the number of beaver dams increased to four (mean length = 21.9 m) and the location of the active beaver dams shifted along the stream corridor. Between 5 August 2014 and 23 June 2015, the number of dams increased by one and the previously existing dams were primarily extended (mean length = 24.4 m). The largest increase in the number of dams occurred between 23 June 2015 and 14 July 2017. Dam numbers nearly doubled from five to nine (mean length = 20 m) and a new dam located along the southwestern portion of the stream reach was constructed. Between 14 July 2017 and 8 July 2019, the number of dams decreased by three; however, the average length of each dam increased (mean length = 32.5 m). The image from 8 July 2019 preceded the failure of the dam complex by approximately one month. Following the failure of the dam complex system in 2019 the number of dams decreased to three (mean length = 20 m) by 8 June 2020, but again increased to nine small dams (mean length = 11.9 m) by 5 August 2021 as beavers began to re-engineer the diffuse stream network that they had developed through their beaver engineering and permafrost degradation.

3.2. Fluvial Geomorphology

The width of the valley increased between 2006 and 2020 as dam building diverted water and beaver-induced degradation of permafrost formed a new valley bottom (Figure 6). Between 2017 and 2019, beaver engineering and permafrost degradation widened the creek valley from 33 to 110 m, while 0.48 m of subsidence occurred on average. Between 2019 and 2020, continued beaver engineering and a catastrophic flood event resulted in fluvio-thermal erosion, thermal erosion, and thermokarst that widened the creek valley from 110 to 180 m, while 0.78 m of subsidence occurred on average. Between 2017 and 2020, the Swan Lake Creek valley widened by ~450%, a ~35,000 m2 area was affected by subsidence that averaged 1.68 m, with more than 2.25 m occurring locally between 2017 and 2020. The total volume of material (soil, ice, and vegetation) lost through beaver activities and beaver-induced permafrost degradation was ~59,000 m3.
Beaver-induced permafrost degradation and dam building also increased the length of the stream network in the Swan Lake Creek study area. Prior to the arrival of beavers in the study stream reach, the length of the creek was 0.6 km and confined to a single incised channel (Figure 7). There was no measurable change in the length of the stream network between 2006 and 2011 associated with the initial development of three beaver dams along the study reach. However, with the addition of four beaver dams between 2011 and 2014 and an additional dam in 2015, the stream channel network increased by an additional 9.6% and 4.4%, respectively. Between 2015 and 2017, the number of dams initially increased but between 2017 and 2019 the number of dams decreased while the mean length increased. This indicator of beavers better establishing their presence in the study area corresponded to a 13.7% increase in the length of the stream network between 2015 and 2017, which was followed by an additional 85.7% increase in the stream network length between 2017 and 2019 as lateral connectivity increased. The catastrophic failure of the beaver dam complex network during August 2019 created the permafrost degradation feature that further increased the length of the stream channel network by 27.8% by 2020. Between 2006 and 2021, the length of the stream channel network increased from ~0.6 km to more than 1.9 km, or a ~220% increase as a result of the combined effects of beaver engineering and permafrost degradation.

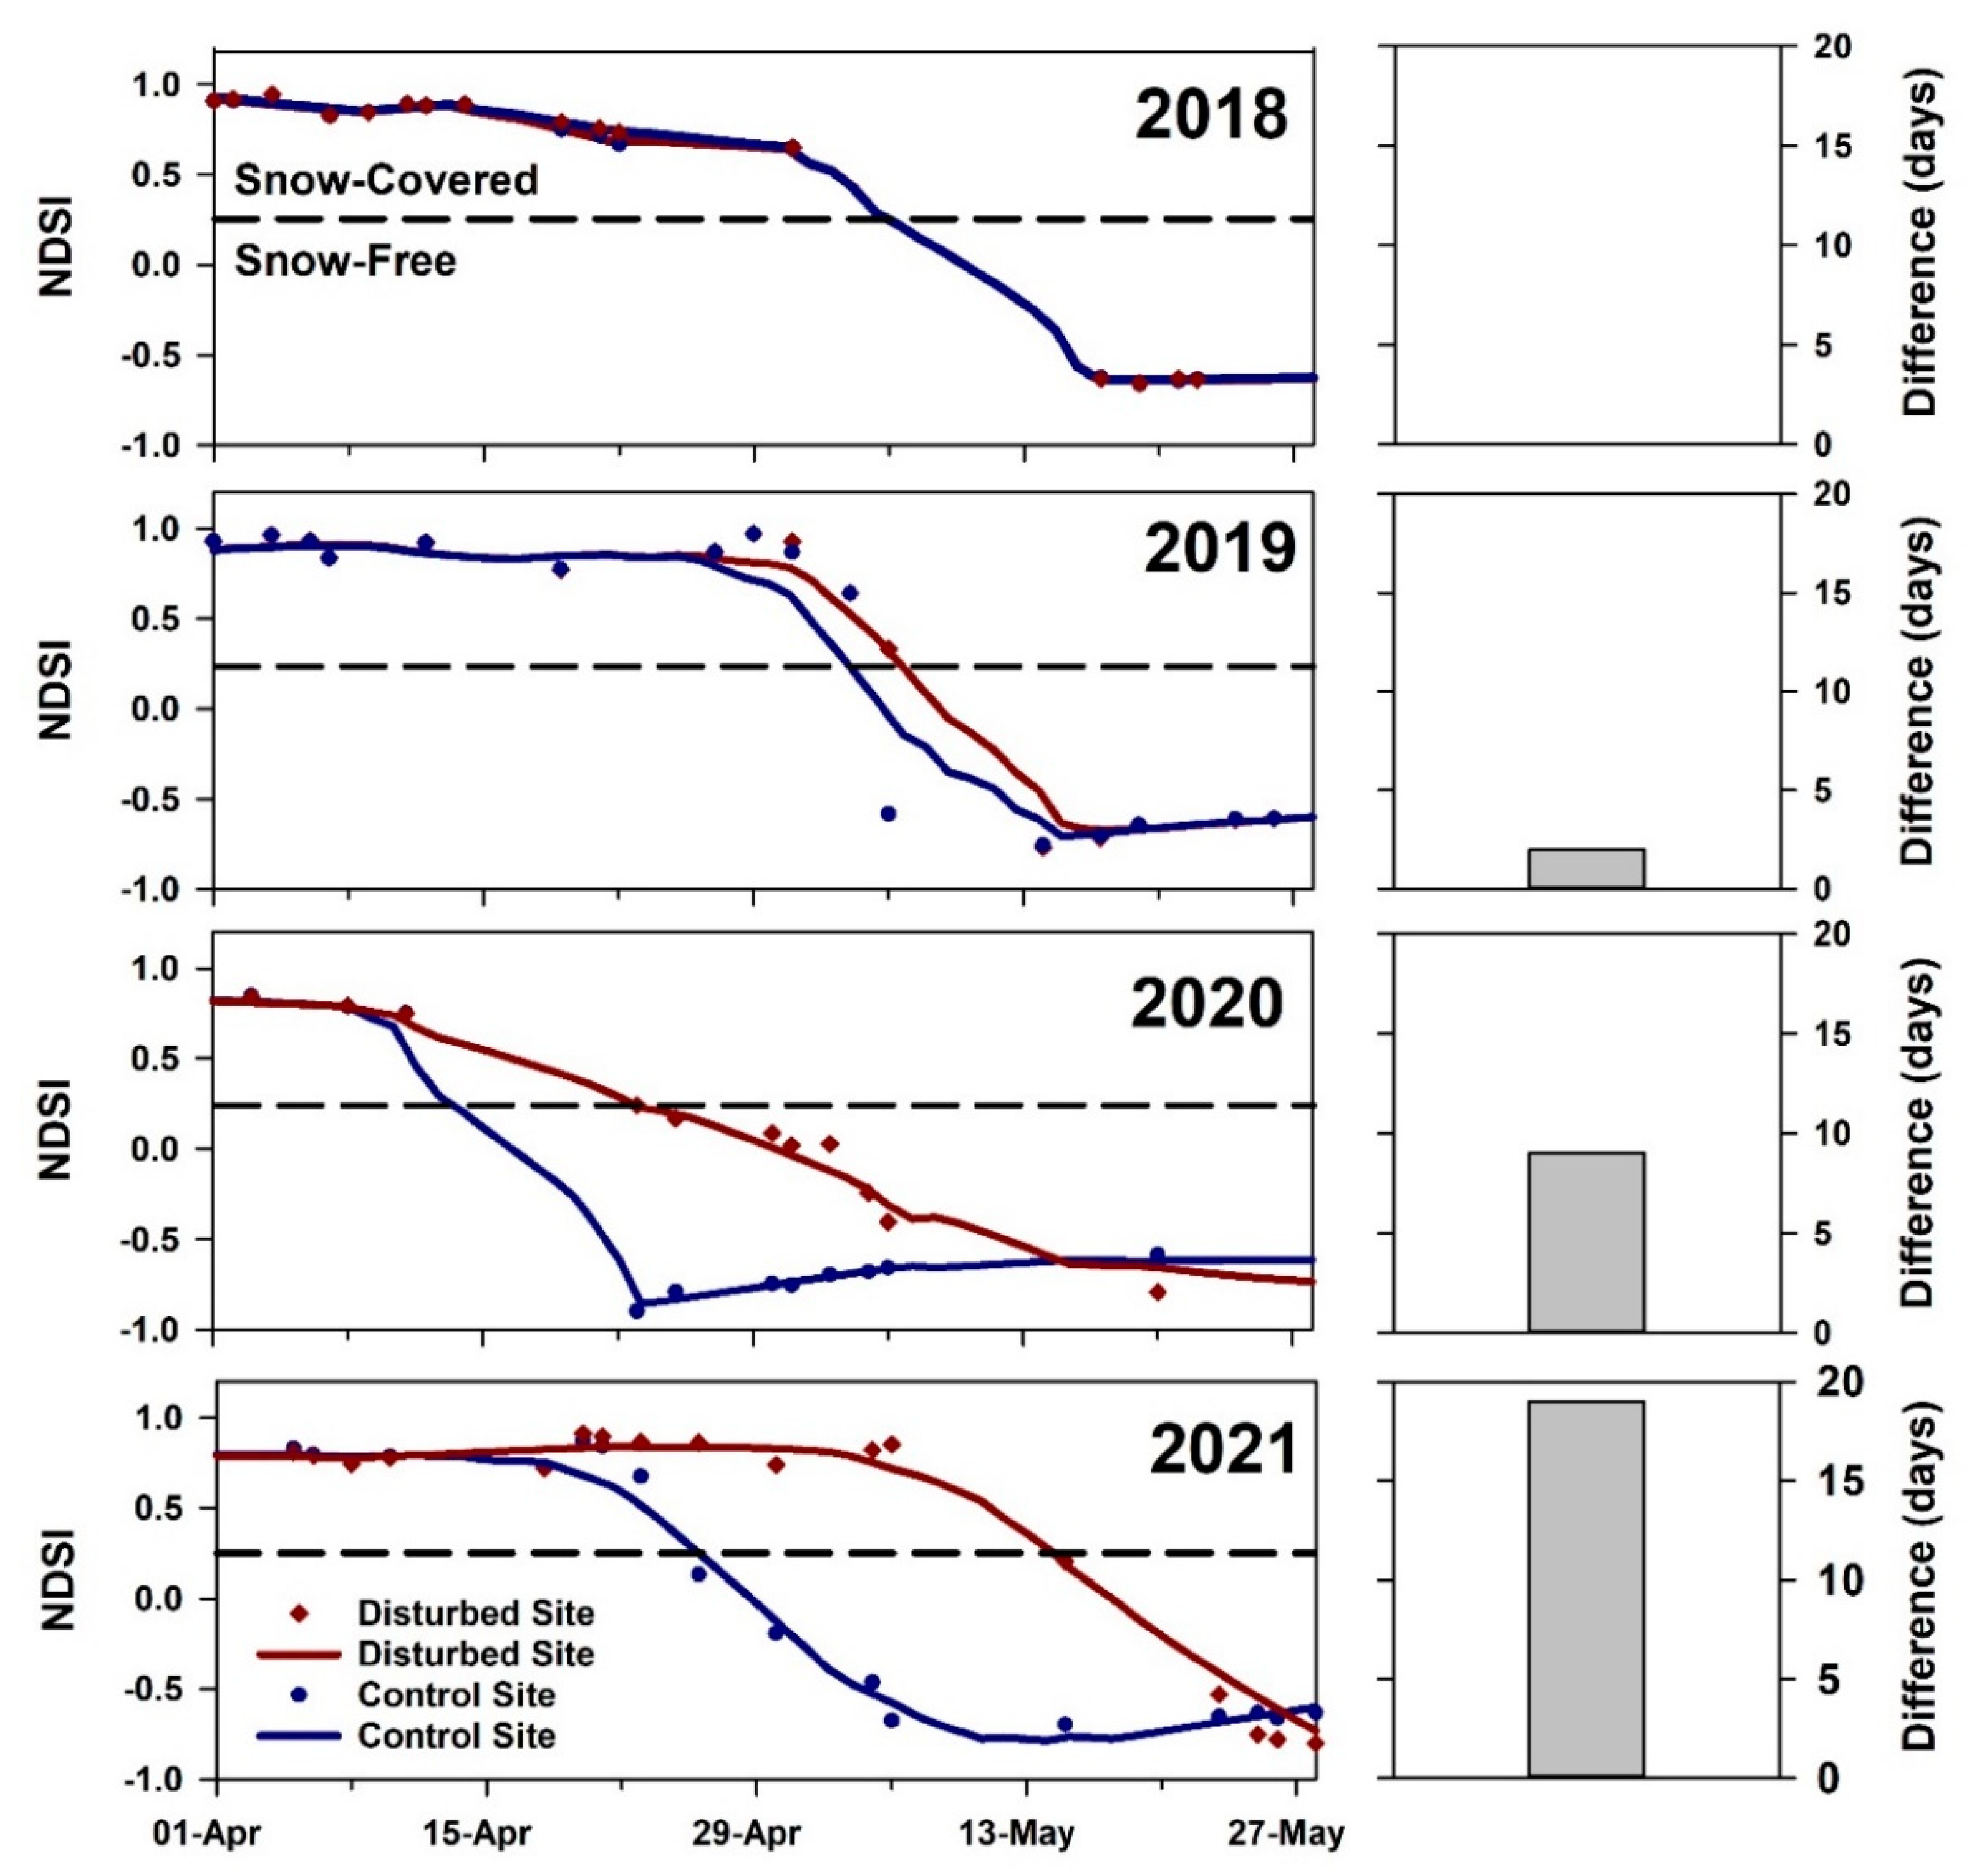
3.3. Changes in Vegetation and Snow

Formation of the beaver-induced permafrost degradation feature caused a decrease and delay in the timing of the peak NDVI the year following the disturbance. Pixel-based, Sentinel-2-derived, NDVI time-series extracted from the beaver-disturbed area relative to an adjacent control site that was unaffected by permafrost degradation showed that NDVI at the two sites tracked one another up until August 2019 (Figure 8). The beaver induced permafrost degradation feature is evident in the rapid decline in NDVI that started in August 2019 relative to the control site. NDVI values at the disturbed area were 14% lower a month after the disturbance relative to the control site. In the first full growing season following the disturbance, early season NDVI was 36% lower, the peak was 23% lower, the peak occurred 8 days later, but the end of season NDVI was roughly the same.
The beaver-induced permafrost degradation feature also resulted in a difference in the timing of snowmelt relative to an adjacent unaffected control site (Figure 9). Pixel-based NDSI data were extracted from the same locations used for the NDVI analysis. The snow melted at both sites on the same day in 2018 (5 May) and within two days of one another in 2019 (4 May and 6 May), the spring before the disturbance. The abrupt increase in the time that snow lingers as a result of the beaver-induced permafrost degradation feature becomes evident in 2020 and 2021. The spring following permafrost degradation, the snow lasted eight days longer at the disturbed site (22 April 2020) relative to the control site (13 April 2020). Two years after the initial disturbance the snow at the disturbed site (14 May 2021) lingered 19 days longer than at the control site (25 April 2021).

4. Discussion

We were able to reconstruct the development of a beaver-induced permafrost degradation feature based on detailed spatial and temporal analysis of multi-dimensional remote sensing imagery. No one remote sensing tool is particularly suited for quantifying and characterizing the way in which permafrost regions are changing in response to disturbances, owing to the varying spatial and temporal scales of change [52]. In this study, we used imagery that ranged in spatial resolution from 30 to 0.05 m and with infrequent temporal coverage to near daily observations. The use of multi-dimensional remote sensing data and the combination of manual and automated image analysis techniques allowed us to reconstruct (1) the timing of beaver engineering on permafrost degradation, (2) widening of the creek valley, (3) an increase in the stream channel network, (4) lowering of peak growing season NDVI, and (5) a prolonging of the spring snowmelt period associated with the beaver-induced permafrost degradation feature. In particular, the observations made in this study using time series remote sensing imagery that document the coupled response of a decrease in the magnitude and timing of peak NDVI and a shift towards a later snow-off date in the permafrost disturbed area could be combined to potentially identify other disturbances to permafrost at regional to pan-Arctic scales using Sentinel-2 imagery.
The catastrophic dam failure that promoted formation of the beaver-induced permafrost degradation feature likely occurred in response to high stream flow caused by a multi-day record rainfall event (Figure 10). Analysis of the daily rainfall data from the weather station in Nome, AK showed that there was more than 50 mm of rain on 2 August 2019 (Figure 10a) and that the nine days prior to the period that bracketed formation of the beaver-induced permafrost degradation feature were the highest on record for the 15-year observation period between 2006 and 2020. In particular, rainfall during the week prior to 5 August 2019 was five times higher than the average weekly rainfall during the period of beaver occupation in the Swan Lake Creek drainage (Figure 10b). Observations of failure of the dam complex and initiation of the beaver-induced permafrost degradation feature following record rainfall has implications for the ongoing rapid expansion of beavers [37,44,47] in an Arctic that is experiencing hydrologic intensification [68,69]. With the more than doubling in beaver ponds on the Seward Peninsula between 2000 and 2020 [46], the likelihood of more widespread beaver-induced permafrost degradation associated with dam failures due to an increase in extreme precipitation events has increased in the 21st Century [70]. The combination of increasing beaver dams and rainfall will likely result in an increase in lateral erosion and downstream effects in lowland permafrost regions in the future.
The results presented in this study are an example of pronounced lateral bank erosion associated with beaver dam failure in ice-rich permafrost (Figure 11). Beaver dams are known to breach centrally or laterally [71]. In temperate regions of North America, dam breaches have been shown to easily erode deposited pond sediments but with minimal lateral bank erosion [72]. Our observations highlight the effects of more than a decade of beaver engineering in a creek confined in ice-rich permafrost that ultimately resulted in a breach and a catastrophic failure of the dam complex system during a two week period in August 2019, over which time the creek valley widened by 150 m through permafrost degradation. The widening of the creek valley also increased lateral hydrologic connectivity in the system. Beaver damming has been shown to increase lateral connectivity and decrease longitudinal connectivity in stream channel networks [73,74]. However, in river and stream corridors in temperate systems that are incised or contain smaller floodplains, the ability of beavers to increase lateral connectivity is limited [73]. In the case of our Swan Lake Creek study reach, the initial confinement was modified as beaver engineering re-routed water to increase the width of stream channel valley through degradation of ice-rich permafrost, ultimately increasing lateral connectivity in the system, further highlighting the unique interaction of beavers and permafrost landscapes [43,47].
The beaver-induced permafrost degradation feature in Swan Lake Creek adds a new permafrost degradation mode to previously characterized mechanisms in Arctic and Boreal regions [75,76]. In the case of our feature, the re-routing of an increasing water level laterally into an ice-rich hillslope, followed by the catastrophic failure of the interconnected waterways, likely led to both lateral (fluvio) [77,78] and top-down thermal erosion [79,80] that occurred preferentially along ice wedge networks. The unique nature of the combined effects of both lateral and top-down thermal erosion is what makes the beaver-induced permafrost degradation feature appear to be unique. This process created an amphitheater-shaped feature that increased the width of the valley by ~150 m, where subsidence of the terrain was as high as 2.25 m (Figure 11). Based on the VHRS imagery, it appears that the majority of thaw subsidence occurred as a result of the fluvio-thermal and thermal erosional processes, but that continued degradation is being driven by thermokarst. The unique setting and processes involved with the initial development of the beaver-induced permafrost degradation feature require further field study to more fully understand the operative processes but there are likely few instances where this type of feature could be generated without the influence of beaver engineering. Other factors that could lead to similar conditions would be a human-built dam along a stream reach or a landslide or thaw slump that blocks the flow of water in a river or creek valley [81]. The combination of fluvio-thermal erosion, thermal erosion, and subsequent thermokarst processes add a unique disruptive event in permafrost regions and warrants inclusion of beaver-induced permafrost degradation as an emerging arctic landscape change mechanism (Figure 12).
The role of beaver engineering on permafrost terrain changes is gaining recognition in Arctic and Boreal landscapes [43,47]. Previous work has shown that beaver engineering can degrade permafrost through water impoundment and inundation of permafrost [44,47,48]. Studies such as this case study provide local insights clarifying the timing of beaver arrival and the multi-faceted impacts to permafrost systems. This study adds the role of failed beaver engineering as an important component of lateral and downstream degradation of ice-rich permafrost. In general, however, the effects of beavers as a key aspect of permafrost degradation in lowland permafrost regions remains largely unaccounted for [43,46]. Adding beaver disturbance to the changing permafrost landscape and the positive feedbacks to permafrost degradation associated with ponding water, thaw subsidence, lateral and downstream effects, and increased snow accumulation is the focus of a recent project funded by the US National Science Foundation, Arctic Beaver Observation Network (A-BON): Tracking a new disturbance regime. A-BON is focused on observations of beaver engineering across circumarctic treeline and tundra environments during the last half-century by mapping and tracking beaver ponds using satellite imagery, field studies, and co-production of knowledge with remote Indigenous communities. Detailed remote sensing observations provided by this study across a range of spatial and temporal scales also provide valuable insights for Phase III of the NASA ABoVE field campaign. While our study focused solely on optical remote sensing datasets, future efforts would benefit from the inclusion of radar-based remote sensing data, such as those available through the NASA ABoVE campaign, to characterize the effects of beavers on ice-rich permafrost terrain [82,83,84].

5. Conclusions

In this study, we used multi-dimensional remote sensing observations to document the occurrence, reconstruct the timing, and highlight the effects of beaver activity on a small creek valley confined by ice-rich permafrost on the Seward Peninsula, Alaska. Beavers initially occupied the creek drainage between 2006 and 2011 and progressively engineered the system to create a complex mosaic of beaver dams that re-routed the stream channel network through 2019, when a catastrophic failure in the system led to the development of a beaver-induced permafrost degradation feature during a roughly two-week period in August 2019. The abrupt thaw event has subsequently been modified by thermokarst processes. As a result of beaver engineering and its subsequent impact on ice-rich permafrost soils the creek valley widened by ~450% and the length of the stream channel network increased by ~220%. Analysis of multi-spectral indices (NDVI and NDSI) showed that the beaver-induced permafrost degradation resulted in a 23% reduction in peak growing season NDVI the summer after the disturbance and a lengthening of the snow-melt period by nearly 20 days. Our detailed remote sensing observations provide the most comprehensive assessment of beaver engineering and its potential role in degrading ice-rich permafrost landscapes in the Arctic. In addition, this study adds to the growing set of observations that have highlighted the need to consider beavers and their activities on models of future landscape change in Arctic and Boreal regions. Efforts such as the NSF-Funded Arctic Boreal Observation Network (A-BON) and the third phase of the NASA ABoVE field campaign provide the foundation for more holistically understanding the interactions of physical, ecological, and social systems as they relate to beavers and permafrost.

Author Contributions

Conceptualization, B.M.J., K.D.T., J.A.C. and A.C.B.; methodology, B.M.J. and M.K.W.J.; formal analysis, B.M.J. and M.K.W.J.; investigation, B.M.J., K.D.T., J.A.C., A.C.B., M.K.W.J., B.V.G., C.D.E., C.W. and C.E.M.; data curation, B.M.J. and M.K.W.J.; writing—original draft preparation, B.M.J.; writing—review and editing, B.M.J., K.D.T., J.A.C., A.C.B., M.K.W.J., B.V.G., C.D.E., C.W. and C.E.M.; visualization, B.M.J.; supervision, K.D.T.; funding acquisition, K.D.T., B.M.J. and J.A.C. The manuscript benefited from collegial discussions among all coauthors. All authors have read and agreed to the published version of the manuscript.

Funding

Funding for this research was provided by US National Science Foundation awards OPP-1850578, OPP-2114051, and OIA-1929170. M.K. Ward Jones is supported by NASA New (Early Career) Investigator Program award 80NSSC21K1820. C.D. Elder thanks the NASA Postdoctoral Program for support. A portion of this work was carried out at the Jet Propulsion Laboratory, California Institute of Technology, under a contract with the National Aeronautics and Space Administration (80NM0018D0004). CDE and CEM participate as part of NASA’s Arctic Boreal Vulnerability Experiment (ABoVE). Geospatial support for this work provided by the Polar Geospatial Center under NSF-OPP awards 1043681 and 1559691. DEMs provided by the Polar Geospatial Center under NSF-OPP awards 1043681, 1559691, and 1542736.

Institutional Review Board Statement

Not applicable.

Informed Consent Statement

Not applicable.

Data Availability Statement

The derived data that support the findings presented in the study are available at the NSF-Funded Arctic Data Center. Landsat images were accessed through the U.S. Geological Survey Earth Explorer archive (https://earthexplorer.usgs.gov/, accessed on 20 November 2021). The Sentinel-2 images and indices were accessed through the European Space Agency (ESA) Sentinel-hub (https://apps.sentinel-hub.com/eo-browser/, accessed on 20 November 2021). The ArcticDEM data were accessed through the University of Minnesota Polar Geospatial Center (PGC) (https://www.pgc.umn.edu/data/arcticdem/, accessed on 20 November 2021). The DigitalGlobe, Inc./MAXAR imagery were provided by the PGC through NSF-OPP awards 1043681 and 1559691. The PlanetLabs Inc. imagery was accessed through Planet Explorer (https://www.planet.com/explorer/, accessed on 20 November 2021).

Conflicts of Interest

The authors declare no conflict of interest. The funders had no role in the design of the study; in the collection, analyses, or interpretation of data; in the writing of the manuscript, or in the decision to publish the results.

References

  1. Graham, R.M.; Cohen, L.; Petty, A.A.; Boisvert, L.N.; Rinke, A.; Hudson, S.R.; Nicolaus, M.; Granskog, M.A. Increasing Frequency and Duration of Arctic Winter Warming Events. Geophys. Res. Lett. 2017, 44, 6974–6983. [Google Scholar] [CrossRef] [Green Version]
  2. Landrum, L.; Holland, M.M. Extremes Become Routine in an Emerging New Arctic. Nat. Clim. Chang. 2020, 10, 1108–1115. [Google Scholar] [CrossRef]
  3. Bintanja, R.; Andry, O. Towards a Rain-Dominated Arctic. Nat. Clim. Chang. 2017, 7, 263–267. [Google Scholar] [CrossRef]
  4. Bintanja, R. The Impact of Arctic Warming on Increased Rainfall. Sci. Rep. 2018, 8, 16001. [Google Scholar] [CrossRef] [PubMed] [Green Version]
  5. Box, J.E.; Colgan, W.T.; Christensen, T.R.; Schmidt, N.M.; Lund, M.; Parmentier, F.-J.W.; Brown, R.; Bhatt, U.S.; Euskirchen, E.S.; Romanovsky, V.E.; et al. Key Indicators of Arctic Climate Change: 1971–2017. Environ. Res. Lett. 2019, 14, 045010. [Google Scholar] [CrossRef]
  6. Jenkins, M.; Dai, A. The Impact of Sea-Ice Loss on Arctic Climate Feedbacks and Their Role for Arctic Amplification. Geophys. Res. Lett. 2021, 48, e2021GL094599. [Google Scholar] [CrossRef]
  7. Lawrence, D.M.; Slater, A.G.; Tomas, R.A.; Holland, M.M.; Deser, C. Accelerated Arctic Land Warming and Permafrost Degradation during Rapid Sea Ice Loss. Geophys. Res. Lett. 2008, 35. [Google Scholar] [CrossRef] [Green Version]
  8. Biskaborn, B.K.; Smith, S.L.; Noetzli, J.; Matthes, H.; Vieira, G.; Streletskiy, D.A.; Schoeneich, P.; Romanovsky, V.E.; Lewkowicz, A.G.; Abramov, A.; et al. Permafrost Is Warming at a Global Scale. Nat. Commun. 2019, 10, 264. [Google Scholar] [CrossRef] [PubMed] [Green Version]
  9. Berner, L.T.; Massey, R.; Jantz, P.; Forbes, B.C.; Macias-Fauria, M.; Myers-Smith, I.; Kumpula, T.; Gauthier, G.; Andreu-Hayles, L.; Gaglioti, B.V.; et al. Summer Warming Explains Widespread but Not Uniform Greening in the Arctic Tundra Biome. Nat. Commun. 2020, 11, 4621. [Google Scholar] [CrossRef] [PubMed]
  10. Pearson, R.G.; Phillips, S.J.; Loranty, M.M.; Beck, P.S.A.; Damoulas, T.; Knight, S.J.; Goetz, S.J. Shifts in Arctic Vegetation and Associated Feedbacks under Climate Change. Nat. Clim. Chang. 2013, 3, 673–677. [Google Scholar] [CrossRef]
  11. Tape, K.; Sturm, M.; Racine, C. The Evidence for Shrub Expansion in Northern Alaska and the Pan-Arctic. Glob. Chang. Biol. 2006, 12, 686–702. [Google Scholar] [CrossRef]
  12. Myers-Smith, I.H.; Grabowski, M.M.; Thomas, H.J.D.; Angers-Blondin, S.; Daskalova, G.N.; Bjorkman, A.D.; Cunliffe, A.M.; Assmann, J.J.; Boyle, J.S.; McLeod, E.; et al. Eighteen Years of Ecological Monitoring Reveals Multiple Lines of Evidence for Tundra Vegetation Change. Ecol. Monogr. 2019, 89, e01351. [Google Scholar] [CrossRef] [Green Version]
  13. Wrona, F.J.; Johansson, M.; Culp, J.M.; Jenkins, A.; Mård, J.; Myers-Smith, I.H.; Prowse, T.D.; Vincent, W.F.; Wookey, P.A. Transitions in Arctic Ecosystems: Ecological Implications of a Changing Hydrological Regime. J. Geophys. Res. Biogeosciences 2016, 121, 650–674. [Google Scholar] [CrossRef] [Green Version]
  14. Lafrenière, M.J.; Lamoureux, S.F. Effects of Changing Permafrost Conditions on Hydrological Processes and Fluvial Fluxes. Earth-Sci. Rev. 2019, 191, 212–223. [Google Scholar] [CrossRef]
  15. McCarty, J.L.; Aalto, J.; Paunu, V.-V.; Arnold, S.R.; Eckhardt, S.; Klimont, Z.; Fain, J.J.; Evangeliou, N.; Venäläinen, A.; Tchebakova, N.M.; et al. Reviews and Syntheses: Arctic Fire Regimes and Emissions in the 21st Century. Biogeosciences 2021, 18, 5053–5083. [Google Scholar] [CrossRef]
  16. Wang, J.A.; Sulla-Menashe, D.; Woodcock, C.E.; Sonnentag, O.; Keeling, R.F.; Friedl, M.A. Extensive Land Cover Change across Arctic–Boreal Northwestern North America from Disturbance and Climate Forcing. Glob. Chang. Biol. 2020, 26, 807–822. [Google Scholar] [CrossRef] [PubMed]
  17. Farquharson, L.M.; Romanovsky, V.E.; Cable, W.L.; Walker, D.A.; Kokelj, S.V.; Nicolsky, D. Climate Change Drives Widespread and Rapid Thermokarst Development in Very Cold Permafrost in the Canadian High Arctic. Geophys. Res. Lett. 2019, 46, 6681–6689. [Google Scholar] [CrossRef] [Green Version]
  18. Nitze, I.; Cooley, S.W.; Duguay, C.R.; Jones, B.M.; Grosse, G. The Catastrophic Thermokarst Lake Drainage Events of 2018 in Northwestern Alaska: Fast-Forward into the Future. Cryosphere 2020, 14, 4279–4297. [Google Scholar] [CrossRef]
  19. Ward Jones, M.K.; Pollard, W.H.; Jones, B.M. Rapid Initialization of Retrogressive Thaw Slumps in the Canadian High Arctic and Their Response to Climate and Terrain Factors. Environ. Res. Lett. 2019, 14, 055006. [Google Scholar] [CrossRef]
  20. Vincent, W.F.; Lemay, M.; Allard, M. Arctic Permafrost Landscapes in Transition: Towards an Integrated Earth System Approach. Arct. Sci. 2017, 3, 39–64. [Google Scholar] [CrossRef] [Green Version]
  21. Vincent, W.F.; Callaghan, T.V.; Dahl-Jensen, D.; Johansson, M.; Kovacs, K.M.; Michel, C.; Prowse, T.; Reist, J.D.; Sharp, M. Ecological Implications of Changes in the Arctic Cryosphere. AMBIO 2011, 40, 87–99. [Google Scholar] [CrossRef] [Green Version]
  22. Vonk, J.E.; Tank, S.E.; Bowden, W.B.; Laurion, I.; Vincent, W.F.; Alekseychik, P.; Amyot, M.; Billet, M.F.; Canário, J.; Cory, R.M.; et al. Reviews and Syntheses: Effects of Permafrost Thaw on Arctic Aquatic Ecosystems. Biogeosciences 2015, 12, 7129–7167. [Google Scholar] [CrossRef] [Green Version]
  23. McGuire, A.D.; Anderson, L.G.; Christensen, T.R.; Dallimore, S.; Guo, L.; Hayes, D.J.; Heimann, M.; Lorenson, T.D.; Macdonald, R.W.; Roulet, N. Sensitivity of the Carbon Cycle in the Arctic to Climate Change. Ecol. Monogr. 2009, 79, 523–555. [Google Scholar] [CrossRef] [Green Version]
  24. Bruhwiler, L.; Parmentier, F.-J.W.; Crill, P.; Leonard, M.; Palmer, P.I. The Arctic Carbon Cycle and Its Response to Changing Climate. Curr. Clim. Chang. Rep. 2021, 7, 14–34. [Google Scholar] [CrossRef]
  25. Schuur, E.A.; McGuire, A.D.; Schädel, C.; Grosse, G.; Harden, J.W.; Hayes, D.J.; Hugelius, G.; Koven, C.D.; Kuhry, P.; Lawrence, D.M.; et al. Climate Change and the Permafrost Carbon Feedback. Nature 2015, 520, 171–179. [Google Scholar] [CrossRef] [PubMed]
  26. Hjort, J.; Karjalainen, O.; Aalto, J.; Westermann, S.; Romanovsky, V.E.; Nelson, F.E.; Etzelmüller, B.; Luoto, M. Degrading Permafrost Puts Arctic Infrastructure at Risk by Mid-Century. Nat. Commun. 2018, 9, 5147. [Google Scholar] [CrossRef]
  27. Schneider von Deimling, T.; Lee, H.; Ingeman-Nielsen, T.; Westermann, S.; Romanovsky, V.; Lamoureux, S.; Walker, D.A.; Chadburn, S.; Trochim, E.; Cai, L.; et al. Consequences of Permafrost Degradation for Arctic Infrastructure – Bridging the Model Gap between Regional and Engineering Scales. Cryosphere 2021, 15, 2451–2471. [Google Scholar] [CrossRef]
  28. O’Neill, H.B.; Burn, C.R.; Allard, M.; Arenson, L.U.; Bunn, M.I.; Connon, R.F.; Kokelj, S.A.; Kokelj, S.V.; LeBlanc, A.-M.; Morse, P.D.; et al. Permafrost Thaw and Northern Development. Nat. Clim. Chang. 2020, 10, 722–723. [Google Scholar] [CrossRef]
  29. Christie, K.S.; Hollmen, T.E.; Huntington, H.P.; Lovvorn, J.R. Structured Decision Analysis Informed by Traditional Ecological Knowledge as a Tool to Strengthen Subsistence Systems in a Changing Arctic. Ecol. Soc. 2018, 23, 42. [Google Scholar] [CrossRef] [Green Version]
  30. Herman-Mercer, N.M.; Laituri, M.; Massey, M.; Matkin, E.; Toohey, R.C.; Elder, K.; Schuster, P.F.; Mutter, E. Vulnerability of Subsistence Systems Due to Social and Environmental: A Case Study in the Yukon-Kuskokwim Delta, Alaska. Arctic 2019, 72, 258–272. [Google Scholar] [CrossRef]
  31. Huntington, H.P.; Raymond-Yakoubian, J.; Noongwook, G.; Naylor, N.; Harris, C.; Harcharek, Q.; Adams, B. “We Never Get Stuck”: A Collaborative Analysis of Change and Coastal Community Subsistence Practices in the Northern Bering and Chukchi Seas, Alaska. ARCTIC 2021, 74, 113–126. [Google Scholar] [CrossRef]
  32. Hauser, D.D.W.; Whiting, A.V.; Mahoney, A.R.; Goodwin, J.; Harris, C.; Schaeffer, R.J.; Schaeffer, R.; Laxague, N.J.M.; Subramaniam, A.; Witte, C.R.; et al. Co-Production of Knowledge Reveals Loss of Indigenous Hunting Opportunities in the Face of Accelerating Arctic Climate Change. Environ. Res. Lett. 2021, 16, 095003. [Google Scholar] [CrossRef]
  33. Wolken, G.; Anna, L.; Brubaker, M.; Coe, J.A.; Christiansen, H.; Jones, B.M.; Jacquemart, M.; Lovholt, F.; Kaab, A.; Natali, S.; et al. Glacier and Permafrost Hazards. Arct. Rep. Card 2021. [Google Scholar] [CrossRef]
  34. Brinkman, T.J.; Hansen, W.D.; Chapin, F.S.; Kofinas, G.; BurnSilver, S.; Rupp, T.S. Arctic Communities Perceive Climate Impacts on Access as a Critical Challenge to Availability of Subsistence Resources. Clim. Chang. 2016, 139, 413–427. [Google Scholar] [CrossRef]
  35. Ford, J.D.; Pearce, T. Climate Change Vulnerability and Adaptation Research Focusing on the Inuit Subsistence Sector in Canada: Directions for Future Research. Can. Geogr. Géographe Can. 2012, 56, 275–287. [Google Scholar] [CrossRef]
  36. Naylor, A.W.; Ford, J.D.; Pearce, T.; Fawcett, D.; Clark, D.; van Alstine, J. Monitoring the Dynamic Vulnerability of an Arctic Subsistence Food System to Climate Change: The Case of Ulukhaktok, NT. PLoS ONE 2021, 16, e0258048. [Google Scholar] [CrossRef]
  37. Müller-Schwarze, D. The Beaver: Natural History of a Wetlands Engineer; Cornell University Press: Ithaca, NY, USA, 2011; ISBN 978-0-8014-6086-9. [Google Scholar]
  38. Bockstoce, J.R. Furs and Frontiers in the Far North: The Contest among Native and Foreign Nations for the Bering Strait Fur Trade; Yale University Press: London, UK, 2009. [Google Scholar]
  39. Novak, M.; Ministry of Natural Resources, T.; Baker, J.A.; Obbard, M.E.; Malloch, B. Wild Furbearer Management and Conservation in North America; Ontario Trappers Association: Toronto, ON, Canada, 1987. [Google Scholar]
  40. Rozhkova-Timina, I.O.; Popkov, V.K.; Mitchell, P.J.; Kirpotin, S.N. Beavers as Ecosystem Engineers—A Review of Their Positive and Negative Effects. IOP Conf. Ser. Earth Environ. Sci. 2018, 201, 012015. [Google Scholar] [CrossRef]
  41. Wohl, E. Legacy Effects of Loss of Beavers in the Continental United States. Environ. Res. Lett. 2021, 16, 025010. [Google Scholar] [CrossRef]
  42. Stoll, N.-L.; Westbrook, C.J. Beaver Dam Capacity of Canada’s Boreal Plain in Response to Environmental Change. Sci. Rep. 2020, 10, 16800. [Google Scholar] [CrossRef]
  43. Tape, K.D.; Jones, B.M.; Arp, C.D.; Nitze, I.; Grosse, G. Tundra Be Dammed: Beaver Colonization of the Arctic. Glob. Chang. Biol. 2018, 24, 4478–4488. [Google Scholar] [CrossRef] [Green Version]
  44. Mcculloch, D.; Hopkins, D. Evidence for an Early Recent Warm Interval in Northwestern Alaska. GSA Bull. 1966, 77, 1089–1108. [Google Scholar] [CrossRef]
  45. NeotomaDB.Org|Home. Available online: https://www.neotomadb.org/ (accessed on 1 November 2021).
  46. Tape, K.D.; Clark, J.A.; Jones, B.M. Beaver Pond Locations in Arctic Alaska, 1949 to 2020. Arct. Data Cent. 2021. [Google Scholar] [CrossRef]
  47. Jones, B.M.; Tape, K.D.; Clark, J.A.; Nitze, I.; Grosse, G.; Disbrow, J. Increase in Beaver Dams Controls Surface Water and Thermokarst Dynamics in an Arctic Tundra Region, Baldwin Peninsula, Northwestern Alaska. Environ. Res. Lett. 2020, 15, 075005. [Google Scholar] [CrossRef]
  48. Grosse, G.; Jones, B. Remote Sensing Leads to Better Understanding of Polar Regions. Eos 2018, 99. [Google Scholar] [CrossRef]
  49. Nitze, I.; Grosse, G.; Jones, B.M.; Romanovsky, V.E.; Boike, J. Remote Sensing Quantifies Widespread Abundance of Permafrost Region Disturbances across the Arctic and Subarctic. Nat. Commun. 2018, 9, 5423. [Google Scholar] [CrossRef] [PubMed]
  50. Kokelj, S.V.; Jorgenson, M.T. Advances in Thermokarst Research. Permafr. Periglac. Process. 2013, 24, 108–119. [Google Scholar] [CrossRef]
  51. Rowland, J.C.; Jones, C.E.; Altmann, G.; Bryan, R.; Crosby, B.T.; Hinzman, L.D.; Kane, D.L.; Lawrence, D.M.; Mancino, A.; Marsh, P.; et al. Arctic Landscapes in Transition: Responses to Thawing Permafrost. Eos Trans. Am. Geophys. Union 2010, 91, 229–230. [Google Scholar] [CrossRef]
  52. National Research Council. Opportunities to Use Remote Sensing in Understanding Permafrost and Related Ecological Characteristics: Report of a Workshop; National Academies Press: Washington, DC, USA, 2014; ISBN 978-0-309-30124-4. [Google Scholar]
  53. Boike, J.; Nitzbon, J.; Anders, K.; Grigoriev, M.; Bolshiyanov, D.; Langer, M.; Lange, S.; Bornemann, N.; Morgenstern, A.; Schreiber, P.; et al. A 16-Year Record (2002–2017) of Permafrost, Active-Layer, and Meteorological Conditions at the Samoylov Island Arctic Permafrost Research Site, Lena River Delta, Northern Siberia: An Opportunity to Validate Remote-Sensing Data and Land Surface, Snow, and Permafrost Models. Earth Syst. Sci. Data 2019, 11, 261–299. [Google Scholar] [CrossRef] [Green Version]
  54. Trofaier, A.M.; Westermann, S.; Bartsch, A. Progress in Space-Borne Studies of Permafrost for Climate Science: Towards a Multi-ECV Approach. Remote Sens. Environ. 2017, 203, 55–70. [Google Scholar] [CrossRef]
  55. Jones, B.M.; Grosse, G.; Arp, C.D.; Miller, E.; Liu, L.; Hayes, D.J.; Larsen, C.F. Recent Arctic Tundra Fire Initiates Widespread Thermokarst Development. Sci. Rep. 2015, 5, 15865. [Google Scholar] [CrossRef] [PubMed] [Green Version]
  56. Van der Sluijs, J.; Kokelj, S.V.; Fraser, R.H.; Tunnicliffe, J.; Lacelle, D. Permafrost Terrain Dynamics and Infrastructure Impacts Revealed by UAV Photogrammetry and Thermal Imaging. Remote Sens. 2018, 10, 1734. [Google Scholar] [CrossRef] [Green Version]
  57. Daly, C.; Smith, J.; Halbleib, M. 1981–2010 High-Resolution Temperature and Precipitation Maps for Alaska Final Report. PRISM Climate Group, Oregon State University: Corvallis, OR, USA, 2018. [Google Scholar]
  58. Walker, D.A.; Raynolds, M.K.; Daniëls, F.J.A.; Einarsson, E.; Elvebakk, A.; Gould, W.A.; Katenin, A.E.; Kholod, S.S.; Markon, C.J.; Melnikov, E.S.; et al. The Circumpolar Arctic Vegetation Map. J. Veg. Sci. 2005, 16, 267–282. [Google Scholar] [CrossRef]
  59. Lloyd, A.H.; Rupp, T.S.; Fastie, C.L.; Starfield, A.M. Patterns and Dynamics of Treeline Advance on the Seward Peninsula, Alaska. J. Geophys. Res. Atmos. 2002, 107, ALT 2-1–ALT 2-15. [Google Scholar] [CrossRef] [Green Version]
  60. Jorgenson, M.; Yoshikawa, K.; Kanevskiy, M.; Shur, Y.; Romanovsky, V.; Marchenko, S.; Jones, B. Permafrost Characteristics of Alaska + Map; University of Alaska: Fairbanks, AK, USA, 2008. [Google Scholar]
  61. Olefeldt, D.; Goswami, S.; Grosse, G.; Hayes, D.; Hugelius, G.; Kuhry, P.; McGuire, A.D.; Romanovsky, V.E.; Sannel, A.B.K.; Schuur, E.A.G.; et al. Circumpolar Distribution and Carbon Storage of Thermokarst Landscapes. Nat. Commun. 2016, 7, 13043. [Google Scholar] [CrossRef] [PubMed] [Green Version]
  62. Jones, B.M.; Tape, K.D.; Clark, J.A.; Bondurant, A.C.; Ward Jones, M.K.; Gaglioti, B.V.; Elder, C.D.; Witharana, C.; Miller, C.E. Swan Lake Creek Study Reach Datasets—Beaver Dams, Flowlines, and UAS Imagery; Seward Peninsula, Alaska; 2006–2021. Arct. Data Cent. 2021. [Google Scholar] [CrossRef]
  63. Porter, C.; Morin, P.; Howat, I.; Noh, M.-J.; Bates, B.; Peterman, K.; Keesey, S.; Schlenk, M.; Gardiner, J.; Tomko, K.; et al. ArcticDEM 2018. Available online: https://www.jstor.org/stable/resrep23563.1?seq=1#metadata_info_tab_contents (accessed on 2 November 2021).
  64. Hall, D.K.; Riggs, G.A.; Salomonson, V.V. Development of Methods for Mapping Global Snow Cover Using Moderate Resolution Imaging Spectroradiometer Data. Remote Sens. Environ. 1995, 54, 127–140. [Google Scholar] [CrossRef]
  65. Pettorelli, N.; Vik, J.O.; Mysterud, A.; Gaillard, J.-M.; Tucker, C.J.; Stenseth, N.C. Using the Satellite-Derived NDVI to Assess Ecological Responses to Environmental Change. Trends Ecol. Evol. 2005, 20, 503–510. [Google Scholar] [CrossRef]
  66. Sentinel Hub. Available online: https://www.sentinel-hub.com/ (accessed on 26 October 2021).
  67. Climate Data Online (CDO). The National Climatic Data Center’s (NCDC) Climate Data Online (CDO) Provides Free Access to NCDC’s Archive of Historical Weather and Climate Data in Addition to Station History Information. | National Climatic Data Center (NCDC). Available online: https://www.ncdc.noaa.gov/cdo-web/ (accessed on 2 November 2021).
  68. Christensen, T.R.; Lund, M.; Skov, K.; Abermann, J.; López-Blanco, E.; Scheller, J.; Scheel, M.; Jackowicz-Korczynski, M.; Langley, K.; Murphy, M.J.; et al. Multiple Ecosystem Effects of Extreme Weather Events in the Arctic. Ecosystems 2021, 24, 122–136. [Google Scholar] [CrossRef]
  69. Kuhn, C.; Butman, D. Declining Greenness in Arctic-Boreal Lakes. Proc. Natl. Acad. Sci. USA 2021, 118, e2021219118. [Google Scholar] [CrossRef]
  70. Arp, C.D.; Whitman, M.S.; Kemnitz, R.; Stuefer, S.L. Evidence of Hydrological Intensification and Regime Change From Northern Alaskan Watershed Runoff. Geophys. Res. Lett. 2020, 47, e2020GL089186. [Google Scholar] [CrossRef]
  71. Demmer, R.; Beschta, R.L. Recent History (1988–2004) of Beaver Dams along Bridge Creek in Central Oregon. Northwest Sci. 2008, 82, 309–318. [Google Scholar] [CrossRef]
  72. Butler, D.R.; Malanson, G.P. The Geomorphic Influences of Beaver Dams and Failures of Beaver Dams. Geomorphology 2005, 71, 48–60. [Google Scholar] [CrossRef]
  73. Larsen, A.; Larsen, J.R.; Lane, S.N. Dam Builders and Their Works: Beaver Influences on the Structure and Function of River Corridor Hydrology, Geomorphology, Biogeochemistry and Ecosystems. Earth-Sci. Rev. 2021, 218, 103623. [Google Scholar] [CrossRef]
  74. Burchsted, D.; Daniels, M.; Thorson, R.; Vokoun, J. The River Discontinuum: Applying Beaver Modifications to Baseline Conditions for Restoration of Forested Headwaters. BioScience 2010, 60, 908–922. [Google Scholar] [CrossRef] [Green Version]
  75. Jorgenson, M.T.; Osterkamp, T.E. Response of Boreal Ecosystems to Varying Modes of Permafrost Degradation. Can. J. For. Res. 2005, 35, 2100–2111. [Google Scholar] [CrossRef]
  76. Jorgenson, M.T. 8.20 Thermokarst Terrains. 2013. Available online: https://www.academia.edu/25248005/Thermokarst_Terrains (accessed on 2 November 2021).
  77. Fuchs, M.; Nitze, I.; Strauss, J.; Günther, F.; Wetterich, S.; Kizyakov, A.; Fritz, M.; Opel, T.; Grigoriev, M.N.; Maksimov, G.T.; et al. Rapid Fluvio-Thermal Erosion of a Yedoma Permafrost Cliff in the Lena River Delta. Front. Earth Sci. 2020, 8, 336. [Google Scholar] [CrossRef]
  78. Shur, Y.; Jones, B.M.; Kanevskiy, M.; Jorgenson, T.; Jones, M.K.W.; Fortier, D.; Stephani, E.; Vasiliev, A. Fluvio-Thermal Erosion and Thermal Denudation in the Yedoma Region of Northern Alaska: Revisiting the Itkillik River Exposure. Permafr. Periglac. Process. 2021, 32, 277–298. [Google Scholar] [CrossRef]
  79. Fortier, D.; Allard, M.; Shur, Y. Observation of Rapid Drainage System Development by Thermal Erosion of Ice Wedges on Bylot Island, Canadian Arctic Archipelago. Permafr. Periglac. Process. 2007, 18, 229–243. [Google Scholar] [CrossRef]
  80. Godin, E.; Fortier, D. Geomorphology of a Thermo-Erosion Gully, Bylot Island, Nunavut, Canada1This Article Is One of a Series of Papers Published in This CJES Special Issue on the Theme of Fundamental and Applied Research on Permafrost in Canada.2Polar Continental Shelf Project Contribution 043-11. Can. J. Earth Sci. 2012, 49, 979–986. [Google Scholar] [CrossRef]
  81. Turner, K.W.; Pearce, M.D.; Hughes, D.D. Detailed Characterization and Monitoring of a Retrogressive Thaw Slump from Remotely Piloted Aircraft Systems and Identifying Associated Influence on Carbon and Nitrogen Export. Remote Sens. 2021, 13, 171. [Google Scholar] [CrossRef]
  82. Park, S.-E. Variations of Microwave Scattering Properties by Seasonal Freeze/Thaw Transition in the Permafrost Active Layer Observed by ALOS PALSAR Polarimetric Data. Remote Sens. 2015, 7, 17135–17148. [Google Scholar] [CrossRef] [Green Version]
  83. Touzi, R.; Hong, G.; Motohka, T.; Shinichi, S.; De Lisle, D. Investigation of Compact SAR L and C Band Complementarity for Permafrost Characterization In Arctic Regions. In Proceedings of the IGARSS 2019—2019 IEEE International Geoscience and Remote Sensing Symposium, Yokohama, Japan, 28 July–2 August 2019; pp. 4665–4667. [Google Scholar]
  84. Zwieback, S.; Meyer, F.J. Top-of-Permafrost Ground Ice Indicated by Remotely Sensed Late-Season Subsidence. Cryosphere 2021, 15, 2041–2055. [Google Scholar] [CrossRef]
Figure 1. The Seward Peninsula in northwestern Alaska showing (a) the location of tundra beaver ponds (red dots) that have been mapped in the region since 2010, (b) Worldview-2 satellite image (Image copyright DigitalGlobe, Inc., Longmont, CO, USA) of Swan Lake and Swan Lake Creek from 8 June 2020, showing the stream study site (yellow box) with beaver ponds (red dots), and (c) an oblique aerial photograph from an unmanned aircraft system (UAS) acquired on 6 August 2021 showing beaver-induced permafrost degradation and the focus of this study.
Remotesensing 13 04863 g001
Figure 2. Field observations of the beaver-induced permafrost degradation feature at the Swan Lake Creek site in early August 2021. Vertical aerial image in the center derived from the UAS data collected on 6 August 2021. The location and view angle of the field photos shown in (ad) are indicated with the corresponding letter and arrow. Field photos showing (a) thermokarst mounds and degraded ice wedges (photo K.D. Tape), (b) exposed ice-rich permafrost and wedge ice (photo K.D. Tape), (c) shrub vegetation in the creek valley with the beaver lodge in the middle of the image (photo A.C. Bondurant), and (d) the creek and beaver lodge looking downstream from just south of the beaver-induced permafrost degradation feature (photo K.D. Tape).
Remotesensing 13 04863 g002
Figure 3. Multi-scale remote sensing image pairs bracketing the development of the beaver-induced permafrost degradation feature in the Swan Lake Creek drainage between 2017 and 2020. (a) Landsat-8, (b) Sentinel-2, (c) PlanetLabs, Inc. CubeSat Imagery, and (d) Worldview-2 imagery (Images copyright DigitalGlobe, Inc., Oakland, CA, USA). The feature is visible in all 2020 images, but it is best resolved at spatial resolutions of 10 m and finer. The yellow pixels highlighted in the 2020 Sentinel-2 image represent the locations of the disturbed and control sites for the multi-spectral indices time series analysis.
Remotesensing 13 04863 g003
Figure 4. PlanetLabs, Inc. CubeSat false-color infrared image time series of the beaver-induced permafrost degradation feature at the Swan Lake Creek study site. The high temporal resolution offered by the PlanetLabs, Inc. constellation of CubeSats provides critical information on the timing of events associated with the beaver-induced permafrost degradation feature. An initial disturbance to the near-surface permafrost terrain is evident in the image from 4 August 2019 (yellow arrow). The image from 20 August 2019 shows that the majority of the disturbance occurred between 4 August and 20 August 2019. Images acquired later in 2019 and in early 2020 indicate that thermokarst processes are likely increasing the area of the permafrost degradation feature at a slower rate since its rapid development.
Remotesensing 13 04863 g004
Figure 5. VHRS time series of imagery from the DigitalGlobe, Inc./MAXAR constellation of satellites showing the establishment of beavers in the Swan Lake Creek drainage after 2006. Dam building activity increased through 2017 when the main stream channel was routed to the northwest towards an ice-rich permafrost hillslope. The dam system ultimately failed between 2019 and 2020 and the catastrophic flood led to the development of a permafrost degradation feature formed by processes of fluvio-thermal erosion, thermal erosion, and subsequent thermokarst. Images are from 27 August 2006 (Quickbird-2), 27 July 2011 (Worldview-1), 5 August 2014 (GeoEye-1), 23 June 2015 (Worldview-1), 14 July 2017 (Worldview-2), 8 July 2019 (Worldview-1), 8 June 2020 (Worldview-2), and 5 August 2021 (Worldview-3). The red lines indicate the location of beaver dams in each image frame. All images are copyright DigitalGlobe, Inc.
Remotesensing 13 04863 g005
Figure 6. ArcticDEM data from 2017, 2019, and 2020 showing removal of shrub vegetation, beaver-induced fluvio-thermal erosion, and thermokarst at the Swan Lake Creek study site. Analysis of repeat observations in ArcticDEM data show that the Swan Lake Creek valley widened from 33 m in 2017, to 110 m in 2019, to 180 m wide in 2020 primarily as a result of thaw subsidence and lateral erosion into ice-rich permafrost terrain caused by beaver engineering activity. The yellow polygon in 2020 depicts the 35,000 m2 disturbed area. There was 59,000 m3 of material lost between 2017 and 2020 due to beaver engineering and permafrost degradation.
Remotesensing 13 04863 g006
Figure 7. Delineation of beaver dams and stream channels along the study section of Swan Lake Creek between 2006 and 2021 that were digitized in VHRS imagery. Beavers began establishing dams in the study area between 2006 and 2011. Between the decade from 2011 to 2021, dam numbers fluctuated with the peak occurring in 2017 (n = 9), prior to the failure of the dam system and development of the beaver-induced permafrost degradation between 2019 and 2020. Between 2006 and 2021, the length of the stream channel network increased from ~0.6 km to more than 1.9 km, or a 220% increase as a result of the combined effects of beaver engineering and permafrost degradation.
Remotesensing 13 04863 g007
Figure 8. NDVI data derived from a time series of Sentinel-2 satellite imagery acquired between 2017 and 2020 for a control site and a site within the beaver-induced permafrost degradation feature area. The black dots indicate single-pixel, individual NDVI values from a particular Sentinel-2 image, while the black curves represent the time integrated NDVI value for each site for each year based on LOESS smoothing using a 3rd order polynomial. The beaver induced permafrost degradation feature is evident in the rapid decline in NDVI that started in August 2019 and also reflected in the reduction in NDVI values during the entire 2020 growing season.
Remotesensing 13 04863 g008
Figure 9. NDSI data derived from a time series of Sentinel-2 satellite imagery acquired between 2018 and 2021 for a control site (blue dots and lines) and a site within the beaver-induced permafrost degradation feature area (red dots and lines). The color-coded dots indicate single-pixel, individual NDSI values from a particular Sentinel-2 image (location shown in Figure 3), while the color-coded lines represent the time integrated NDSI value for each site for each year based on LOESS smoothing using a 1st order polynomial. Blowing and drifting snow now accumulates in a thaw-affected depression during the winter, increasing the snow depth relative to the control site, and resulting in a longer snow-melt period for areas affected by permafrost degradation. The difference in snow-melt date between the control and disturbed site was 19 days in 2021, compared to 0 in 2018, prior to the beaver-induced fluvio-thermal erosion and thermokarst feature development.
Remotesensing 13 04863 g009
Figure 10. Precipitation data plots based on the US National Weather Service station located in Nome, Alaska. (a) Plot of daily rainfall (mm/day) from July and August 2019 showing the extreme precipitation event on 2 August 2019, two days before initial failure of the beaver dam complex was noticed in the PlantLabs, Inc. (Pleasant Grove, CA, USA) satellite imagery (Figure 4). (b) Daily precipitation data aggregated into weekly bins showing the weekly summer rainfall during 2019 (dark grey bars), the mean weekly rainfall (black line) and the standard deviation (light grey shaded area) in weekly rainfall for the 15-year period from 2006 to 2020. The nine days prior to the failure of the beaver dam complex and initiation of the permafrost degradation feature were the highest on record during the period of beaver occurrence in the Swan Lake Creek study area.
Remotesensing 13 04863 g010
Figure 11. A 15 cm resolution, colorized digital surface model derived from the UAS survey data (top) and extracted elevation profile (bottom) for the portion of Swan Lake Creek most heavily disturbed by the beaver-induced permafrost degradation. Numerous features are evident in the elevation profile data, from left to right—gently sloping tussock tundra that is underlain by ice rich permafrost; the area of beaver-induced permafrost degradation showing melted ice wedges, intervening thermokarst mounds, and the now diffuse creek channel; tall shrubs; low shrubs; and gently sloping tussock tundra.
Remotesensing 13 04863 g011
Figure 12. VHRS imagery showing examples of similar landscape settings where the combined actions of beaver-induced permafrost degradation processes (fluvio-thermal erosion, thermal erosion, and subsequent thermokarst processes) are likely responsible for the development of the landform. Beaver-induced permafrost degradation features at (a) the Swan Lake Creek site, Seward Peninsula, Alaska (6 June 2020), (b) Ptarmigan Creek, Seward Peninsula, Alaska (6 July 2019), and (c) an unnamed creek near Noatak, Alaska (6 September 2018). Recognition of the potential role of beaver engineering on permafrost degradation may help to characterize similar features across low Arctic and Boreal landscapes. All images are copyright DigitalGlobe, Inc.
Remotesensing 13 04863 g012
Table 1. Multi-dimensional remote sensing image platforms, spatial resolution, temporal resolution, spectral resolution, radiometric resolution, temporal range of images used, number of images in the time series analysis, and the application for detecting and quantifying beaver-induced permafrost degradation at the Swan Lake Creek study site, Seward Peninsula, Alaska.
Image PlatformSpatial Resolution (m) Temporal ResolutionSpectral Resolution (Bands)Radiometric Resolution (Bit Depth)Temporal Range of Images UsedImages in Time Series Analysis (n)Remote Sensing Application
Landsat OLI308–16 days 8162017–202117General Observations of Landcover Change
Sentinel-2101–5 days4122017–2021152Multi-Spectral Index Trend Analysis
PlanetLabs, Inc Cubesats3–5Daily4122019 (July/August)15Object Feature Detection Timing
Arctic DEM2InfrequentN/AN/A2017–20203DSM/dDSM Generation
DigitalGlobe, Inc./MAXAR VHRS0.5Infrequent1112006–20218Object Feature Detection Impacts
UAS0.15Infrequent31620211DSM Generation
Publisher’s Note: MDPI stays neutral with regard to jurisdictional claims in published maps and institutional affiliations.

