
Remote Sensing of Landslide-Generated Sediment Plumes, Peace River, British Columbia

 ,
, 
Abstract
:1. Introduction
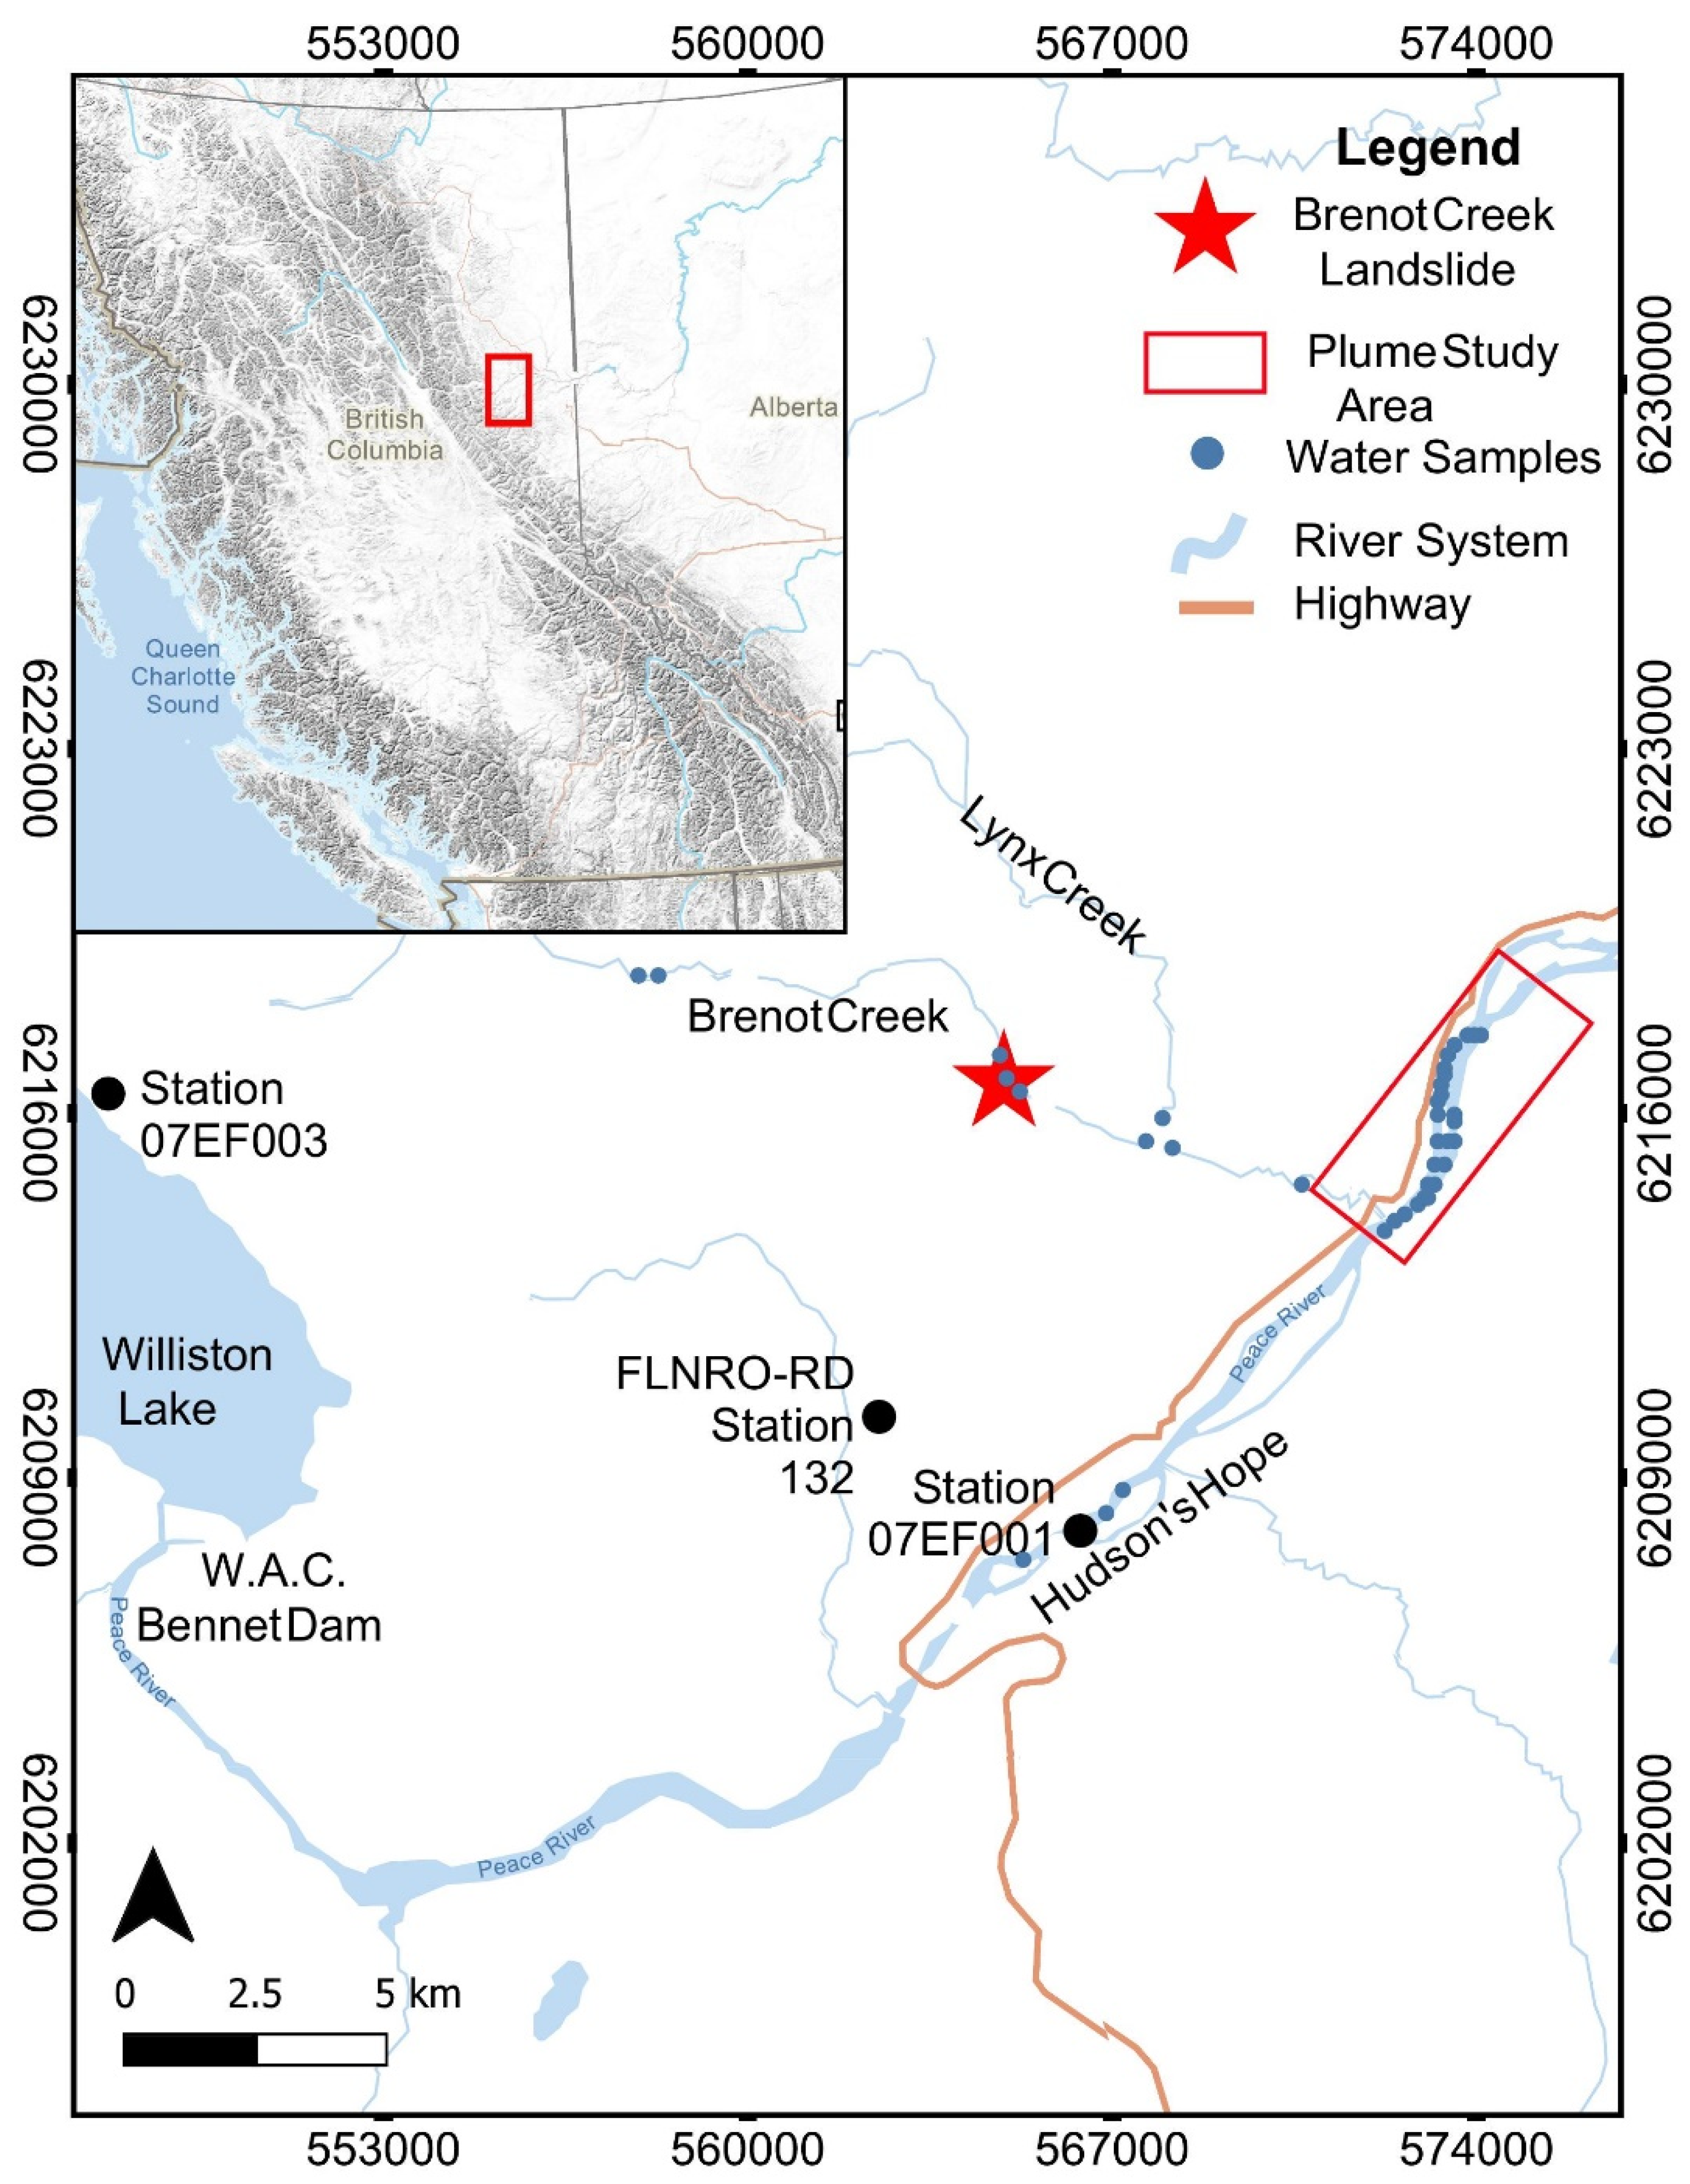
2. Setting
3. Methods
3.1. Remote Sensing Analysis of Sediment Plume
3.1.1. Calibration Data
3.1.2. Optical Imagery Processing
3.1.3. Quantification of Suspended Sediment Concentration
3.2. Field Observation of Slide Activity and Sediment Transport in Brenot Creek and Lynx Creek
3.2.1. Slide Mechanisms and Failure Activity
3.2.2. Sediment Transport in Brenot Creek and Lynx Creek
3.3. Analysis of Plume Activity in Hydro-Climatic Context
3.3.1. Hydro-Climatic Data
3.3.2. Spearman’s and Kendall Correlation
4. Results
4.1. The Brenot Creek Landslide
4.2. Temporal and Spatial Plume Dynamics
4.3. Brenot Creek and Lynx Creek Sediment
4.4. Hydrological and Meteorological Control on Plume Variability
5. Linking Remotely Sensed Plume Concentrations to Landslide Activity
6. Impact of the Recurrent Landslide on the Fluvial System
7. Future of the Landslide and Plume
8. Conclusions
- The sediment plume is persistent, fluctuates in concentration throughout the year, and shows no evidence of ceasing. At the same time, headwall retreat and the removal of mass at the groundwater-controlled slide are ongoing.
- Surface differencing of DEMs yielded an upper estimate of sediment delivery to the Peace River of 165,000 tonnes/year, significantly higher than the pure riverine load of 23,400 tonnes/year [60]. Topographic evidence of similar geomorphic features in the nearby area suggests that low-magnitude, recurrent landslides play a significant role in the sediment delivery of the Peace River catchment.
- The link between plume concentration and landslide activity is complex. The continuous erosion of landslide deposits by the ever-flowing tributaries results in steady delivery to the Peace River, resulting in plume sediment concentrations with temporal variability throughout the year.
- Low plume concentrations occur in either the winter months, when the creeks are partially frozen or in the summer months, possibly linked to a decrease in the groundwater-sourced discharge.
- Moderate plume concentrations occur during all months of the year, though concentrations tend to be lower among the moderately ranging events in the summer.
- High plume concentration does not occur during the summer months and is positively correlated to water level at a nearby reservoir—a proxy for overall groundwater conditions at the site. We interpret this as evidence that high plume concentrations may be linked to the failure of the groundwater-controlled landslide or the removal of a large amount of material from the landslide site.
- Only high plume concentrations are therefore immediately linked to failure. Further validation is required to determine whether our plume activity threshold (<120 mg/L) is suitable. Using said threshold, monitoring of landslide activity in the coming years via remote sensing is possible.
- Application of this concept to other recurrent landslides that are immediately linked to a river network is possible when the hydro-climatic context is sufficiently known.
Author Contributions
Funding
Institutional Review Board Statement
Informed Consent Statement
Data Availability Statement
Acknowledgments
Conflicts of Interest
References
- Clapuyt, F.; Vanacker, V.; Christl, M.; Van Oost, K.; Schlunegger, F. Spatio-temporal dynamics of sediment transfer systems in landslide-prone Alpine catchments. Solid Earth 2019, 10, 1489–1503. [Google Scholar] [CrossRef] [Green Version]
- Dethier, E.; Magilligan, F.J.; Renshaw, C.E.; Nislow, K.H. The role of chronic and episodic disturbances on channel–hillslope coupling: The persistence and legacy of extreme floods. Earth Surf. Process. Landf. 2016, 41, 1437–1447. [Google Scholar] [CrossRef]
- Li, G.; West, A.J.; Densmore, A.L.; Hammond, D.E.; Jin, Z.; Zhang, F.; Wang, J.; Hilton, R.G. Connectivity of earthquake-triggered landslides with the fluvial network: Implications for landslide sediment transport after the 2008 Wenchuan earthquake. J. Geophys. Res. Earth Surf. 2016, 121, 703–724. [Google Scholar] [CrossRef] [Green Version]
- Swanson, F.J.; Fredriksen, R.L. Sediment routing and budgets: Implications for judging impacts of forestry practices. In Sediment Budgets and Routing in Forested Drainage Basins; Swanson, F.J., Janda, R.J., Dunne, T., Swanston, D.N., Eds.; U.S. Department of Agriculture, Forest Service, Pacific Northwest Forest and Range Experiment Station: Portland, OR, USA, 1982; pp. 129–137. [Google Scholar]
- Campforts, B.; Shobe, C.M.; Steer, P.; Vanmaercke, M.; Lague, D.; Braun, J. HyLands 1.0: A hybrid landscape evolution model to simulate the impact of landslides and landslide-derived sediment on landscape evolution. Geosci. Model Dev. 2020, 13, 3863–3886. [Google Scholar] [CrossRef]
- Broeckx, J.; Rossi, M.; Lijnen, K.; Campforts, B.; Poesen, J.; Vanmaercke, M. Landslide mobilization rates: A global analysis and model. Earth Sci. Rev. 2020, 201, 102972. [Google Scholar] [CrossRef]
- Reid, L.M.; Dunne, T. Sediment budgets as an organizing framework in fluvial geomorphology. In Tools in Fluvial Geomorphology; Wiley: Hoboken, NJ, USA, 2016; pp. 357–380. [Google Scholar]
- Ibsen, M.-L.; Brunsden, D. The nature, use and problems of historical archives for the temporal occurrence of landslides, with specific reference to the south coast of Britain, Ventnor, Isle of Wight. Geomorphology 1996, 15, 241–258. [Google Scholar] [CrossRef]
- Korup, O. Large landslides and their effect on sediment flux in South Westland, New Zealand. Earth Surf. Process. Landf. 2005, 30, 305–323. [Google Scholar] [CrossRef]
- Lin, G.-W.; Chen, H.; Hovius, N.; Horng, M.-J.; Dadson, S.; Meunier, P.; Lines, M. Effects of earthquake and cyclone sequencing on landsliding and fluvial sediment transfer in a mountain catchment. Earth Surf. Process. Landf. 2008, 33, 1354–1373. [Google Scholar] [CrossRef]
- Hovius, N.; Stark, C.P.; Hao-Tsu, C.; Jiun-Chuan, L. Supply and Removal of Sediment in a Landslide-Dominated Mountain Belt: Central Range, Taiwan. J. Geol. 2000, 108, 73–89. [Google Scholar] [CrossRef]
- Geertsema, M.; Clague, J.J.; Schwab, J.W.; Evans, S.G. An overview of recent large catastrophic landslides in northern British Columbia, Canada. Eng. Geol. 2006, 83, 120–143. [Google Scholar] [CrossRef]
- Fuller, I.C.; Riedler, R.A.; Bell, R.; Marden, M.; Glade, T. Landslide-driven erosion and slope-channel coupling in steep, forested terrain, Ruahine Ranges, New Zealand, 1946–2011. Catena 2016, 142, 252–268. [Google Scholar] [CrossRef]
- Kasai, M.; Brierley, G.; Page, M.; Marutani, T.; Trustrum, N. Impacts of land use change on patterns of sediment flux in Weraamaia catchment, New Zealand. Catena 2005, 64, 27–60. [Google Scholar] [CrossRef]
- Metternicht, G.; Hurni, L.; Gogu, R. Remote sensing of landslides: An analysis of the potential contribution to geo-spatial systems for hazard assessment in mountainous environments. Remote Sens. Environ. 2005, 98, 284–303. [Google Scholar] [CrossRef]
- Mertes, L.A.K.; Smith, M.O.; Adams, J.B. Estimating suspended sediment concentrations in surface waters of the Amazon River wetlands from Landsat images. Remote Sens. Environ. 1993, 43, 281–301. [Google Scholar] [CrossRef]
- Wang, J.J.; Lu, X.X. Estimation of suspended sediment concentrations using Terra MODIS: An example from the Lower Yangtze River, China. Sci. Total Environ. 2010, 408, 1131–1138. [Google Scholar] [CrossRef]
- Pavelsky, T.M.; Smith, L.C. Remote sensing of suspended sediment concentration, flow velocity, and lake recharge in the Peace-Athabasca Delta, Canada. Water Resour. Res. 2009, 45, 11. [Google Scholar] [CrossRef]
- Bonansea, M.; Fernandez, R.L. Remote sensing of suspended solids concentration in a reservoir with frequent wildland fires on its watershed. Water Sci. Technol. 2013, 67, 217–223. [Google Scholar] [CrossRef] [PubMed]
- Davies, M.; Paulen, R.; Hickin, A. Inventory of Holocene Landslides, Peace River Area, Alberta (NTS 84C); Alberta Energy and Utilities Board: Edmonton, AB, Canada, 2005. [Google Scholar]
- Miller, B.G.N. Two Landslides and Their Dams, Peace River Lowlands. Master’s Thesis, University of Alberta, Edmonton, AB, Canada, 2000. [Google Scholar]
- Miller, B.; Dufresne, A.; Geertsema, M.; Atkinson, N.; Evensen, H.; Cruden, D. Longevity of dams from landslides with sub-channel rupture surfaces, Peace River region, Canada. Geoenviron. Disasters 2018, 5, 1. [Google Scholar] [CrossRef] [Green Version]
- Kim, T.H.; Cruden, D.M.; Martin, C.D.; Froese, C.R. The 2007 Fox Creek landslide, Peace River Lowland, Alberta, Canada. Landslides 2010, 7, 89–98. [Google Scholar] [CrossRef]
- Severin, J.M. Landslides in the Charlie Lake Map Sheet, Fort St. John. Ph.D. Thesis, University of British Columbia, Vancouver, BC, Canada, 2004. [Google Scholar]
- Loo, T. Disturbing the Peace: Environmental Change and the Scales of Justice on a Northern River. Environ. Hist. 2007, 12, 895–919. [Google Scholar] [CrossRef] [Green Version]
- Waite, J.; Gruber, H. Peace River Site C Project: Environmental Studies; Development of a Mitigation AND Compensation Program; and Project Licencing. Can. Water Resour. J. 1981, 6, 20–37. [Google Scholar] [CrossRef] [Green Version]
- Canadian Environmental Assessment Agency; BC Hydro. Report of the Joint Review Panel: Site C Clean Energy Project; B.C. Hydro and Power Authority, British Columbia, under the Authority of the Federal Minister of the Environment, Gov-ernment of Canada: Ottawa, ON, Canada; B.C. Minister of Environment, Government of British Columbia: Victoria, BC, Canada, 2014; ISBN 978-1-100-23631-5.
- Peraza-Castro, M.; Sauvage, S.; Sánchez-Pérez, J.M.; Ruiz-Romera, E. Effect of flood events on transport of suspended sediments, organic matter and particulate metals in a forest watershed in the Basque Country (Northern Spain). Sci. Total Environ. 2016, 569, 784–797. [Google Scholar] [CrossRef]
- Quinton, J.N.; Catt, J.A. Enrichment of Heavy Metals in Sediment Resulting from Soil Erosion on Agricultural Fields. Environ. Sci. Technol. 2007, 41, 3495–3500. [Google Scholar] [CrossRef] [PubMed]
- District of Hudson’s Hope; Ministry of Forests, Lands, Natural Resource Operations; Rural Development, BC; Northern Health, BC; Ministry of Health, BC. Lynx Creek/Brenot Creek Water Quality Testing [Digital Data]; District of Hudson’s Hope: Prince George, BC, Canada, November 2014.
- Butcher, G.A. Peace River Area: Peace River Mainstem Water Quality Assessment and Objectives; Water Quality Unit, Resource Quality Section, Water Management Branch: Victoria, BC, Canada, 1987. [Google Scholar]
- Ortman, B.; Diversified Technical Services; BC OGRIS. Groundwater Monitoring in the Greater Hudson Hope Area (Final Report). 2005. Available online: http://www.bcogris.ca/documents/scek/Final_Reports/d-ECIM-Com-DTS-2004-21-Rep.pdf (accessed on 21 March 2021).
- Church, M. The Regulation of Peace River: A Case Study for River Management; Wiley: Hoboken, NJ, USA, 2014. [Google Scholar]
- Church, M. Geomorphic response to river flow regulation: Case studies and time-scales. Regul. Rivers Res. Manag. 1995, 11, 3–22. [Google Scholar] [CrossRef]
- Mathews, W.H. Quaternary Stratigraphy and Geomorphology of Charlie Lake (94A) Map-Area, British Columbia; Canadian Geological Survey: Ottawa, ON, Canada, 1978. [CrossRef]
- Hartman, G.; Clague, J. Quaternary stratigraphy and glacial history of the Peace River valley, northeast British Columbia. Can. J. Earth Sci. 2008, 45, 549–564. [Google Scholar] [CrossRef]
- Van Esch, K.J.B. Failure Behaviour of Bedrock and Overburden Landslides of the Peace River Valley near Fort St. John, British Columbia. Ph.D. Thesis, University of British Columbia, Vancouver, BC, Canada, 2012. [Google Scholar]
- Hickin, A.S.; Lian, O.B.; Levson, V.M.; Cui, Y. Pattern and chronology of glacial Lake Peace shorelines and implications for isostacy and ice-sheet configuration in northeastern British Columbia, Canada. Boreas 2015, 44, 288–304. [Google Scholar] [CrossRef]
- Evans, S.G.; Hu, X.Q.; Enegren, E.G. The 1973 Attachie slide, Peace River valley, near Fort St. John, B.C., Canada: A landslide with a high-velocity flow slide component in Pleistocene sediment. In Proceedings of the 7th International Symposium on Landslides, Balkema, Trondheim, Norway, 17–21 June 1996; pp. 715–720. [Google Scholar]
- Fletcher, L.A. Failure Behaviour of two Landslides in Silt and Clay. Ph.D. Thesis, University of British Columbia, Vancouver, BC, Canada, 2000. [Google Scholar]
- Multi Agency Laboratory Analytical Protocols (EPA). Chapter 12: Laboratory Sample Preparation, EPA 402-B-04-001B. 2004. Available online: https://www.epa.gov/sites/production/files/2015-05/documents/402-b-04-001b-12-final.pdf (accessed on 21 May 2018).
- Olthof, I.; Pouliot, D.; Fernandes, R.; Latifovic, R. Landsat-7 ETM+ radiometric normalization comparison for northern mapping applications. Remote Sens. Environ. 2005, 95, 388–398. [Google Scholar] [CrossRef]
- Rowlands, G.P.; Purkis, S.J.; Riegl, B.M. The 2005 coral-bleaching event Roatan (Honduras): Use of pseudo invariant features (PIFs) in satellite assessments. J. Spat. Sci. 2008, 53, 99–112. [Google Scholar] [CrossRef]
- Wang, C.; Chen, S.; Li, D.; Wang, D.; Liu, W.; Yang, J. A Landsat-based model for retrieving total suspended solids concentration of estuaries and coasts in China. Geosci. Model Dev. 2017, 10, 4347–4365. [Google Scholar] [CrossRef] [Green Version]
- Ruddick, K.G.; De Cauwer, V.; Park, Y.-J.; Moore, G. Seaborne measurements of near infrared water-leaving reflectance: The similarity spectrum for turbid waters. Limnol. Oceanogr. 2006, 51, 1167–1179. [Google Scholar] [CrossRef] [Green Version]
- Zhan, C.; Yu, J.; Wang, Q.; Li, Y.; Zhou, D.; Xing, Q.; Chu, X. Remote sensing retrieval of surface suspended sediment concentration in the Yellow River Estuary. Chin. Geogr. Sci. 2017, 27, 934–947. [Google Scholar] [CrossRef] [Green Version]
- Pereira, F.J.S.; Costa, C.A.G.; Foerster, S.; Brosinsky, A.; de Araújo, J.C. Estimation of suspended sediment concentration in an intermittent river using multi-temporal high-resolution satellite imagery. Int. J. Appl. Earth Obs. Geoinf. 2019, 79, 153–161. [Google Scholar] [CrossRef]
- Michaud, J.P.; Wierenga, M. Estimating Discharge and StreamFlows: A Guide for Sand and Gravel Operators. Ecol. Publ. 2005, 70, 37. [Google Scholar]
- Hamed, K.H. Trend detection in hydrologic data: The Mann–Kendall trend test under the scaling hypothesis. J. Hydrol. 2008, 349, 350–363. [Google Scholar] [CrossRef]
- Hamed, K.H. The distribution of Spearman’s rho trend statistic for persistent hydrologic data. Hydrol. Sci. J. 2016, 61, 214–223. [Google Scholar] [CrossRef]
- Liang, L.; Li, L.; Liu, Q. Precipitation variability in Northeast China from 1961 to 2008. J. Hydrol. 2011, 404, 67–76. [Google Scholar] [CrossRef]
- Hutchinson, J.N.; Bhandari, R.K. Undrained loading, a fundamental mechanism of mudflows and other mass movements. Geotechnique 1971, 21, 353–358. [Google Scholar] [CrossRef]
- Canadian Environmental Assessment Agency; BC Hydro; Golder Associates. Site C Clean Energy Project: Baseline Aquatic Productivity in the Upper Peace River; 2012; Volume 2, Appendix P. Available online: https://iaac-aeic.gc.ca/050/documents_staticpost/63919/85328/Vol2_Appendix_P.pdf (accessed on 12 September 2020).
- Imaizumi, F.; Sidle, R.C. Linkage of sediment supply and transport processes in Miyagawa Dam catchment, Japan. J. Geophys. Res. Earth Surf. 2007, 112, F3. [Google Scholar] [CrossRef] [Green Version]
- Cavalli, M.; Trevisani, S.; Comiti, F.; Marchi, L. Geomorphometric assessment of spatial sediment connectivity in small Alpine catchments. Geomorphology 2013, 188, 31–41. [Google Scholar] [CrossRef]
- Abramson, L.W. Slope Stability and Stabilization Methods; Wiley: New York, NY, USA, 1996. [Google Scholar]
- Ritchie, J.; Zimba, P.; Everitt, J. Remote Sensing Techniques to Assess Water Quality. Photogramm. Eng. Remote Sens. 2003, 69, 695–704. [Google Scholar] [CrossRef] [Green Version]
- Brando, V.E.; Dekker, A.G. Satellite hyperspectral remote sensing for estimating estuarine and coastal water quality. IEEE Trans. Geosci. Remote Sens. 2003, 41, 1378–1387. [Google Scholar] [CrossRef]
- Morgan, A.J.; Paulen, R.C.; Slattery, S.R.; Froese, C.R.; Energy Resources Conservation Board. Geological Setting for Large Landslides at the Town of Peace River, Alberta (NTS 84C); Alberta Geological Survey: Edmonton, AB, Canada, 2012.
- Thompson, J.N. The Deforest Creek Landslide and Sediment Transport in Deer Creek, Skagit County, Washington. Master’s Thesis, Western Washington University, Bellingham, WA, USA, 1988. [Google Scholar] [CrossRef]
- Kemp, P.; Sear, D.; Collins, A.; Naden, P.; Jones, I. The impacts of fine sediment on riverine fish. Hydrol. Process. 2011, 25, 1800–1821. [Google Scholar] [CrossRef]
- Göransson, G.; Norrman, J.; Larson, M. Contaminated landslide runout deposits in rivers—Method for estimating long-term ecological risks. Sci. Total Environ. 2018, 642, 553–566. [Google Scholar] [CrossRef] [PubMed]
- Cavers, D.S. Groundwater blow off & piping debris-flow failures. In Proceedings of the 3rd Canadian Conference on Geotechnique & Natural Hazards, Edmonton, AB, Canada, 9–10 June 2003; pp. 151–158. [Google Scholar]
- Geertsema, M.; Schwab, J.W.; Jordan, P.; Millard, T.H.; Rollerson, T.P. Hillslope processes. In Compendium of Forest Hydrology and Geomorphology in British Columbia, BC Ministry of Forest and Range; Pike, R.G., Redding, T.E., Moore, R.D., Winker, R.D., Bladon, K.D., Eds.; Province of British Columbia: Victoria, BC, Canada, 2010; Volume 66, pp. 213–273. [Google Scholar]


| Survey Dates Compared | Change in Width (m) | Headwall Retreat (m) | Sediment Lost from Landslide (m3) |
|---|---|---|---|
| 2016 vs. 2014 (Initial Failure) | 28 | 4 | 99,000 |
| 2014 vs. 2015 | 2 | 22 | 75,000 |
| 2015 vs. 2017 | 33 | 63 | 265,000 |
| 2017 to 2020 | 8 | 31 | 102,000 1 |
| Net Change | 71 | 120 | 541,000 |
Publisher’s Note: MDPI stays neutral with regard to jurisdictional claims in published maps and institutional affiliations. |
© 2021 by the authors. Licensee MDPI, Basel, Switzerland. This article is an open access article distributed under the terms and conditions of the Creative Commons Attribution (CC BY) license (https://creativecommons.org/licenses/by/4.0/).
Share and Cite
Hughes, K.E.; Wild, A.; Kwoll, E.; Geertsema, M.; Perry, A.; Harrison, K.D. Remote Sensing of Landslide-Generated Sediment Plumes, Peace River, British Columbia. Remote Sens. 2021, 13, 4901. https://doi.org/10.3390/rs13234901
Hughes KE, Wild A, Kwoll E, Geertsema M, Perry A, Harrison KD. Remote Sensing of Landslide-Generated Sediment Plumes, Peace River, British Columbia. Remote Sensing. 2021; 13(23):4901. https://doi.org/10.3390/rs13234901
Chicago/Turabian StyleHughes, Katie E., Amanda Wild, Eva Kwoll, Marten Geertsema, Alexandra Perry, and K. Darcy Harrison. 2021. "Remote Sensing of Landslide-Generated Sediment Plumes, Peace River, British Columbia" Remote Sensing 13, no. 23: 4901. https://doi.org/10.3390/rs13234901
APA StyleHughes, K. E., Wild, A., Kwoll, E., Geertsema, M., Perry, A., & Harrison, K. D. (2021). Remote Sensing of Landslide-Generated Sediment Plumes, Peace River, British Columbia. Remote Sensing, 13(23), 4901. https://doi.org/10.3390/rs13234901