Article

Measurements and Modeling of Optical-Equivalent Snow Grain Sizes under Arctic Low-Sun Conditions

1
Leipzig Institute for Meteorology (LIM), University of Leipzig, Stephanstr. 3, 04103 Leipzig, Germany
2
Department of Geosciences, University of Oslo, 0371 Oslo, Norway
3
Alfred Wegener Institute Helmholtz Centre for Polar and Marine Research (AWI), 14476 Potsdam, Germany
4
Institute of Meteorology and Climate Research, Karlsruhe Institute of Technology (KIT), 76344 Karlsruhe, Germany
5
Alfred Wegener Institute Helmholtz Centre for Polar and Marine Research (AWI), 27570 Bremerhaven, Germany
6
Institute of Environmental Physics, University of Bremen, 28359 Bremen, Germany
*
Author to whom correspondence should be addressed.
Remote Sens. 2021, 13(23), 4904; https://doi.org/10.3390/rs13234904
Submission received: 22 September 2021 / Revised: 26 November 2021 / Accepted: 30 November 2021 / Published: 3 December 2021

Abstract

:
The size and shape of snow grains directly impacts the reflection by a snowpack. In this article, different approaches to retrieve the optical-equivalent snow grain size ( r opt ) or, alternatively, the specific surface area (SSA) using satellite, airborne, and ground-based observations are compared and used to evaluate ICON-ART (ICOsahedral Nonhydrostatic—Aerosols and Reactive Trace gases) simulations. The retrieval methods are based on optical measurements and rely on the r opt -dependent absorption of solar radiation in snow. The measurement data were taken during a three-week campaign that was conducted in the North of Greenland in March/April 2018, such that the retrieval methods and radiation measurements are affected by enhanced uncertainties under these low-Sun conditions. An adjusted airborne retrieval method is applied which uses the albedo at 1700 nm wavelength and combines an atmospheric and snow radiative transfer model to account for the direct-to-global fraction of the solar radiation incident on the snow. From this approach, we achieved a significantly improved uncertainty (<25%) and a reduced effect of atmospheric masking compared to the previous method. Ground-based in situ measurements indicated an increase of r opt of 15 µm within a five-day period after a snowfall event which is small compared to previous observations under similar temperature regimes. ICON-ART captured the observed change of r opt during snowfall events, but systematically overestimated the subsequent snow grain growth by about 100%. Adjusting the growth rate factor to 0.012 µm 2 s 1 minimized the difference between model and observations. Satellite-based and airborne retrieval methods showed higher r opt over sea ice (<300 µm) than over land surfaces (<100 µm) which was reduced by data filtering of surface roughness features. Moderate-Resolution Imaging Spectroradiometer (MODIS) retrievals revealed a large spread within a series of subsequent individual overpasses, indicating their limitations in observing the snow grain size evolution in early spring conditions with low Sun.

Graphical Abstract

1. Introduction

The enhanced sensitivity of the Arctic climate system regarding global warming, referred to as Arctic Amplification, is associated with several feedback mechanisms [1,2,3]. Numerous scientific efforts are targeted on the quantification of individual contributions of these feedback mechanisms to Arctic Amplification [4,5,6,7,8]. Simulations of various climate models from the Coupled Model Intercomparison Project Phase 5 (CMIP5) [9] identified the snow–ice surface albedo feedback, driven by the positive coupling between increasing near-surface temperature and the melting of snow and sea ice, as the second largest contributor after the lapse rate feedback [4,8]. Qu et al. [5] noted a bias in the magnitude of the snow–ice albedo feedback, which was attributed to the inadequate parametrization of the snow and ice surface albedo in several models.
Most climate models assume a constant surface albedo for fresh and old snow with simplistic assumptions for the transition between both extremes. In reality, the parameters determining the albedo of snow-covered surfaces are manifold, such as the solar zenith angle (SZA), cloudiness, snow impurities, surface roughness, snow grain size and shape [10,11,12,13,14,15,16,17,18]. E.g., Donth et al. [19] quantified the effect of black carbon (BC) impurities, cloudiness, and snow grain size on the broadband snow surface albedo ( α bb ). They identified a minor BC effect ( Δ α bb = 0.01 for a reasonable range of BC mass concentration in snow), but major effects due to cloudiness ( Δ α bb up to 0.12 for aged snow) and snow grain size ( Δ α bb = 0.07 for particles of fresh and aged snow).
Driven by thermodynamics, snow grains constantly transform (snow metamorphism). The rate of these transformations depends on the ambient conditions, such as temperature and humidity. The snow structure changes more rapidly for higher temperatures and for greater temperature differences within the snowpack. For winter and early spring in Polar areas, the snow metamorphism runs mostly under dry conditions. Local temperature gradients in a snowpack lead to diffusion of water vapour from higher to lower temperature areas. This diffusion is linked to sublimation of warmer grains and vapour depositional growth of colder ones, typically resulting in faceted and depth hoar grains [20,21]. The so-called equilibrium metamorphism for snowpacks with a low vertical temperature gradient (below 0.1 K cm 1 ) [22], is dominated by the grain-boundary diffusion [23]. As a consequence, the snow grains become larger and more spherical.
Due to the complex and versatile shapes of snow grains [24], the snow particle size refers to an optical-equivalent grain size, rather than a geometrical measure. The optical-equivalent grain size represents a collection of spheres with the same volume-to-surface ratio compared to non-spherical snow particles [25,26]. As an alternative measure, the specific surface area (SSA, in units of m 2 kg 1 ) is used, which can be related to the optical-equivalent snow grain size radius ( r opt ):
SSA = 3 ρ ice · r opt ,
with ρ ice representing the density of ice (917 kg m 3 ). For simplification, in the following we use the term snow grain size, which refers to the more accurate term optical-equivalent snow grain size.
The snow metamorphism also affects the surface radiative energy budget. More spherical and larger snow grains amplify the absorption of solar radiation and lead to an increase of the surface temperature that in turn accelerates the snow metamorphism. Larger grains allow for a deeper penetration of the incident radiation into the snowpack linked to a higher probability of absorption in the shortwave-infrared (SWIR) spectral range and a decrease of the snow surface albedo, e.g., [11,27].
Several studies followed the evolution of the SSA by ground-based [28,29,30,31], airborne [30], and satellite-based [32,33] observations. Satellite-based retrievals of the snow grain size or SSA are applied using various optical sensors such as MODerate-resolution Imaging Spectroradiometer (MODIS) [33,34,35], Ocean and Land Colour Instrument (OLCI) [36], or Sea and Land Surface Temperature Radiometer (SLSTR) [37]. Satellite-based retrieval results are mainly validated against ground-based observations. For example, the OLCI-based SSA product was compared to ground measurements in Greenland using the IceCube instrument [38]. An underestimation with differences below 35 m 2 kg 1 was found [36]. The SLTSR-based retrieval results were validated against data from seven field-based measurements showing correlation coefficients higher than 0.85 with root mean square errors for r opt and SSA of less than 15 µm and 10 m 2 kg 1 , respectively [39]. A similar correlation coefficient (0.86) was derived from the comparison of the MODIS-based product with ground measurements from six field experiments [40]. Wiebe et al. [40] found maximum differences of 20 µm for undisturbed cases. However, in the presence of cirrus clouds, the retrieved snow grain size tended to be underestimated, while in the case of surface hoar and wind crust an overestimation a maximum difference of 63 µm was observed.
The common basis of many studies is the retrieval of the snow grain size, which is obtained by applying the analytical SSA–snow reflection relationship. This relationship is derived from the asymptotic radiative transfer (ART) approach by Kokhanovsky and Zege [41] assuming a plane surface. The ground-based methods mostly refer to the measurements of the surface albedo, whereas satellite data provide the bidirectional reflectance distribution function (BRDF). However, both reflection properties are influenced by e.g., the surface roughness and the snow grain shape and orientation. Therefore, a comparison of grain size data derived from different observation platforms is significantly affected by the assumption and uncertainty of these parameters.
In general, an increasing surface roughness tends to reduce the surface albedo and leads to a positive bias of the retrieved snow grain size [11,29]. For satellite-based remote sensing of the snow grain size, the deviation of the snow BRDF from that of an ideal plane surface, may lead to an underestimation (overestimation) of the retrieved SSA ( r opt ) ranging up to one order of magnitude [42]. The influence of the grain shape on the SSA-albedo/BRDF relationship was explored by several authors, e.g., [27,32,43]. Based on ray tracing simulations, Picard et al. [27] revealed an uncertainty of ±20% of the retrieved SSA from surface albedo measurement when the snow grain shape is unknown. Jin et al. [32] studied the shape effect on satellite-based r opt retrievals and summarized that the directional reflectance is more affected by the grain shape than the albedo, and that the best agreement to measured quantities was found when assuming aggregated snow grains. Assuming a combination of different grain shapes was proposed by Libois et al. [28], since metamorphized snow is mostly composed of a mixture of shapes [27].
The following study compares different methods of ground-based, airborne and satellite-based observations of the snow grain size. The intercomparison is further discussed in relation to modeled data from a numerical weather and climate model, and a parametrization of SSA evolution [44]. In contrast to previous studies on methodical comparisons, e.g., [30], this work applies r opt retrievals on data collected under extreme Arctic conditions (low Sun with SZA about 80°). For these conditions, remote sensing, based on optical measurements, is increasingly challenging because of enhanced measurement and retrieval uncertainties. Since low-Sun observations are prevalent especially in Arctic spring and autumn, and an evaluation of weather and climate models require observations of larger spatial scales, this study estimates the variations of different snow grain size retrievals for these extreme conditions. Section 2 introduces the instrumentation and analyzed data set, which was obtained in the framework of a three-week measurement campaign in the North of Greenland in March/April 2018. Section 3 presents the applied models and retrieval methods to estimate the snow grain size. Section 4 shows the intercomparison with respect to (i) the temporal variability of local snow grain size measurements and modeling, and (ii) the spatial variability based on satellite and airborne observations. Furthermore, the retrieval uncertainties are discussed (Section 5) before a summary and a conclusion are given in Section 6.

2. Study Area and Measurements

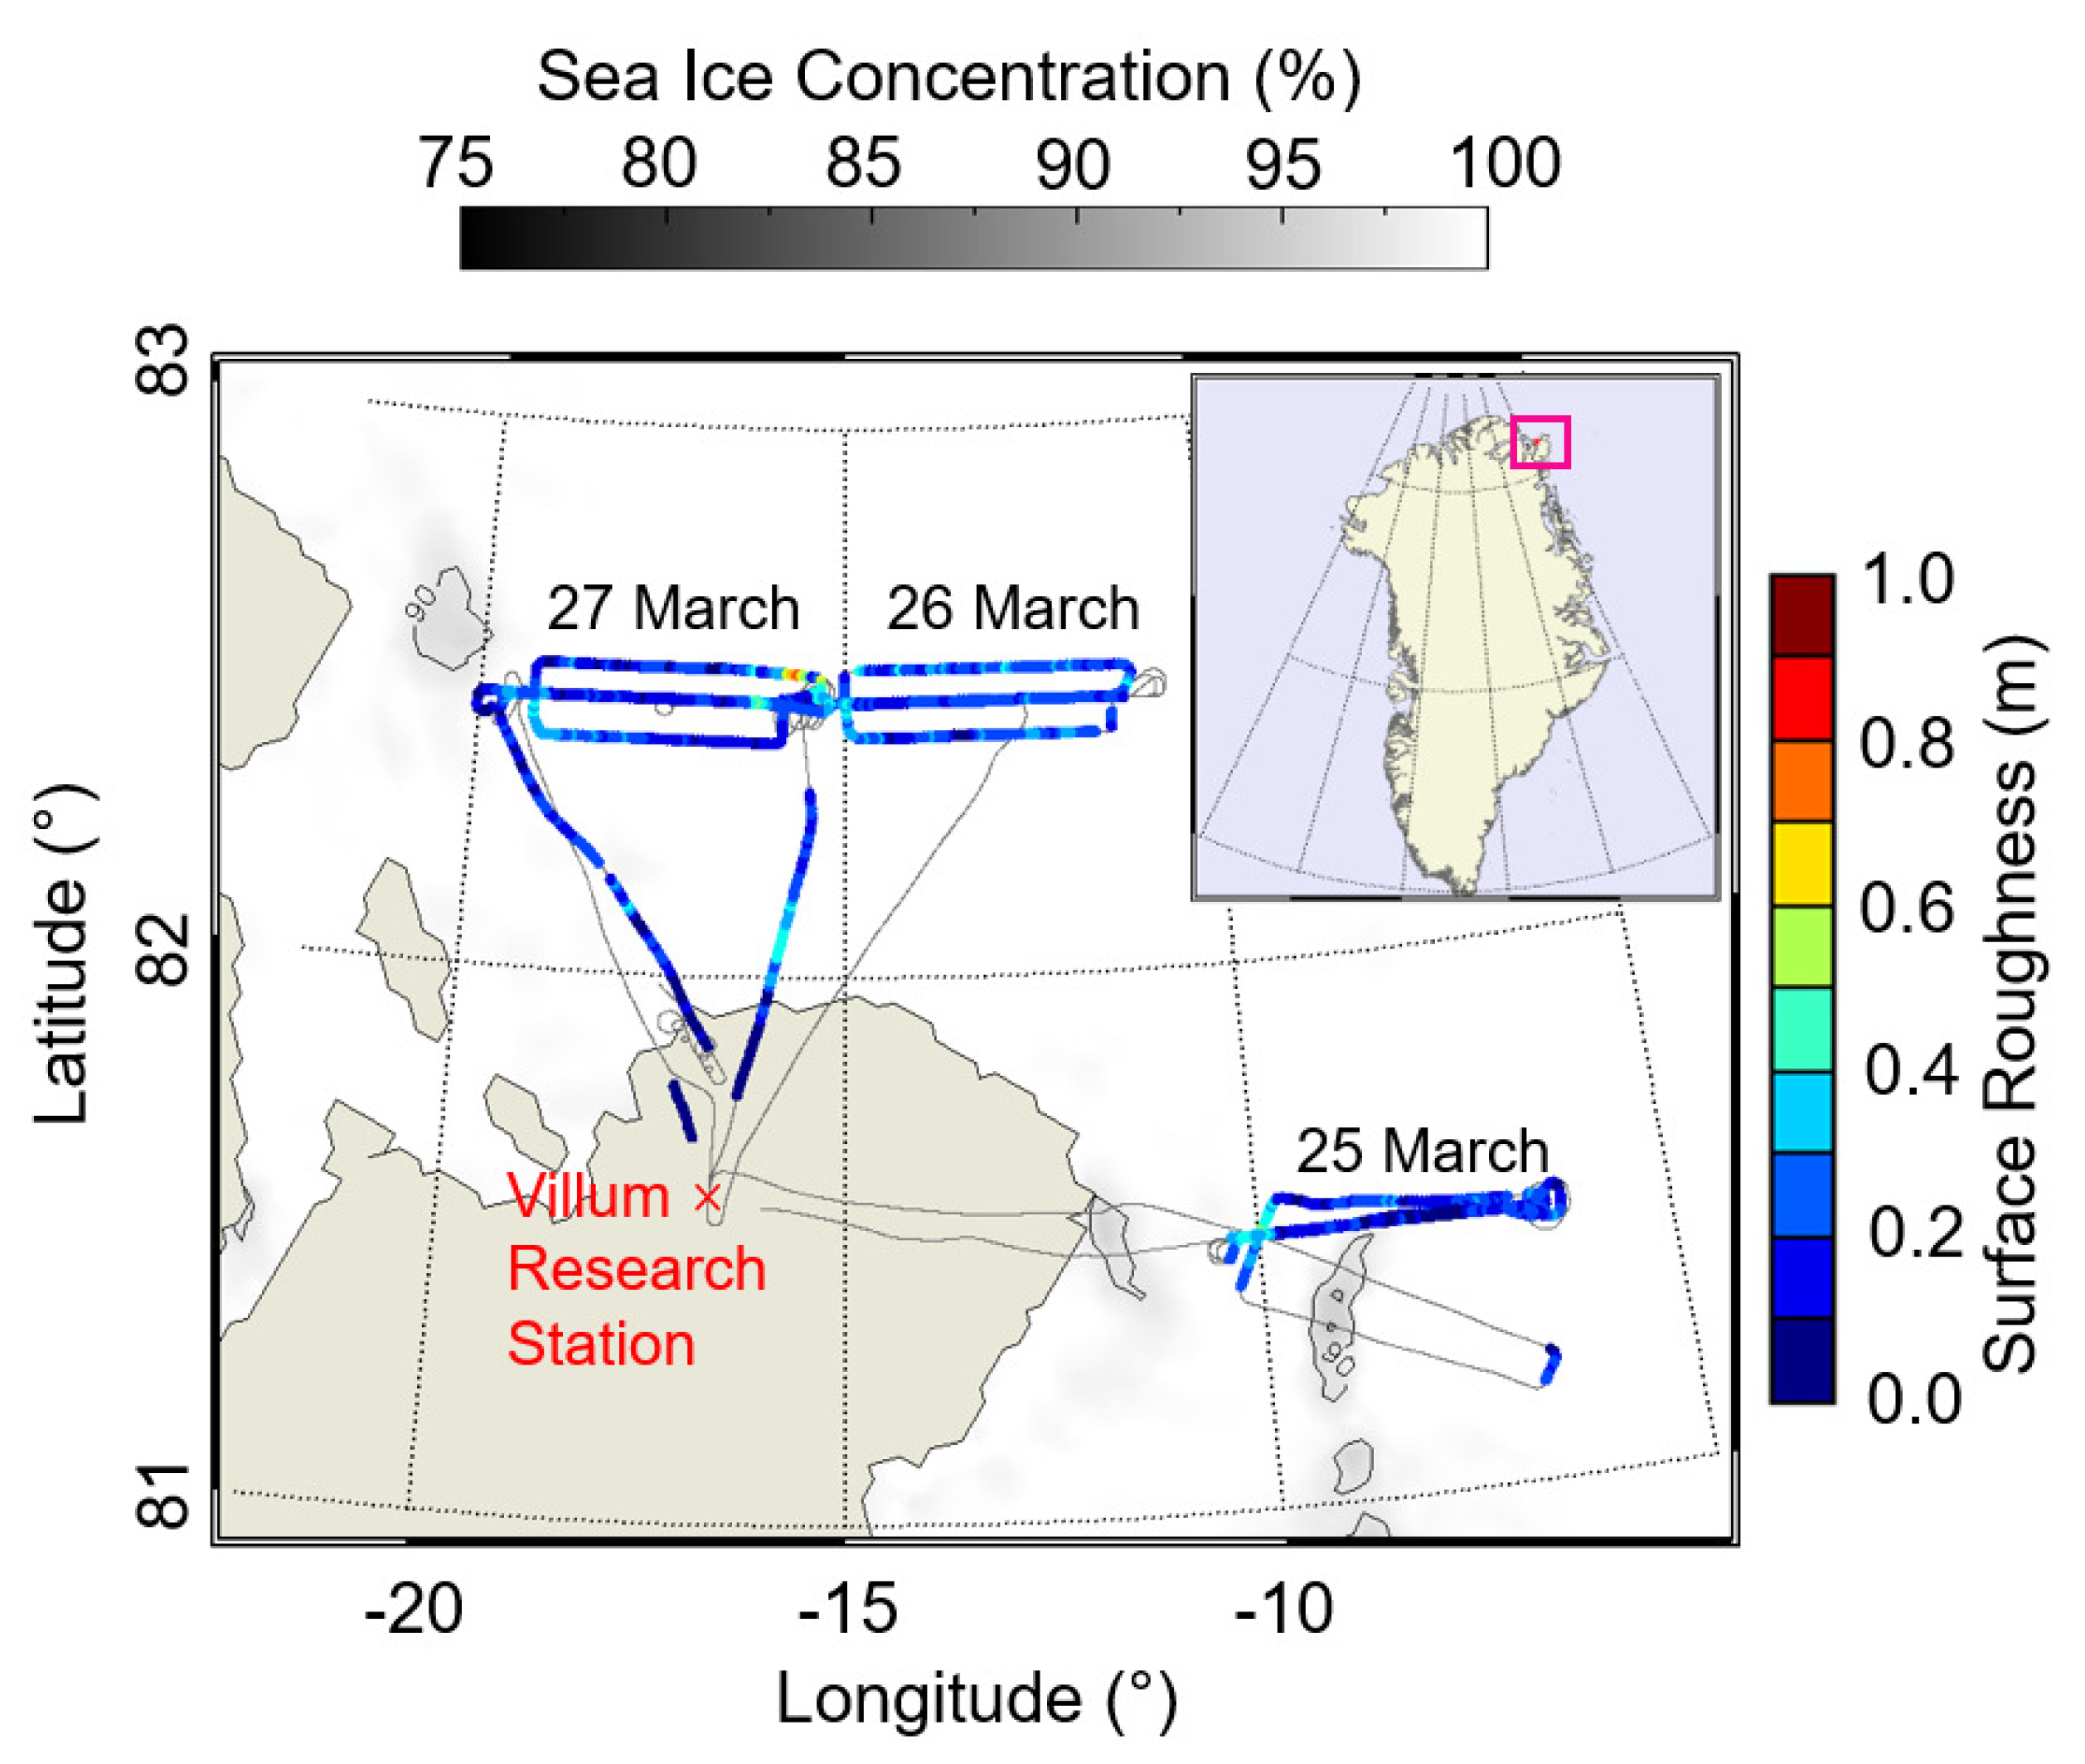
2.1. PAMARCMiP Campaign

This study is based on measurements performed during the Polar Airborne Measurements and Arctic Regional Climate Model Simulation Project (PAMARCMiP) in 2018. PAMARCMiP 2018 belongs to a series of aircraft campaigns performed within the Arctic region [45] and was conducted together with ground-based observations from 10 March to 8 April 2018. Ground-based and airborne measurements were performed at and in the vicinity of the Villum research station (Station Nord), Greenland (81°36′N, 16°40′W) to document the short-term variability, horizontal and vertical distribution of aerosols and BC in the atmosphere, and concentrations of BC embedded in snow. The airborne activities started on 23 March 2018 and were carried out with the research aircraft Polar 5 [46]. During 14 flights cloud, aerosol [47], and surface properties were quantified by in situ and remote sensing instruments. The observations mainly covered Arctic ocean and the Fram Strait.
Surface properties, as the spectral surface albedo and snow grain size were derived from the spectral modular airborne radiation measurement system (SMART) [48]. The airborne laser scanner RIEGL VQ580 measured the distance to the surface with an accuracy of about 2.5 cm [49]. Out of these data, a 1 × 1 km 2 reference elevation model with a horizontal resolution of 1 m was generated along the flight track. The standard deviation of the relative surface elevation describes the surface roughness. A downward-looking commercial photo camera equipped with a fisheye lens was used to classify the surface conditions. To quantify atmospheric properties, dropsondes of type RD94 [50] were released during the flights. Vaisala HUMICAP humidity and temperature sensors were part of the basis meteorology instrumentation of the Polar 5 aircraft. An airborne Sun photometer with an active tracking system (SPTA) [51] was installed on the top of the aircraft and provided the aerosol optical depth (AOD) at 861 nm and 1026 nm wavelengths. Atmospheric aerosol was also characterized by the Airborne Mobile Aerosol LiDAR (AMALi) system [52] operated in zenith-viewing direction to measure backscatter coefficient profiles at 355 and 532 nm wavelength.

2.2. Instrumentation to Measure the Snow Grain Size

2.2.1. Ground-Based Measurements by the IceCube System

As a ground-based reference, an IceCube instrument was used to derive the SSA of snow over land during PAMARCMiP 2018. The SSA was measured daily at the ground along a fixed 100 m transect located in close vicinity of the Villum research station (distance of 2 km) between 19 March and 4 April, with about 51 samples taken each day. Additionally, broadband surface albedo measurements (300–3600 nm wavelength) were performed by a pair of stationary pyranometers (CM22 by Kipp&Zonen, Delft, The Netherlands) installed close to this IceCube sample line. The manufacturer gives an irradiance uncertainty of about 2%. This uncertainty increases for low-Sun measurements due to the increase of the cosine response error (max. ±3% deviation from ideal at 80° SZA). A second SSA data set was sampled between 22 March and 3 April along a 150 m transect with 5 samples each day about 600 m away from the other transect. With these data sets, temporal and spatial variabilities of the snow grain size and SSA within the course of the campaign were observed.
The IceCube device illuminates a snow sample with a laser diode emitting at 1310 nm wavelength underneath an integrating sphere [38]. A photodiode detects the reflected signal, which is used to calculate the SSA based on radiative transfer simulations with an uncertainty of about 10% for SSA values of up to 60 m 2 kg 1 , which corresponds to a r opt down to 55 µm [38]. The limitations of the IceCube measurement principle for snow samples with smaller grain sizes is related to artefacts, which occur when the snow density is lower than 100 kg m 3 and the radiation may reach the bottom of the snow sample. However, the mean density derived from the weight of the snow sample was 230 ± 30 kg m 3 during PAMARCMiP 2018 and did not fall below this threshold. Recently, Calonne et al. [53] found a systematic factor of 1.3 between SSA derived from IceCube measurements and tomographic images. Optically based SSA retrievals as for the IceCube depend on assumptions about the snow grain shape, such that larger uncertainties than 10% may occur.

2.2.2. Airborne Measurements by SMART

The SMART instrument on board of the research aircraft Polar 5 consists of optical inlets, fibre optics, spectrometers, and a data acquisition system. A set of upward- and downward-looking optical inlets were installed on the aircraft fuselage. The optical inlets were actively stabilized to correct for aircraft movement [48]. The upward and downward spectral radiation was transferred, via optical fibre, from the optical inlets to a set of four spectrometers (two for each hemisphere) covering a spectral range of 0.3 µm to 2.2 µm wavelength with a full width at half maximum of 1–2 and 9–16 nm, respectively [48,54,55]. Radiometric calibrations were performed before and after the field campaign using a NIST-certified (National Institute of Standard and Technology) radiation source (1000 W lamp). In addition, in-field calibrations were applied documenting possible temporal drifts of the SMART sensitivity during the campaign. At large solar zenith angles around 80° to 85° as present during PAMARCMiP, the uncertainty of the measured irradiance at flight level is increased compared to observations performed at smaller SZA. The known components of uncertainty (cosine correction, sensor tilting, absolute calibration, transfer calibration, wavelength accuracy, and dark current subtraction) of SMART were re-evaluated with respect to the large SZAs and the wavelengths applied in the snow grain size retrieval. In particular, the uncertainty of the cosine correction (4%) and the uncertainty of the sensor tilt (2.5%) have a major effect on the overall accuracy of the downward irradiance in the near-infrared (NIR) wavelength range, since the direct-to-global fraction is approaching unity in this spectral range. Using Gaussian error propagation, the uncertainty of downward and upward irradiance in the NIR summed up to 5.7% and 4.0%, respectively.

2.2.3. Satellite Measurements

Two different approaches for satellite SSA retrievals were considered in the study, based on data from the MODerate Resolution Imaging Spectroradiometers (MODIS) on board of the Terra and Aqua satellites and the Sea and Land Surface Temperature Radiometer (SLSTR) instrument on board of Sentinel-3. SLSTR covers the VIS, NIR, and infrared spectral range with nine spectral channels. The used channels for the snow grain size retrievals (0.55 µm and 1.6 µm) have a spatial resolution of 500 m with a measurement accuracy between 2 and 5% [56]. MODIS obtains data in 36 spectral channels with wavelengths ranging from 0.405 to 14.385 µm. Radiance data (level 1B product MOD02) of three channels (3: 0.47 µm, 2: 0.85 µm, 5: 1.24 µm) are applied for the retrieval. These data have a spatial resolution of 250 m and 500 m, respectively, and show a radiometric accuracy of 1.5% to 3% [40].
For the period and area of the PAMARCMiP observations, SLSTR data were available almost once a day, while from MODIS up to four images per day could be used for the data evaluation.

2.3. Measurement Conditions during PAMARCMiP 2018

2.3.1. Sea Ice Conditions

The analysis of aircraft observations focuses on the period 25–27 March 2018, when mostly cloudless conditions prevailed along the flight paths. This restriction to a cloudless period is required to have collocated satellite observations of the surface available. Figure 1 shows the sea ice roughness as derived from the airborne laser scanner along the flight tracks (black lines) for these days. The lowest mean roughness was measured on 25 March with 0.18 ± 0.11 m (max. 0.56 m), the highest on 26 March with 0.23 ± 0.08 m (max. 0.49 m). The highest absolute roughness of 0.81 m was derived on 27 March. The percentage sea ice concentration derived for 26 March from satellite observations by the Advanced Microwave Scanning Radiometer (AMSR) instrument [57] is displayed in the background of Figure 1 with a spatial gridding of about 3 km. Although the flight track on 25 March also covered a region of sea ice concentrations down to 80%, detected by the AMSR-2 sensor, the more northern regions overflown on the following two days were characterized by a sea ice concentration of about 100%. Aircraft-based photos of the surface showed several open leads and young thin ice in the area overflown on 25 March. The snow depth maps derived from AMSR-2 measurements with a resolution of 25 km [58] revealed a mean snow depth averaged along the flight track changing from 22 cm to 27 cm between the flights.

2.3.2. Meteorological Conditions

The general meteorological situation during PAMARCMiP 2018 was characterized by a high-pressure system over the North Pole and weak lows over North-East Greenland, leading to a period of cloudless conditions in the measurement area between 25 and 27 March 2018. Observations of the sea ice surface properties were performed in different flight altitudes ranging from 50 m to 5 km partly passing the same location. For the radiative transfer simulations in this study the atmospheric conditions were constrained by the airborne observations. Sun photometer data were used to estimate the AOD of the entire atmospheric column. The vertical distribution of the aerosol as indicated by AOD measurements in different altitudes was similar for all three days with a continuous decrease of AOD with flight height. No indication of distinctive aerosol layers up to 5 km was given. To setup the simulations in the NIR spectral range, the AOD was extrapolated to 1100, 1280, and 1700 nm by fitting the Angstrom formula [59] to the measured AOD at 861 and 1026 nm. For determining the columnar AOD, only data from flight sections in the lowest altitude were taken into account. For the three flights, mean columnar AODs at 1700 nm wavelength between 0.01 and 0.03 were obtained, indicating the clean conditions during the three flights. In addition, measurements with the AMALi system did not show any disturbances by clouds or aerosol layers. Only a short sequence on 25 March around 16 UTC was removed from the analysis. The atmospheric profiles of air humidity and temperature were compiled from aircraft and dropsonde data. Dropsondes were released during the flights on 26 and 27 March, while for 25 March the atmospheric profile was derived on basis of the aircraft meteorological sensors during a continuous ascent. The temperature profile on 26 March shows the strongest inversion of all three flights, with −20 C difference between the surface temperature of −30 C and the temperature at the inversion height located around 880 hPa, corresponding to an altitude of 1.1 km. The weakest inversion of about 5 K difference was measured on 27 March. The main flight patterns on both days were performed close to 82.5°N over sea ice. On these days, the absolute humidity below 900 hPa pressure level was significantly lower than on 25 March, when the near-surface absolute humidity was affected by areas of open water close to 81.5°N latitude. For this reason, the largest atmospheric impact on the measured radiative quantities due to extinction is expected for the flight on 25 March.

3. Modeling Tools and Retrieval Methods
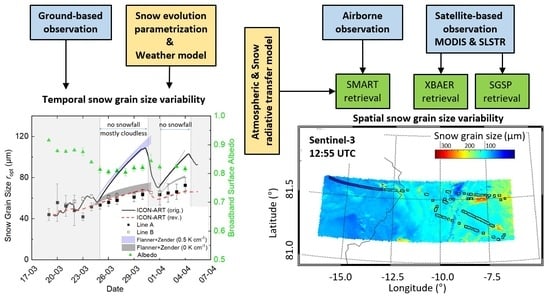
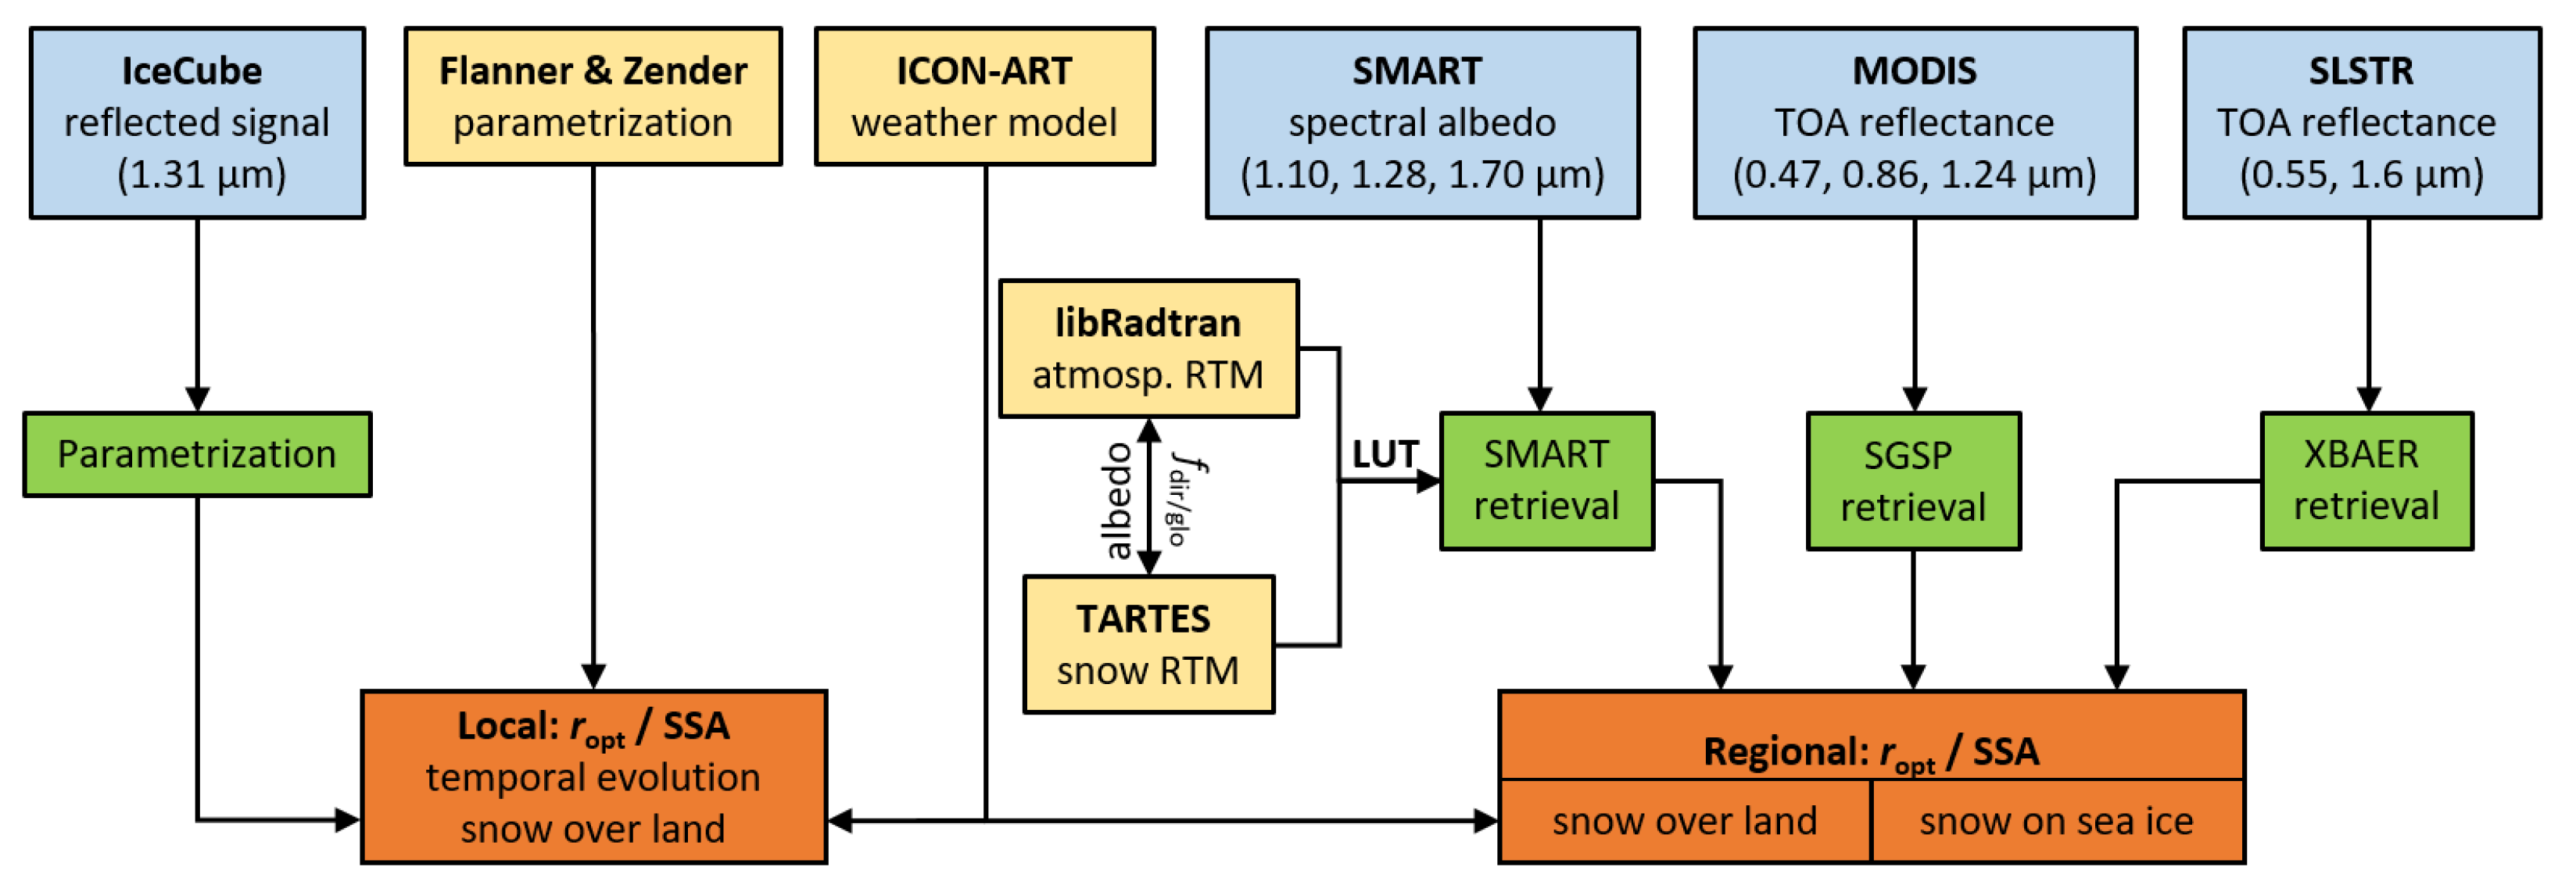
3.1. Overview

This section introduces the modeling tools and snow grain size retrieval methods that were applied on satellite and airborne radiation measurements. For better orientation Figure 2 provides an overview of the linkages between the different measurements, retrievals, and models used to estimate the temporal and spatial variability of the snow grain size (or SSA) over sea ice and land surface. Additionally, to the observational results, simulations of the snow grain size metamorphism performed by means of a weather model and a SSA evolution scheme are presented and compared to the temporal evolution of the snow size derived from local IceCube measurements. The retrieval algorithm applied on SMART data is based on atmospheric and snow radiative transfer models (RTM) which were coupled iteratively. The atmospheric RTM provides the direct-to-global fraction ( f dir / glo ) of the solar radiation incident on the snow depending on the atmospheric conditions and the surface albedo. This direct-to-global fraction is set as boundary condition in the snow RTM for creating Look-Up-Tables (LUT) that are used for the snow grain size retrieval.

3.2. Models

3.2.1. Snow Radiative Transfer Model—TARTES

The open-source Two-streAm Radiative TransfEr in Snow model (TARTES) [43] was used to simulate the surface albedo in direct and inverse mode. The calculation of the snow albedo from snow grain size in direct mode served as input to atmospheric radiative transfer modeling to assess e.g., the impact of clouds on snow albedo and the impact of the assumed snow grain shape on the retrieved grain size. In inverted mode TARTES was used to retrieve the snow grain size from aircraft albedo measurements.
TARTES simulates the radiative transfer in a snowpack applying the delta-Eddington approximation [60]. The snowpack can be constructed from a predefined number of horizontally homogeneous snow layers defined by their snow density, SSA, and mass fraction of soot. The description of the single-scattering properties of each layer is based on analytical equations given by Kokhanovsky and Zege [41] (see also Section 4).
Libois et al. [43,61] discussed the role of the snow grain shape on the radiative transfer in a snowpack. The grain shape is represented by the absorption enhancement parameter (B), and geometrical asymmetry factor ( g G ). B accounts for the photon path length inside the snow grains due to multiple internal reflections, while g G approximates the ratio between forward and backward scattering by the snow grains. Following Libois et al. [43], for particles large compared to the wavelength, the asymmetry factor g can be estimated by:
g = 0.5 · ( g G + 1 ) .
TARTES allows an adjustment of B and g depending on the selected particle shape.
In the simulations of the snow surface albedo, we assumed a single snow layer without soot impurities. The snow grain size was varied between 10 µm and 300 µm. The surface albedo strongly depends on the spectral distribution and the direct-to-global fraction of the incident radiation. This input was provided by an atmospheric radiative transfer model (Section 3.2.2). Generally, for a smooth snow surface the surface albedo increases with increasing SZA due to a higher probability of the photons to be scattered out of the topmost layer of the snowpack at low Sun. Additionally, the forward scattering dominates the asymmetry of scattering, and increases the surface albedo [11]. For low Sun, single-scattering dominates, while for higher Sun the radiation can penetrate deeper into the snowpack corresponding to a higher probability of multiple-scattering. The scattering phase function of the snow particles depends on the snow grain shape. Therefore, the effect of the grain shape on the radiative transfer becomes more relevant for single-scattering than for multi-scattering events, when the angular scattering dependence is increasingly smeared out [11].

3.2.2. Atmospheric Radiative Transfer Model—libRadtran

To calculate the direct-to-global fraction of the incident solar radiation and for the atmospheric correction of the airborne surface albedo measurements, the radiative transfer package libRadtran [62,63] was applied. As a solver for the radiative transfer equation, the Discrete Ordinate Radiative Transfer solver (DISORT) [64] routine was chosen. For the parametrization of the gas absorption, the SBDART model [65] was applied. The extraterrestrial spectrum was taken from Gueymard [66]. Profiles of pressure, temperature, density, and gases were adapted to the airborne observations. The aerosol particle properties were specified by the spectral AOD, derived from Sun photometer measurements, the single-scattering albedo ( ω ), and the asymmetry factor of the aerosol particles. The latter two parameters were estimated from the Ny-Ålesund AERONET (AErosol RObotic NETwork) data set. We set ω = 0.95 and g = 0.65 as default in the NIR. The impact of the uncertainty of ω and g on the simulated NIR spectral irradiance is low, since the AOD derived for the selected data set did not exceed 0.03 (Section 2). Simulations using an ω of 0.99 and a g of 0.58 resulted in a difference to the default settings of less than 1%.

3.2.3. Weather and Climate Model—ICON-ART

Often, satellite measurements serve as validation of models. However, in terms of snow grain size, there are large uncertainties in both models and remote sensing methods. For this reason, this study compares the results of different observational methods during PAMARCMiP with results from the weather model ICOsahedral Nonhydrostatic model (ICON) [67]. In this way, it is possible to assess whether the model can provide an estimate of snow grain size in the absence of measurements. ICON was developed by the German Weather Service (DWD) and Max Planck Institute for Meteorology (MPI-M). The model system solves the compressible Navier–Stokes equations on an icosahedral grid, which can be seamlessly adjusted in resolution for global and regional simulations. A detailed description of the model can be found in Zängl et al. [67] and Giorgetta et al. [68]. With the extension for Aerosols and Reactive Trace gases (ICON-ART) developed at the Karlsruhe Institute of Technology (KIT), the model can simulate aerosols, trace gases, and related feedbacks [69,70]. The limited area mode, applied here, enables the model to simulate a confined region at high resolution with prescribed lateral boundary conditions. The simulation was run with a horizontal resolution of approximately 3.3 km. The initial state and the boundaries were driven with data from the Integrated Forecasting System (IFS) of the European Centre for Medium-Range Weather Forecasts (ECMWF) and fed in at six-hour intervals. ICON currently has two different snow models. The first is a single-layer snow model used for the operational weather forecast. The second is an experimental multi-layer snow model [71], which was applied in this study in a three-layer set up. To investigate the impact of aerosols on the optical properties of snow, the model was extended by the snow grain radius as a new prognostic variable, whereby the aging is based on Essery et al. [72]. In contrast to the original parametrization, ICON-ART uses a lower threshold value discriminating new and aged snow. The applied threshold value is 1 kg m 2 compared to 2.5 kg m 2 .

3.2.4. Parametrization of SSA Evolution

Flanner and Zender [44] parameterized the SSA evolution of dry snow with respect to the effect of the local temperature gradient and the curvature growth following the approach by Legagneux et al. [73]. Based on observational data they proposed an empirical relation of temperature controlled SSA evolution by the fit parameters κ and τ :
SSA ( t ) = SSA 0 · τ t + τ 1 / κ ,
with t for time and SSA 0 representing the initial SSA at t = 0. Simulations in this study were performed for a set of parameters τ and κ representative for a range of snow temperatures (−37 °C to −28 °C) and vertical temperature gradients (0 K cm 1 to 0.5 K cm 1 ). The temperature-dependent best-fit parameters for τ and κ were fitted to adapt them to the temperature range during the considered period based on the tabulated data at 0 °C, −10 °C, −20 °C, and −50 °C in Flanner and Zenner [44].

3.3. Snow Grain Size Retrieval Methods

3.3.1. XBAER Retrieval of Snow Grain Size Using Satellite-Based Sentinel-3 Data

The eXtensible Bremen Aerosol/cloud and surfacE parameters Retrieval (XBAER) algorithm is a generic algorithm, which can derive aerosol [74], cloud [75], and surface [76] properties from satellite observations. It has recently been extended to derive snow grain size, snow particle shape, and SSA using the Sea and Land Surface Temperature Radiometer (SLSTR) instrument on board Sentinel-3. The retrieval process is performed using a LUT. In the LUT, snow optical properties are pre-calculated for nine predefined ice crystal particle shapes (aggregate of 8 columns, droxtal, hollow bullet rosette, hollow column, plate, aggregate of 5 plates, aggregate of 10 plates, solid bullet rosette, column) [77]. An atmospheric correction step is applied with a weakly absorbing aerosol type [76] and AOD from Modern-Era Retrospective Analysis for Research and Applications (MERRA) simulation. The aerosol profile is approximated by an exponential function between surface and 3 km altitude. Other trace gas profiles are taken from a monthly latitude-dependent mean climatology. Snow grain size and snow particle shape are then obtained by minimizing the differences between theoretical simulations and SLSTR observations of the surface directional reflectances at two wavelengths (0.55 µm and 1.6 µm). The sensitivity study, as presented in Mei et al. [37], shows that the impact of snow particle shape selection on the r opt retrieval is significant, and potential cloud/aerosol contamination introduce an underestimation of r opt . The previous comparison between XBAER derived snow grain size and ground-based measurements of continental snow shows a relative difference of less than 5% [39].

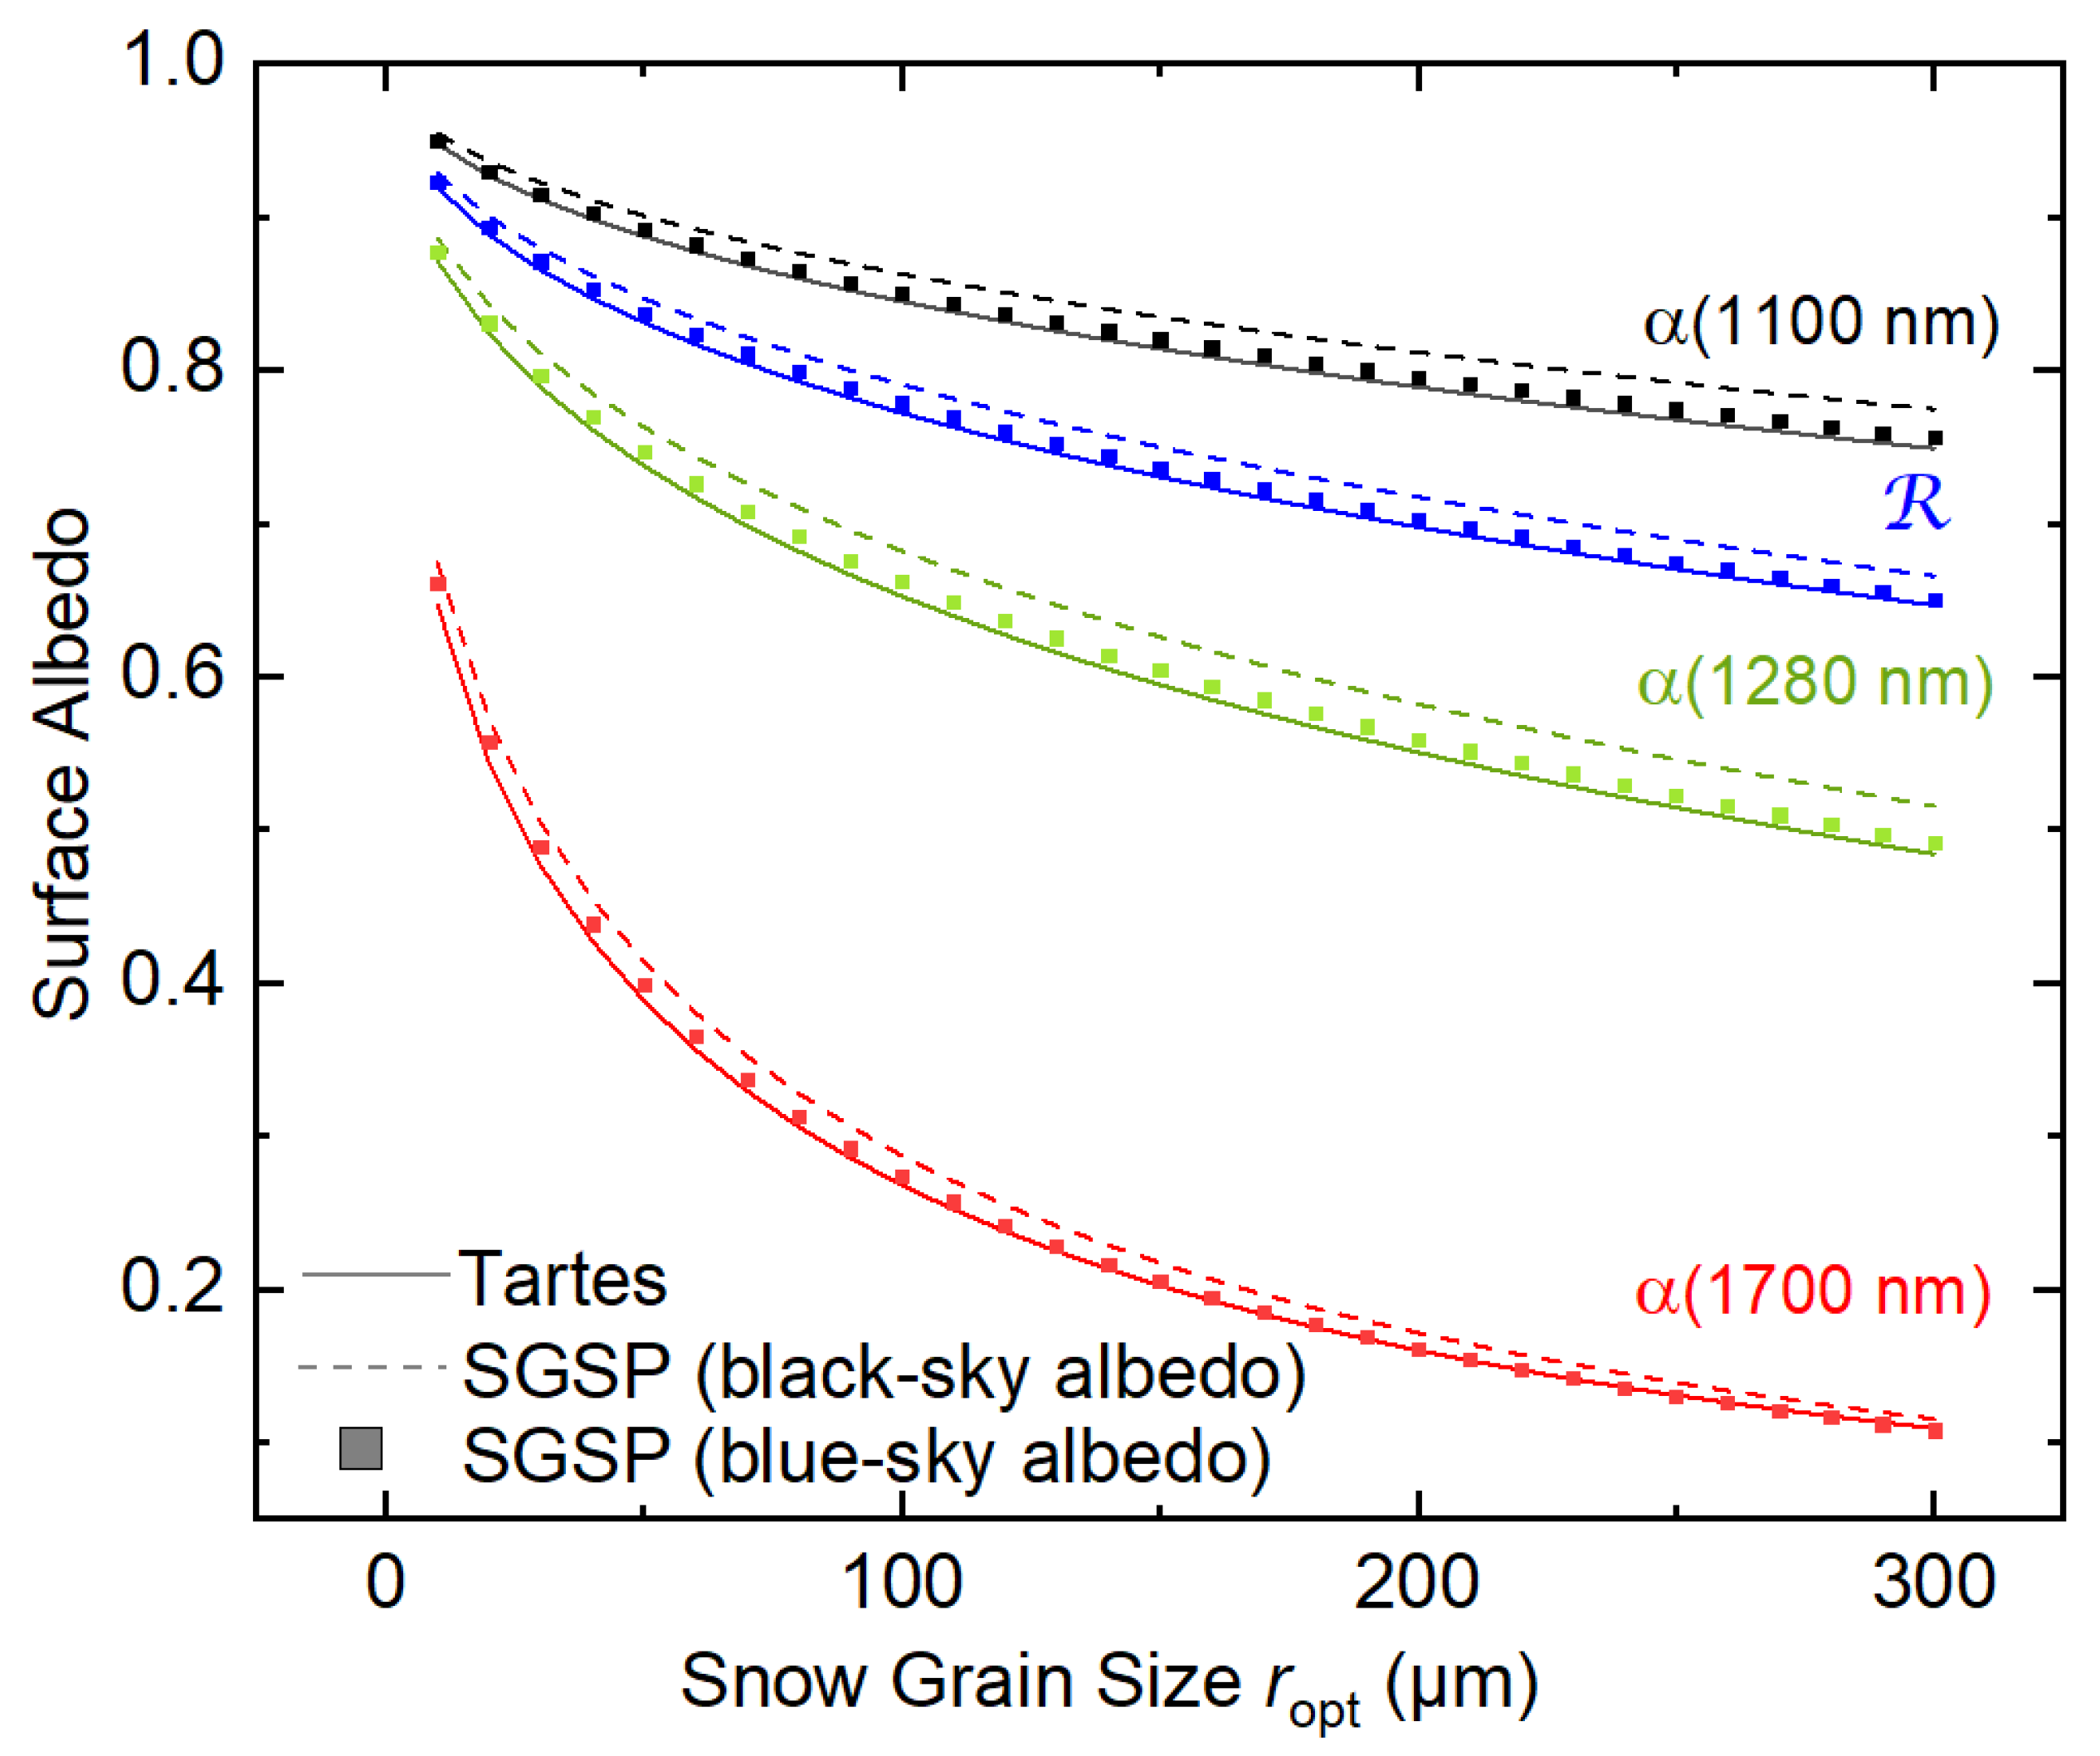
3.3.2. SGSP Retrieval of Snow Grain Size Using Satellite-Based MODIS Data

In this study, the snow grain size and pollution amount (SGSP) retrieval algorithm by Zege et al. [35] was applied to MODIS data. Following Wiebe et al. [40], the SGSP retrieval does not require a priori information on the snow grain shape. Radiances of MODIS (MOD02) measured in three channels (0.47 µm, 0.85 µm, 1.24 µm) are used in this method, which reveals a snow grain size retrieval uncertainty of 10% for SZA lower than 75° [35]. This uncertainty increases up to 20% for SZA = 85° [30].
The SGSP retrieval method uses an analytical asymptotic solution of the radiative transfer equation [41]. Following Zege et al. [35], the black-sky surface albedo α bs ( θ 0 ) , corresponding to the hemispherical reflectance and assuming only direct illumination, can be calculated as a function of the solar zenith angle θ 0 by:
α bs = exp [ y · K 0 ( θ 0 ) ] ,
where K 0 represents the escape function determining the angular distribution of radiation, which escapes from a semi-infinite, non-absorbing medium as approximated by Kokhanovsky [78] with:
K 0 = 3 7 · [ 1 + 2 cos ( θ 0 ) ] .
For completely diffuse illumination Equation (4) reduces to:
α ws = e x p [ y ] ,
defining the white-sky albedo α ws [35]. According to Kokhanovsky and Zege [41] and Zege et al. [35], y in Equations (4) and (6) can be written as:
y = A · 4 π · χ ( λ ) λ · r opt ,
when considering radiative transfer in a dense snowpack, with χ being the imaginary part of the complex refractive index of ice, wavelength λ , which is taken from Warren and Brandt [79]. A represents the form factor, which depends on the particle shape, and combines the absorption enhancement parameter B and the asymmetry parameter g:
A = 4 3 2 B 1 g .
Ref. [35] gave a range of A between 5.1 for fractals [80] and 6.5 for spheres. This range of possible values of A contributes to the uncertainty of the retrieved r opt (25%) due to the unknown particle shape. The SGSP retrieval uses an averaged value for A of 5.8 with B = 1.5 and g = 0.84, derived for a mixture of randomly oriented hexagonal plates and columns. To reduce uncertainties using different settings for the satellite retrieval and the TARTES simulations, we set A = 5.8 in both applications.
Since satellites cannot measure the albedo directly to relate the snow albedo and the snow grain size using Equation (4), the SGSP retrieval accounts for the BRDF instead. Satellite-based measurements of the snow surface reflectance are determined by both atmospheric and surface contributions. By considering the atmospheric contribution and assuming the spectral independence of the BRDF, the snow grain size is determined iteratively [35,40]. Further details regarding to the theoretical background of the SGSP retrieval, and the applied equations were given in Zege et al. [35] and Wiebe et al. [40].

3.3.3. Snow Grain Size Retrieval Using Airborne SMART Data

Carlsen et al. [30] applied a modified approach of the SGSP retrieval by Zege et al. [35] to derive the snow grain size from airborne spectral albedo measurements. In their retrieval approach, Carlsen et al. [30] used the spectral albedo ratio ( R ), which is the ratio between the SMART albedo measurements at λ 1 = 1280 nm and λ 2 = 1100 nm wavelength. Based on Equations (4) and (7) they related the snow grain size to R by:
r opt = ln R A · K 0 ( θ 0 ) · 4 π · χ ( λ 2 ) λ 2 4 π · χ ( λ 1 ) λ 1 2 .
It was argued that using a spectral albedo ratio would reduce the retrieval uncertainty, because wavelength-independent calibration uncertainties of the SMART instrument would cancel each other out [30]. Nevertheless, in this study here also a single-wavelength approach is tested that uses the albedo at 1700 nm wavelength (subsequently called α (1700 nm)-based retrieval).
SMART measures the spectral albedo at flight altitude. As for satellite observations, scattering by atmospheric constituents between surface and aircraft alters the radiation spectrum compared to measurements at surface level. Therefore, an atmospheric correction was applied following the method by Wendisch et al. [81]. It is based on an iterative algorithm, which deployed radiative transfer simulations with the radiative transfer package libRadtran [62,63].
The aircraft measurements by Carlsen et al. [30] were performed over the Antarctic Plateau at high elevation and, thus, in dry air and pristine atmospheric conditions, such that f dir / glo in the NIR spectral range was assumed to be close to unity. This allowed the usage of the black-sky albedo in Equation (9) to retrieve r opt under cloudless conditions [30]. However, for the atmospheric conditions during PAMARCMiP the diffuse incident radiation cannot be neglected, such that the blue-sky albedo ( α bs ) needs to be taken into account. The blue-sky albedo can be understood as a linear combination of the black-sky and white-sky albedo:
α b = α bs · f dir / glo + α ws · ( 1 f dir / glo ) .
Different to Carlsen et al. [30], this study applies a combination of TARTES and libRadtran simulations to generate LUTs. These LUTs relate blue-sky snow surface albedo and snow grain size for the specific atmospheric conditions (in terms of f dir / glo ) during the PAMARCMiP observations. To estimate r opt , a nonlinear least square method is applied which minimizes the root mean square deviation between the observed and modeled albedo.

3.3.4. Relevance of Atmospheric Effect Correction on SMART Retrieval

Both TARTES and the SGSP retrieval method rely on the same theoretical background based on the formalism by Kokhanovsky and Zege [41]. Figure 3 compares the dependence of snow surface albedo with snow grain size for the different approaches. Neglecting the diffuse incident contribution for the PAMARCMiP conditions, would result in a significant difference of the calculated surface albedo for SZA = 80° and A = 5.8 (Figure 3). For all wavelengths, the parameterized black-sky albedo (dashed lines) using Equation (4) is larger than the results from the TARTES simulations (solid lines) and blue-sky-albedo calculations applying Equation (10) (filled squares), which account for the proper f dir / glo . The direct-to-global fraction and consequently the offset between the black-sky and blue-sky-albedo are wavelength-dependent, such that R shows also a bias between both methods. This indicates the need for considering the direct-to-global fraction in the retrieval and shows the advantage to use coupled atmospheric and snow radiative transfer models.
The atmospheric masking over Arctic snow can contribute to significant uncertainties in the albedo-based r opt retrieval. The atmospheric effects representative for the PAMARCMiP conditions are illustrated in Figure 4. The spectral surface albedo was simulated for snow grain sizes between 60 µm and 350 µm (SSA: 9.3 to 55 m 2 kg 1 ) using the TARTES model (gray scaled solid lines in Figure 4). The spectral surface albedo for r opt = 60 µm was set as input for atmospheric radiative transfer simulations with libRadtran to calculate the upward and downward spectral irradiances at 200 m and 3000 m altitude, corresponding to common flight altitudes during PAMARCMiP. The height-dependent albedo calculated from the simulated irradiance spectra are shown as dotted and dashed red lines in Figure 4.
Over bright surfaces, such as snow, the atmospheric masking results in a reduction of the albedo in higher altitudes compared to the surface albedo. In the considered wavelength range, the atmospheric masking is dominated by the extinction of water vapour which is most efficient in the gray marked spectral ranges shown in Figure 4. A minor absorption effect on the albedo spectrum for 3 km flight altitude is still visible outside of these marked areas. Only in the range of the atmospheric window ( λ > 1550 nm), gas absorption becomes negligible. For the r opt retrieval wavelengths 1100 nm and 1280 nm (both indicated by a vertical line in Figure 4), the albedo at 3 km altitude shows a reduction of 0.14 and 0.12, respectively, as compared to the default surface albedo. The atmospheric impact on the albedo for 200 m flight altitude is rather small with a bias of −0.01. However, the bias would directly contribute to a r opt retrieval error, if no atmospheric correction was applied. The snow grain size matching with the uncorrected albedo at 1280 nm wavelength at 3 km altitude, for example, would result in an overestimated r opt of about 150 µm (SSA = 22 m 2 kg 1 ) compared to the default 60 µm snow grain size. This clearly demonstrates the relevance of the atmospheric correction when using wavelengths, which are highly affected by water vapour absorption. The uncertainty due to an insufficient atmospheric correction is reduced when applying the α (1700 nm)-based retrieval as shown in Figure 4.

4. Comparison of Retrieval Results

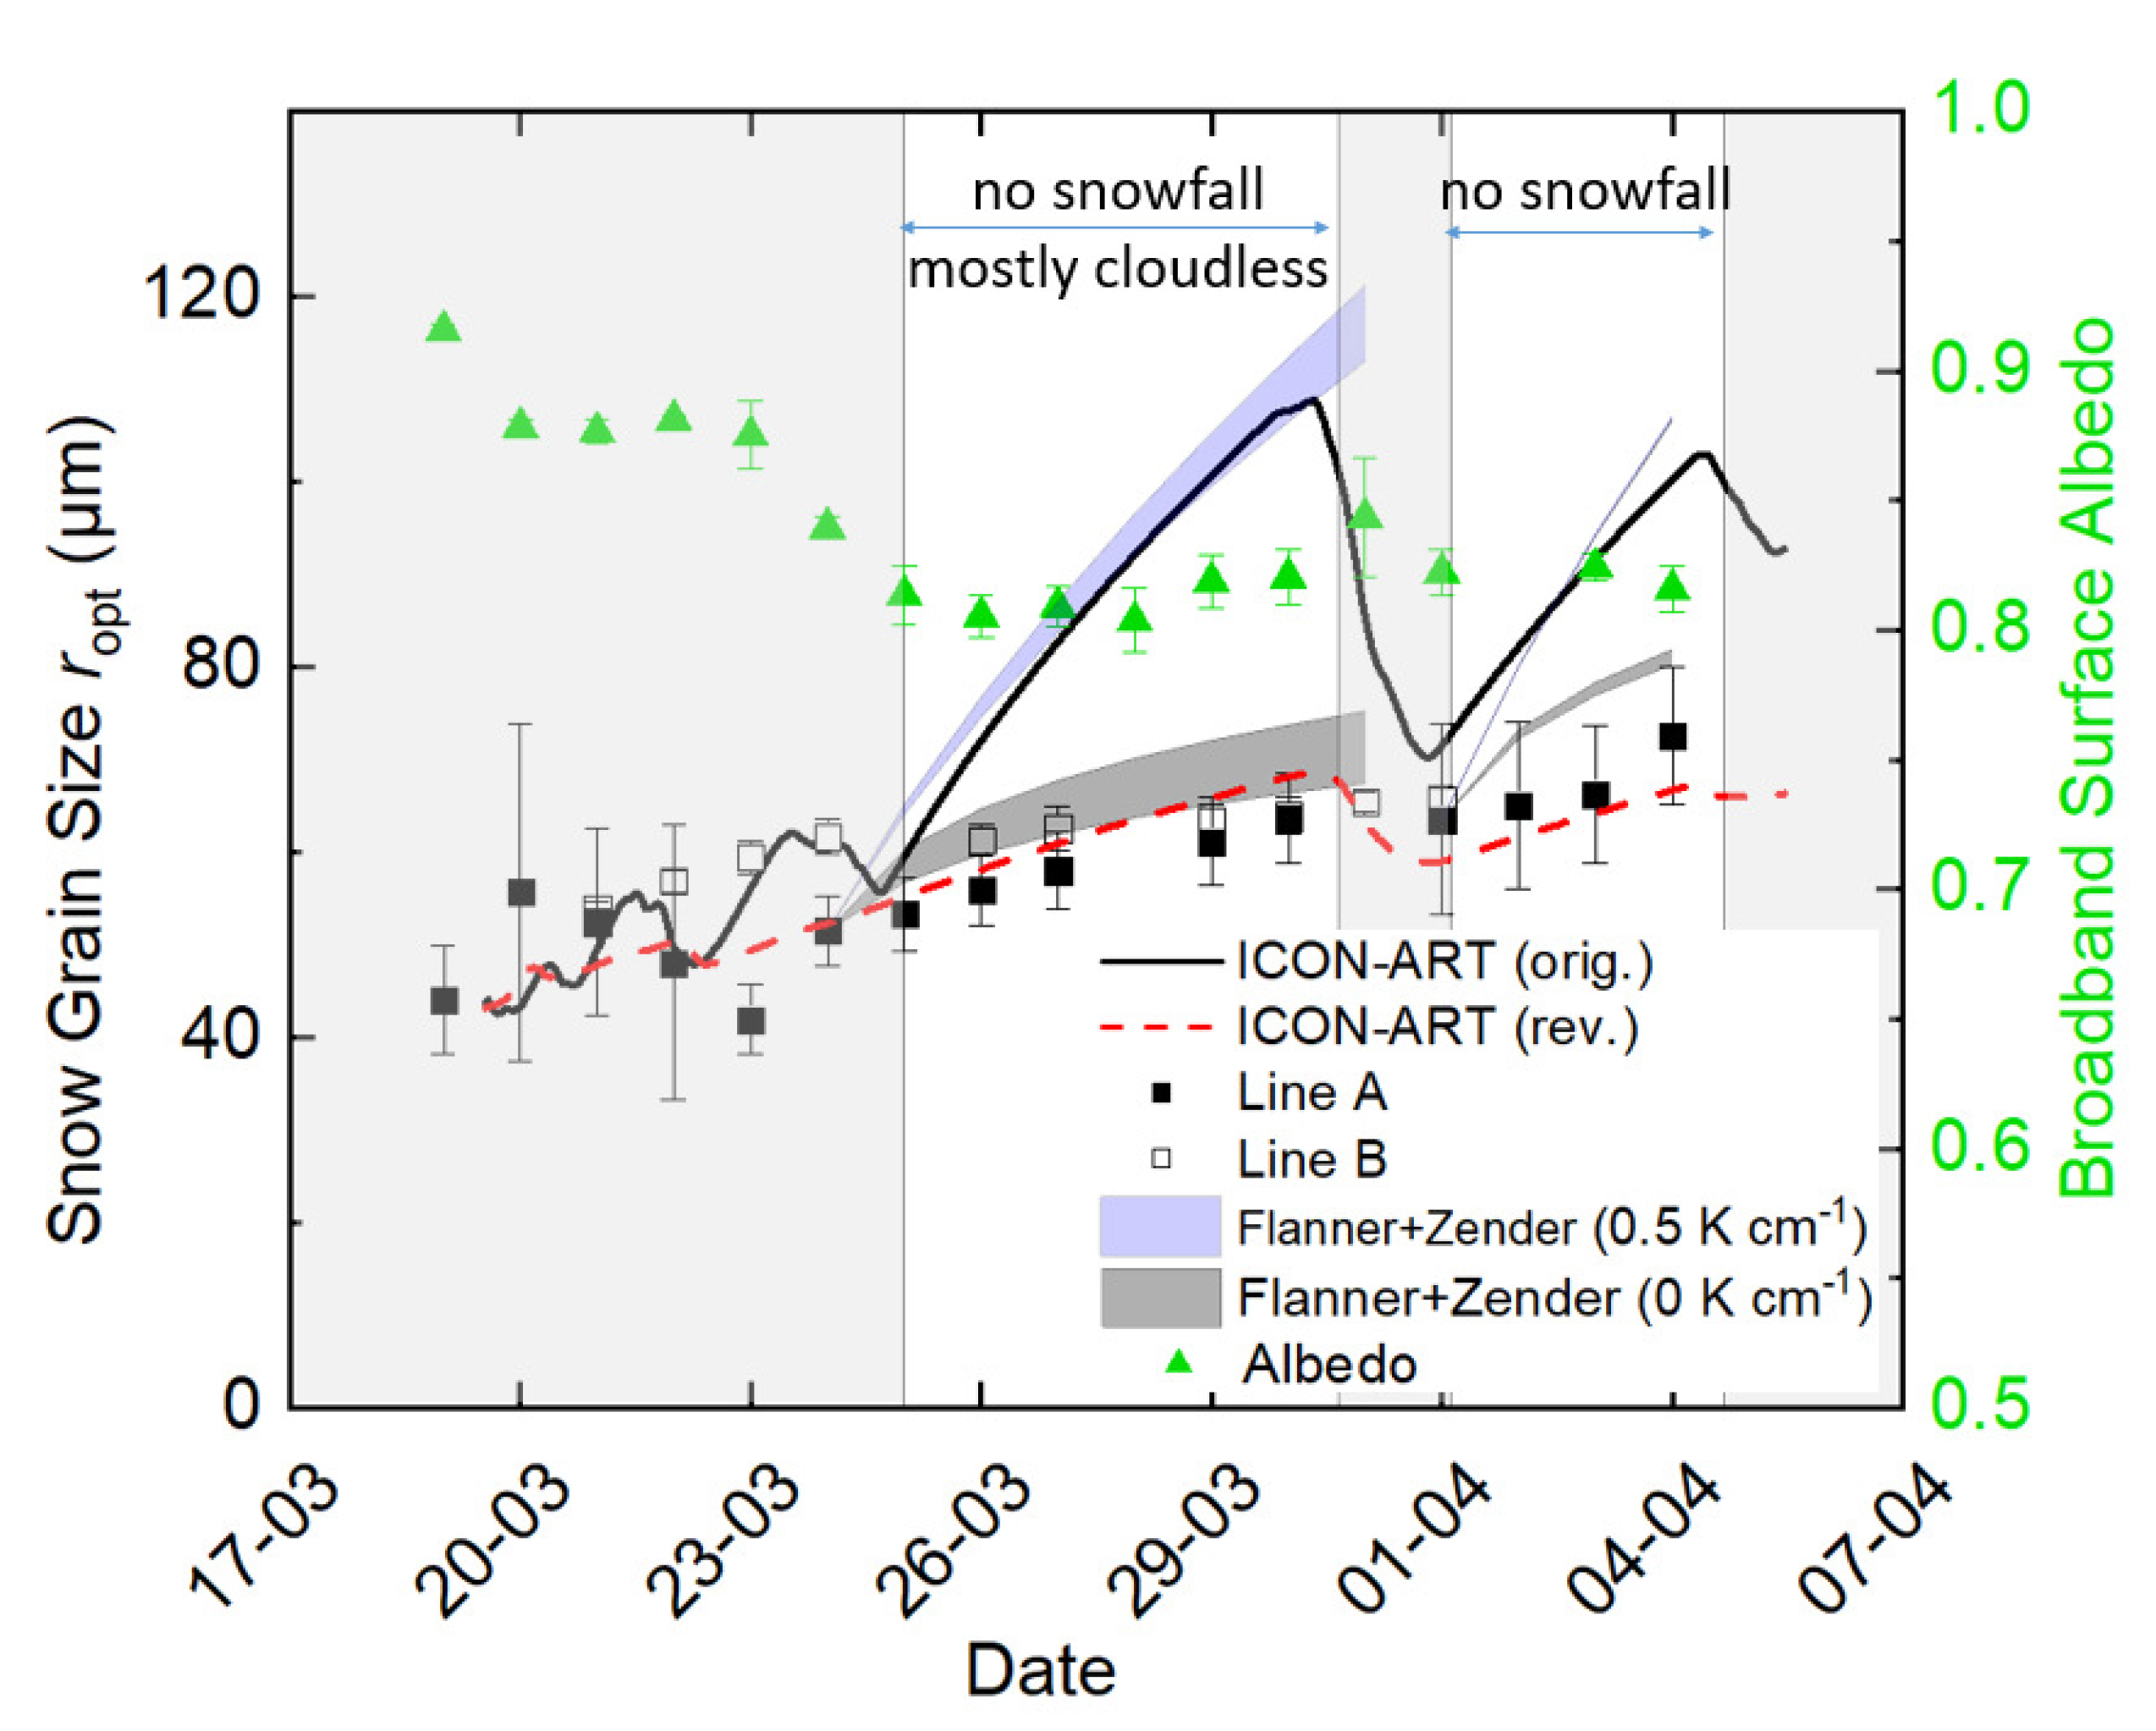
4.1. Temporal Variability: Local Observations and Modeling

Daily ground-based snow grain size measurements by the IceCube instrument near the Villum research station were performed during PAMARCMiP over almost three weeks starting on 19 March 2018. At the beginning of the measurement period a hard crust covered with only some millimeter of snow was observed, which resulted from a refreezing period after a massive snow melting event in the end of February 2018. After days of snowfall, a period of dry and mostly cloudless conditions followed, whereby the air temperature did not exceed −25 °C. The spatially averaged snow grain size data along line A (100 m, 51 samples) and along line B (150 m, 5 samples) are shown in Figure 5. The error bars indicate the 1-sigma standard deviation calculated from the total set of samples. In general, r opt increased slightly at both sample locations between 44 µm and 72 µm within the three weeks of measurements. The highest variability was observed in the first period of snowfall up to the onset of the cloudless period on 25 March 2018. The day-to-day variation in this first week of observations was stronger than for the following periods, and the spatial variation between the 51 samples along the 100 m transect (line A) covered almost the entire range of r opt -values of the three weeks of measurements. Weak snowfall and blowing snow were reported on 20 March, drifting snow and weak snowfall for 22 March, which might explain the striking variability on these two days. The spatially averaged snow grain size along line B showed mostly higher r opt -values than measured along line A (600 m away), in particular in the first week with snowfall and drifting and blowing snow conditions. For the remaining period, both data sets of line A and line B agreed within the range of the individual standard deviations. The range and the temporal evolution of the measured snow grain size is less strong, with an increase of 15 µm within five days after snowfall, than observed by Carlsen et al. [30] for example. Their measurements on the Antarctic Plateau have shown a more pronounced daily increase in snow grain size after snowfall of about 5.8 µm day 1 (daily SSA decrease: 3.2 m 2 kg 1 day 1 ) under a similar temperature regime (−20 °C to −35 °C).
The snow grain size evolution simulated with ICON-ART is shown in Figure 5 as a solid line. The simulation assumes a growth rate factor of 0.06 µm 2 s 1 for this temperature and snow grain size range as suggested in Essery et al. [72]. The snowfall period before 25 March is well covered by the ICON-ART simulations. However, the growth of the snow particles evolves rapidly in the cloudless period reaching r opt -values up to 110 µm (SSA = 30 m 2 kg 1 ) which is about twice the numbers derived from the IceCube measurements. With the onset of the second short period of snowfall on 30 March, the snow grain size decreased to a value similar to the in situ observations. The comparison shows that the snow grain size of new snow can be well reproduced by ICON-ART. However, the aging process is not well represented by the growth rate factor from Essery et al. [72] for the specific conditions during PAMARCMiP. Therefore, the parametrization of the growth rate factor in ICON-ART was adjusted, such that the simulated snow grain size covers the in situ measurements (red dashed line in Figure 5). For the specific temperature and snow grain size during PAMARCMiP, the original growth parametrization of Essery et al. [72] was applied, but with a reduced growth rate factor of about 0.012 µm 2 s 1 , one fifth of the original value.
In addition to ICON-ART, the parametrization by Flanner and Zender [44] was compared to the observations. For the precipitation-free period starting at the end of 24 March we calculated the snow grain size evolution based on Equation (3) for two scenarios with dT/dz = 0 K cm 1 and dT/dz = 0.5 K cm 1 . From snow pit measurements performed on 24 March, a vertical temperature gradient of about 0.4 K cm 1 was derived. Further snow temperature measurements were conducted at the top of the snowpack covering a range between −28 °C and −37 °C. The dark gray and blue areas shown in Figure 5 account for this range of snowpack top temperatures, where the upper boundaries of the snow grain size range comprise with the higher snowpack top temperature and the lower boundary with calculations for −37 °C. A significant overestimation was observed assuming a vertical temperature gradient of 0.5 K cm 1 (blue shaded areas in Figure 5). The snow grain size for this scenario matches well with the original ICON-ART simulations (black solid line). However, the IceCube measurements show that the vertical gradient effect is less relevant for these low surface temperatures than considered in the parametrization after Flanner and Zender. Using an equilibrium metamorphism (dT/dz = 0 K cm 1 ) would lead to a much better agreement between parameterized and measured snow grain sizes (dark gray area in Figure 5). One of the reasons for this poor representation of snow grain size evolution by the parametrization might be caused by the lower fitting quality of the temperature-dependent parameters, τ and κ from Flanner and Zender [44] to the observed temperature range during PAMARCMiP. For dT/dz = 0 K cm 1 , the original temperature-dependent parameters were described by an exponential decay fitting with a coefficient of determination ( R 2 ) larger than 0.99, while for dT/dz = 0.5 K cm 1 the fitting quality was significantly lower [ R 2 ( τ ) = 0.5, R 2 ( κ ) = 0.99].
The snow metamorphism affects the measured broadband surface albedo, which is shown in Figure 5. The broadband surface albedo derived from the ground-based pyranometer measurements were calculated from daily averages of measurements between 15:30 and 16:30 UTC, when daily IceCube measurements were carried out. The highest surface albedo values were observed before 25 March. With the onset of the cloudless period the broadband surface albedo decreased from about 0.87 to about 0.80. Radiative transfer simulations using TARTES and libRadtran were applied to estimate the surface albedo for the conditions on 22 March and 26 March, representing the overcast (period I) and cloudless period (period II). During the overcast period I (22 March) only diffuse radiation incident on the snow layer which makes the albedo calculation independent from the SZA. A snow grain size of r opt = 50 µm was set. The parameters of period II (26 March) were estimated with SZA = 81.4° and r opt = 60 µm. The simulations revealed a difference of Δ α = 0.09 between period I ( α = 0.96) and period II ( α = 0.87) which is only slightly higher than derived from the observations ( Δ α = 0.07). However, the absolute values of the modeled albedo for 22 and 26 March overestimate the corresponding observations ( α = 0.88 and α = 0.80) even taking the measurement uncertainty into account. This may be a result of the choice of the snow grain shape in TARTES in terms of setting the parameters B and g. The shape effect is further discussed in Section 5.3.
Despite the observed bias between modeled and measured snow albedo, we used TARTES simulations to evaluate the change of the broadband surface albedo from period I to period II. The decrease of snow albedo might be caused by the increase of snow grain size and/or the change of the atmospheric conditions. To separate these two effects, the snow albedo for period II was re-calculated assuming a r opt of 50 µm (similar to r opt in period I). As a result, the increase of α by 0.01 indicates a minor effect by the snow grain size variation. For a more detailed investigation of the atmospheric impact on the broadband surface albedo, the snow albedo for period II was re-simulated using TARTES assuming only white-sky albedo (similar to the cloud conditions from period I). The new setup forced the surface broadband albedo to increase by 0.08 which emphasizes the impact of clouds. Consequently, for the discussion on the snow grain size effect on the surface albedo, the atmospheric impact must be separated. The temporal decrease of the surface albedo in Figure 5 was attributed to the cloud impact rather than to the increase of the snow grain size for the PAMARCMiP period and conditions.

4.2. Spatial Variability: Airborne and Satellite Observations

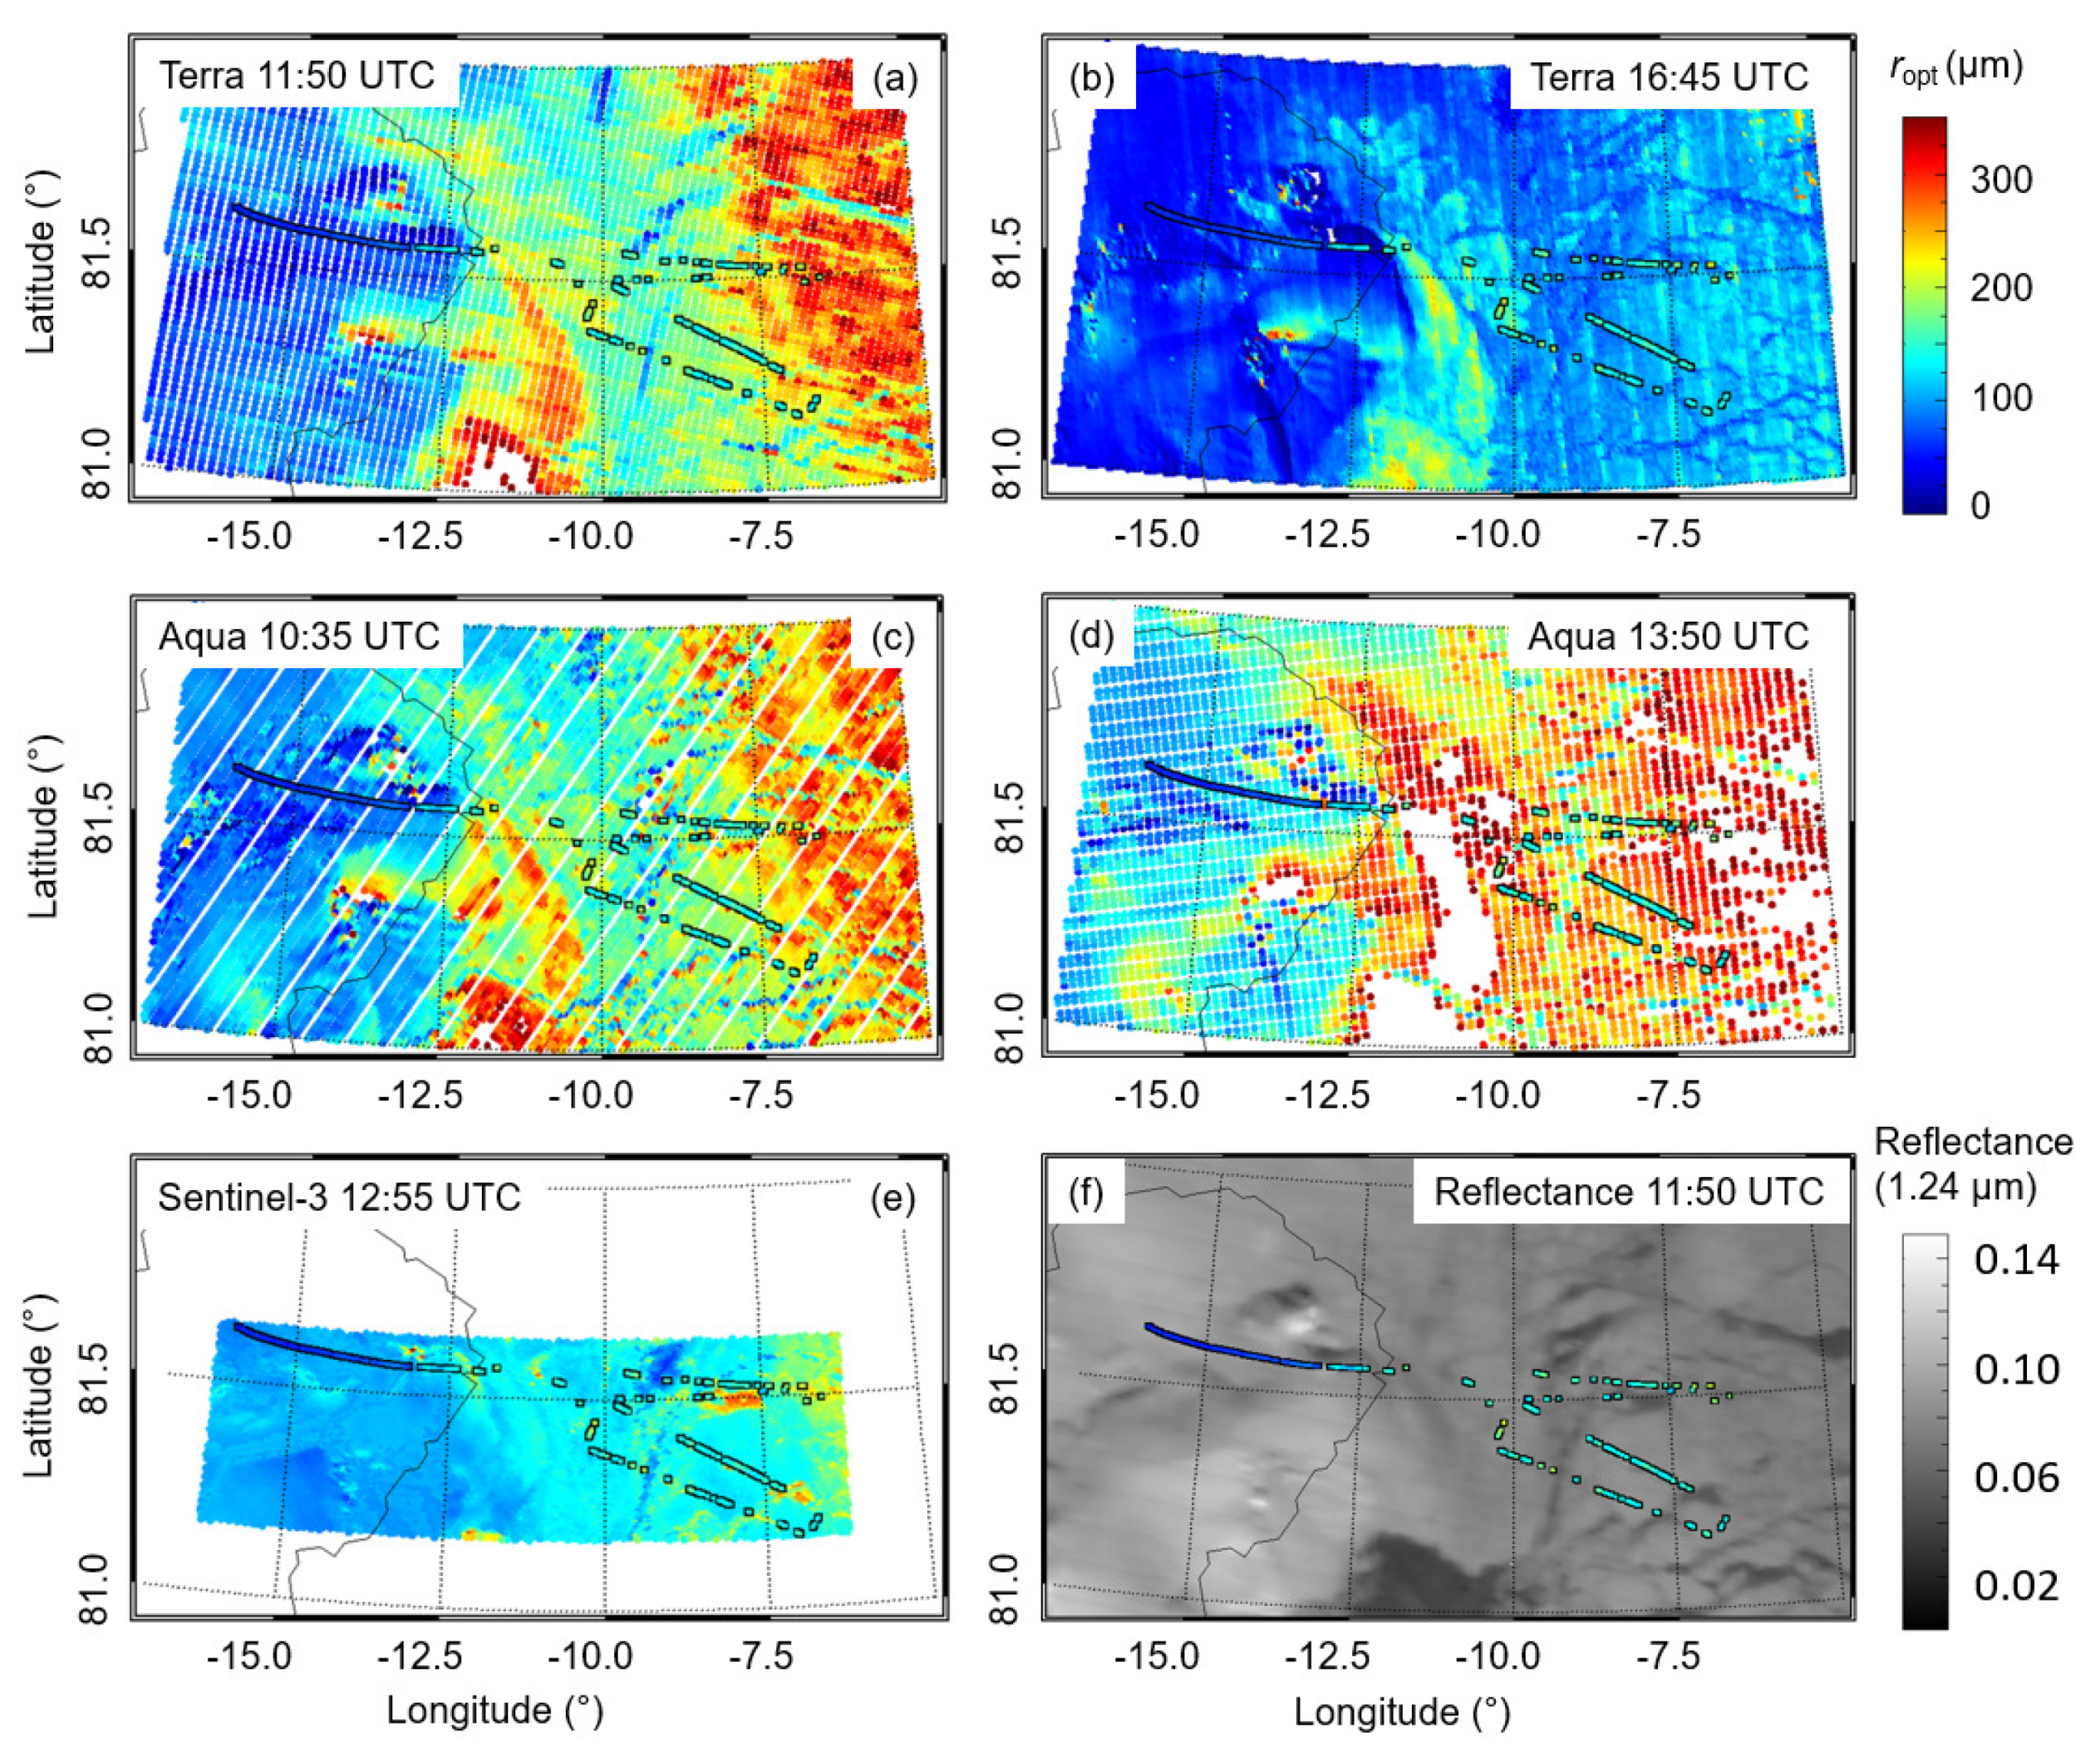
4.2.1. Retrieved Maps of Snow Grain Size

Maps of the retrieved snow grain size from the SGSP and XBAER retrieval techniques using MODIS and Sentinel-3 data, as well as the reflectance at 1.24 µm wavelength from MODIS measurements at 11:50 UTC for 25 March are shown in Figure 6. The snow grain sizes estimated from the SMART measurements along the flight track (14–17 UTC) are displayed on each of the panels. They were retrieved from the surface albedo at 1700 nm wavelength. Four MODIS overpasses were evaluated for the period and region of aircraft observations on this day. The different number of valid data points led to an irregular spatial distribution of the snow grain size in each of the four MODIS maps (Figure 6a–d).
As illustrated in Figure 6, the main spatial features of the retrieved snow grain size show similar patterns from west to east with lowest r opt -values over land, increasing r opt -values near the eastern coast of Greenland, an area of slightly decreasing r opt (near −9° longitude), and highest values in the most eastern part of the overflown area. Both satellite and airborne observations revealed less variation of the snow grain size over Greenland than over the sea ice. Over Greenland, the retrieved r opt was mostly less than 100 µm (SSA = 33 m 2 kg 1 ), while r opt over sea ice reached values of up to 300 µm (SSA = 11 m 2 kg 1 ). An exception was found for the map from the MODIS 16:45 UTC overpass, where significant lower r opt -values were retrieved over the sea ice (Figure 6b). At this time, the SZA ranged between 82.4° and 84° for the entire scene. The SZA of the other satellite overpasses were smaller between 79.1° and 81.9°. As discussed earlier, the retrieval uncertainty increases with increasing SZA, which might be one of the reasons for the apparent different spatial snow grain size pattern observed in the late afternoon overpass (Figure 6b). The spatial distribution of the reflectance at 1.24 µm wavelength (Figure 6f), which is sensitive to the snow grain size, shows an increasing surface inhomogeneity in the eastern region with the highest r opt -values. A low reflectance at this wavelength does not necessarily correspond to open water. It might also indicate young ice areas with a possible thin snow layer on top, which causes an overestimation of the derived snow grain size. For example, in the area centred at 81° latitude and −11° longitude, such low reflectances together with high r opt -values were measured, while the AMSR instrument indicates a closed sea ice cover. Furthermore, the measurements might be affected by thin low-level clouds generated above open leads, which were not completely excluded from the data analysis. Limited to the area of the Sentinel-3 overpass, the frequency distributions of r opt are shown for each overpass of MODIS and SLSTR in Figure 7. The 13:50 UTC overpass was excluded in this analysis due to the high amount of unclassified pixel, which would bias the statistics of this case. The plot of the relative frequencies (in r opt -bins of 10 µm) shows two main modes for the three MODIS-based distributions. These two modes represent the lower snow grain sizes over land and the higher numbers retrieved over sea ice. The two morning overpasses revealed similar distributions over sea ice, but some shift of the “land”-mode by 20 µm snow grain size. Corresponding to Figure 6b the relative frequency of the MODIS data from 16:45 UTC revealed the smallest distribution and the smallest r opt -values compared to the other MODIS overpasses. The XBAER retrieval shows a significant smaller variability with a narrower frequency distribution. A narrow mode with a maximum at 120 µm marks the snow grain size derived over land. Over sea ice, there are two further modes (maxima at 140 µm and 180 µm, respectively), with the third mode resulting from the highest r opt -values measured over the most eastern region (Figure 6f). There, the surface is more heterogeneous and indicates an effect of surface roughness on the retrieval results (see Section 5).

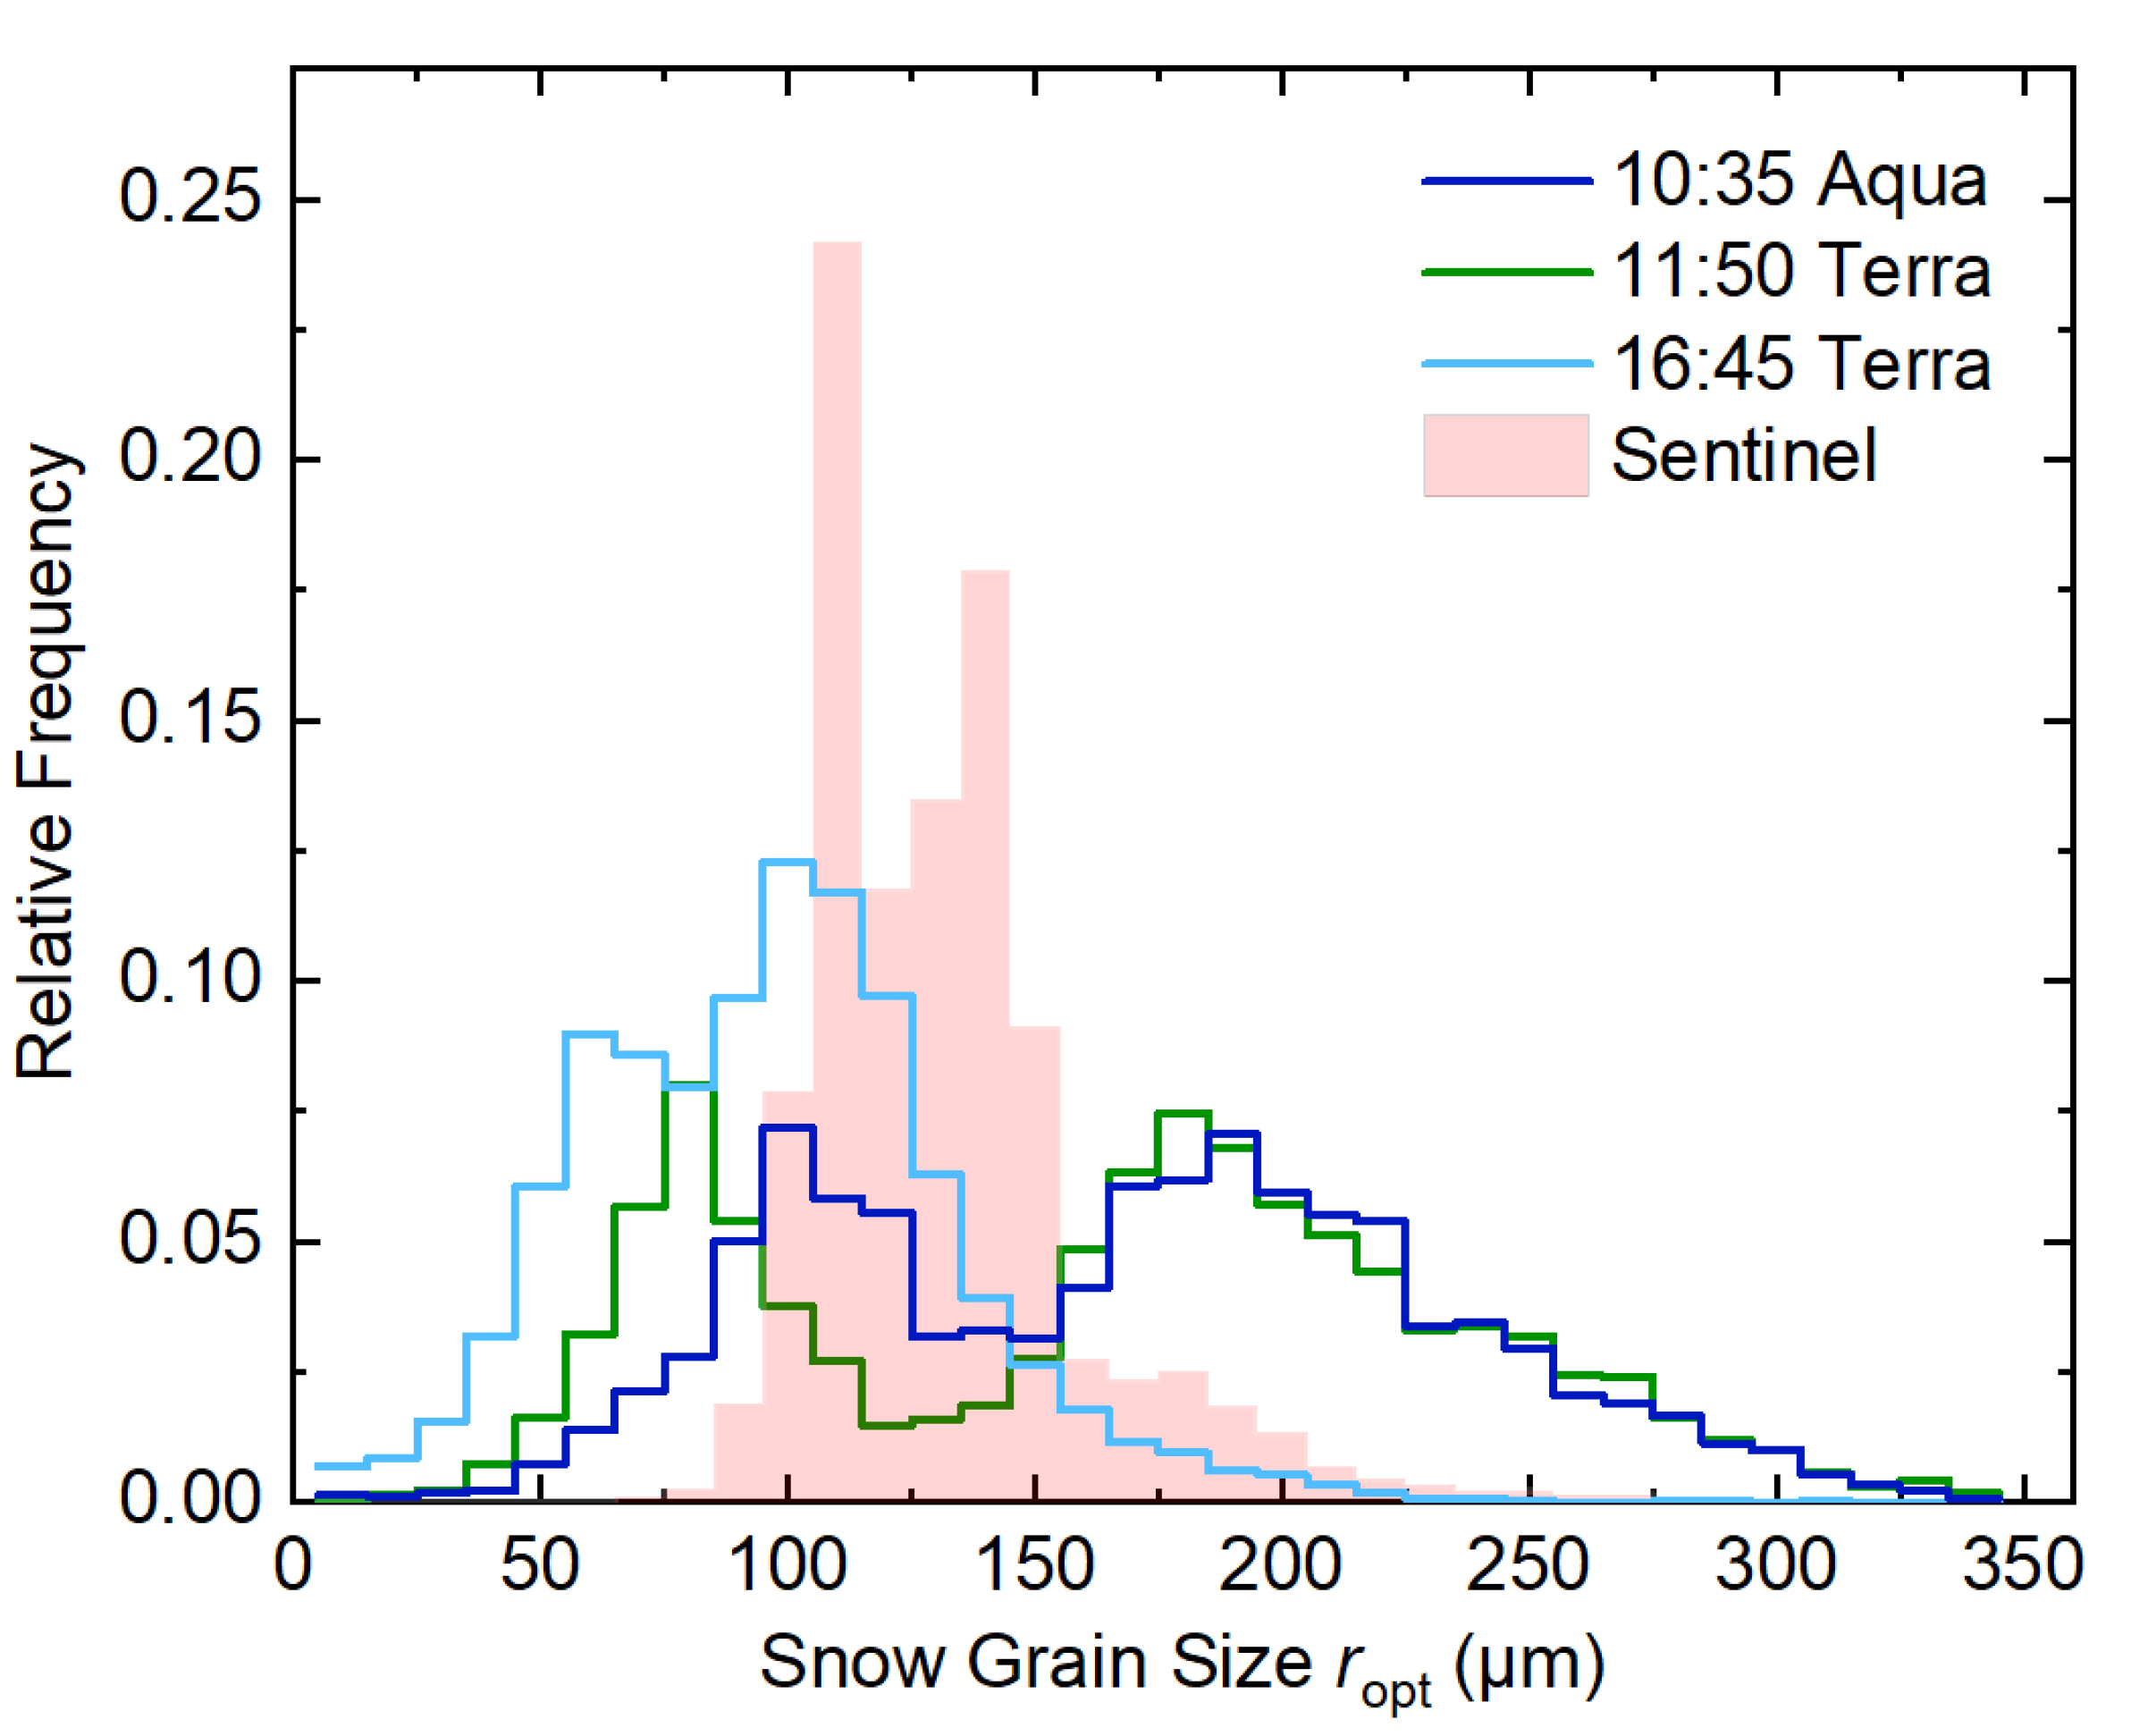
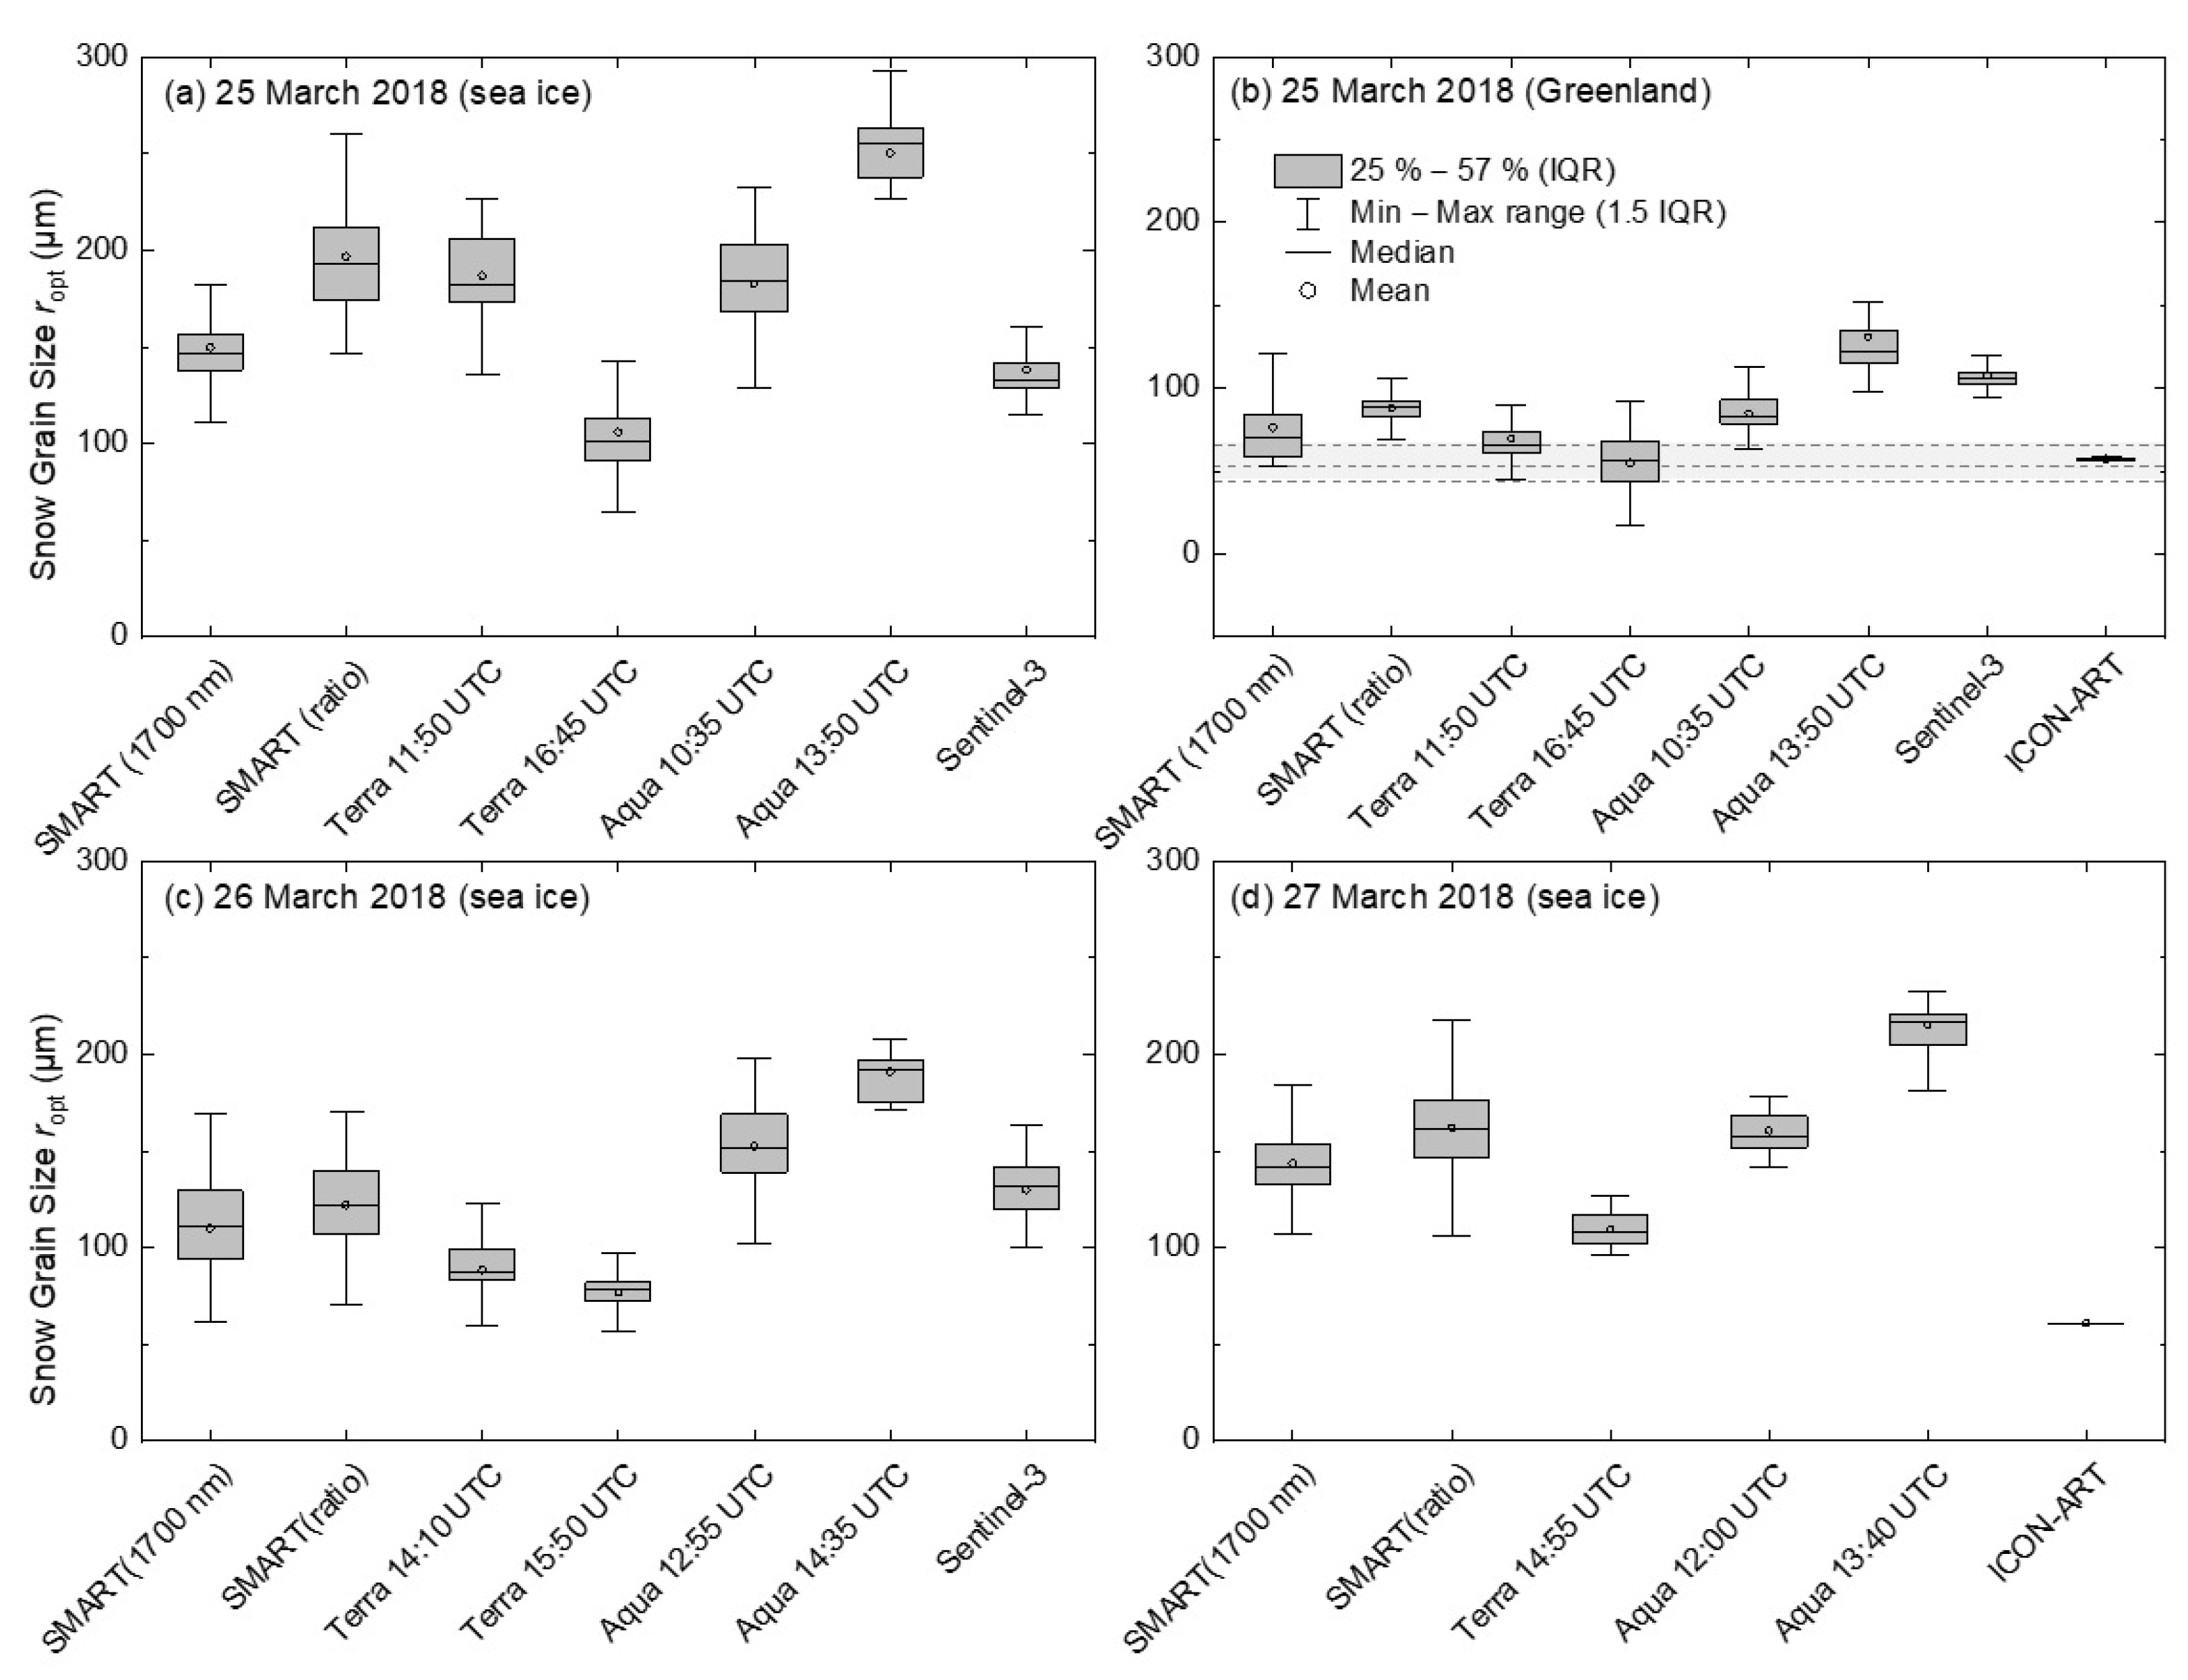
4.2.2. Statistical Comparison for Smooth Snow Surfaces

The spatial scales of typical roughness features are below the resolution of the satellite-based observations, which makes it difficult to identify sub-scale roughness features from MODIS or SLSTR data alone. Therefore, observations along the aircraft flight path were used to screen the satellite and SMART data for surface conditions. Areas with increased surface roughness, without snow, or with thin snow layers that are not optically thick, and cases, which were contaminated by low-level clouds were identified by camera observations and laser scanner data. The snow surface class was derived from manually selected red, green, and blue channel thresholds which were set from training samples as applied in Jäkel et al. [82] and Hartmann et al. [83]. Since the laser scanner did not cover the entire flight path, we used also fisheye camera images to estimate the fraction of shadowed and illuminated areas within the individual images as a marker for the roughness of the overflown surface. The ratio of the red and blue channel was calculated for each image pixel. From training images, threshold values of the ratio were defined, which characterized shadowed (ratio < 0.8) and illuminated (ratio > 1.1) pixels. The areal fractions of the shadowed and illuminated pixels ( f sh , f il ) were calculated with respect to the angular resolution of the image pixels [82]. A “smooth surface” was set for cases with f sh < 5% and f il < 5%. The spatial distribution of the remaining SMART data points in Figure 6 shows the filtering result with respect to the surface conditions. In particular, the flight section between −12.5° and 10.0° longitude was identified as a region of rough sea ice.
The statistical measures of the retrieved snow grain size are summarized in Figure 8. For the 25 March, the filtered data were separated into observation above sea ice and land. ICON-Art simulations were also available over the land region. The satellite data were matched to the flight track of the Polar 5 aircraft before the statistical mean, the median, the first and third quartile, and the minimum and maximum values without outliers were calculated. A running average of the SMART measurements was used to account for the spatial resolution of the satellite data. For 25 March (sea ice), the analysis reveals that the interquartile ranges (IQR), indicated by the gray boxes, cover different r opt -ranges, especially for the SGSP retrievals of the MODIS data from 13:50 UTC and 16:45 UTC. The applied SGSP retrieval exhibit no clear bias compared to the other methods as can be concluded from the broad range of retrieved snow grain sizes. The XBAER retrieval shows the smallest IQR, and apart from the 16:45 UTC MODIS overpass, also the lowest mean r opt . For the SMART albedo measurements, both the R -based and the α (1700 nm)-based retrieval method were applied. They revealed differences of the mean r opt -values of 47 µm between both methods for the flight over sea ice, and a 12 µm difference over land. This corresponds to differences in the SSA of about 5 m 2 kg 1 over land and sea ice.
Overall, the spread between the mean r opt -values of the different methods is significantly lower over the land surface than over the sea ice (Figure 8). Apart from the XBAER retrieval, the qualitative differences between the methods are similar for observations over land and sea ice, with lowest (highest) r opt -values for the 16:45 UTC (13:50 UTC) observations by MODIS. The best agreement to IceCube measurements were derived from the 16:45 UTC MODIS overpass where the IQR is within the measurement range of the IceCube data (Figure 8b). All other retrievals and simulations showed a positive bias compared to the in situ measurements. XBAER and the SGSP retrieval of the 13:50 UTC MODIS overpass deviate by a factor of two from the IceCube results. Possible reasons for the deviation of the XBAER results, but also of the SMART retrieval, could originate from the assumption of the snow particle shape when calculating the LUTs. Although for the SMART retrieval, a mixture of grain shapes is assumed, XBAER estimates the snow grain shape in 9 classes [37] in addition to the snow grain size. For the considered area, mostly droxtals were retrieved over the land and the coastal region, and aggregates of 8 columns over sea ice. Implications of the shape effect are further discussed in Section 5.
The snow grain size statistics for 26 and 27 March are displayed in Figure 8c,d. The region observed during both flights was further north than on 25 March (about 82.5°N), and AMSR-2 data covered sea ice with concentrations of about 100% (Figure 1). Due to the earlier flight time (12 UTC on 26 March and 13 UTC on 27 March), the SZA was in a similar range (79–82° SZA) compared to 25 March. The variability between the different r opt retrievals was found to be lower for 26 and 27 March than for the more Southern flight on 25 March. However, the mean snow grain size along the flight tracks may still vary by 100 µm (SSA variation: 25 m 2 kg 1 ) which corresponds to a bias of about 100%. The retrieval results of the MODIS instruments suggest that the snow grain size from the Terra satellite tends to be lower than the r opt -distribution derived from the Aqua satellite. Comparing the MODIS snow grain size within a 2 km radius around the Villum research station with IceCube measurements (45–72 µm, including measurement uncertainty), revealed best agreement with r opt -values from the Terra satellite (53–84 µm) on all three days. In contrast, Aqua showed r opt between 78 to 120 µm for the same period. In all three flights, the α (1700 nm)-based retrieval for SMART revealed smaller values than the R -based method. For 27 March, the ICON-ART simulations covered the entire flight track, because the model-based land mask of ICON-ART classified this near coastal region as land. Similar to the comparison over land (25 March), the model showed low variability (<1 µm standard deviation) and lowest r opt (<100 µm) compared to all other methods. Due to the rather coarse resolution of 3.3 km in this model setup, the small-scale variations present in the observations could not be resolved properly.

5. Discussion: Implications of Low-Sun Conditions

The different r opt retrieval methods from the satellite and airborne observations are all subject to uncertainties which become increasingly relevant under the low-Sun conditions in the Arctic. After addressing the uncertainties of the SGSP (Section 5.1) and SMART (Section 5.2) retrieval, we are discussing the effect of the choice of snow crystal shape (Section 5.3), and the retrieval wavelength that affect the penetration depth of radiation in the snow (Section 5.4).

5.1. Uncertainties of the SGSP Satellite Retrieval

The comparison of the different r opt retrieval results from the satellite-based optical observations show a large spread in particular over sea ice (Figure 6). The reasons behind this large spread among the SGSP retrieval results of successive overpasses are manifold. First, uncertainties introduced by the measured reflectances can contribute significantly to the retrieval bias. Wiebe et al. have shown that a combination of uncertainties in two or three MODIS channels can result in a snow grain size error of up to 36% for 100 µm grains [40]. In a model study, Zege et al. analyzed the effect of MODIS radiances uncertainties on the SGSP retrieval error. They used a random normally distributed error with the standard deviation of 2% and found a factor of two between reference and retrieved r opt for SZA = 80° [35]. Since the measurement uncertainties are affected by Sun and sensor viewing directions, which were variable between the different MODIS overpasses, we can assume that these uncertainties contribute to the observed variation of the retrieved snow grain size.
The atmospheric correction of both satellited-based retrieval methods does not account for actual atmospheric gas profiles. Instead, mean climatology data are used. As shown in Section 3, the retrieval uncertainty is dependent on the accuracy of the atmospheric correction and increasingly relevant for low-Sun conditions [35]. In contrast to XBAER, which used AOD data from MERRA, the SGSP retrieval assumes climatological-based aerosol profiles. Improper aerosol assumptions may lead to a systematic underestimation of retrieved r opt . They are small (3%) for typical background Arctic aerosol conditions (AOD 0.05), but increase to up to 37% in the case of Arctic pollution conditions for AOD 0.11 [37]. Since the AOD did not exceed 0.05 during the three days of observations, the retrieval uncertainty due to aerosol effects is small.
Although the XBAER retrieval obtains r opt and snow particle shape by an iterative optimization approach of measured and pre-calculated reflectances, the SGSP retrieval relies on the radiative transfer theory that relates surface albedo and snow grain size. From satellites, one can only observe the surface from one direction, but a hemispherically integrated value, in terms of the surface albedo, is needed to infer r opt by the SGSP retrieval. This brings forward a problem of inferring surface reflectances in all directions (BRDF) using just one directional observation, and this at three spectral channels used in SGSP. The assumption in the SGSP retrieval is that snow BRDF does not depend on wavelength. This assumption does not hold precisely, as there is a dependence on the real part of the complex refractive index between the used MODIS channels 3, 2 and 5, which proved negligible at smaller SZAs. In the cases where snow BRDF deviates significantly from Lambertian surface (i.e., at higher solar angles), the variation with wavelength becomes significant and propagates into the retrieved grain size. The difference between the higher and lower SZA in accounting for the BRDF in SGSP lies in redistribution of first and higher orders of scattering into the hemisphere with changing wavelength. Therefore, the varying real part of the complex refractive index cannot be considered to be merely a multiplication factor which would be easy to account for.
The larger variability of the retrieved snow grain size distributions among the satellite observations that is shown in Figure 7 is additionally caused by differential macroscopic surface roughness effects on the directional reflectance and surface albedo. Compared to plane surfaces, the directional reflectance is reduced in the forward reflectance peak and enhanced in the backward reflectance [84]. The shading effect in the forward direction is more effective than the reflection to the backward direction that leads to a decrease of the hemispherically integrated albedo [42]. However, the satellite-based retrieval methods rely on a compact and plane snowpack, such that roughness effects mainly observed on the sea ice, lead to an increase of the r opt retrieval uncertainty, which is more pronounced for high SZAs. Larue et al. [18] have shown that the surface reflection is sensitive to the fraction and orientation of the roughness features. It can be assumed that the fraction of these features did not significantly change between the different satellite overpasses. However, the relation between orientation of roughness feature, Sun and sensor viewing direction deviates among the satellite observations, such that shading effects by roughness features differently impact the directional reflectance observed by the satellite sensor.

5.2. SMART Measurement Uncertainty and Retrieval Sensitivity

In contrast to the SGSP retrieval, the SMART retrieval algorithm directly applies for the albedo—snow grain size relationship that is derived from the asymptotic radiative transfer theory [41]. Since the albedo represents a hemispherically integrated measure, it is less dependent on alterations of the directional reflection. That includes directional effects by surface roughness on a macroscopic scale, but also the impact of the scattering phase function representing the assumed grain shape on a microscopic scale. Both use of the albedo instead of the directional reflectance for the retrieval and application of the atmospheric correction based on directly measured variables reduce the retrieval uncertainties along with low-Sun conditions compared to satellite-based products.
Two wavelength-dependent approaches were tested which show generally lower r opt values for the α (1700 nm)-based than for the R -based retrieval (Figure 8). The retrieval accuracy is affected by the uncertainty of the surface albedo or the albedo ratio. The total uncertainty of the surface albedo retrieved from the airborne observations is estimated to be about 7.1%. Using the albedo ratio R , the uncertainty reduces to 5.8% as the transition to relative measurements provides independence from the absolute calibration.
To estimate the contribution of the SMART measurement uncertainty on the accuracy of the r opt retrieval we applied combined TARTES and libRadtran simulations to relate snow grain size and surface albedo, exemplary for a SZA of 80°. The simulated surface albedo and the albedo ratio R were biased by the corresponding measurement uncertainties of SMART ( ± Δ α ). Finally, the snow grain size was retrieved from the biased surface albedo and R using the predefined LUTs. Figure 9a shows the true (input) snow grain size as well as the retrieved grain size for both directions of the albedo bias ( ± Δ α ). The retrieved r opt based on the albedo ratio R reveals a larger deviation from the 1:1 line compared to the retrieval results using α (1700 nm), even though the assumed bias of R (5.8%) is smaller than the bias of α (7.1%). As illustrated in Figure 3, the decrease of the surface albedo at 1700 nm wavelength with increasing r opt is steeper than the decrease of R . Therefore, the effect of the measurement uncertainty is higher for the R -based retrieval. For the studied configuration, this may lead to absolute deviations between true r opt and retrieved r opt which are about three to five times higher than using α (1700 nm) (Figure 9a). The relative deviation (Figure 9b) clearly demonstrates the dependence of snow grain size and measurement uncertainty. For small grain sizes, as those of fresh fallen snow, the retrieved snow grain size could be overestimated by about 100% when applying the R -based retrieval, while the α (1700 nm)-based retrieval would lead to uncertainties of less than 25% for all considered grain sizes.

5.3. Effect of Snow Particle Shape

The snow particle shape directly affects the single-scattering properties in terms of differences in the scattering phase function. The MODIS and SMART-based retrievals of the snow grain size were performed for a mixture of particle shapes using similar settings. In contrast, XBAER retrieves the particle shape simultaneously to the snow grain size. The use of an inappropriate ice crystal shape in XBAER may lead to an error between less 10% to more than 50% in the retrieval of grain size, depending on the particle shape and the grain size value itself [37]. An independent ground-based measurement data set of snow grain shape would certainly be helpful to understand the similarity and diversity between different retrievals. However, these data were not available for PAMARCMiP.
Therefore, the sensitivity of the retrieval methods to the assumed snow particle shape was quantified for the PAMARCMiP specific conditions with a SZA of 80° on basis of TARTES simulations. In TARTES snow albedo was calculated for different shapes such as cylinders, spheroids, cuboids, hexagonal plates with variable aspect ratios (height to the length), and fractals for r opt up to 200 µm. The simulated spectral snow albedo served as input for the snow grain size retrieval which was applied for each shape-specific TARTES simulation. The ratio of the retrieved snow grain size (using the α (1700 nm)-based and the R -based retrieval) and the reference snow grain size (mixed shape) of the TARTES simulations is shown in Figure 10a.
Altogether, for the PAMARCMiP specific conditions, the effect of the unknown snow grain particle shape may lead to uncertainties in the range of ±35% in extreme cases when using LUTs based on calculations for a mixed shape particle type which is higher than reported by Picard et al. [27] with uncertainties of ±20%. The tendency of the deviation strongly correlates with the form factor A. Keeping the surface albedo constant, when absorption is enhanced due to the increase of the form factor A, requires a decrease of the snow grain size to compensate the absorption effect. Furthermore, we can conclude from Figure 10a that there is no clear particle type (e.g., cylinder, spheroid) specific tendency of the snow grain size deviation. Rather, the particle aspect ratio may determine the tendency and magnitude of the snow grain size deviation in the same order than the particle type itself. For example, for hexagonal plates the lowest aspect ratio gave a smaller retrieved snow grain size than the mixed shape approach, while for larger aspect ratios the opposite relation was observed, which clearly is driven by the dependence of the asymmetry parameter g on the particle aspect ratio (see Figure 7 in [26]).
It was found that in general, the relative biases between the α (1700 nm)-based and R -based retrieval methods are almost similar for small and large snow grain sizes. The α (1700 nm)-based retrieval shows only a variability of 4% within the studied range of r opt , while for the R -based retrieval this spread is 2%, as illustrated by the standard deviations of r opt in Figure 10a. Both retrieval approaches show similar results for all shapes, with the R -based retrieval being only slightly higher than the α (1700 nm)-based method. The assumption on the grain shape has a much more critical impact on the retrieval. However, for most retrievals no a priori knowledge of the snow shape is available, and the shape mixture is still the best choice. Therefore, the retrieved r opt should be interpreted also as a shape-equivalent grain size representing the snow albedo that can be calculated assuming a shape mixture. In particular, for satellite-based retrievals, a shape mixture might be the best choice, since the observations cover a large footprint (several hundreds of meters) with natural variability of snow grain shape.
Based on the two extreme snow shapes (hexagonal plates with an aspect ratio of 2 and cylinders with an aspect ratio of 0.25), the retrieval algorithm was adapted to either of both by adjusting the form factor A. These modified retrievals were applied to the case of 25 March 2018 separating observations over land and sea ice. The statistics of the retrieved r opt are given in Figure 10b. Absolute mean differences of about 87 µm ( α (1700 nm)-based retrieval) and 115 µm ( R -based retrieval) over sea ice were derived, while over Greenland the mean differences decreased to 50 µm and 62 µm, respectively. This promotes the usage of the α (1700 nm)-based retrieval for cloudless conditions, because of its lower sensitivity to the snow grain shape than the R -based retrieval.

5.4. Wavelength Choice and Penetration Depth

Using different retrieval wavelengths might result in different r opt estimates, because the penetration depth of the radiation in the snow depends on the wavelength and therefore weights the vertical structure of the snowpack differently. This becomes crucial if the snow layers are stratified, such that a vertical difference in the snow grain size can impose systematic differences in the retrieval. According to the Beer-Lambert law, the radiation decreases exponentially with penetration. The distance in the snowpack where the incident irradiance has decayed to 1/e∼37% of its value is the e-folding depth ( z e ). It is used as a measure to quantify, for which layer the retrieved snow grain sizes are representative. For snow, the e-folding depth is calculated by:
z e = 3 · ρ snow ρ ice · 2 π · χ ( λ ) λ · r opt · B · ( 1 g ) 1 ,
following Zege et al. [85], with ρ snow and ρ ice representing the densities of ice and snow. The penetration depth increases with decreasing wavelength and snow density, as well as with increasing snow grain size.
The two non-absorbing retrieval wavelengths of the SGSP and XBAER algorithm (469 nm and 550 nm) are not sensitive to r opt . They are primarily used to derive the soot concentration (SGSP retrieval) and the snow particle shape (XBAER retrieval), respectively. For the other retrieval wavelength (858–1700 nm) the e-folding depth was calculated for snow densities between 200 kg m 3 and 300 kg m 3 (derived from ground-based snow measurements during PAMARCMiP) and snow grain sizes between 60 µm and 180 µm. For these conditions, the SGSP retrieval refers to snow layers of up to 3 cm depth, while the XBAER and SMART retrieval consider snow layers of less than 1 cm depth. Snow pit measurements of the snow grain size and the snow density in the vicinity of the Villum research station have shown only a low variability (less than 5 µm difference) within the first 10 cm of the snowpack, such that the choice of retrieval wavelength to derive r opt is of minor importance here.

6. Summary and Conclusions

This study compares snow grain size estimates from different observational methods and models under low-Sun conditions. The analysis is based on airborne and ground-based observations during the PAMARCMiP 2018 campaign hold in the vicinity of the Villum research station, North Greenland, in early spring 2018. The applied methods to retrieve r opt are in general all based on optical measurements making use of the grain size dependent absorption of solar radiation by snow, but in detail depend on the specific instrument, which cover ground-based in situ (IceCube), airborne (SMART) and satellite observation (MODIS on Aqua and Terra, SLSTR on Sentinel-3). The different retrieval methods rely on the asymptotic radiative transfer theory [41] applied on airborne albedo and MODIS reflectance measurements (SGSP retrieval) [35], as well as a minimizing approach of measured SLSTR and pre-calculated reflectances for variable grain sizes and shapes (XBAER retrieval).
The snow grain size retrieval of the airborne SMART instrument accounts for the direct-to-global fraction of the solar radiation incident on the snow by coupling an atmospheric and a snow radiative transfer model. The retrieval was applied for two wavelength settings, (i) an albedo ratio method, and (ii) a new single-wavelength approach using the albedo at 1700 nm wavelength. The reduction of the retrieval uncertainty promotes the usage of this single-wavelength retrieval approach in combination with the coupled atmosphere and snow model.
Moreover, the locally measured r opt evolution was compared to r opt simulations from the ICON-ART model and a parametrization proposed by Flanner and Zender [44]. To our knowledge, these different methods have not been compared at high latitudes (low-Sun conditions) before. In particular, the retrievals using albedo and reflectance measurements are subject to significant uncertainties due to the large SZA of about 80° as present during the PAMARACMiP campaign. However, conditions with low Sun are common in early spring in the central Arctic. Therefore, this comparison of different approaches demonstrates the consequences of retrieval uncertainties for evaluating the snow evolution.
Local in situ measurements over the three-week period of the PAMARCMiP campaign revealed a minor increase of r opt compared to previous measurements on the Antarctic Plateau [30] under a similar temperature regime. The r opt evolution modeled by ICON-ART showed good performance for the time frame of snowfall events. In the cloudless period of the campaign, in contrast to the IceCube in situ data, the modeled r opt doubled its value within five days. Adjusting the growth rate factor to 0.012 µm 2 s 1 led to the best agreement with the in situ data. Additionally, the parametrization after Flanner and Zender [44] showed a significant overestimation of the r opt evolution when assuming a vertical temperature gradient close to the measured gradient of about 0.4 K cm 1 . This indicates certain weaknesses caused by the limited derivation of the best-fit-parameters κ and τ , or the poor representation of the curvature growth for these low temperatures (T < −28 °C).
Three days of cloudless conditions were selected to compare ground-based, aircraft and satellite observations of r opt . Measurement flights over the Fram Strait performed on 25 March 2018, indicated higher and more variable r opt -values over the sea ice ( r opt < 300 µm) than over land ( r opt < 100 µm), which was also deduced from the two satellite-based retrievals, XBAER (SLSTR on Sentinel) and SGSP (MODIS on Aqua and Terra). The statistical analysis of the filtered satellite data covering the flight path of the Polar 5 aircraft over smooth snow surfaces showed mean r opt differences up to 100 µm between the successive overpasses. For land surface measurements near the Villum research station, snow grain size from the Terra satellite ( r opt : 53–84 µm) showed a better agreement to the ground-based IceCube data set ( r opt : 45–72 µm) than the Aqua product ( r opt : 78–120 µm). The difference between XBAER and SGSP snow grain size is larger compared to the difference between SGSP and SMART retrieval, probably due to the assumption of the ice crystal shape. Both SMART retrieval approaches deviated by up to 40% from each other, but ranged between the MODIS derived extremes with better agreement of the α (1700 nm)-based retrieval with the IceCube measurements.
Filtering of the data with respect to smooth sea ice surface conditions did not necessarily improve the comparison between the different retrievals and observations. Measurement uncertainties at low-Sun conditions and the fact that successive satellite overpasses are taken under different Sun and observation geometries, make an additional contribution to the large spread of satellite results. This shows their limitations in studying the day-to-day evolution of the snow grain size under low-Sun conditions in particular over sea ice. As shown here for one case of PAMARCMiP, the differences of retrieved r opt between two overpasses exceeds the typical evolution of snow grain size by snow metamorphism.
Potential retrieval uncertainties based on the airborne SMART observations were analyzed. The findings of this analysis may serve as recommendations also for satellite-based applications. We propose (i) to apply an atmospheric correction, (ii) to calculate LUTs of the blue-sky albedo, instead of assuming a black-sky albedo, (iii) to consider roughness features and their spatial proportion by collocated laser scanner and/or imaging methods covering a similar FOV, (iv) to make use of suitable wavelengths in the SWIR to use the strongest sensitivity on r opt and lower dependence on atmospheric extinction, and (v) to use a form factor representing a mixed-type of grain shapes.

Author Contributions

All authors contributed to the editing of the manuscript and to the discussion of the results. E.J. and M.W. designed this study. E.J. drafted the manuscript, performed the radiative transfer simulations, and prepared the figures. A.E. and A.H. were leading the PAMARCMiP campaign. G.B., T.C. and L.M. contributed to the interpretation of the retrieval data. G.B. and M.Z. processed the IceCube data. L.I. and L.M. compiled the satellite retrievals. A.R. run the ICON-ART simulations. V.H. provided the laser scanner data, and M.S. was responsible for the instrumental preparation of SMART. K.N. helped to define the atmospheric conditions, and S.R. worked on the atmospheric correction. A.H. processed the Sun photometer data. All authors have read and agreed to the published version of the manuscript.

Funding

This research was funded by the Deutsche Forschungsgemeinschaft (DFG, German Research Foundation)—project ID 268020496—TRR 172, within the Transregional Collaborative Research Center “ArctiC Amplification: Climate Relevant Atmospheric and SurfaCe Processes, and Feedback Mechanisms (AC)3”. This work was further supported by the European Research Council (ERC) through Grant StG758005 and by the DFG—project ID 424326801—SPP1158.

Data Availability Statement

The airborne measurement data are published on PANGAEA under https://doi.org/10.1594/PANGAEA.932527.

Acknowledgments

We thank Franziska Nehring from FIELAX GmbH for post-processing the meteorological aircraft data and the Institute of Environmental Physics, University of Bremen for the provision of the merged MODIS-AMSR2 sea ice concentration data at https://seaice.uni-bremen.de/data/modis_amsr2 (last access 25 September 2018). Thanks to the IMAPP (International MODIS/AIRS Processing Package) team at SSEC (Space Science and Engineering Center, University of Wisconsin-Madison) for providing the MODIS destriping routine. Development of IMAPP is supported by NASA under grant NNX14AK06G.

Conflicts of Interest

The authors declare no conflict of interest.

References

  1. Serreze, M.C.; Barry, R.G. Processes and impacts of Arctic amplification: A research synthesis. Glob. Planet. Chang. 2011, 77, 85–96. [Google Scholar] [CrossRef]
  2. Cohen, J.; Screen, J.A.; Furtado, J.C.; Barlow, M.; Whittleston, D.; Coumou, D.; Francis, J.; Dethloff, K.; Entekhabi, D.; Overland, J.; et al. Recent Arctic amplification and extreme mid-latitude weather. Nat. Geosci. 2014, 7, 627–637. [Google Scholar] [CrossRef] [Green Version]
  3. Wendisch, M.; Macke, A.; Ehrlich, A.; Lüpkes, C.; Mech, M.; Chechin, D.; Dethloff, K.; Velasco, C.B.; Bozem, H.; Brückner, M.; et al. The Arctic Cloud Puzzle: Using ACLOUD/PASCAL Multiplatform Observations to Unravel the Role of Clouds and Aerosol Particles in Arctic Amplification. Bull. Am. Meteorol. Soc. 2019, 100, 841–871. [Google Scholar] [CrossRef]
  4. Pithan, F.; Mauritsen, T. Arctic amplification dominated by temperature feedbacks in contemporary climate models. Nature 2014, 7, 181–184. [Google Scholar] [CrossRef]
  5. Qu, X.; Hall, A. On the persistent spread in snow-albedo feedback. Clim. Dyn. 2014, 42, 69–81. [Google Scholar] [CrossRef]
  6. Fletcher, C.G.; Thackeray, C.W.; Burgers, T.M. Evaluating biases in simulated snow albedo feedback in two generations of climate models. J. Geophys. Res. 2015, 120, 12–26. [Google Scholar] [CrossRef]
  7. Goosse, H.; Kay, J.E.; Armour, K.C.; Bodas-Salcedo, A.; Chepfer, H.; Docquier, D.; Jonko, A.; Kushner, P.J.; Lecomte, O.; Massonnet, F.; et al. Quantifying climate feedbacks in polar regions. Nat. Commun. 2018, 9, 1919. [Google Scholar] [CrossRef] [PubMed]
  8. Block, K.; Schneider, F.A.; Mülmenstädt, J.; Salzmann, M.; Quaas, J. Climate models disagree on the sign of total radiative feedback in the Arctic. Tellus A Dyn. Meteorol. Oceanogr. 2020, 72, 1–14. [Google Scholar] [CrossRef] [Green Version]
  9. Taylor, K.E.; Stouffer, R.J.; Meehl, G.A. An Overview of CMIP5 and the Experiment Design. Bull. Am. Meteorol. Soc. 2012, 93, 485–498. [Google Scholar] [CrossRef] [Green Version]
  10. Choudhury, B.J.; Chang, A.T.C. The albedo of snow for partially cloudy skies. Bound.-Layer Meteor. 1981, 20, 371–389. [Google Scholar] [CrossRef]
  11. Warren, S. Optical Properties of Snow. Rev. Geophys. Space Phys. 1982, 20, 67–89. [Google Scholar] [CrossRef]
  12. Warren, S.; Brandt, R.; O’Rawe Hinton, P. Effect of surface roughness on bidirectional reflectance of Antarctic snow. J. Geophys. Res. 1998, 103, 25789–25807. [Google Scholar] [CrossRef]
  13. Dumont, M.; Brissaud, O.; Picard, G.; Schmitt, B.; Gallet, J.C.; Arnaud, Y. High-accuracy measurements of snow Bidirectional Reflectance Distribution Function at visible and NIR wavelengths—Comparison with modelling results. Atmos. Chem. Phys. 2010, 10, 2507–2520. [Google Scholar] [CrossRef] [Green Version]
  14. Gardner, A.S.; Sharp, M.J. A review of snow and ice albedo and the development of a new physically based broadband albedo parameterization. J. Geophys. Res. Earth Surf. 2010, 115, 1–15. [Google Scholar] [CrossRef]
  15. Pirazzini, R.; Raisanen, P.; Vihma, T.; Johansson, M.; Tastula, E.M. Measurements and modelling of snow particle size and shortwave infrared albedo over a melting Antarctic ice sheet. Cryosphere 2015, 9, 2357–2381. [Google Scholar] [CrossRef] [Green Version]
  16. Saito, M.; Yang, P.; Loeb, N.G.; Kato, S. A Novel Parameterization of Snow Albedo Based on a Two-Layer Snow Model with a Mixture of Grain Habits. J. Atmos. Sci. 2019, 76, 1419–1436. [Google Scholar] [CrossRef]
  17. Tanikawa, T.; Kuchiki, K.; Aoki, T.; Ishimoto, H.; Hachikubo, A.; Niwano, M.; Hosaka, M.; Matoba, S.; Kodama, Y.; Iwata, Y.; et al. Effects of Snow Grain Shape and Mixing State of Snow Impurity on Retrieval of Snow Physical Parameters From Ground-Based Optical Instrument. J. Geophys. Res. Atmos. 2020, 125, e2019JD031858. [Google Scholar] [CrossRef]
  18. Larue, F.; Picard, G.; Arnaud, L.; Ollivier, I.; Delcourt, C.; Lamare, M.; Tuzet, F.; Revuelto, J.; Dumont, M. Snow albedo sensitivity to macroscopic surface roughness using a new ray-tracing model. Cryosphere 2020, 14, 1651–1672. [Google Scholar] [CrossRef]
  19. Donth, T.; Jäkel, E.; Ehrlich, A.; Heinold, B.; Schacht, J.; Herber, A.; Zanatta, M.; Wendisch, M. Combining atmospheric and snow radiative transfer models to assess the solar radiative effects of black carbon in the Arctic. Atmos. Chem. Phys. 2020, 20, 8139–8156. [Google Scholar] [CrossRef]
  20. Colbeck, S.C. Theory of metamorphism of dry snow. J. Geophys. Res. Ocean. 1983, 88, 5475–5482. [Google Scholar] [CrossRef]
  21. Gubler, H. Model for dry snow metamorphism by interparticle vapor flux. J. Geophys. Res. Atmos. 1985, 90, 8081–8092. [Google Scholar] [CrossRef]
  22. Taillandier, A.S.; Domine, F.; Simpson, W.R.; Sturm, M.; Douglas, T.A. Rate of decrease of the specific surface area of dry snow: Isothermal and temperature gradient conditions. J. Geophys. Res. Earth Surf. 2007, 112, F3. [Google Scholar] [CrossRef] [Green Version]
  23. Kaempfer, T.U.; Schneebeli, M. Observation of isothermal metamorphism of new snow and interpretation as a sintering process. J. Geophys. Res. Atmos. 2007, 112, 24101. [Google Scholar] [CrossRef]
  24. Kikuchi, K.; Kameda, T.; Higuchi, K.; Yamashita, A. A global classification of snow crystals, ice crystals, and solid precipitation based on observations from middle latitudes to polar regions. Atmos. Res. 2013, 132, 460–472. [Google Scholar] [CrossRef]
  25. Grenfell, T.C.; Warren, S.G. Representation of a nonspherical ice particle by a collection of independent spheres for scattering and absorption of radiation. J. Geophys. Res. 1999, 104, 31697–31709. [Google Scholar] [CrossRef]
  26. Neshyba, S.P.; Grenfell, T.C.; Warren, S.G. Representation of a nonspherical ice particle by a collection of independent spheres for scattering and absorption of radiation: 2. Hexagonal columns and plates. J. Geophys. Res. 2003, 108, 4448. [Google Scholar] [CrossRef]
  27. Fily, G.P.L.A.F.D.M. Determining snow specific surface area from near-infrared reflectance measurements: Numerical study of the influence of grain shape. Cold Reg. Sci. Technol. 2009, 56, 10–17. [Google Scholar] [CrossRef]
  28. Libois, Q.; Picard, G.; Arnaud, L.; Dumont, M.; Lafaysse, M.; Morin, S.; Lefebvre, E. Summertime evolution of snow specific surface area close to the surface on the Antarctic Plateau. Cryosphere 2015, 9, 2383–2398. [Google Scholar] [CrossRef] [Green Version]
  29. Picard, G.; Libois, Q.; Arnaud, L.; Verin, G.; Dumont, M. Development and calibration of an automatic spectral albedometer to estimate near-surface snow SSA time series. Cryosphere 2016, 10, 1297–1316. [Google Scholar] [CrossRef] [Green Version]
  30. Carlsen, T.; Birnbaum, G.; Ehrlich, A.; Freitag, J.; Heygster, G.; Istomina, L.; Kipfstuhl, S.; Orsi, A.; Schäfer, M.; Wendisch, M. Comparison of different methods to retrieve optical-equivalent snow grain size in central Antarctica. Cryosphere 2017, 11, 2727–2741. [Google Scholar] [CrossRef] [Green Version]
  31. Dumont, M.; Arnaud, L.; Picard, G.; Libois, Q.; Lejeune, Y.; Nabat, P.; Voisin, D.; Morin, S. In situ continuous visible and near-infrared spectroscopy of an alpine snowpack. Cryosphere 2017, 11, 1091–1110. [Google Scholar] [CrossRef] [Green Version]
  32. Jin, Z.; Charlock, T.P.; Yang, P.; Xie, Y.; Miller, W. Snow optical properties for different particle shapes with application to snow grain size retrieval and MODIS/CERES radiance comparison over Antarctica. Remote Sens. Environ. 2008, 112, 3563–3581. [Google Scholar] [CrossRef]
  33. Lyapustin, A.; Tedesco, M.; Wang, Y.; Aoki, T.; Hori, M.; Kokhanovsky, A. Retrieval of snow grain size over Greenland from MODIS. Remote Sens. Environ. 2009, 113, 1976–1987. [Google Scholar] [CrossRef]
  34. Retrieval of subpixel snow covered area, grain size, and albedo from MODIS. Remote Sens. Environ. 2009, 113, 868–879. [CrossRef] [Green Version]
  35. Zege, E.P.; Katsev, I.L.; Malinka, A.V.; Prikhach, A.S.; Heygster, G.; Wiebe, H. Algorithm for retrieval of the effective snow grain size and pollution amount from satellite measurements. Remote Sens. Environ. 2011, 115, 2674–2685. [Google Scholar] [CrossRef]
  36. Kokhanovsky, A.; Lamare, M.; Danne, O.; Brockmann, C.; Dumont, M.; Picard, G.; Arnaud, L.; Favier, V.; Jourdain, B.; Le Meur, E.; et al. Retrieval of Snow Properties from the Sentinel-3 Ocean and Land Colour Instrument. Remote Sens. 2019, 11, 2280. [Google Scholar] [CrossRef] [Green Version]
  37. Mei, L.; Rozanov, V.; Pohl, C.; Vountas, M.; Burrows, J.P. The retrieval of snow properties from SLSTR Sentinel-3—Part 1: Method description and sensitivity study. Cryosphere 2021, 15, 2757–2780. [Google Scholar] [CrossRef]
  38. Gallet, J.C.; Domine, F.; Zender, C.S.; Picard, G. Measurement of the specific surface area of snow using infrared reflectance in an integrating sphere at 1310 and 1550 nm. Cryosphere 2009, 3, 167–182. [Google Scholar] [CrossRef] [Green Version]
  39. Mei, L.; Rozanov, V.; Jäkel, E.; Cheng, X.; Vountas, M.; Burrows, J.P. The retrieval of snow properties from SLSTR Sentinel-3—Part 2: Results and validation. Cryosphere 2021, 15, 2781–2802. [Google Scholar] [CrossRef]
  40. Wiebe, H.; Heygster, G.; Zege, E.; Aoki, T.; Hori, M. Snow grain size retrieval SGSP from optical satellite data: Validation with ground measurements and detection of snow fall events. Remote Sens. Environ. 2013, 128, 11–20. [Google Scholar] [CrossRef]
  41. Kokhanovsky, A.A.; Zege, E.P. Scattering optics of snow. Appl. Opt. 2004, 43, 1589–1602. [Google Scholar] [CrossRef]
  42. Kuchiki, K.; Aoki, T.; Niwano, M.; Motoyoshi, H.; Iwabuchi, H. Effect of sastrugi on snow bidirectional reflectance and its application to MODIS data. J. Geophys. Res. Atmos. 2011, 116, D18110. [Google Scholar] [CrossRef] [Green Version]
  43. Libois, Q.; Picard, G.; France, J.L.; Arnaud, L.; Dumont, M.; Carmagnola, C.M.; King, M.D. Influence of grain shape on light penetration in snow. Cryosphere 2013, 7, 1803–1818. [Google Scholar] [CrossRef] [Green Version]
  44. Flanner, M.G.; Zender, C.S. Linking snowpack microphysics and albedo evolution. J. Geophys. Res. 2006, 111, D12208. [Google Scholar] [CrossRef] [Green Version]
  45. Herber, A.B.; Haas, C.; Stone, R.S.; Bottenheim, J.W.; Liu, P.; Li, S.M.; Staebler, R.M.; Strapp, J.W.; Dethloff, K. Regular airborne surveys of Arctic sea ice and atmosphere. Eos Trans. Am. Geophys. Union 2012, 93, 41–42. [Google Scholar] [CrossRef]
  46. Wesche, C.; Steinhage, D.; Nixdorf, U. Polar aircraft Polar5 and Polar6 operated by the Alfred Wegener Institute. J. Large-Scale Res. Facil. 2016, 2, A87. [Google Scholar] [CrossRef] [Green Version]
  47. Nakoudi, K.; Ritter, C.; Böckmann, C.; Kunkel, D.; Eppers, O.; Rozanov, V.; Mei, L.; Pefanis, V.; Jäkel, E.; Herber, A.; et al. Does the Intra-Arctic Modification of Long-Range Transported Aerosol Affect the Local Radiative Budget? (A Case Study). Remote Sens. 2020, 12, 2112. [Google Scholar] [CrossRef]
  48. Wendisch, M.; Heintzenberg, J.; Bussemer, M. Measurement-based aerosol forcing calculations: The influence of model complexity. Meteor. Z. 2001, 10, 45–60. [Google Scholar] [CrossRef]
  49. Carlsen, T.; Birnbaum, G.; Ehrlich, A.; Helm, V.; Jäkel, E.; Schäfer, M.; Wendisch, M. Parameterizing anisotropic reflectance of snow surfaces from airborne digital camera observations in Antarctica. Cryosphere 2020, 14, 3959–3978. [Google Scholar] [CrossRef]
  50. Ikonen, I.; Demetriades, N.W.S.; Holle, R. Vaisala dropsondes: History, status, and applications. In Proceedings of the 29th Conference on Hurricanes and Tropical Meteorology, SPONSOR, Tucson, AZ, USA, 10–14 May 2010. [Google Scholar]
  51. Herber, A.; Thomason, L.W.; Gernandt, H.; Leiterer, U.; Nagel, D.; Schulz, K.H.; Kaptur, J.; Albrecht, T.; Notholt, J. Continuous day and night aerosol optical depth observations in the Arctic between 1991 and 1999. J. Geophys. Res. 2002, 107, AAC 6-1–AAC 6-13. [Google Scholar] [CrossRef]
  52. Stachlewska, I.S.; Neuber, R.; Lapmpert, A.; Ritter, C.; Wehrle, G. AMALi—the Airborne Mobile Aerosol Lidar for Arctic research. Atmos. Chem. Phys. 2010, 10, 2947–2963. [Google Scholar] [CrossRef] [Green Version]
  53. Calonne, N.; Richter, B.; Löwe, H.; Cetti, C.; ter Schure, J.; Van Herwijnen, A.; Fierz, C.; Jaggi, M.; Schneebeli, M. The RHOSSA campaign: Multi-resolution monitoring of the seasonal evolution of the structure and mechanical stability of an alpine snowpack. Cryosphere 2020, 14, 1829–1848. [Google Scholar] [CrossRef]
  54. Bierwirth, E.; Wendisch, M.; Ehrlich, A.; Heese, B.; Tesche, M.; Althausen, D.; Schladitz, A.; Müller, D.; Otto, S.; Trautmann, T.; et al. Spectral surface albedo over Morocco and its impact on the radiative forcing of Saharan dust. Tellus 2009, 61B, 252–269. [Google Scholar] [CrossRef] [Green Version]
  55. Jäkel, E.; Walther, J.; Wendisch, M. Thermodynamic phase retrieval of convective clouds: Impact of sensor viewing geometry and vertical distribution of cloud properties. Atmos. Meas. Tech. 2013, 6, 539–547. [Google Scholar] [CrossRef] [Green Version]
  56. Coppo, P.; Ricciarelli, B.; Brandani, F.; Delderfield, J.; Ferlet, M.; Mutlow, C.; Munro, G.; Nightingale, T.; Smith, D.; Bianchi, S.; et al. SLSTR: A high accuracy dual scan temperature radiometer for sea and land surface monitoring from space. J. Mod. Opt. 2010, 57, 1815–1830. [Google Scholar] [CrossRef]
  57. Spreen, G.; Kaleschke, L.; Heygster, G. Sea ice remote sensing using AMSR-E 89 GHz channels. J. Geophys. Res. 2008, 113, C02S03. [Google Scholar] [CrossRef] [Green Version]
  58. Rostosky, P.; Spreen, G.; Farrell, S.L.; Frost, T.; Heygster, G.; Melsheimer, C. Snow Depth Retrieval on Arctic Sea Ice From Passive Microwave Radiometers—Improvements and Extensions to Multiyear Ice Using Lower Frequencies. J. Geophys. Res. Ocean. 2018, 123, 7120–7138. [Google Scholar] [CrossRef]
  59. Angström, A. The parameters of atmospheric turbidity. Tellus 1964, 16, 64–75. [Google Scholar] [CrossRef] [Green Version]
  60. Joseph, J.; Wiscombe, W.; Weinman, J. The Delta-Eddington Approximation for Radiative Flux Transfer. J. Atmos. Sci. 1977, 33, 2452–2459. [Google Scholar] [CrossRef]
  61. Libois, Q.; Picard, G.; Dumont, M.; Arnaud, L.; Sergent, C.; Pougatch, E.; Sudul, M.; Vial, D. Experimental determination of the absorption enhancement parameter of snow. J. Glaciol. 2014, 60, 714–724. [Google Scholar] [CrossRef] [Green Version]
  62. Mayer, B.; Kylling, A. Technical note: The libRadtran software package for radiative transfer calculations—Description and examples of use. Atmos. Chem. Phys. 2005, 5, 1855–1877. [Google Scholar] [CrossRef] [Green Version]
  63. Emde, C.; Buras-Schnell, R.; Kylling, A.; Mayer, B.; Gasteiger, J.; Hamann, U.; Kylling, J.; Richter, B.; Pause, C.; Dowling, T.; et al. The libRadtran software package for radiative transfer calculations (version 2.0.1). Geosci. Model Dev. 2016, 9, 1647–1672. [Google Scholar] [CrossRef] [Green Version]
  64. Stamnes, K.; Tsay, S.C.; Wiscombe, W.; Laszlo, I. DISORT, A General-Purpose Fortran Program for Discrete-Ordinate-Method Radiative Transfer in Scattering and Emitting Layered Media: Documentation of Methodology; Technical Report; Deptartment of Physics and Engineering Physics, Stevens Institute of Technology: Hoboken, NJ, USA, 2000. [Google Scholar]
  65. Ricchiazzi, P.; Gautier, C. Investigation of the effect of surface heterogeneity and topography on the radiation environment of Palmer Station, Antarctica, with a hybrid 3-D radiative transfer model. J. Geophys. Res. 1998, 103, 6161–6178. [Google Scholar] [CrossRef] [Green Version]
  66. Gueymard, C.A. The sun’s total and spectral irradiance for solar energy applications and solar radiation models. Sol. Energy 2004, 76, 423–453. [Google Scholar] [CrossRef]
  67. Zängl, G.; Reinert, D.; Ripodas, P.; Baldauf, M. The ICON (ICOsahedral Non-hydrostatic) modelling framework of DWD and MPI-M: Description of the non-hydrostatic dynamical core. Q. J. R. Meteorol. Soc. 2015, 141, 563–579. [Google Scholar] [CrossRef]
  68. Giorgetta, M.A.; Brokopf, R.; Crueger, T.; Esch, M.; Fiedler, S.; Helmert, J.; Hohenegger, C.; Kornblueh, L.; Köhler, M.; Manzini, E.; et al. ICON-A, the Atmosphere Component of the ICON Earth System Model: I. Model Description. J. Adv. Model. Earth Syst. 2018, 10, 1613–1637. [Google Scholar] [CrossRef]
  69. Rieger, D.; Bangert, M.; Bischoff-Gauss, I.; Förstner, J.; Lundgren, K.; Reinert, D.; Schröter, J.; Vogel, H.; Zängl, G.; Ruhnke, R.; et al. ICON–ART 1.0—A new online-coupled model system from the global to regional scale. Geosci. Model Dev. 2015, 8, 1659–1676. [Google Scholar] [CrossRef] [Green Version]
  70. Schröter, J.; Rieger, D.; Stassen, C.; Vogel, H.; Weimer, M.; Werchner, S.; Förstner, J.; Prill, F.; Reinert, D.; Zängl, G.; et al. ICON-ART 2.1—A flexible tracer framework and its application for composition studies in numerical weather forecasting and climate simulations. Geosci. Model Dev. Discuss. 2018, 11, 4043–4068. [Google Scholar] [CrossRef] [Green Version]
  71. Machulskaya, E.E.; Lykosov, V.N. An Advanced Snow Parameterization for Models of Atmospheric Circulation. COSMO Newsl. 2008, 8, 10–16. [Google Scholar]
  72. Essery, R.; Best, M.; Cox, P. MOSES 2.2 Technical Documentation, Hadley Centre Technical Note 30. 2001, p. 30. Available online: https://jules.jchmr.org/sites/default/files/HCTN_30.pdf (accessed on 22 September 2021).
  73. Legagneux, L.; Taillandier, A.S.; Dominé, F. Grain growth theories and the isothermal evolution of the specific surface area of snow. J. Appl. Phys. 2004, 95, 6175–6184. [Google Scholar] [CrossRef]
  74. Mei, L.; Rozanov, V.; Vountas, M.; Burrows, J.P.; Levy, R.C.; Lotz, W. Retrieval of aerosol optical properties using MERIS observations: Algorithm and some first results. Remote Sens. Environ. 2017, 197, 125–140. [Google Scholar] [CrossRef] [PubMed]
  75. Mei, L.; Rozanov, V.; Vountas, M.; Burrows, J.P. The retrieval of ice cloud parameters from multi-spectral satellite observations of reflectance using a modified XBAER algorithm. Remote Sens. Environ. 2018, 215, 128–144. [Google Scholar] [CrossRef]
  76. Mei, L.; Rozanov, V.; Ritter, C.; Heinold, B.; Jiao, Z.; Vountas, M.; Burrows, J.P. Retrieval of Aerosol Optical Thickness in the Arctic Snow-Covered Regions Using Passive Remote Sensing: Impact of Aerosol Typing and Surface Reflection Model. IEEE Trans. Geosci. Remote Sens. 2020, 58, 5117–5131. [Google Scholar] [CrossRef]
  77. Yang, P.; Bi, L.; Baum, B.A.; Liou, K.N.; Kattawar, G.W.; Mishchenko, M.I.; Cole, B. Spectrall consistent scattering, absorption, and polarization properties of atmospheric ice crystals at wavelengths from 0.2 to 100 μm. J. Atmos. Sci. 2013, 70, 330–347. [Google Scholar] [CrossRef]
  78. Kokhanovsky, A.A. The influence of horizontal inhomogeneity on radiative characteristics of clouds: An asymptotic case study. IEEE Trans. Geosci. Remote Sens. 2003, 41, 817–825. [Google Scholar] [CrossRef]
  79. Warren, S.G.; Brandt, R.E. Optical constants of ice from the ultraviolet to the microwave: A revised compilation. J. Geophys. Res. 2008, 113, D14220. [Google Scholar] [CrossRef]
  80. Kokhanovsky, A.; Macke, A. Integral light-scattering and absorption characteristics of large, nonspherical particles. Appl. Opt. 1997, 36, 8785–8790. [Google Scholar] [CrossRef] [PubMed]
  81. Wendisch, M.; Pilewskie, P.; Jäkel, E.; Schmidt, S.; Pommier, J.; Howard, S.; Jonsson, H.H.; Guan, H.; Schröder, M.; Mayer, B. Airborne measurements of areal spectral surface albedo over different sea and land surfaces. J. Geophys. Res. 2004, 109, D08203. [Google Scholar] [CrossRef]
  82. Jäkel, E.; Stapf, J.; Wendisch, M.; Nicolaus, M.; Dorn, W.; Rinke, A. Validation of the sea ice surface albedo scheme of the regional climate model HIRHAM–NAOSIM using aircraft measurements during the ACLOUD/PASCAL campaigns. Cryosphere 2019, 13, 1695–1708. [Google Scholar] [CrossRef] [Green Version]
  83. Hartmann, M.; Adachi, K.; Eppers, O.; Haas, C.; Herber, A.; Holzinger, R.; Hünerbein, A.; Jäkel, E.; Jentzsch, C.; van Pinxteren, M.; et al. Wintertime Airborne Measurements of Ice Nucleating Particles in the High Arctic: A Hint to a Marine, Biogenic Source for Ice Nucleating Particles. Geophys. Res. Lett. 2020, 47, e2020GL087770. [Google Scholar] [CrossRef]
  84. Hudson, S.R.; Warren, S.G.; Brandt, R.E.; Grenfell, T.C.; Six, D. Spectral bidirectional reflectance of Antarctic snow: Measurements and parameterization. J. Geophys. Res. Atmos. 2006, 111, D18106. [Google Scholar] [CrossRef] [Green Version]
  85. Zege, E.; Ivanov, A.; Katsev, I. Image Transfer through a Scattering Medium; Springer: New York, NY, USA, 1991. [Google Scholar]
Figure 1. Color-coded sea ice roughness along the flight tracks for 25–27 March 2018 measured by the laser scanner on the Polar 5 aircraft. Dark gray line indicates flight track without laser scanner measurements. Sea ice concentration for this period is displayed in the background (basically all overflown areas had a sea ice concentration of about 100%). Insert map of Greenland shows location of measurement area (red box).
Remotesensing 13 04904 g001
Figure 2. Schematics of the linkages between the different observational (blue boxes), retrieval (green boxes), and modeling (yellow boxes) methods used in this study. Details are given in the subsequent subsections.
Remotesensing 13 04904 g002
Figure 3. Simulated surface albedo of different snow grain sizes r opt for 1100, 1280, and 1700 nm wavelength using TARTES (solid lines) and the SGSP equations for black-sky and blue-sky-albedo (dashed lines, filled squares) for SZA = 80°. Additionally, the albedo ratio R is plotted for all methods.
Remotesensing 13 04904 g003
Figure 4. Spectral albedo derived from simulated upward and downward irradiance spectra at different altitudes (200 m, 3000 m) over the surface (red dotted and red dashed line). The default surface albedo (thick solid red line) represents the input surface albedo with a r opt = 60 µm (derived from TARTES simulations). The other solid lines are simulated albedo spectra for r opt ranging between 100 µm and 350 µm. The shaded areas mark the absorption bands of water vapour.
Remotesensing 13 04904 g004
Figure 5. Locally averaged IceCube measurements of the snow grain size during PAMARCMiP at two locations (along line A and line B) in the vicinity of the Villum research station. Bars give the standard deviation of the spatial averaging. Mean broadband surface albedo derived from ground-based pyranometer data near line A is additionally shown (triangles). ICON-ART modeled snow grain sizes are indicated as black solid and red dashed lines. Spread of parametrization result of the snow grain size evolution after Flanner and Zender [44] is shown as dark gray and light blue areas.
Remotesensing 13 04904 g005
Figure 6. Snow grain size estimated from MODIS satellite observations and applying the SGSP retrieval (ad), and XBAER retrieval results on SLSTR data (e) for the area overflown with the Polar 5 aircraft on 25 March 2018. (f) MODIS reflectance (MOD02) measured at 1.24 µm wavelength. The colour-coded r opt derived from SMART measurements ( α (1700 nm)-based method) is overlaid.
Remotesensing 13 04904 g006
Figure 7. Relative frequency of the retrieved snow grain size from Sentinel-3, Aqua, and Terra overpasses on 25 March 2018.
Remotesensing 13 04904 g007
Figure 8. Box-and-whisker plot of snow grain size statistics along the entire flight track over sea ice (a) and over Greenland (b) on 25 March 2018, as well as over sea ice on 26 March 2018 (c), and on 27 March 2018 (d). Minimum and maximum values (without statistical outliers) are displayed as vertical bars. The boxes indicate the 25th, 50th (median), and 75th percentiles of the distribution. IQR stands for interquartile range. The mean r opt and the range of measurement uncertainty of the IceCube data is shown as horizontal light gray bar in (b).
Remotesensing 13 04904 g008
Figure 9. Effect of the SMART measurement uncertainty on the accuracy of the retrieved r opt derived from a model-based sensitivity study for SZA = 80°. (a) Correlation of retrieved and true (input) r opt , (b) relative deviation in % depending on true r opt . Results are shown for the α (1700 nm)-based and R -based retrieval using TARTES.
Remotesensing 13 04904 g009
Figure 10. (a) Ratio of retrieved snow grain size for various particle shapes and the reference mixed shape based on LUTs from TARTES simulations for SZA = 80°. The shape-dependent form factors A are given within the plot next to the r opt -averaged values. The vertical bars indicate the standard deviation of the r opt -averaging. The studied shapes: cylinders (Cyl), spheroids (Sph), hexagonal plates (HexP), cuboids (Cub), and fractals are selected according to the TARTES internal shape list from Libois et al. [43]. The number behind the shape abbreviation gives the aspect ratio of the particle. (b) Retrieved r opt from SMART measurements over sea ice and Greenland on 25 March 2018 assuming the two particle shapes hexagonal plates and cylinders.
Remotesensing 13 04904 g010
Publisher’s Note: MDPI stays neutral with regard to jurisdictional claims in published maps and institutional affiliations.

