Article

Tracking Sustainable Restoration in Agro-Pastoral Ecotone of Northwest China

1
Key Laboratory of Western China’s Environmental Systems (Ministry of Education), College of Earth and Environmental Sciences, Lanzhou University, Lanzhou 730000, China
2
Department of Geosciences and Natural Resource Management, University of Copenhagen, 1350 Copenhagen, Denmark
3
Department of Geography, Western Michigan University, Kalamazoo, MI 49008, USA
*
Author to whom correspondence should be addressed.
Remote Sens. 2021, 13(24), 5031; https://doi.org/10.3390/rs13245031
Submission received: 23 October 2021 / Revised: 1 December 2021 / Accepted: 4 December 2021 / Published: 10 December 2021
(This article belongs to the Section Environmental Remote Sensing)

Abstract

:
Large-scale ecological restoration (ER) projects have been implemented in northwest China in recent decades as a means to prevent desertification and improve ecosystem services. However, previous studies have demonstrated adverse impacts in the form of widespread soil water deficit caused by intensive ER activities. Understanding the role of climate change and ER efforts in vegetation dynamics and soil moisture consumption is essential for sustainable ecosystem management. Here, we used the break for additive season and trend (BFAST) method to analyse spatial patterns in the normalized difference vegetation index (NDVI) variation over the agro-pastoral ecotone of northwest China (APENC) for 2000–2015. From the combined use of generalized additive modelling (GAM) and residual-trend analysis (RESTREND), we distinguished and quantified the effects of climate and human management on vegetation and soil water dynamics. Approximately 78% of the area showed vegetation variations representing a significant change in NDVI, of which more than 68% were categorized as abrupt changes. Large areas of the abrupt change type, interrupted increase and monotonic increase in NDVI were observed before 2006, and small areas of the change type of negative reversals were observed after 2012. Anthropogenic activity was found to be the major driving factor of variation in vegetation (contribution rate of 56%) and soil moisture (contribution rate of 78%). The vegetation expansion, which was mainly related to the large number of ER programs that started in 2000, was found to increase soil moisture depletion. By comparing areas where anthropogenic activities had a high contribution rate to vegetation increase and areas where soil moisture consumption was severely increased, we identify and discuss hotspot areas of soil moisture consumption caused by the ER programs. The current methodological workflow and results represent a novel foundation to inform and support water resource management and ecological-restoration-related policy making.

1. Introduction

Increased soil moisture depletion as a result of climate change and/or intractable land management may lead to adverse effects on vegetation and agricultural production [1,2,3], such as the reduction of plant growth, decrease of vegetation resistance to external stress, decline in crop yields, and even plant mortality [4,5,6]. Prolonged excessive soil moisture depletion can cause soil desiccation, which will influence the hydrological cycle at the local-regional scale and may lead to soil degradation, thereby, threatening ecosystem health and services [7,8,9].
Over recent decades, Chinese development programs implemented several large-scale ecological restoration (ER) projects in order to protect and restore fragile and/or degraded ecosystems. The specific conservation practices of these ER projects mainly include activities, such as afforestation, aerial seeding, conversion of cropland to grassland, dune fixation, grazing bans and restrictions [10]. Studies have shown that vegetation growth in response to ER has been effective in combatting land degradation and desertification [10], increasing biomass [11], promoting carbon sequestration [12], reducing soil loss [12,13] and enhancing the biodiversity in degraded ecosystems [14]. However, a number of recent studies have also shown that ER activities in some cases may lead to high-water consumption by newly planted vegetation, thereby, resulting in enhanced soil water deficits and increased plant water stress [1,15,16,17,18,19,20]. Notably in water limited areas, studies have shown that revegetation of degraded areas can cause severe depletion of soil water resources [15,16,17], therefore, ultimately defeating the purpose of ER by increasing the problems of land degradation. These findings were also confirmed by field experiments where increased soil moisture consumption was observed under intensive vegetation restoration [1,4,5,6,21,22,23,24]. Altogether, this suggests that uninformed implementation of ER projects in semi-arid China may result in increased land degradation by depleting soil moisture and, therefore, pose a serious obstacle to sustainable land use.
Understanding the spatio-temporal variability in soil moisture caused by ER activities is essential for the maintenance and development of dryland ecosystems [25]. Various remote sensing systems have been used to estimate soil moisture during recent decades [17,26,27], such as Soil Moisture and Oceanic System (SMOS) as well as Soil Moisture Active Passive (SMAP). In the optical and thermal infrared regions of the electromagnetic spectrum, a range of soil moisture indicators (e.g., TVDI; Temperature Vegetation Dryness Index) have successfully been applied for soil moisture retrieval [28,29]. TVDI, proposed by Sandholt et al., is based on an empirical parameterization of the land surface derived from vegetation indices and land surface temperature (LST) [30]. Being effective in quantifying dryness/wetness conditions, it has been extensively used as an index to estimate regional soil moisture in arid and semi-arid regions, and the potential for estimating soil moisture over large areas has been well demonstrated [31,32,33,34,35]. The TVDI-based model considers vegetation coverage in the soil moisture estimation and has been widely applied to vegetated areas [31,32]. Compared to soil moisture products and resource-intensive field work, it incorporates the impact of vegetation changes on soil moisture and facilitates the ability to derive soil moisture information at the plot scale [36]. The residual trend-based analysis (RESTREND) is one of the most widely used methods for separating the relative impacts caused by climatic factors and anthropogenic activities on land degradation [37,38,39,40]. The assumption underlying the application of the RESTREND method is that climate is the key controlling factor influencing vegetation growth and that any residual trends not accounted for by climate must be inherent to human interventions [41,42]. RESTREND analyses were used to study rain-use efficiency [43,44] and grassland NDVI dynamics [39,40].
The arid and semiarid agro-pastoral ecotone of northwest China (hereafter APENC) is a fragile ecologically transitional zone in China [45]. From 2000 to 2015, the Chinese government has implemented a number of ER projects in this region being amongst the most successful examples of revegetation and reversing desertification [46,47,48]. Since 2000, widespread soil water deficits have also been reported due to the excessive demand for water by the implementation of ER activities [1,5,15,17,18,49]. Current knowledge of soil moisture change in APENC is, however, based either on in situ measurements from sample plots or from coarse-scale soil moisture satellite data (e.g., the resolution of AMSR-E soil moisture product is 25 km, SMOS is 25 km, and SMAP is 9 km, respectively), that cannot accurately characterize the impacts on soil moisture consumption from anthropogenic activities on a scale being compatible with the scale of ER projects. Thus, understanding long-term trends and dynamics in vegetation growth and evaluating soil moisture indicators at an appropriate spatial scale may help us obtain a deeper understanding of to what extent ER activities are sustainable or not (i.e., resulting in soil water shortages).
Based on the break for the additive season and trend (BFAST), generalized additive modelling (GAM) and residual-trend (RESTREND) methods, we analysed vegetation and soil moisture changes during 2000–2015 in relation to climate change and human management activities. Our overall objective is to quantify the effects of anthropogenic activity on vegetation and soil moisture variations to support the sustainable use of water resources. Specifically this will be achieved by (1) improving the parameterization of long term changes of vegetation in APENC, including gradual and abrupt changes, (2) separating human-driven from climatic-induced changes in vegetation and in soil moisture, (3) quantifying the positive and negative effects of anthropogenic activity on vegetation and soil moisture variations and (4) identifying hotspots regions of soil water deficit caused by human-induced increased vegetation cover. The approach is expected to be particularly relevant for decision-making on land use management and ecological restoration policies.

2. Materials and Methods
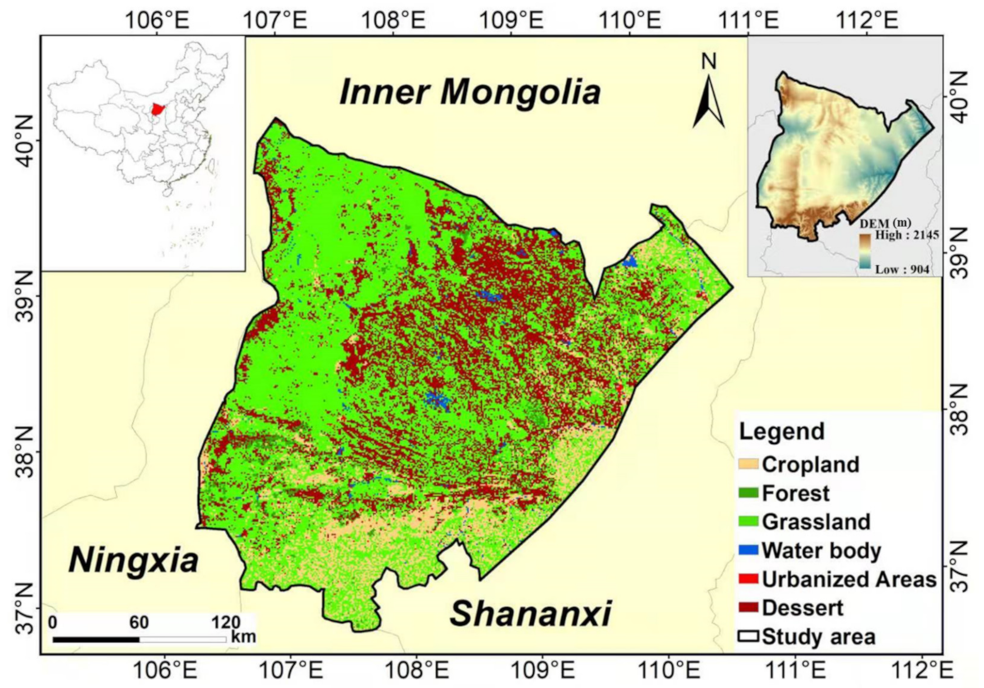
2.1. Study Area

The study region of the semiarid agro-pastoral ecotone of northwest China (APENC) represents a mosaic of agriculture and pastoral lands, covering 77,513 km2 (Figure 1). It is located between 106.228–110.903°E and 36.816–40.194°N, with an altitude ranging from 904 m to 2145 m above sea level. The main land cover types are grassland, desert, cropland and forest [39]. The climate in this area is characterized by a typical semi-arid continental climate, with an annual average temperature of approximately 7–9 °C, the annual mean precipitation varies from 250 to 450 mm, with most of it falling in the summer, and the annual mean wind speed is up to 5 m/s [50,51]. The main topography includes active dunes, semi-fixed dunes and fixed dunes [52]. The main soil texture classes contains sandy loam, loam and sand. Amorphic soils, Aridisols, Pedocals, Semi-aqueous soils and Anthrosols are the main soil types [53]. APENC is part of one of the largest agro-pastoral ecotones in the world and is highly sensitive to climate change and anthropogenic activities [54]. The influence of climate change and a historical high pressure on resources (primarily over-grazing) have contributed to severe desertification in this region in the past century. To reverse this development, the Chinese government has implemented multiple policy-driven environmental protection programs since 1998, such as “Grain for Green”, “Tree-North Shelter Forest” and afforestation subsidy policies [51,54].

2.2. Datasets

2.2.1. Moderate Resolution Imaging Spectroradiometer (MODIS) Data

The MODIS NDVI (MOD13A1, 16-day scaled at 1 km resolution) and LST (Land Surface Temperature) (MOD11A2, 8-day scaled at 1 km resolution) data extending from 2000 to 2015 were obtained from the NASA (https://lpdaac.usgs.gov/dataset_discovery/modis/modis_products_table, accessed on 20 August 2019). NDVI is derived from atmospherically-corrected reflectance in the red and near-infrared wavebands of MODIS images and shows a high correlation with green biomass and vegetation productivity [55,56]. In generating NDVI images, low-quality pixels were removed using a MODIS-specific compositing method based on product quality assurance metrics. We converted the temporal resolution of MODIS NDVI from a 16-day scale into a monthly scale through the maximum value composite (MVC) method. MODIS LST is retrieved by a generalized split-window algorithm, and it has been validated and is considered ready to use in scientific analysis [57]. The QA flags accompanying the LST product were used to select good quality pixels. MODIS 8-day LST data were aggregated into monthly data based on the mean values. Specifically, if the quality of 8-day pixels in a given period were equally good then the average values were generated. Otherwise, the pixels with better quality were selected to output the monthly average value, and if pixels did not have acceptable quality, the spatial average of the neighbouring pixels was included. Then, we extracted the monthly NDVI and LST of the growing season for analysis. The growing season was defined as the period from April to September according to the climate characteristics and vegetation growth conditions [58]. All analyses have been conducted for the overlapping period of all available datasets (2000–2015).

2.2.2. Land Use and Land Cover Dataset

A land use and land cover (LULC) dataset from the Resources and Environmental Data Cloud Platform (http://www.resdc.cn/data.aspx?DATAID=99, accessed on 25 June 2019) for the year 2010 with a 1 km resolution was incorporated to test for broad-scale pattern in the BFAST trend types. The data production is based on Landsat TM/ETM remote sensing images of each period as the main data source, which is generated by human visual interpretation [59]. The dataset consists of six primary land use/cover types and 25 secondary land use/cover types. We selected grassland, desert, cropland and forest for the analysis, as they are main land use/cover types in this region.

2.2.3. Soil Texture and Soil Type Data

The soil texture and soil type data of APENC (in 1:1,000,000) scale was provided by Data Center for Resources and Environmental Sciences, Chinese Academy of Sciences (RESDC) (http://www.resdc.cn, accessed on 20 November 2021). The soil texture data consists of three categories, including sand, silt, and clay. The distribution of soil texture classes in APENC (Supplementary Figure S1a) is shown in accordance with the USDA soil texture triangle [60].
The soil type data was compiled by the Institute of Soil Science, Chinese Academy of Sciences based on the results of the Second National Soil Survey of China [53]. It was classified using the Genetic Soil Classification of China (GSCC), which includes 12 orders, 61 great groups, 235 sub-great groups, and 909 families [61]. The distribution of soil types in APENC is shown in Supplementary Figure S1b. Here, we selected the main soil texture classes (sandy loam, loam and sand) and soil types (Amorphic soils, Aridisols, Pedocals, Semi-aqueous soils and Anthrosols) for the analysis.

2.2.4. Climatic Data

We downloaded the monthly air temperature (TEM), precipitation (PRE), near surface wind speed (SWS) and total downward solar radiation, including shortwave and longwave radiation (RAD) from the China Meteorological Forcing Dataset (CMFD). The CMFD was produced by merging a variety of data sources and has been proven to agree well with observation data [62,63]. The dataset used in this study spans from 2000 to 2015, with a spatial resolution of 0.1°. All variables were resampled to 1 km spatial resolution using the bilinear method.

2.2.5. Volumetric Soil Water Data

The monthly averaged volumetric soil water (0–7 cm) data was provided by the European Center for Medium-Range Weather Forecasting (https://cds.climate.copernicus.eu/cdsapp#!/dataset/reanalysis-era5-land-monthly-means?tab=overview, accessed on 4 November 2020), with a spatial resolution of 0.1°. The dataset used in this study spans from 2000 to 2015. These data were resampled to 1 km spatial resolution using bilinear interpolation.

2.2.6. ER Affected Evapotranspiration (ET) Data

The ER affected evapotranspiration data was provided by Wang et al. [64]. The ET is the main water loss from the earth’s surface, particularly in arid and semiarid regions [65]. To explore the impact of ER activities on evapotranspiration, Wang et al. used the Priestley–Taylor Jet Propulsion Laboratory (PT-JPL) model to calculate the net impact of ER on the evaporative moisture (ER_ET) [64]. The reliability of the simulated evapotranspiration was verified from observational data [66]. Here, we used ER_ET data from 2000 to 2015 as an independent data source to evaluate our quantification and spatial patterns of the impacts of anthropogenic activities on the soil moisture consumption. The linear trend of ER_ET in the growing season from 2000 to 2015 is presented in Supplementary Figure S2.

2.3. Method

In this paper, we first used the BFAST method to systematically assess and monitor the spatial pattern of NDVI changes and incorporated LULC and soil texture data to analyse the corresponding relationship of NDVI changes. Next, a nonlinear GAM model was used in combination with RESTREND to separate the climate-driven from the human-driven NDVI and TVDI variation. Subsequently, we quantified the positive and negative effects of anthropogenic activity on NDVI and TVDI. Here, we used precipitation, volume soil water and the impact of anthropogenic activities on soil moisture consumption (ER_ET) data to evaluate our quantification and spatial patterns of the impact of anthropogenic activities on TVDI. Finally, we selected areas where anthropogenic activities dominate the increase in TVDI and NDVI to map hotspots of soil water deficit from human-induced increased vegetation cover.

2.3.1. Break for the Additive Season and Trend (BFAST) Method

We used the BFAST method to detect the occurrence and timing of abrupt changes in NDVI. BFAST is an algorithm that is based on locally weighted regression for temporal signal decomposition [67]. The time series is decomposed into seasonal, trend and residual additive components [67,68]. Assuming that non-linearity can be approximated by fitting a piecewise linear model, BFAST can detect trend shifts within the NDVI time series. This analysis provides valuable information about the occurrence of trend shifts and the timing and magnitude of the relevant breakpoints in environmental time series [69].
The r package BFAST01 (http://bfast.r-forge.r-project.org, accessed on 13 September 2020) was used here for the detection of the major breakpoint (one or none) in the NDVI time series [70,71]. We chose the “harmonic” model to fit the seasonality because it is considered being the most adapted to natural vegetation [67]. The minimum period for fitting a piecewise linear segment was set to 3 years [72]. The single detected breakpoint (if significant) can be considered the most important trend shift in the time series [69,70,73].

2.3.2. Temperature Vegetation Dryness Index (TVDI) Calculation

TVDI was proposed by Sandholt et al. based on an empirical parameterization of the surface temperature and vegetation index [30]. The dryness index reflects the spatial variation of soil moisture in the top soil layer. Originally, the two-dimensional vegetation index and surface temperature (NDVI-Ts) space is triangular or trapezoidal, but the NDVI-Ts space was found to be bi-parabolic, and the dry or wet edges were not linear for study areas covered with low biomass vegetation [74]:
TVDI = T s T smin T smax T smin
T smax = a 1 × NDVI 2 + b 1 × NDVI + c 1
T smin = a 2 × NDVI 2 + b 2 × NDVI + c 2
where T s is the MODIS LST; T smin ( T smax ) are the minimum (maximum) LST in the NDVI-Ts, respectively, defining the wet (dry) edge; and a1 and b1 (a2 and b2) are the parabolic fitting coefficients of the wet (dry) edge. These coefficients can be acquired from scatter plots of the NDVI-Ts space. The value of TVDI ranges from 0 to 1, and high TVDI values represent dry conditions and low values wet conditions. For more information about TVDI calculations, please see [30,74]

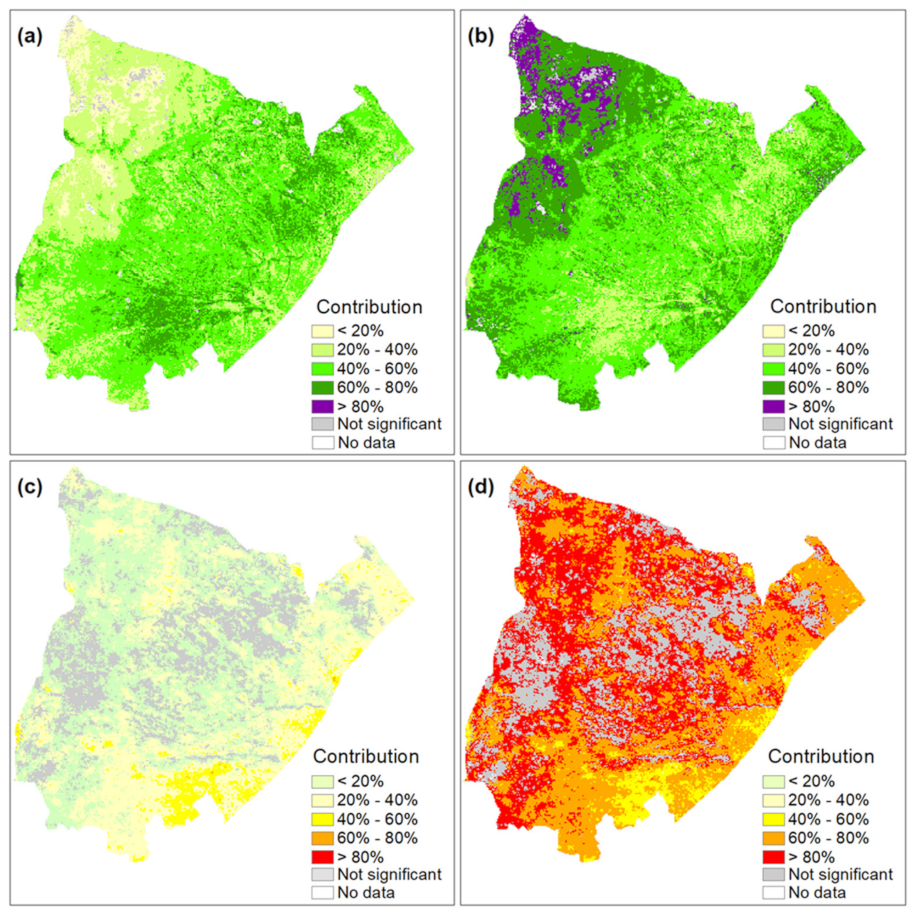
2.3.3. Quantifying Climatic and Anthropogenic Contributions to Vegetation and Soil Moisture Variability

The traditional residual trend analysis (RESTREND) assumes that predictors are linearly correlated to climate factors, and any trends in the deviation between the linear fitted value and the actual value are interpreted as being human-induced. However, the response of NDVI and TVDI to any external influence is complex, and a linear model cannot sufficiently capture the nonlinear climate–NDVI and climate–TVDI relationship [75].
A generalized additive model (GAM) can reveal nonlinear ecosystem responses to different predictors by applying non-parametric smoothers to each predictor and additionally calculating component responses [40,76,77]. Compared with linear models, GAM has lower AIC (Akaike Information Criterion) values at most pixels and performs better (Supplementary Figure S3). A generalized additive model (GAM, Equation (4)) was built to evaluate the climatic contribution to the variation in NDVI and TVDI at the pixel scale between 2000 and 2015. Following research by Xue et al., the precipitation (PRE), temperature (TEM), total downward solar radiation (RAD) and near surface wind speed (SWS) are included as explanatory variables [39].
g NDVI = β 0 + f 1 PRE + f 2 TEM + f 3 RAD + f 4 SWS
where g is the link function, β 0 is the intercept, and f 1 , f 2 , f 3 and f 4 are the predicting smoothers.
The residual difference between the observed NDVI and predicted NDVI was calculated as the NDVIa (anthropogenic contribution). The contribution of climate factors can be quantified by variance decomposition (adj-R2) and the remaining fraction (i.e., 1—adj-R2) was then interpreted as the anthropogenic contribution (AC_NDVI). The method to calculate the contribution of TVDI is the same as for NDVI.
We then quantified the contribution rate of anthropogenic and climate effects on vegetation variations and soil moisture, and we proposed a quantitative approach as an extension of Xue’s method [39]:
C _ NDVI a = NDVI a t n NDVI a t 2000
where C _ NDVI a denotes the anthropogenic contribution, NVDI a t n indicates the annual growing season NDVI affected by anthropogenic influence (except in 2000), NVDI a t 2000 indicates the NDVI affected by anthropogenic influence in 2000, C _ NDVI a > 0 denotes that anthropogenic activities provide positive effects on the vegetation, and C _ NDVI a < 0 indicates that anthropocentric activities have negative effects on the vegetation. We used C _ NDVI ap and C _ NDVI an to express the positive and negative anthropogenic impact, respectively. The total contributions of positive SUM _ C _ NDVI ap and negative SUM _ C _ NDVI an were calculated as follows:
SUM _ C _ NDVI ap = t 2000 t n C _ NDVI ap t 2000 t n C _ NDVI ap + t 2000 t n C _ NDVI an × AC _ NDVI × 100 %
SUM _ C _ NDVI an = t 2000 t n C _ NDVI an t 2000 t n C _ NDVI ap + t 2000 t n C _ NDVI an × AC _ NDVI × 100 %
where t 2000 referrs to the year of 2000 and n = 2001 ,   2002 ,   2003 , 2015 .
The method to quantify the contribution rates of anthropogenic effects on the TVDI is the same as for NDVI. It should be noted that C _ TVDI a > 0 represents anthropogenic activities leading to soil moisture consumption; therefore, the higher the value, the higher the risk of soil water deficits due to anthropogenic activities (e.g., overplanting and over revegetation). In such a case, the amount of rainfall in the area could not sustain the water demand of revegetated plants. C _ TVDI a < 0 represents an anthropogenic induced increase in soil moisture.

3. Results

3.1. Spatial Pattern of NDVI Time Series

The results of the spatial distribution of the type of trend shifts (Figure 2) show that ~78% (60.0 × 10³ km2) of areas experienced significant changes in NDVI, of which ~68% were categorized as showing an abrupt change. The type “Interrupted increase” in NDVI was the most frequent type of change in NDVI, where NDVI was characterized by a period of increase interrupted by a break and followed by a second period of increase. It comprised approximately 61% (corresponding to an area of approximately 36.6 × 10³ km2) of all cases with a significant change. Large patches of “Interrupted increase” were notably observed in northwest and southern APENC (Figure 2a). The type “Negative reversal” was the second most dominant change class, covering more than 19% of the entire study area (or approx. 24.7% of all cases of significant changes). This type was mostly observed in the central and north-central part of APENC. Other noticeable spatial patterns (accounting for a share of 13% of the observed significant change in NDVI) were observed in northeast and eastern part of APENC, both cases displaying a third type “Monotonic increase” in NDVI. More than 54% of the abrupt change in NDVI occurred before 2006, whereas the period 2006–2009 was characterized by the lowest number of breaks. Interestingly, abrupt changes in NDVI were observed earlier in the western part of APENC as compared to the eastern part, where a large area showed abrupt changes in 2009 and after. In addition, for 75% of all pixels of APENC, changes in NDVI were significant both prior and after the direct shift (Figure 2b).

3.2. Correspondence between Changes in NDVI and Land Use/Land Cover and SOIL Texture

The shares of abrupt positive and negative trends were approximately equal in most of the land cover types (Figure 3a), and all of the major land cover classes showed large areas of significant trends in the entire period (e.g., both before and after the break point) (between 73.19% and 81.20%) (Figure 3b). The share of the “Interrupted increase” in desert (32.91%) was much smaller than that of the other three land cover types (45.8–58.39%), but the “Negative reversal” (22.97%) was slightly larger than for the other classes (14.28–20.75%). Interestingly, the type “Negative reversal” was mostly observed for all negative type of change, while the “Monotonic decrease” accounted for a very small share (less than 0.65%). In addition, changes were observed in each individual year, with 2003, 2004 and 2012 showing larger areas of detected abrupt changes, followed by 2005, 2011 and 2010 (Figure 3c). In the three main soil texture classes, the proportions of the “Stable” were almost equal (Figure 3d). The share of the “Interrupted increase” in sand (39.43%) was smaller than that of the other soil texture classes (46.82–50.24%), whereas the “Negative reversal” (26.93%) was slightly larger than for the other soil texture classes (18.43–19.01%). The trend change type under different soil types is shown in Supplementary Figure S4.

3.3. Relationships between NDVI, TVDI, Climate and Anthropogenic Activity

The degree of NDVI and TVDI temporal variability explained by climatic factors were analysed using GAM models. The NDVI and TVDI numerical results indicated that approximately 98.05% and 80.19% of the APENC passed the significance test in NDVI and TVDI variability (p < 0.05), respectively. For the entire APENC, the four climatic factors together explained 43.62% of the NDVI variance and 19.81% of the TVDI variance, respectively (Figure 4a,c). The areas where climatic factors contributed more than 60% to NDVI changes covered 13.14% of the entire study area, while areas with a contribution rate of more than 60% to TVDI changes accounted for less than 1% of the study area. The anthropogenic contribution to the observed variation in NDVI and TVDI was estimated as residuals to the simulated (climate-driven) NDVI and TVDI. Anthropogenic activities contributed 56.38% to the vegetation variability and 77.86% to the TVDI dynamics (Figure 4b,d). The results showed that 36.35% and 59.84% of NDVI and TVDI changes were mainly affected by anthropogenic activities. Larger clusters of high degree of explanation from anthropogenic activities to NDVI dynamics concentrated in the northwest part of APENC and for TVDI high anthropogenic contributions were found throughout the entire region.
In order to quantify the geographic extent and direction of anthropogenic impacts on the variation in vegetation and soil moisture, we also compared the positive and negative anthropogenic contribution rates to the NDVI and TVDI. The positive contribution rate represents the degree to which anthropogenic activities promote vegetation growth (Figure 5a) and soil moisture increase (Figure 5c), while the negative contribution rate represents the degree of vegetation degradation (Figure 5b) and soil moisture decrease (Figure 5d). The positive contribution (36.84% on average for the study area) of vegetation expansion caused by anthropogenic activities was higher than the negative contribution (19.55%) of vegetation reduction. On the contrary, the impact on soil moisture decrease by vegetation expansion from anthropogenic activities was observed in most areas, with a total contribution rate of 46.67%, which was more than that of anthropogenic increase in soil moisture (covering 30.95%). Very high contribution rates towards soil moisture decreases (aggravated soil moisture consumption) were primarily observed in the eastern and northwestern areas of APENC. Notably, the areas of severe soil moisture consumption were predominantly found in areas where anthropogenic activities had a very high positive contribution rate to vegetation variations. Taken together, these results suggest that anthropogenic activities might have caused an increase in soil water deficits over APENC in the period from 2000 to 2015.

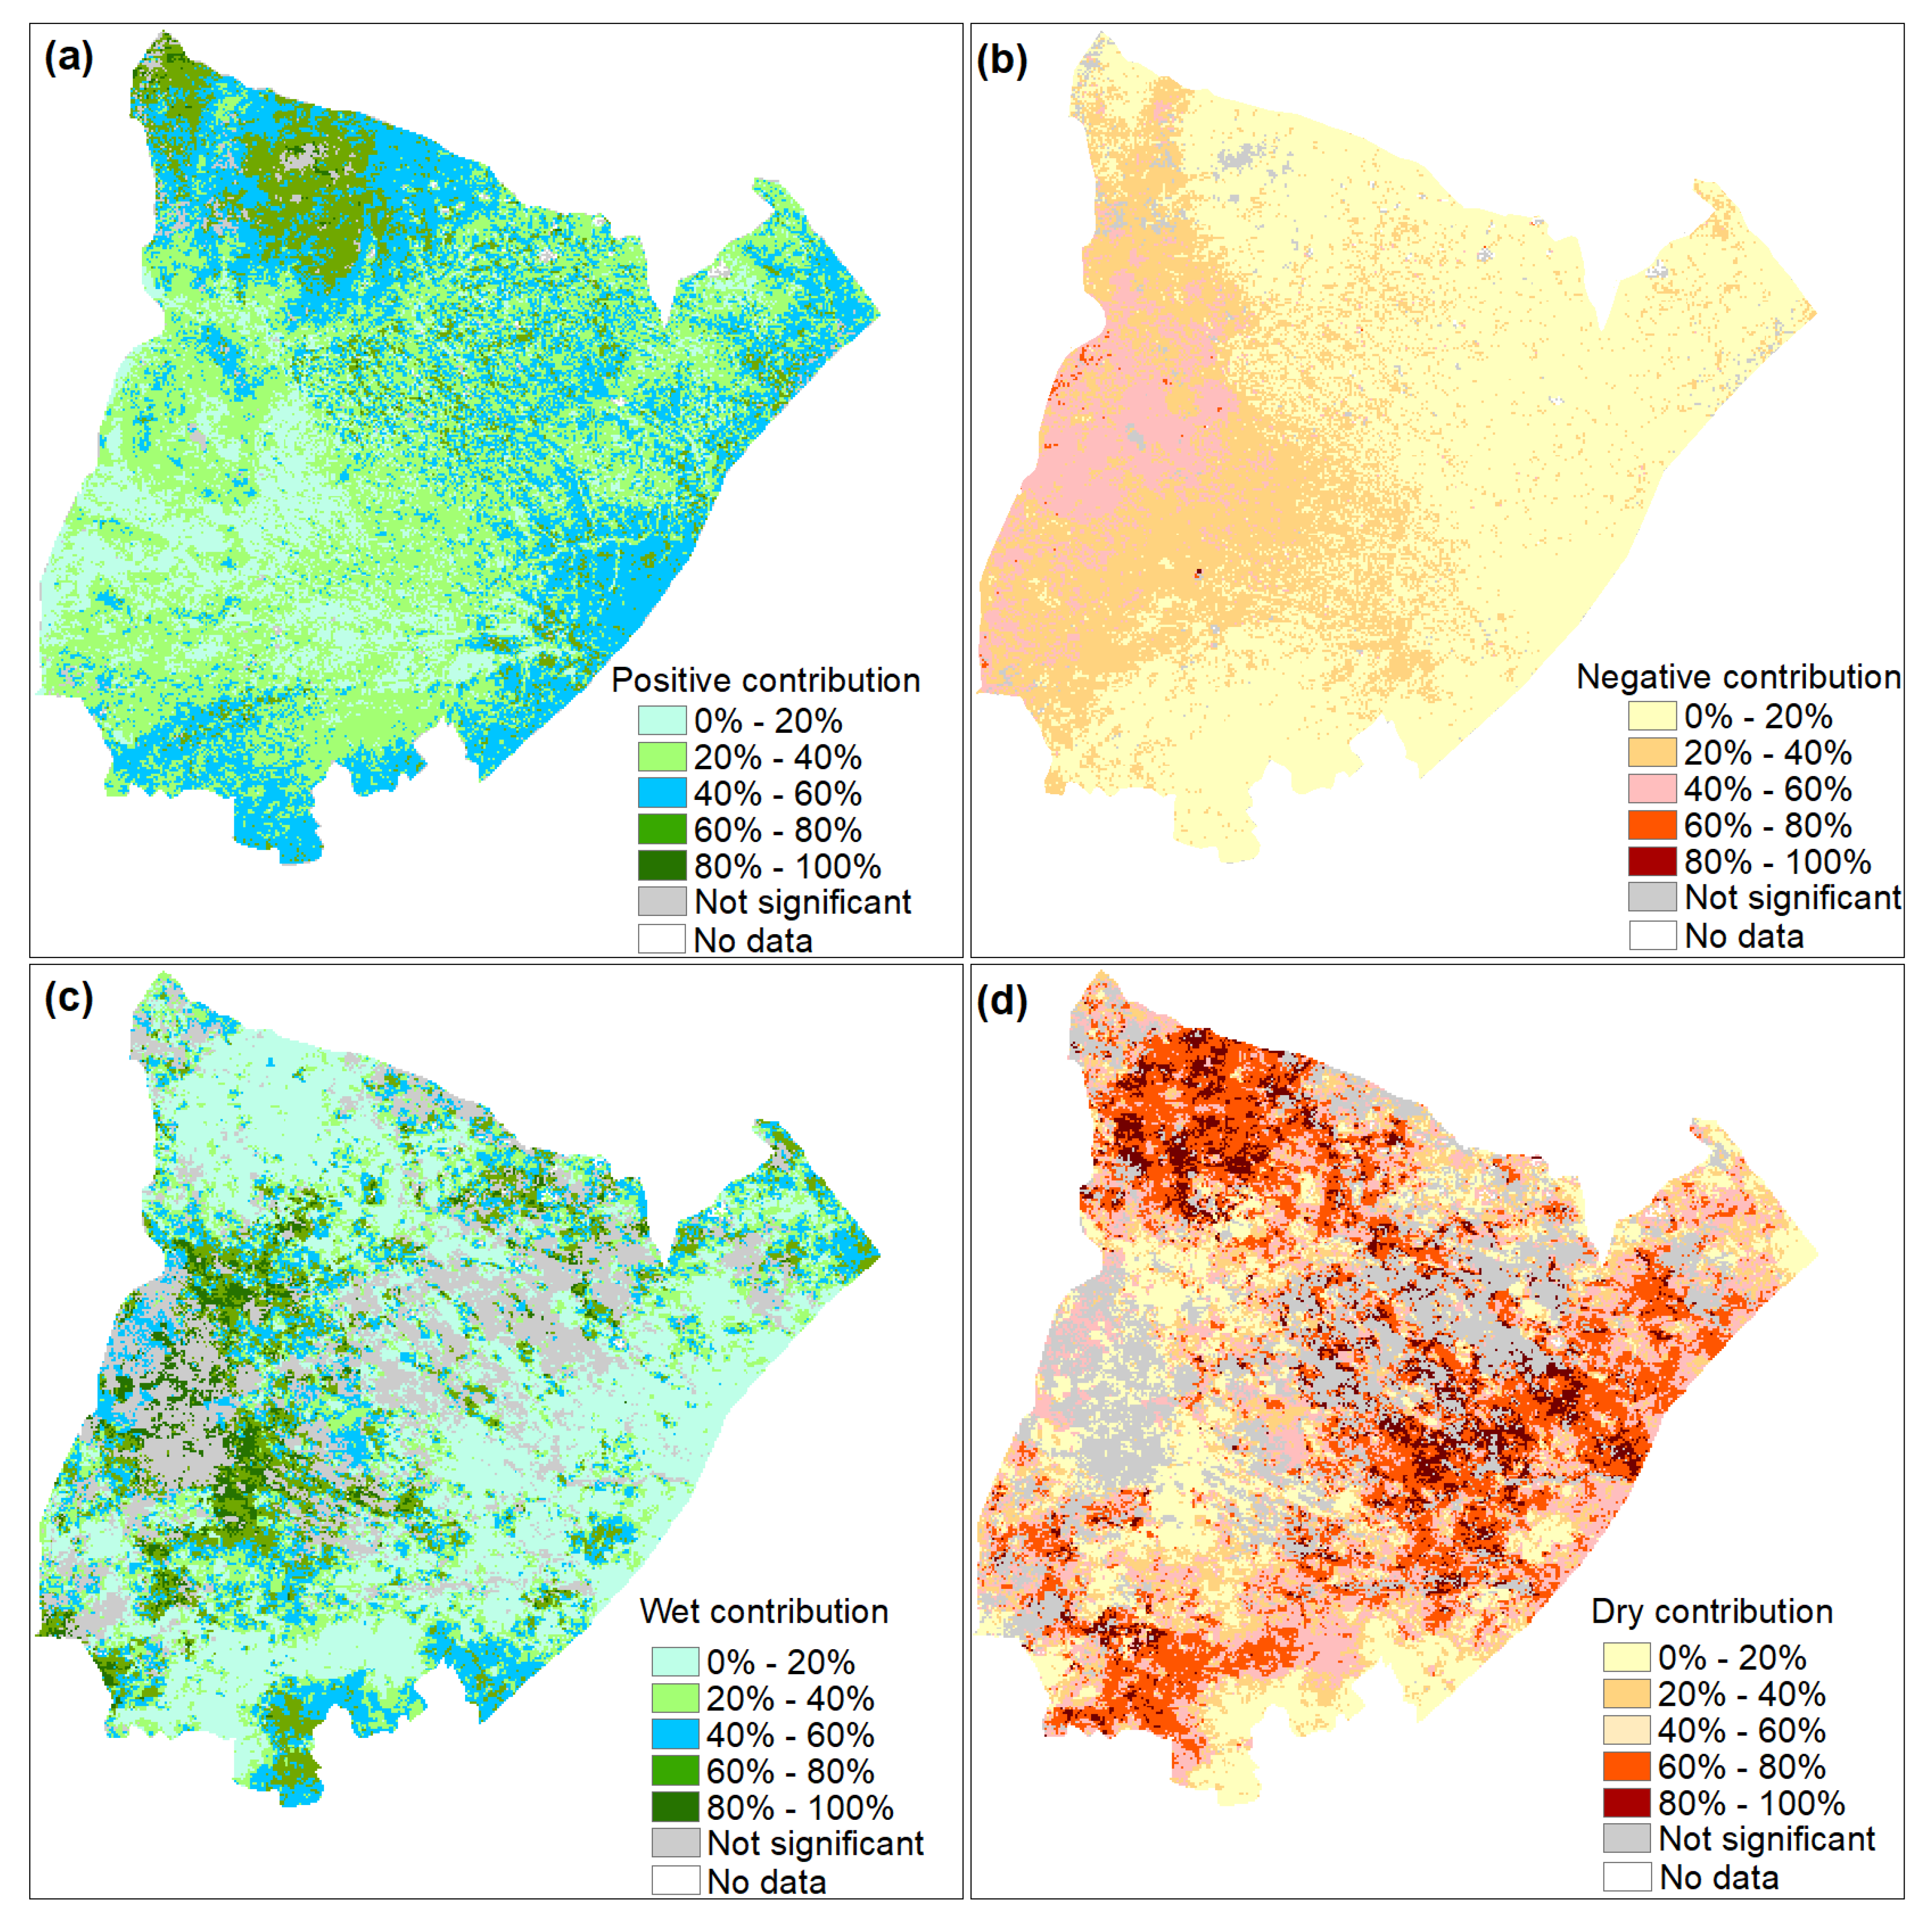
3.4. Mapping Hotspots of Soil Water Deficit from Human-Induced Increased Vegetation Cover

We divided the dry contribution rate from anthropogenic activities to TVDI (DC) (Figure 5d) into five classes as a function of the level of decrease (Table 1). Subsequently, the wet contribution rate from anthropogenic activities to TVDI (WC), the positive contribution rate of anthropogenic activities to vegetation growth (PC), the average annual precipitation in the growing season (APRE) and the average annual volumetric soil water in the growing season (ASW) were calculated for the study area per DC class. In areas of DC1 and DC2, anthropogenic activities dominated the increase in soil moisture (the value of WC1 is greater than the value of DC1), the average PC is 33%, and the average ASW is 0.2 m3/m3 (ASW being higher than for other regions). DC3 has the highest precipitation, but the corresponding ASW is lower than DC1 and DC2. The DC3 value in this area is slightly higher than WC3 value. Anthropogenic activities mainly controlled the soil moisture consumption in areas DC4 and DC5 (DC4 and DC5 values are considerably larger than WC), the PC4 and WC4 increased significantly, and the precipitation and ASW were the least in these two regions. The magnitude of the linear trend of ER_ET under different classes of DC during 2000–2015 (Figure 6) shows that, as the DC value increased, the ET caused by ER activities also increased. DC and ER_ET were observed to be significantly correlated (p < 0.05) with a correlation of 0.74.
The pixels of DC3, DC4 and DC5 represent areas where anthropogenic activities dominated the consumption of soil moisture, whereas PC3 (40–60%), PC4 (60–80%) and PC5 (80–100%) represent areas where anthropogenic activities were associated with significant vegetation increase during 2000–2015. We combined the different areas of DC and PC classes selected above to map high risk areas of soil water deficit caused by anthropogenic activities (Figure 7). Strong soil moisture deficits resulting from anthropogenic activities were predominantly observed in the northwest part of APENC, whereas only smaller parts of the eastern and southern APENC showed signs of soil moisture depletion due to anthropogenic interventions.

4. Discussion

4.1. Evidence of Human-Induced Greening in Semiarid Northwest China

The semiarid northwest China represents an ecologically important area in China and is highly sensitive to climatic variability and human management [39,78]. Since 2000, the Chinese government has been implementing multiple large-scale ER projects, and the extent to which these programs affect the state of the vegetation-soil moisture interactions of the ecosystems is still being debated [79]. This study applied the BFAST to reveal NDVI variations during the period 2000–2015 and then used a nonlinear general additive model (GAM) in combination with a contribution rate analysis of residuals. This allowed us to quantify the relative contribution rates of anthropogenic impacts to the NDVI and TVDI in APENC.
First, the growing season NDVI time series showed a significant overall increasing trend during 2000–2015, which is consistent with the findings of previous studies [15,80]. Anthropogenic activity has been claimed to be the major factor driving vegetation changes in APENC, since large rates of change in vegetation showed non-significant correlations with precipitation [81]. Additionally, BFAST was able to detect abrupt changes in long-term trends in vegetation in response to the timing of peak of intervention activities. A series of state policies and projects (e.g., “the Grain-to-Green Program” in 1999, the “Law of the People’s Republic of China on Sand Prevention and Control” in 2002 and “Two Policies that Limit the Effects of Goat Grazing”) were developed and implemented to address environmental degradation in the late 1990s [10,82]. Here, we detected large scale breaks in 2003 and 2004, predominantly in the form of the Interrupted increase, corresponded to the official large scale start time of the projects. After 2006, the main goal of the Chinese government was rather to maintain the results of ecological restoration [82]. Once again, our results are in line with this narrative, as no large-scale abrupt shifts were detected. It is worth mentioning that many break points were observed in 2012, especially the trend type of “Negative reversal” accounted for 82% (9564 km2) of all break areas in this year. This coincides with the completion of the first stage of the projects after 2012.
Second, the analysis of the GAM and residuals indicated that climate factors explained 43% of vegetation variance in APENC (Figure 4a). This finding supports that APENC is highly sensitive to climate change [78,83]. Analysis of the climatic factors during the growing season over the past two decades showed significantly increased precipitation, decreased temperature and decreased solar radiation as well as decreased wind speed for the APENC (Supplementary Figure S5). Precipitation is the main limiting climatic factor affecting vegetation growth in these arid and semiarid regions [84,85], and an increased trends of precipitation likely resulted in sufficient soil moisture favouring vegetation growth [86]. Liu et al. found that the decreasing trends in temperature and solar radiation can reduce plant transpiration and soil evaporation [87], thereby, further positively affecting vegetation growth in APENC by establishing a surplus in the water balance. In addition, surface wind speed is a crucial factor influencing vegetation variation [88], as wind speed is generally negatively correlated with soil surface moisture [89]. The decrease in wind speed is, therefore, likely to also have a positive effect on vegetation growth. Overall, the natural condition, thereby, appears to have been more favourable for the growth and development of vegetation after 2000 [90].
However, further results from this study suggest that the impact of favourable climate conditions is by far the only explanation for the observed vegetation growth in large parts of the study area. Indeed, 56% of NDVI variance and 78% TVDI variance remained unexplained by climate (Figure 4) and can, therefore, be attributed to anthropogenic interventions. The attribution to human management is supported by other studies, including, notably, Zhang et al., who found that the existing vegetation cover in APENC has already exceed the climate-defined equilibrium vegetation cover, especially in the central and eastern regions [79]. Wang et al. used the PT-JPL model to simulate the ET under two scenarios of ER projects (implementation and absence of implementation) and found that revegetation substantially enhanced the ET in APENC [64]. Here, we used their ER_ET dataset to evaluate our results of the adverse effects of soil moisture consumption caused by anthropogenic activities in this study. We found a significant positive correlation between ER_ET and DC (R reached 0.7), which implies that our results estimated at the pixel-level reflect well the change in soil moisture caused by human management. There is always a trade-off between vegetation growth and soil moisture consumption [79]. While it was recognized that a number of ER activities have improved vegetation coverage resulting in increasing biomass [11], promoted carbon sequestration [12] and reduced soil loss [12,13], the corresponding impact of ER activities on soil moisture depletion should not be ignored. Here, we found that precipitation and volumetric soil water were lower in regions with high anthropogenic impacts on soil moisture depletion (DC) compared with in regions characterized by low DC. However, human-induced greening (PC) also co-occurred under high anthropogenic impact on soil moisture depletion (DC). In particular, in areas of high contribution to soil moisture consumption (DC4 and DC5), soil moisture was observed to be near the wilting point during critical periods of the growing season, thereby, being unable to support the growth of the new planting [16,91]. Zhao et al. have shown that, in the absence of ER projects, the impact on water resources from other anthropogenic activities is negligible because water management in the form of reservoir construction etc. is not common practice in APENC [18]. Therefore, our study confirms that massive revegetation may consume excessive resources of soil water through increased ET. This is particularly the case in grasslands where grass roots are concentrated in the upper 20 cm, hence, causing an overuse of soil moisture in the upper layer [16,92] and even soil desiccation [17,93].

4.2. Towards Sustainable Restoration Measures in APENC

Vegetation restoration in APENC is mostly focused on ameliorating the grassland and forest cover rather than transforming one land cover type into another [15]. Thus, one of the future main focal points of ER projects will be to thin the existing vegetation cover in areas with a high risk of soil water deficit, and any new revegetation project should be planted with native species characterized by less soil moisture consumption and lower density in plant cover [94]. Additionally, ongoing management is also an important aspect when conducting revegetation activities. Grazing management and control are used as a means to restore degraded grasslands. However, grazing control not only has low economic benefits but also wastes a large amount of forage resources, which is discouraging to farmers [15]. The ecological benefits based on these water resource and economic costs may not be sustainable. To maintain the sustainability of vegetation, future ER strategies should depend on healthy plant–soil systems and should consider the balance between water supply and uptake, the availability of water, the balance between economic, ecological and social benefits and how it will influence the livelihoods of local people.

4.3. Advantage and Limitation of the Methodological Framework

Accurate quantification of the impacts of human management on vegetation and the associated soil water consumption is beneficial to build a sustainable plant–soil systems. The residual trend analysis (RESTREND) has been widely used to separate anthropogenic activities from climatic effects on vegetation by developing a linear climate–vegetation factors model [39,43,44,95]. However, the response of the vegetation to the external influence is complex and often a linear model cannot sufficiently reveal the nonlinear vegetation responses to different predictors [75]. GAM is non-parametric extension of linear model regressions, it supports non-Gaussian error distributions and nonlinear relationships between vegetation and external driving factors [40,76,77]. In this study, we combined the GAM model and the RESTREND method to decompose the contribution of climate and anthropogenic activities to NDVI and TVDI and identified the relative contribution rates of anthropogenic disturbances on vegetation and soil moisture [96,97].
Our findings are consistent with results suggested in other similar soil water deficit studies [15,18,79]. However, the accuracy of our study is not verified by in situ observations as spatially explicit data on soil water deficits or soil desiccation caused by anthropogenic activities is not available at the regional scale. It would have strengthened the study if a database on individual ER projects (type, extent, investment, duration etc.) existed for an evaluation of the results obtained here. Vegetation recovery and changes are strongly influenced by the spatial redistribution of soil moisture, which, in turn, is influenced by the soil characteristics concerning water holding capacity, soil-infiltrating processes and rainfall intercepting processes by vegetation canopies [98]. In the future, more comprehensive and spatially explicit survey data and remote sensing data at higher spatial resolutions are needed in conjunction with soil characteristics and vegetation types to better evaluate the results and improve the research capabilities. When we separated the anthropogenic influences on NDVI and TVDI via established GAM regressions, the response of climatic factors to vegetation changes was not considered. Wang et al. pointed out that the potential feedback of the LUCC on local climate may have reduced precipitation in APENC [51], and, in this case, the anthropogenic influence on vegetation and soil moisture might be underestimated in this study.

5. Conclusions

This study provides a novel methodological framework to track non-sustainable restoration characterized by increased soil water deficits as result of large-scale ER projects. We used a piecewise linear model (BFAST) to detect trend shifts in time series of a satellite-based proxy for vegetation (NDVI) to assess spatio-temporal patterns in vegetation in APENC during 2000–2015. The result showed that BFAST is sensitive to vegetation variations and most areas experienced an interrupted increasing trend during the period of study, and the trend breakpoints mainly occurred before 2006 and in 2012, reflecting the periods of onset and termination of the majority of ER projects. Subsequently, we distinguished and quantified the effects of climate and anthropogenic influence on vegetation and soil moisture dynamics. Anthropogenic activity was found to be the major driving factor of vegetation variation (contribution rate of 56%) and soil moisture change (contribution rate of 78%). The increase in vegetation was found to be spatially linked with an increase in the consumption of soil water. Our results revealed areas that were at high risk of soil water depletion due to excessive anthropogenic management of the vegetation as an attempt to counter ongoing land degradation. The methodological workflow developed here proved useful in analysing the coupling between vegetation growth and soil moisture deficits. This approach is beneficial for decision-making on future sustainable water resource management and ecological restoration policies.

Supplementary Materials

The following are available online at https://www.mdpi.com/article/10.3390/rs13245031/s1, Figure S1. The soil texture classes (a) and distribution of soil types (b) in APENC. Figure S2. The linear trend of ER_ET changes during 2000 to 2015 in APENC. Figure S3. The difference between the linear model (LM) and the generalized additive model (GAM) in (a) fitting NDVI and (b) TVDI in the value of Akaike Information Criterion (AIC), similarly structured with the same climatic predictors of air temperature, precipitation, near surface wind speed and total downward solar radiation. Figure S4. The trend change types for the main soil types in APENC. Figure S5. (a) The temporal trend of the growing season accumulated precipitation, (b) growing season accumulated total downward solar radiation, (c) growing season mean temperature and (d) growing season mean near-surface wind speed. All analyses cover the period of 2000–2015.

Author Contributions

L.Y. implemented the data analysis and wrote the paper. S.H., R.F. and C.H. conceived the research, guided the implementation of the research and revised and finalized the manuscript, and C.H. was responsible for project administration. All authors have read and agreed to the published version of the manuscript.

Funding

This work was funded by the National Natural Science Foundation of China (Grant Numbers: 42030501; 41530752), and the China Scholarship Council (201906180066). S.H. was funded by the STEREOIII program of the Belgian Science Policy Office [U-TURN project, Grant Numbers: SR/00/339] and by VILLUM FONDEN [DRYTIP project; Grant Numbers: 37465].

Acknowledgments

We are sincerely thankful for the data support and constructive comments from Xuejin Wang, Yayong Xue, Xuliang Li and Jie Tian. We are grateful to the members of the Center for Dryland Water Resources Research and Watershed Science, Lanzhou University for their hard field work in instrument installation, data collection and laboratory analyses.

Conflicts of Interest

The authors declare no conflict of interest.

References

  1. Wang, Y.Q.; Shao, M.A.; Zhu, Y.J.; Liu, Z.P. Impacts of land use and plant characteristics on dried soil layers in different climatic regions on the Loess Plateau of China. Agric. For. Meteorol. 2011, 151, 437–448. [Google Scholar] [CrossRef]
  2. Jensen, M.; Wright, J.; Pratt, B. Estimating soil moisture depletion from climate, crop and soil data. Trans. ASAE. 1971, 14, 954–959. [Google Scholar] [CrossRef]
  3. Brocca, L.; Morbidelli, R.; Melone, F.; Moramarco, T. Soil moisture spatial variability in experimental areas of central Italy. J. Hydrol. 2007, 333, 356–373. [Google Scholar] [CrossRef]
  4. Jian, S.Q.; Zhao, C.Y.; Fang, S.M.; Yu, K. Effects of different vegetation restoration on soil water storage and water balance in the Chinese Loess Plateau. Agric. For. Meteorol. 2015, 206, 85–96. [Google Scholar] [CrossRef]
  5. Fu, W.; Huang, M.B.; Gallichand, J.; Shao, M.G. Optimization of plant coverage in relation to water balance in the Loess Plateau of China. Geoderma 2012, 173, 134–144. [Google Scholar] [CrossRef]
  6. Wang, L.; Wang, S.P.; Shao, H.B.; Wu, Y.J.; Wang, Q.J. Simulated water balance of forest and farmland in the hill and gully region of the Loess Plateau in China. Plant Biosyst. 2012, 146, 226–243. [Google Scholar] [CrossRef]
  7. Bai, X.; Jia, X.; Jia, Y.; Shao, M.; Hu, W. Modeling long-term soil water dynamics in response to land-use change in a semi-arid area. J. Hydrol. 2020, 585, 124824. [Google Scholar] [CrossRef]
  8. Bai, X.; Jia, X.; Zhao, C.; Shao, M. Artificial forest conversion into grassland alleviates deep-soil desiccation in typical grass zone on China’s Loess Plateau: Regional modeling. Agric. Ecosyst. Environ. 2021, 320, 107608. [Google Scholar] [CrossRef]
  9. Zhao, C.L.; Shao, M.A.; Jia, X.X.; Zhu, Y.J. Factors Affecting Soil Desiccation Spatial Variability in the Loess Plateau of China. Soil Sci. Soc. Am. J. 2019, 83, 266–275. [Google Scholar] [CrossRef]
  10. Liu, Q.F.; Zhang, Q.; Yan, Y.Z.; Zhang, X.F.; Niu, J.M.; Svenning, J.C. Ecological restoration is the dominant driver of the recent reversal of desertification in the Mu Us Desert (China). J. Clean Prod. 2020, 268, 10. [Google Scholar] [CrossRef]
  11. Tong, X.W.; Brandt, M.; Yue, Y.M.; Horion, S.; Wang, K.L.; De Keersmaecker, W.; Tian, F.; Schurgers, G.; Xiao, X.M.; Luo, Y.Q.; et al. Increased vegetation growth and carbon stock in China karst via ecological engineering. Nat. Sustain. 2018, 1, 44–50. [Google Scholar] [CrossRef]
  12. He, S.X.; Liang, Z.S.; Han, R.L.; Wang, Y.; Liu, G.B. Soil carbon dynamics during grass restoration on abandoned sloping cropland in the hilly area of the Loess Plateau, China. Catena 2016, 137, 679–685. [Google Scholar] [CrossRef]
  13. Duan, X.W.; Bai, Z.W.; Rong, L.; Li, Y.B.; Ding, J.H.; Tao, Y.Q.; Li, J.X.; Li, J.S.; Wang, W. Investigation method for regional soil erosion based on the Chinese Soil Loss Equation and high-resolution spatial data: Case study on the mountainous Yunnan Province, China. Catena 2020, 184, 14. [Google Scholar] [CrossRef]
  14. Huang, C.B.; Zhou, Z.X.; Peng, C.H.; Teng, M.J.; Wang, P.C. How is biodiversity changing in response to ecological restoration in terrestrial ecosystems? A meta-analysis in China. Sci. Total Environ. 2019, 650, 1–9. [Google Scholar] [CrossRef] [PubMed]
  15. Zhang, M.M.; Wu, X.Q. The rebound effects of recent vegetation restoration projects in Mu Us Sandy land of China. Ecol. Indic. 2020, 113, 10. [Google Scholar] [CrossRef]
  16. Deng, L.; Yan, W.M.; Zhang, Y.W.; Shangguan, Z.P. Severe depletion of soil moisture following land-use changes for ecological restoration: Evidence from northern China. For. Ecol. Manag. 2016, 366, 1–10. [Google Scholar] [CrossRef]
  17. Feng, X.M.; Li, J.X.; Cheng, W.; Fu, B.J.; Wang, Y.Q.; Lu, Y.H.; Shao, M.A. Evaluation of AMSR-E retrieval by detecting soil moisture decrease following massive dryland re-vegetation in the Loess Plateau, China. Remote Sens. Environ. 2017, 196, 253–264. [Google Scholar] [CrossRef]
  18. Zhao, M.; Geruo, A.; Zhang, J.E.; Velicogna, I.; Liang, C.Z.; Li, Z.Y. Ecological restoration impact on total terrestrial water storage. Nat. Sustain. 2021, 4, U56–U85. [Google Scholar] [CrossRef]
  19. Lu, C.X.; Zhao, T.Y.; Shi, X.L.; Cao, S.X. Ecological restoration by afforestation may increase groundwater depth and create potentially large ecological and water opportunity costs in arid and semiarid China. J. Clean Prod. 2018, 176, 1213–1222. [Google Scholar] [CrossRef]
  20. Liang, W.; Bai, D.; Wang, F.Y.; Fu, B.J.; Yan, J.P.; Wang, S.; Yang, Y.T.; Long, D.; Feng, M.Q. Quantifying the impacts of climate change and ecological restoration on streamflow changes based on a Budyko hydrological model in China’s Loess Plateau. Water Resour. Res. 2015, 51, 6500–6519. [Google Scholar] [CrossRef]
  21. Chen, L.D.; Huang, Z.L.; Gong, J.; Fu, B.J.; Huang, Y.L. The effect of land cover/vegetation on soil water dynamic in the hilly area of the loess plateau, China. Catena 2007, 70, 200–208. [Google Scholar] [CrossRef]
  22. Wang, Y.Q.; Shao, M.A.; Shao, H.B. A preliminary investigation of the dynamic characteristics of dried soil layers on the Loess Plateau of China. J. Hydrol. 2010, 381, 9–17. [Google Scholar] [CrossRef]
  23. Yang, Y.; Sun, H.; Han, Y.; Wu, Z.; Song, S.; Zhao, R. Effects of artificial vegetation restoration on soil physicochemical properties in southern edge of Mu Us Sandy Land. Agric. Sci. Technol. 2014, 15, 648. [Google Scholar]
  24. Zhang, Y.; Huang, M.B.; Lian, J.J. Spatial distributions of optimal plant coverage for the dominant tree and shrub species along a precipitation gradient on the central Loess Plateau. Agric. For. Meteorol. 2015, 206, 69–84. [Google Scholar] [CrossRef]
  25. Peng, J.; Niesel, J.; Loew, A.; Zhang, S.Q.; Wang, J. Evaluation of Satellite and Reanalysis Soil Moisture Products over Southwest China Using Ground-Based Measurements. Remote Sens. 2015, 7, 15729–15747. [Google Scholar] [CrossRef] [Green Version]
  26. Njoku, E.G. Theory for passive microwave remote-sensing of near-surface soil-moisture. J. Geophys. Res. 1977, 82, 3108–3118. [Google Scholar] [CrossRef]
  27. Colliander, A.; Chan, S.; Kim, S.B.; Das, N.; Yueh, S.; Cosh, M.; Bindlish, R.; Jackson, T.; Njoku, E. Long term analysis of PALS soil moisture campaign measurements for global soil moisture algorithm development. Remote Sens. Environ. 2012, 121, 309–322. [Google Scholar] [CrossRef]
  28. Holzman, M.E.; Rivas, R.; Piccolo, M.C. Estimating soil moisture and the relationship with crop yield using surface temperature and vegetation index. Int. J. Appl. Earth Obs. Geoinf. 2014, 28, 181–192. [Google Scholar] [CrossRef]
  29. Rahimzadeh-Bajgiran, P.; Omasa, K.; Shimizu, Y. Comparative evaluation of the Vegetation Dryness Index (VDI), the Temperature Vegetation Dryness Index (TVDI) and the improved TVDI (iTVDI) for water stress detection in semi-arid regions of Iran. ISPRS J. Photogramm. Remote Sens. 2012, 68, 1–12. [Google Scholar] [CrossRef]
  30. Sandholt, I.; Rasmussen, K.; Andersen, J. A simple interpretation of the surface temperature/vegetation index space for assessment of surface moisture status. Remote Sens. Environ. 2002, 79, 213–224. [Google Scholar] [CrossRef]
  31. Tagesson, T.; Horion, S.; Nieto, H.; Fornies, V.Z.; Gonzalez, G.M.; Bulgin, C.E.; Ghent, D.; Fensholt, R. Disaggregation of SMOS soil moisture over West Africa using the Temperature and Vegetation Dryness Index based on SEVIRI land surface parameters. Remote Sens. Environ. 2018, 206, 424–441. [Google Scholar] [CrossRef] [Green Version]
  32. Yuan, L.N.; Li, L.; Zhang, T.; Chen, L.Q.; Zhao, J.L.; Hu, S.; Cheng, L.; Liu, W.Q. Soil Moisture Estimation for the Chinese Loess Plateau Using MODIS-derived ATI and TVDI. Remote Sens. 2020, 12, 3040. [Google Scholar] [CrossRef]
  33. Chen, J.A.; Wang, C.Z.; Jiang, H.; Mao, L.X.; Yu, Z.R. Estimating soil moisture using Temperature-Vegetation Dryness Index (TVDI) in the Huang-huai-hai (HHH) plain. Int. J. Remote Sens. 2011, 32, 1165–1177. [Google Scholar] [CrossRef]
  34. Kwon, Y.-J.; Ryu, S.; Cho, J.; Lee, Y.-W.; Park, N.-W.; Chung, C.-Y.; Hong, S. Infrared Soil Moisture Retrieval Algorithm Using Temperature-Vegetation Dryness Index and Moderate Resolution Imaging Spectroradiometer Data. Asia-Pac. J. Atmos. Sci. 2020, 56, 275–289. [Google Scholar] [CrossRef]
  35. Zhao, H.; Li, Y.; Chen, X.; Wang, H.; Yao, N.; Liu, F. Monitoring monthly soil moisture conditions in China with temperature vegetation dryness indexes based on an enhanced vegetation index and normalized difference vegetation index. Theor. Appl. Climatol. 2021, 143, 159–176. [Google Scholar] [CrossRef]
  36. Li, Z.G.; Wang, Y.L.; Zhou, Q.B.; Wu, J.S.; Peng, J.; Chang, H.F. Spatiotemporal variability of land surface moisture based on vegetation and temperature characteristics in Northern Shaanxi Loess Plateau, China. J. Arid. Environ. 2008, 72, 974–985. [Google Scholar] [CrossRef]
  37. Ge, W.; Deng, L.; Wang, F.; Han, J. Quantifying the contributions of human activities and climate change to vegetation net primary productivity dynamics in China from 2001 to 2016. Sci. Total Environ. 2021, 773, 145648. [Google Scholar] [CrossRef]
  38. Evans, J.; Geerken, R. Discrimination between climate and human-induced dryland degradation. J. Arid. Environ. 2004, 57, 535–554. [Google Scholar] [CrossRef]
  39. Xue, Y.Y.; Zhang, B.Q.; He, C.S.; Shao, R. Detecting Vegetation Variations and Main Drivers over the Agropastoral Ecotone of Northern China through the Ensemble Empirical Mode Decomposition Method. Remote Sens. 2019, 11, 1860. [Google Scholar] [CrossRef] [Green Version]
  40. Wu, J.S.; Li, M.; Zhang, X.Z.; Fiedler, S.; Gao, Q.Z.; Zhou, Y.T.; Cao, W.F.; Hassan, W.; Ciprian, M.; Tarolli, P.; et al. Disentangling climatic and anthropogenic contributions to nonlinear dynamics of alpine grassland productivity on the Qinghai-Tibetan Plateau. J. Environ. Manag. 2021, 281, 10. [Google Scholar] [CrossRef]
  41. Li, X.B.; Li, R.H.; Li, G.Q.; Wang, H.; Li, Z.F.; Li, X.; Hou, X.Y. Human-induced vegetation degradation and response of soil nitrogen storage in typical steppes in Inner Mongolia, China. J. Arid. Environ. 2016, 124, 80–90. [Google Scholar] [CrossRef]
  42. Wessels, K.J.; van den Bergh, F.; Scholes, R.J. Limits to detectability of land degradation by trend analysis of vegetation index data. Remote Sens. Environ. 2012, 125, 10–22. [Google Scholar] [CrossRef]
  43. Radda, I.A.; Kumar, B.M.; Pathak, P. Land Degradation in Bihar, India: An Assessment Using Rain-Use Efficiency and Residual Trend Analysis. Agric. Res. 2021, 10, 434–447. [Google Scholar] [CrossRef]
  44. Li, X.S.; Wang, H.Y.; Zhou, S.F.; Sun, B.; Gao, Z.H. Did ecological engineering projects have a significant effect on large-scale vegetation restoration in Beijing-Tianjin Sand Source Region, China? A remote sensing approach. Chin. Geogr. Sci. 2016, 26, 216–228. [Google Scholar] [CrossRef] [Green Version]
  45. Runnstrom, M.C. Rangeland development of the Mu Us sandy land in semiarid China: An analysis using landsat and NOAA remote sensing data. Land Degrad. Dev. 2003, 14, 189–202. [Google Scholar] [CrossRef]
  46. Tian, H.J.; Cao, C.X.; Chen, W.; Bao, S.N.; Yang, B.; Myneni, R.B. Response of vegetation activity dynamic to climatic change and ecological restoration programs in Inner Mongolia from 2000 to 2012. Ecol. Eng. 2015, 82, 276–289. [Google Scholar] [CrossRef]
  47. Zhang, Z.H.; Huisingh, D. Combating desertification in China: Monitoring, control, management and revegetation. J. Clean Prod. 2018, 182, 765–775. [Google Scholar] [CrossRef]
  48. Ma, Z.H.; Yan, N.N.; Wu, B.F.; Stein, A.; Zhu, W.W.; Zeng, H.W. Variation in actual evapotranspiration following changes in climate and vegetation cover during an ecological restoration period (2000–2015) in the Loess Plateau, China. Sci. Total Environ. 2019, 689, 534–545. [Google Scholar] [CrossRef]
  49. Yang, L.; Wei, W.; Chen, L.D.; Chen, W.L.; Wang, J.L. Response of temporal variation of soil moisture to vegetation restoration in semi-arid Loess Plateau, China. Catena 2014, 115, 123–133. [Google Scholar] [CrossRef]
  50. Xu, X.; Li, X.; Wang, X.; He, C.; Tian, W.; Tian, J.; Yang, L. Estimating daily evapotranspiration in the agricultural-pastoral ecotone in Northwest China: A comparative analysis of the Complementary Relationship, WRF-CLM4. 0, and WRF-Noah methods. Sci. Total Environ. 2020, 729, 138635. [Google Scholar] [CrossRef]
  51. Wang, X.J.; Zhang, B.Q.; Xu, X.F.; Tian, J.; He, C.S. Regional water-energy cycle response to land use/cover change in the agro-pastoral ecotone, Northwest China. J. Hydrol. 2020, 580, 16. [Google Scholar] [CrossRef]
  52. Liu, Q.; Zhao, Y.; Zhang, X.; Buyantuev, A.; Niu, J.; Wang, X. Spatiotemporal Patterns of Desertification Dynamics and Desertification Effects on Ecosystem Services in the Mu Us Desert in China. Sustainability 2018, 10, 589. [Google Scholar] [CrossRef] [Green Version]
  53. Shi, X.; Yu, D.; Warner, E.; Pan, X.; Petersen, G.; Gong, Z.; Weindorf, D. Soil database of 1:1,000,000 digital soil survey and reference system of the Chinese genetic soil classification system. Soil Surv. Horiz. 2004, 45, 129–136. [Google Scholar] [CrossRef]
  54. Cao, Q.; Yu, D.; Georgescu, M.; Han, Z.; Wu, J. Impacts of land use and land cover change on regional climate: A case study in the agro-pastoral transitional zone of China. Environ. Res. Lett. 2015, 10, 124025. [Google Scholar] [CrossRef]
  55. Abbas, S.; Nichol, J.E.; Qamer, F.M.; Xu, J. Characterization of Drought Development through Remote Sensing: A Case Study in Central Yunnan, China. Remote Sens. 2014, 6, 4998–5018. [Google Scholar] [CrossRef] [Green Version]
  56. Pettorelli, N.; Vik, J.O.; Mysterud, A.; Gaillard, J.-M.; Tucker, C.J.; Stenseth, N.C. Using the satellite-derived NDVI to assess ecological responses to environmental change. Trends Ecol. Evol. 2005, 20, 503–510. [Google Scholar] [CrossRef] [PubMed]
  57. Wan, Z. New refinements and validation of the MODIS land-surface temperature/emissivity products. Remote Sens. Environ. 2008, 112, 59–74. [Google Scholar] [CrossRef]
  58. Zhu, X.; He, H.S.; Zhang, S.; Dijak, W.D.; Fu, Y. Interactive effects of climatic factors on seasonal vegetation dynamics in the central Loess Plateau, China. Forests 2019, 10, 1071. [Google Scholar] [CrossRef] [Green Version]
  59. Ning, J.; Liu, J.; Kuang, W.; Xu, X.; Zhang, S.; Yan, C.; Li, R.; Wu, S.; Hu, Y.; Du, G. Spatiotemporal patterns and characteristics of land-use change in China during 2010–2015. J. Geogr. Sci. 2018, 28, 547–562. [Google Scholar] [CrossRef] [Green Version]
  60. USDA. Soil Mechanics Level I. In Module 3–USDA Textural Soil Classification. Study Guide. Available online: https://www.nrcs.usda.gov/Internet/FSE_DOCUMENTS/stelprdb1044818.pdf (accessed on 20 November 2021).
  61. Shi, X.; Yu, D.; Xu, S.; Warner, E.D.; Wang, H.; Sun, W.; Zhao, Y.; Gong, Z. Cross-reference for relating Genetic Soil Classification of China with WRB at different scales. Geoderma 2010, 155, 344–350. [Google Scholar] [CrossRef]
  62. Liu, Q.; Fu, Y.S.H.; Zeng, Z.Z.; Huang, M.T.; Li, X.R.; Piao, S.L. Temperature, precipitation, and insolation effects on autumn vegetation phenology in temperate China. Glob. Chang. Biol. 2016, 22, 644–655. [Google Scholar] [CrossRef]
  63. Yang, K.; He, J. China Meteorological Forcing Dataset (1979–2018). 2019. Available online: https://data.tpdc.ac.cn/en/data/8028b944-daaa-4511-8769-965612652c49/ (accessed on 21 October 2021).
  64. Wang, X.; Zhang, B.; Li, F.; Li, X.; Li, X.; Wang, Y.; Shao, R.; Tian, J.; He, C. Vegetation Restoration Projects Intensify Intraregional Water Recycling Processes in the Agro-Pastoral Ecotone of Northern China. J. Hydrometeorol. 2021, 22, 1385–1403. [Google Scholar] [CrossRef]
  65. Walker, E.; García, G.A.; Venturini, V.; Carrasco, A. Regional evapotranspiration estimates using the relative soil moisture ratio derived from SMAP products. Agric. Water Manag. 2019, 216, 254–263. [Google Scholar] [CrossRef]
  66. Shao, R.; Zhang, B.; Su, T.; Long, B.; Cheng, L.; Xue, Y.; Yang, W. Estimating the increase in regional evaporative water consumption as a result of vegetation restoration over the Loess Plateau, China. J. Geophys. Res. Atmos. 2019, 124, 11783–11802. [Google Scholar] [CrossRef]
  67. Verbesselt, J.; Hyndman, R.; Newnham, G.; Culvenor, D. Detecting trend and seasonal changes in satellite image time series. Remote Sens. Environ. 2010, 114, 106–115. [Google Scholar] [CrossRef]
  68. Verbesselt, J.; Zeileis, A.; Herold, M. Near real-time disturbance detection in terrestrial ecosystems using satellite image time series: Drought detection in Somalia. Work. Pap. Econ. Stat. 2011, 18. Available online: http://hdl.handle.net/10419/73481 (accessed on 5 May 2021).
  69. Horion, S.; Ivits, E.; De Keersmaecker, W.; Tagesson, T.; Vogt, J.; Fensholt, R. Mapping European ecosystem change types in response to land-use change, extreme climate events, and land degradation. Land Degrad. Dev. 2019, 30, 951–963. [Google Scholar] [CrossRef] [Green Version]
  70. De Jong, R.; Verbesselt, J.; Zeileis, A.; Schaepman, M.E. Shifts in global vegetation activity trends. Remote Sens. 2013, 5, 1117–1133. [Google Scholar] [CrossRef] [Green Version]
  71. Bernardino, P.N.; De Keersmaecker, W.; Fensholt, R.; Verbesselt, J.; Somers, B.; Horion, S. Global-scale characterization of turning points in arid and semi-arid ecosystem functioning. Glob. Ecol. Biogeogr. 2020, 29, 1230–1245. [Google Scholar] [CrossRef] [Green Version]
  72. Watts, L.M.; Laffan, S.W. Effectiveness of the BFAST algorithm for detecting vegetation response patterns in a semi-arid region. Remote Sens. Environ. 2014, 154, 234–245. [Google Scholar] [CrossRef]
  73. Horion, S.; Prishchepov, A.V.; Verbesselt, J.; de Beurs, K.; Tagesson, T.; Fensholt, R. Revealing turning points in ecosystem functioning over the Northern Eurasian agricultural frontier. Glob. Chang. Biol. 2016, 22, 2801–2817. [Google Scholar] [CrossRef] [PubMed]
  74. Liu, Y.; Wu, L.; Yue, H. Biparabolic NDVI-Ts space and soil moisture remote sensing in an arid and semi arid area. Can. J. Remote Sens. 2015, 41, 159–169. [Google Scholar] [CrossRef]
  75. Burkett, V.R.; Wilcox, D.A.; Stottlemyer, R.; Barrow, W.; Fagre, D.; Baron, J.; Price, J.; Nielsen, J.L.; Allen, C.D.; Peterson, D.L.; et al. Nonlinear dynamics in ecosystem response to climatic change: Case studies and policy implications. Ecol. Complex. 2005, 2, 357–394. [Google Scholar] [CrossRef] [Green Version]
  76. Lopez-Moreno, J.I.; Nogues-Bravo, D. A generalized additive model for the spatial distribution of snowpack in the Spanish Pyrenees. Hydrol. Process. 2005, 19, 3167–3176. [Google Scholar] [CrossRef]
  77. Mitchell, M.G.F.; Bennett, E.M.; Gonzalez, A. Strong and nonlinear effects of fragmentation on ecosystem service provision at multiple scales. Environ. Res. Lett. 2015, 10, 094014. [Google Scholar] [CrossRef]
  78. Qian, W.H.; Lin, X.; Zhu, Y.F.; Xu, Y.; Fu, J.L. Climatic regime shift and decadal anomalous events in China. Clim. Chang. 2007, 84, 167–189. [Google Scholar] [CrossRef]
  79. Zhang, S.L.; Yang, D.W.; Yang, Y.T.; Piao, S.L.; Yang, H.B.; Lei, H.M.; Fu, B.J. Excessive Afforestation and Soil Drying on China’s Loess Plateau. J. Geophys. Res. Biogeosci. 2018, 123, 923–935. [Google Scholar] [CrossRef]
  80. Xu, Z.W.; Hu, R.; Wang, K.X.; Mason, J.A.; Wu, S.Y.; Lu, H.Y. Recent greening (1981–2013) in the Mu Us dune field, north-central China, and its potential causes. Land Degrad. Dev. 2018, 29, 1509–1520. [Google Scholar] [CrossRef]
  81. Zhou, D.J.; Zhao, X.; Hu, H.F.; Shen, H.H.; Fang, J.Y. Long-term vegetation changes in the four mega-sandy lands in Inner Mongolia, China. Landsc. Ecol. 2015, 30, 1613–1626. [Google Scholar] [CrossRef]
  82. Delang, C.O.; Yuan, Z. China’s Grain for Green Program; Springer: Heidelberg, Germany, 2015. [Google Scholar]
  83. Chen, J.; Wei, H.; Jin, L.Y.; Chen, J.H.; Chen, S.Q.; Chen, F.H. A climatological northern boundary index for the East Asian summer monsoon and its interannual variability. Sci. China-Earth Sci. 2018, 61, 13–22. [Google Scholar] [CrossRef]
  84. Duan, H.C.; Yan, C.Z.; Tsunekawa, A.; Song, X.; Li, S.; Xie, J.L. Assessing vegetation dynamics in the Three-North Shelter Forest region of China using AVHRR NDVI data. Environ. Earth Sci. 2011, 64, 1011–1020. [Google Scholar] [CrossRef]
  85. Miao, L.J.; Jiang, C.; Xue, B.L.; Liu, Q.; He, B.; Nath, R.; Cui, X.F. Vegetation dynamics and factor analysis in arid and semi-arid Inner Mongolia. Environ. Earth Sci. 2015, 73, 2343–2352. [Google Scholar] [CrossRef]
  86. Liu, Z.J.; Liu, Y.S.; Li, Y.R. Anthropogenic contributions dominate trends of vegetation cover change over the farming-pastoral ecotone of northern China. Ecol. Indic. 2018, 95, 370–378. [Google Scholar] [CrossRef]
  87. Liu, Z.J.; Wu, C.Y.; Wang, S.S. Predicting Forest Evapotranspiration by Coupling Carbon and Water Cycling Based on a Critical Stomatal Conductance Model. IEEE J. Sel. Top. Appl. Earth Obs. Remote Sens. 2017, 10, 4469–4477. [Google Scholar] [CrossRef]
  88. Han, S.J.; Xu, D.; Wang, S.L. Decreasing potential evaporation trends in China from 1956 to 2005: Accelerated in regions with significant agricultural influence? Agric. For. Meteorol. 2012, 154, 44–56. [Google Scholar] [CrossRef]
  89. Meng, Z.J.; Dang, X.H.; Gao, Y.; Ren, X.M.; Ding, Y.L.; Wang, M. Interactive effects of wind speed, vegetation coverage and soil moisture in controlling wind erosion in a temperate desert steppe, Inner Mongolia of China. J. Arid Land 2018, 10, 534–547. [Google Scholar] [CrossRef] [Green Version]
  90. Xiu, L.N.; Yan, C.Z.; Li, X.S.; Qian, D.W.; Feng, K. Monitoring the response of vegetation dynamics to ecological engineering in the Mu Us Sandy Land of China from 1982 to 2014. Environ. Monit. Assess. 2018, 190, 18. [Google Scholar] [CrossRef] [PubMed]
  91. Jin, T.T.; Fu, B.J.; Liu, G.H.; Wang, Z. Hydrologic feasibility of artificial forestation in the semi-arid Loess Plateau of China. Hydrol. Earth Syst. Sci. 2011, 15, 2519–2530. [Google Scholar] [CrossRef] [Green Version]
  92. Deng, L.; Liu, G.B.; Shangguan, Z.P. Land-use conversion and changing soil carbon stocks in China’s ‘Grain-for-Green’ Program: A synthesis. Glob. Chang. Biol. 2014, 20, 3544–3556. [Google Scholar] [CrossRef] [PubMed]
  93. Bryan, B.A.; Gao, L.; Ye, Y.Q.; Sun, X.F.; Connor, J.D.; Crossman, N.D.; Stafford-Smith, M.; Wu, J.G.; He, C.Y.; Yu, D.Y.; et al. China’s response to a national land-system sustainability emergency. Nature 2018, 559, 193–204. [Google Scholar] [CrossRef]
  94. Chen, Y.P.; Wang, K.B.; Lin, Y.S.; Shi, W.Y.; Song, Y.; He, X.H. Balancing green and grain trade. Nat. Geosci. 2015, 8, 739–741. [Google Scholar] [CrossRef]
  95. Irisarri, J.G.N.; Texeira, M.; Oesterheld, M.; Veron, S.R.; Della Nave, F.; Paruelo, J.M. Discriminating the biophysical signal from human-induced effects on long-term primary production dynamics. The case of Patagonia. Glob. Chang. Biol. 2021. [Google Scholar] [CrossRef] [PubMed]
  96. Li, Y.R.; Cao, Z.; Long, H.L.; Liu, Y.S.; Li, W.J. Dynamic analysis of ecological environment combined with land cover and NDVI changes and implications for sustainable urban-rural development: The case of Mu Us Sandy Land, China. J. Clean Prod. 2017, 142, 697–715. [Google Scholar] [CrossRef]
  97. Liu, R.; Xiao, L.L.; Liu, Z.; Dai, J.C. Quantifying the relative impacts of climate and human activities on vegetation changes at the regional scale. Ecol. Indic. 2018, 93, 91–99. [Google Scholar] [CrossRef]
  98. Li, X. Influence of variation of soil spatial heterogeneity on vegetation restoration. Sci. China Ser. D Earth Sci. 2005, 48, 2020–2031. [Google Scholar] [CrossRef]
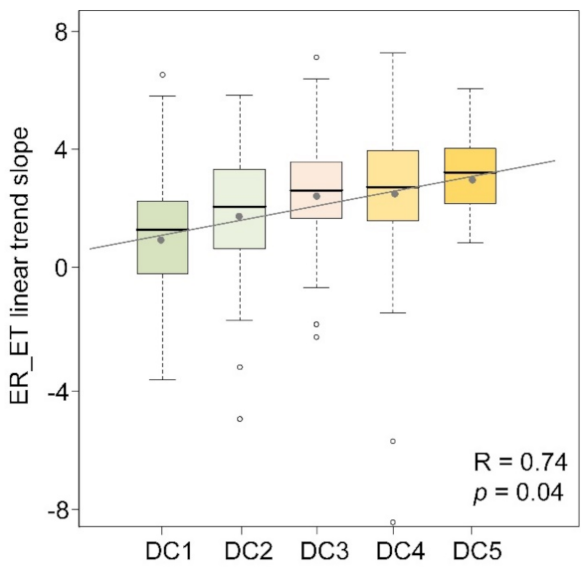
Figure 1. Geographic location of the semiarid agro-pastoral ecotone of northwest China (APENC) and land use and land cover types in 2010. Note: Data on land use was downloaded from the Resources and Environmental Data Cloud Platform at a spatial resolution of 1 km.
Remotesensing 13 05031 g001
Figure 2. (a) Change type, (b) statistical significance for the different segments and (c) timing of trend shift in the Normalized Difference Vegetation Index (NDVI). Only pixels with a significant (p < 0.05) change are shown.
Remotesensing 13 05031 g002
Figure 3. Trend breaks stratified by land cover: (a) change type, (b) trend significance and (c) timing of breakpoint. Trend change type stratified by main soil texture classes (d) in APENC.
Remotesensing 13 05031 g003
Figure 4. Spatial patterns of the relationship between NDVI, TVDI, climate and anthropogenic activity during 2000–2015 assessed from GAM. (a) The total climate contribution (%) to NDVI, (b) the total anthropogenic activity contribution (%) to NDVI, (c) the total climate contribution (%) to TVDI and (d) the total anthropogenic activity contribution (%) to TVDI. All plots cover the period during 2000–2015, only significant pixels (p < 0.05) are presented.
Remotesensing 13 05031 g004
Figure 5. Spatial distribution of the contribution rate (%) from anthropogenic activities on NDVI/TVDI dynamics during 2000–2015. (a) Positive contribution rate from anthropogenic activities to NDVI, (b) negative contribution rate from anthropogenic activities to NDVI, (c) wet contribution (WC) rate from anthropogenic activities to TVDI and (d) dry contribution (DC) rate from anthropogenic activities to TVDI. Only significant pixels (p < 0.05) are presented.
Remotesensing 13 05031 g005
Figure 6. The magnitude of ER_ET trend under different classes of DC during 2000−2015. The hollow dots represent outliers, and solid dots represent the average value of ER_ET under different classes of DC. The ER_ET data refer to Wang et al. [64].
Remotesensing 13 05031 g006
Figure 7. The impact of anthropogenic activities on soil moisture depletion. DC3, DC4 and D5 represent areas with the medium, moderately severe and severe soil moisture consumption caused by different levels of anthropogenically increased vegetation activities, respectively. PC3, PC4 and PC5 represent areas with medium, moderately strong and high degree of vegetation increases by anthropogenic activities. The combination of classes spanning from DC3_PC3 to DC5_PC5, represent an increasing soil moisture depletion due to anthropogenically increased vegetation activities.
Remotesensing 13 05031 g007
Table 1. Comparison of the contribution rate of anthropogenic activities to increased soil moisture (WC), the positive contribution rate of anthropogenic activities to vegetation growth (PC), the average annual precipitation in the growing season (APRE) and the average annual volumetric soil water in the growing season (ASW) under different contribution rates of anthropogenic activities to soil moisture consumption (DC).
DCWC (%)PC (%)APRE (mm)ASW (m3/m3)
DC1 (0–20%)87.9232.98293.590.20
DC2 (20–40%)59.2335.82298.780.20
DC3 (40–60%)30.6838.64306.010.19
DC4 (60–80%)10.9743.37291.130.18
DC5 (80–100%)3.6945.53278.670.17
Publisher’s Note: MDPI stays neutral with regard to jurisdictional claims in published maps and institutional affiliations.

