Article

Mapping Land Use Land Cover Changes and Their Determinants in the Context of a Massive Free Labour Mobilisation Campaign: Evidence from South Wollo, Ethiopia

1
Center for Food Security Studies, College of Development Studies, Addis Ababa University, Addis Ababa P.O. Box 1176, Ethiopia
2
Department of Urban and Regional Planning and Geo-Information Management, University of Twente, Hengelosestraat 99, P.O. Box 217, 7514 AE Enschede, The Netherlands
3
Center for Environment and Sustainable Development, College of Development Studies, Addis Ababa University, Addis Ababa P.O. Box 1176, Ethiopia
*
Author to whom correspondence should be addressed.
Remote Sens. 2021, 13(24), 5078; https://doi.org/10.3390/rs13245078
Submission received: 12 October 2021 / Revised: 26 November 2021 / Accepted: 2 December 2021 / Published: 14 December 2021
(This article belongs to the Topic Climate Change and Environmental Sustainability)

Abstract

:
Northern Ethiopia is characterised by fragile mountain eco-systems that are highly susceptible to land degradation, impacting food security and livelihoods. This study appraises Land Use Land Cover Changes (LULCC) and their determinants from 2000 to 2020 in Dessie Zuria and Kutaber Woredas. It explores the LULCC and the key anthropogenic drivers of the change over the past 20 years through a mix of satellite imagery and a survey of local understandings. Six land use types (agriculture, forest, area closure, grazing, settlement and bare land) were mapped from satellite imagery that was acquired from Landsat 7 for the years 2000, 2005, and 2010, and Landsat 8 and OLI multispectral imageries for the years 2015 and 2020 with a spectral resolution of 30-m obtained from USGS. The results showed that agricultural land increased from 29.68% in 2000 to 35.77% in 2020.Furthermore, settlement and grazing lands enlarged from 5.95% and 6.04%, respectively, to 8.31% and 6.35% during the same period, while bare land increased from 9.89% to 10.92% in 2020. On the contrary, forest and area closure decreased from 18.45% and 29.99% to 17.8% and 17.38%, respectively. Meanwhile, population growth, unrestricted grazing, losing a sense of ownership of protected area closures and forests, lack of cooperation, using the free labour mobilisation schemes for government-induced agendas, weak enforcement of laws and bylaws, and engaging farmers for extended days on the campaign were prominent determinants of the changes. This research has implications for development actors across land management and food security towards implementing sustainable land management in the area and beyond.

Graphical Abstract

1. Introduction

The sustainability of natural resources has been seriously constrained by enormous land degradation in Ethiopia [1]. Land degradation has globally resulted in climate change, environmental hazards, loss of biodiversity and eco-systems, and, most importantly, has contributed to the abrupt rising of food prices and the recurrence of drought and food insecurity [2]. One-fourth of the Earth’s total land surface has been eroded, and the rate and extent of degradation have risen dramatically, making land degradation one of the most pressing challenges of our globe. Unless the situation is brought under control, 95% of the Earth’s land area might be degraded by 2050 [3]. 65 % of the eco-system of Earth has either been degraded or has been unsustainably exploited, and the degradation could become significantly worse in the next half-century [4].
Land degradation in Sub-Saharan Africa (SSA) is widespread. Sixty-five per cent of agricultural land is degraded due to wind and soil erosion, and 28% of the population lives in areas that are prone to land degradation. Specifically, 40% of the grassland, 26% of the forestland, and 12% of the cropland have severe land degradation [5]. In Ethiopia, the rate of deforestation and the extent of forest resource degradation is at a critical stage. Many interwoven and interlaced factors like the demand for farmland, free grazing, an elevated need for fuelwood, and the expansion of settlements are prominent causes of the current high rate of land degradation [6,7]. Global assessment of land degradation report that more than 26% of the country has already been degraded [8]. According to the EFCCC (2018) report, the forest degradation rate extends above 92,000 ha/year, which remains incomparable with the annual replacement rate, 19,000 ha/year [9]. The phenomenon has further exacerbated soil degradation, resulting in nutrient depletion, poor soil fertility, and low agricultural productivity. Annual soil loss increased from 1,493,000,000 tons in 2007 to 2,136,940,683 tons in 2013 [9]. The north-eastern part of the country suffered from all of the devastating effects of land degradation; it remains one of the country’s famine corridors, where meteorological drought leading to precarious food insecurity remains the norm [9,10].
Land degradation is negatively correlated with food security; Soil fertility decline and nutrient mining leads to reduced agricultural productivity and, thus, translate to food insecurity [2]. Many undernourished people are found in SSA [11]. According to Lefroy and others, in West Africa, particularly in areas of high land degradation, the proportion of children who die before the age of five is more than 30%. The country has been unable to feed its population properly from domestic production, resulting in chronic and transitory food insecurity [10]. Therefore, due to the multifaceted effects of land degradation, tenure insecurity, and high population growth, 32% of Ethiopians are food insecure and need external assistance [12]. The same source revealed that Ethiopia has the highest undernourishment/hunger rate, with 32.1 million people affected. Thus, this places the country as the fourth African country, scoring 37.1% in undernourishment.
Cognisant of this, the Government of Ethiopia (GoE) and other development agencies have tried to halt the land degradation problem. Considerable resources have been mobilised to manage the farmlands’ sustainability and promote agricultural productivity with improved natural resource-conserving technologies. In 1970, the World Food Program introduced a MERT (Managing Environmental Resources to Enable Transitions to a more Sustainable Livelihoods) program, which aims at controlling land degradation by rehabilitating ruined lands and improving productivity [13,14,15]. Additionally, in 2000, a Sustainable Land Management Program (SLM) was launched and thus succeeded MERT to address Ethiopia’s three most significant development and environmental problems; low agricultural productivity, land degradation, and tenure insecurity. Development actors have introduced different soil and water conservation practices (SWCPs) through these programs. Natural and anthropogenic-induced LULCCs have been witnessed for the last five decades, especially in areas where these SWCPs were introduced [16].
Investigating LULCC are essential components in current strategies for managing natural resources and monitoring environmental changes [16]. A LULCC study using remote sensing (RS) and Geographic Information Systems (GIS) produced a maximum orientation result. RS and GIS data allow for more comprehensive studies of earth-system function, patterning, and change through time at the local, regional, and global scales. Multi-temporal RS datasets allow mapping and identifying landscape changes, effectively supporting sustainable landscape planning and management [17]. Change detection and monitoring entail evaluating differences in LULC between periods captured due to various environmental conditions and human actions [18]. The successful application of satellite remote sensing for LULC change detection requires a thorough understanding of landscape characteristics, imaging technologies, and techniques in connection to the analysis’ goal [17]. For an in-depth understanding of biophysical conditions, integrated, place-based research on LULC change necessitates a combination of agent-based systems and narrative perspectives. Integration of remote sensing data with information from local land users can provide better insights into LULCC [19]. Therefore, this study emphasises studying LULCCs and their determinants using information obtained from the community and the application of RS and GIS tools.
The principal action employed by the GoE and the community to revitalise the natural resource basis of each watershed is through a free labour mobilisation campaign, which involves mobilising and organising all capable farmers for 30–60 days in the watershed activities during the off-farm months of the year. The campaign took place for the last two decades, most specifically in areas assumed as degradation prone and resource-poor. Despite the program’s widespread implementation, the contribution of these campaigns to bring anticipated LULCC has not yet been studied and documented [20]. Furthermore, anthropogenic determinants assumed for the predicted change are neither identified nor categorised. Hence, different scholars have undertaken many studies focusing on LULCC using RS and GIS tools at various spatial and temporal dimensions [21,22,23]. Most researchers were entirely absorbed in LULC changes alone without showing the nexus to the free labour mobilisation campaign. Others have undertaken the studies without combining RS and community perception and knowledge. In this regard, the knowledge base we had is scanty and limited; it further calls for additional investigation.To this effect, this research was carried out using a combination of spatial and non-spatial data compounded by local understandings of the environment to explore how labour campaigns affect LULCC through RS and GIS techniques. With this understanding, this study answers two crucial questions: (i) what are the trends of LULC changes detected in the last twenty years? and (ii) what are the major anthropogenic and socio-economic determinants for the observed LULC changes?
The paper is composed of five parts. After this introduction, sections two, three, four and five will discuss methods, results, discussion, and conclusion and future work.

2. Materials and Methods

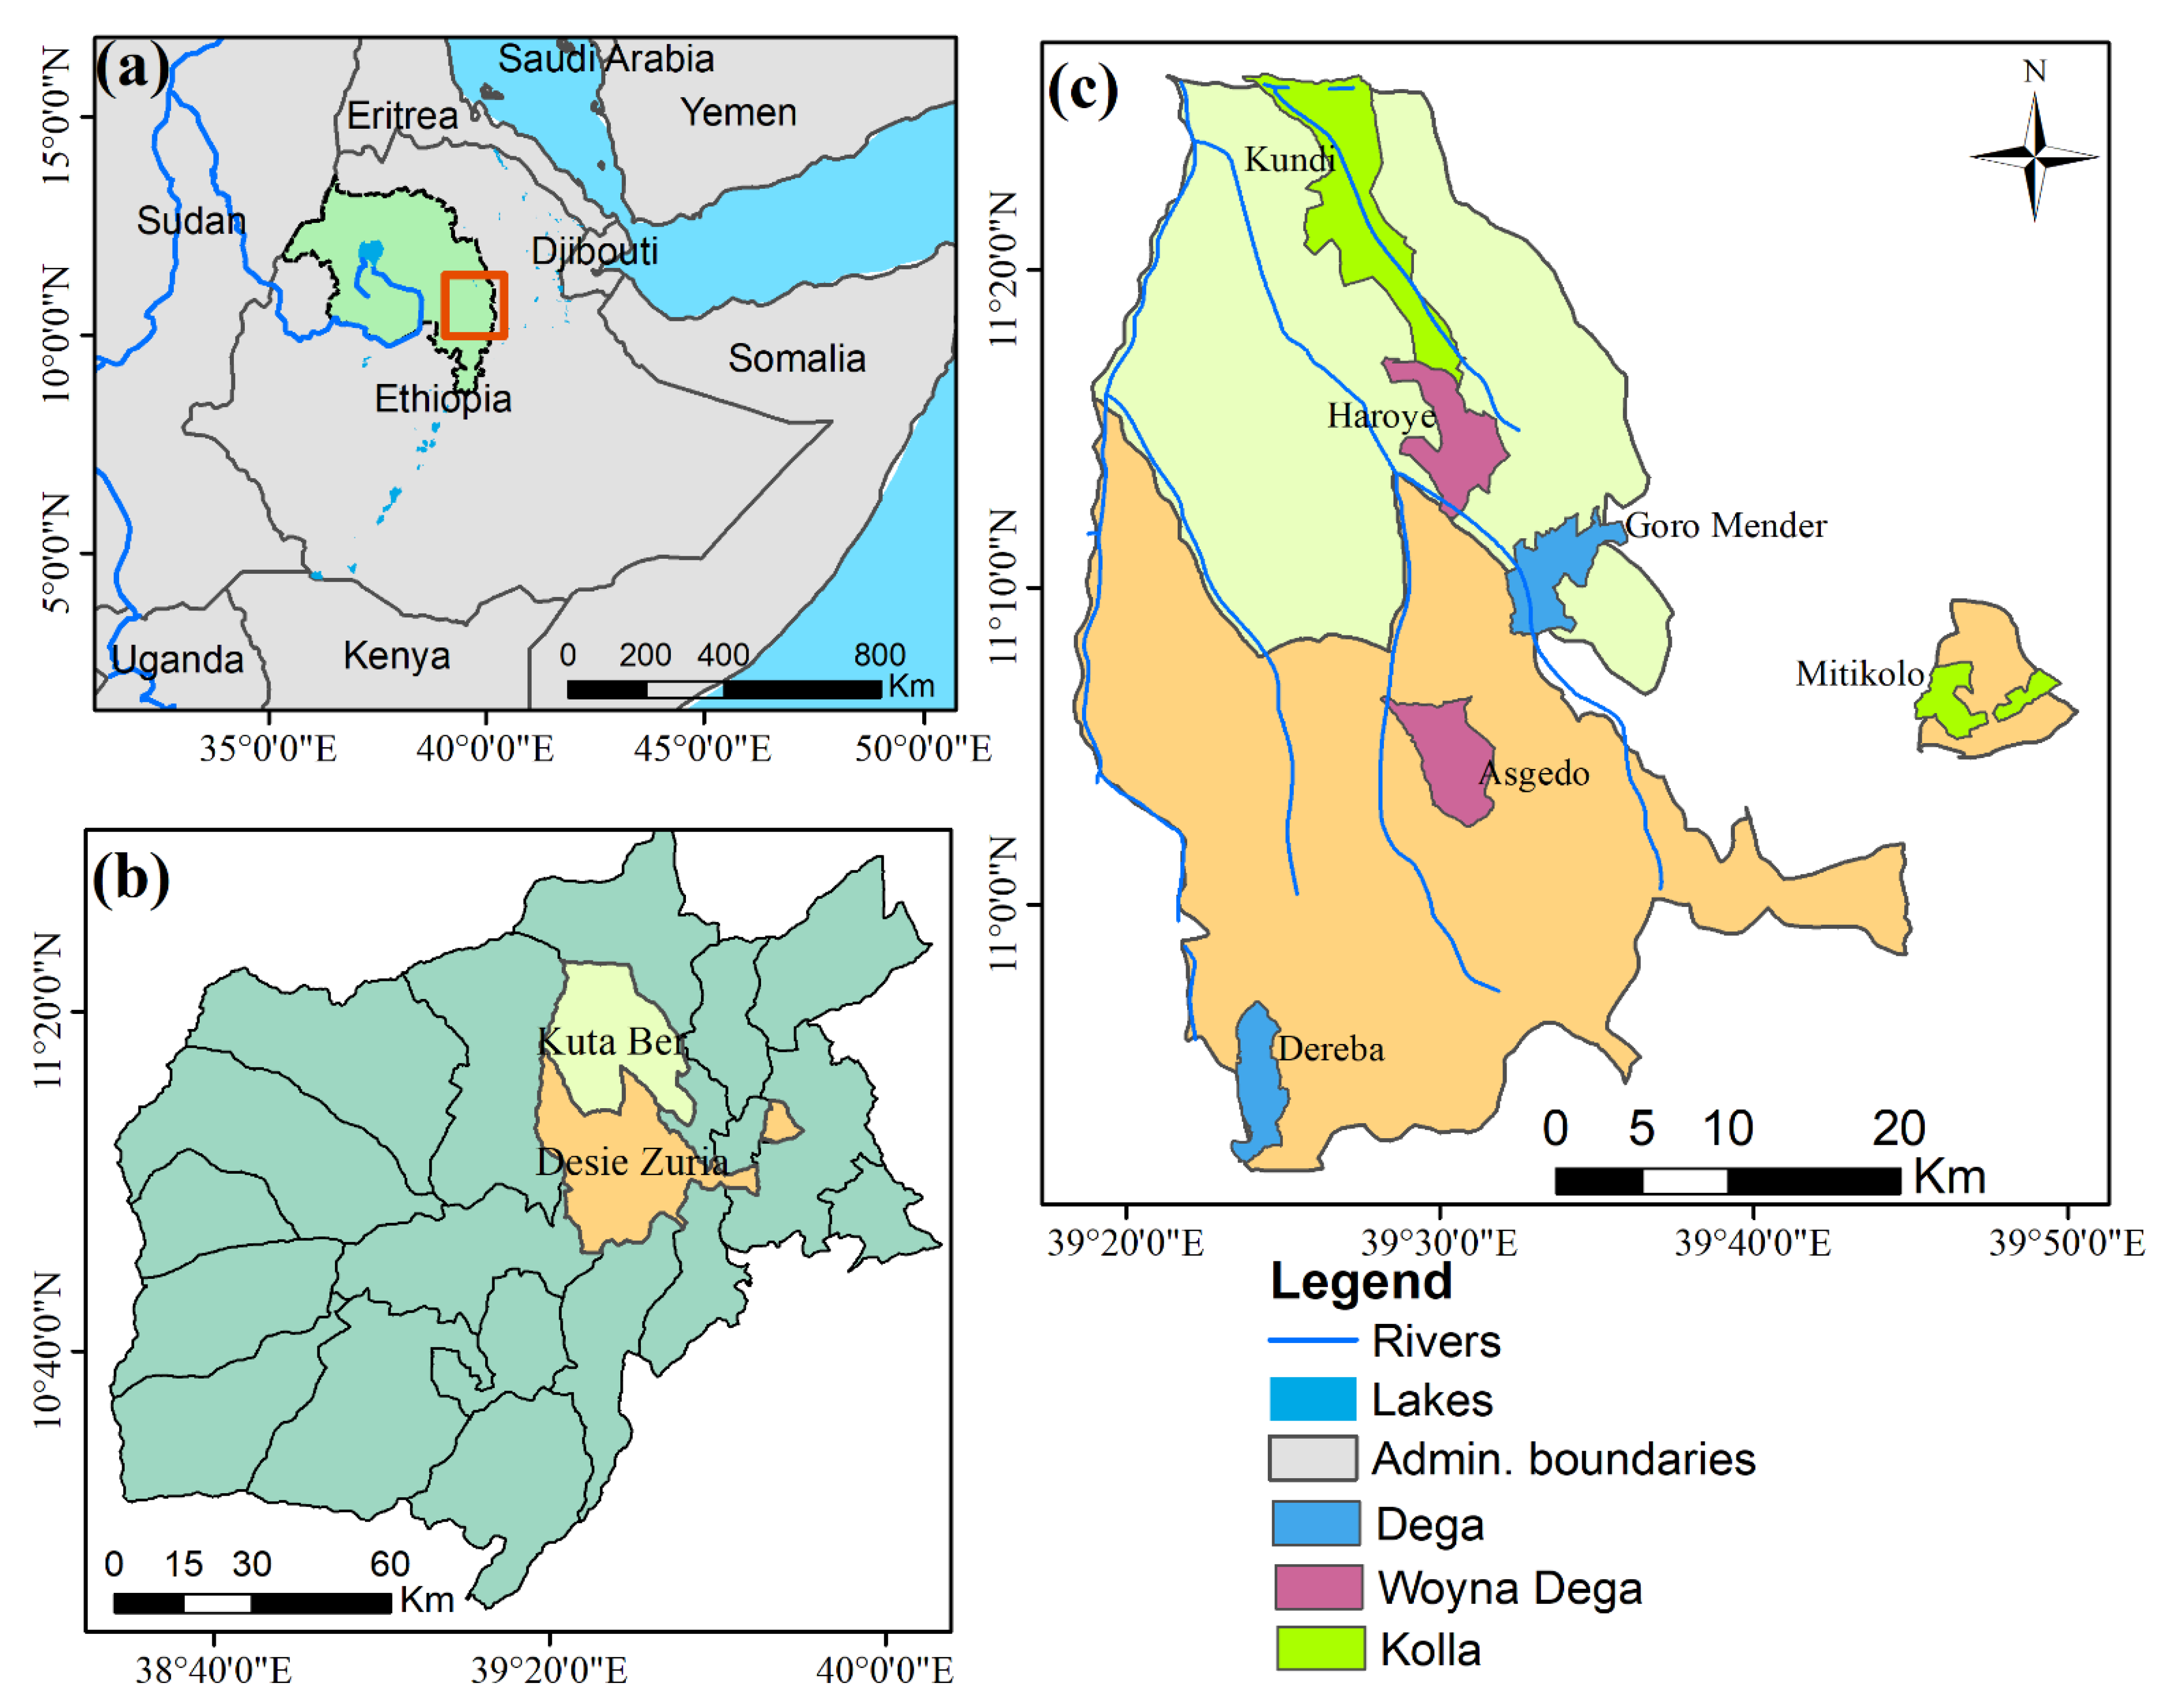
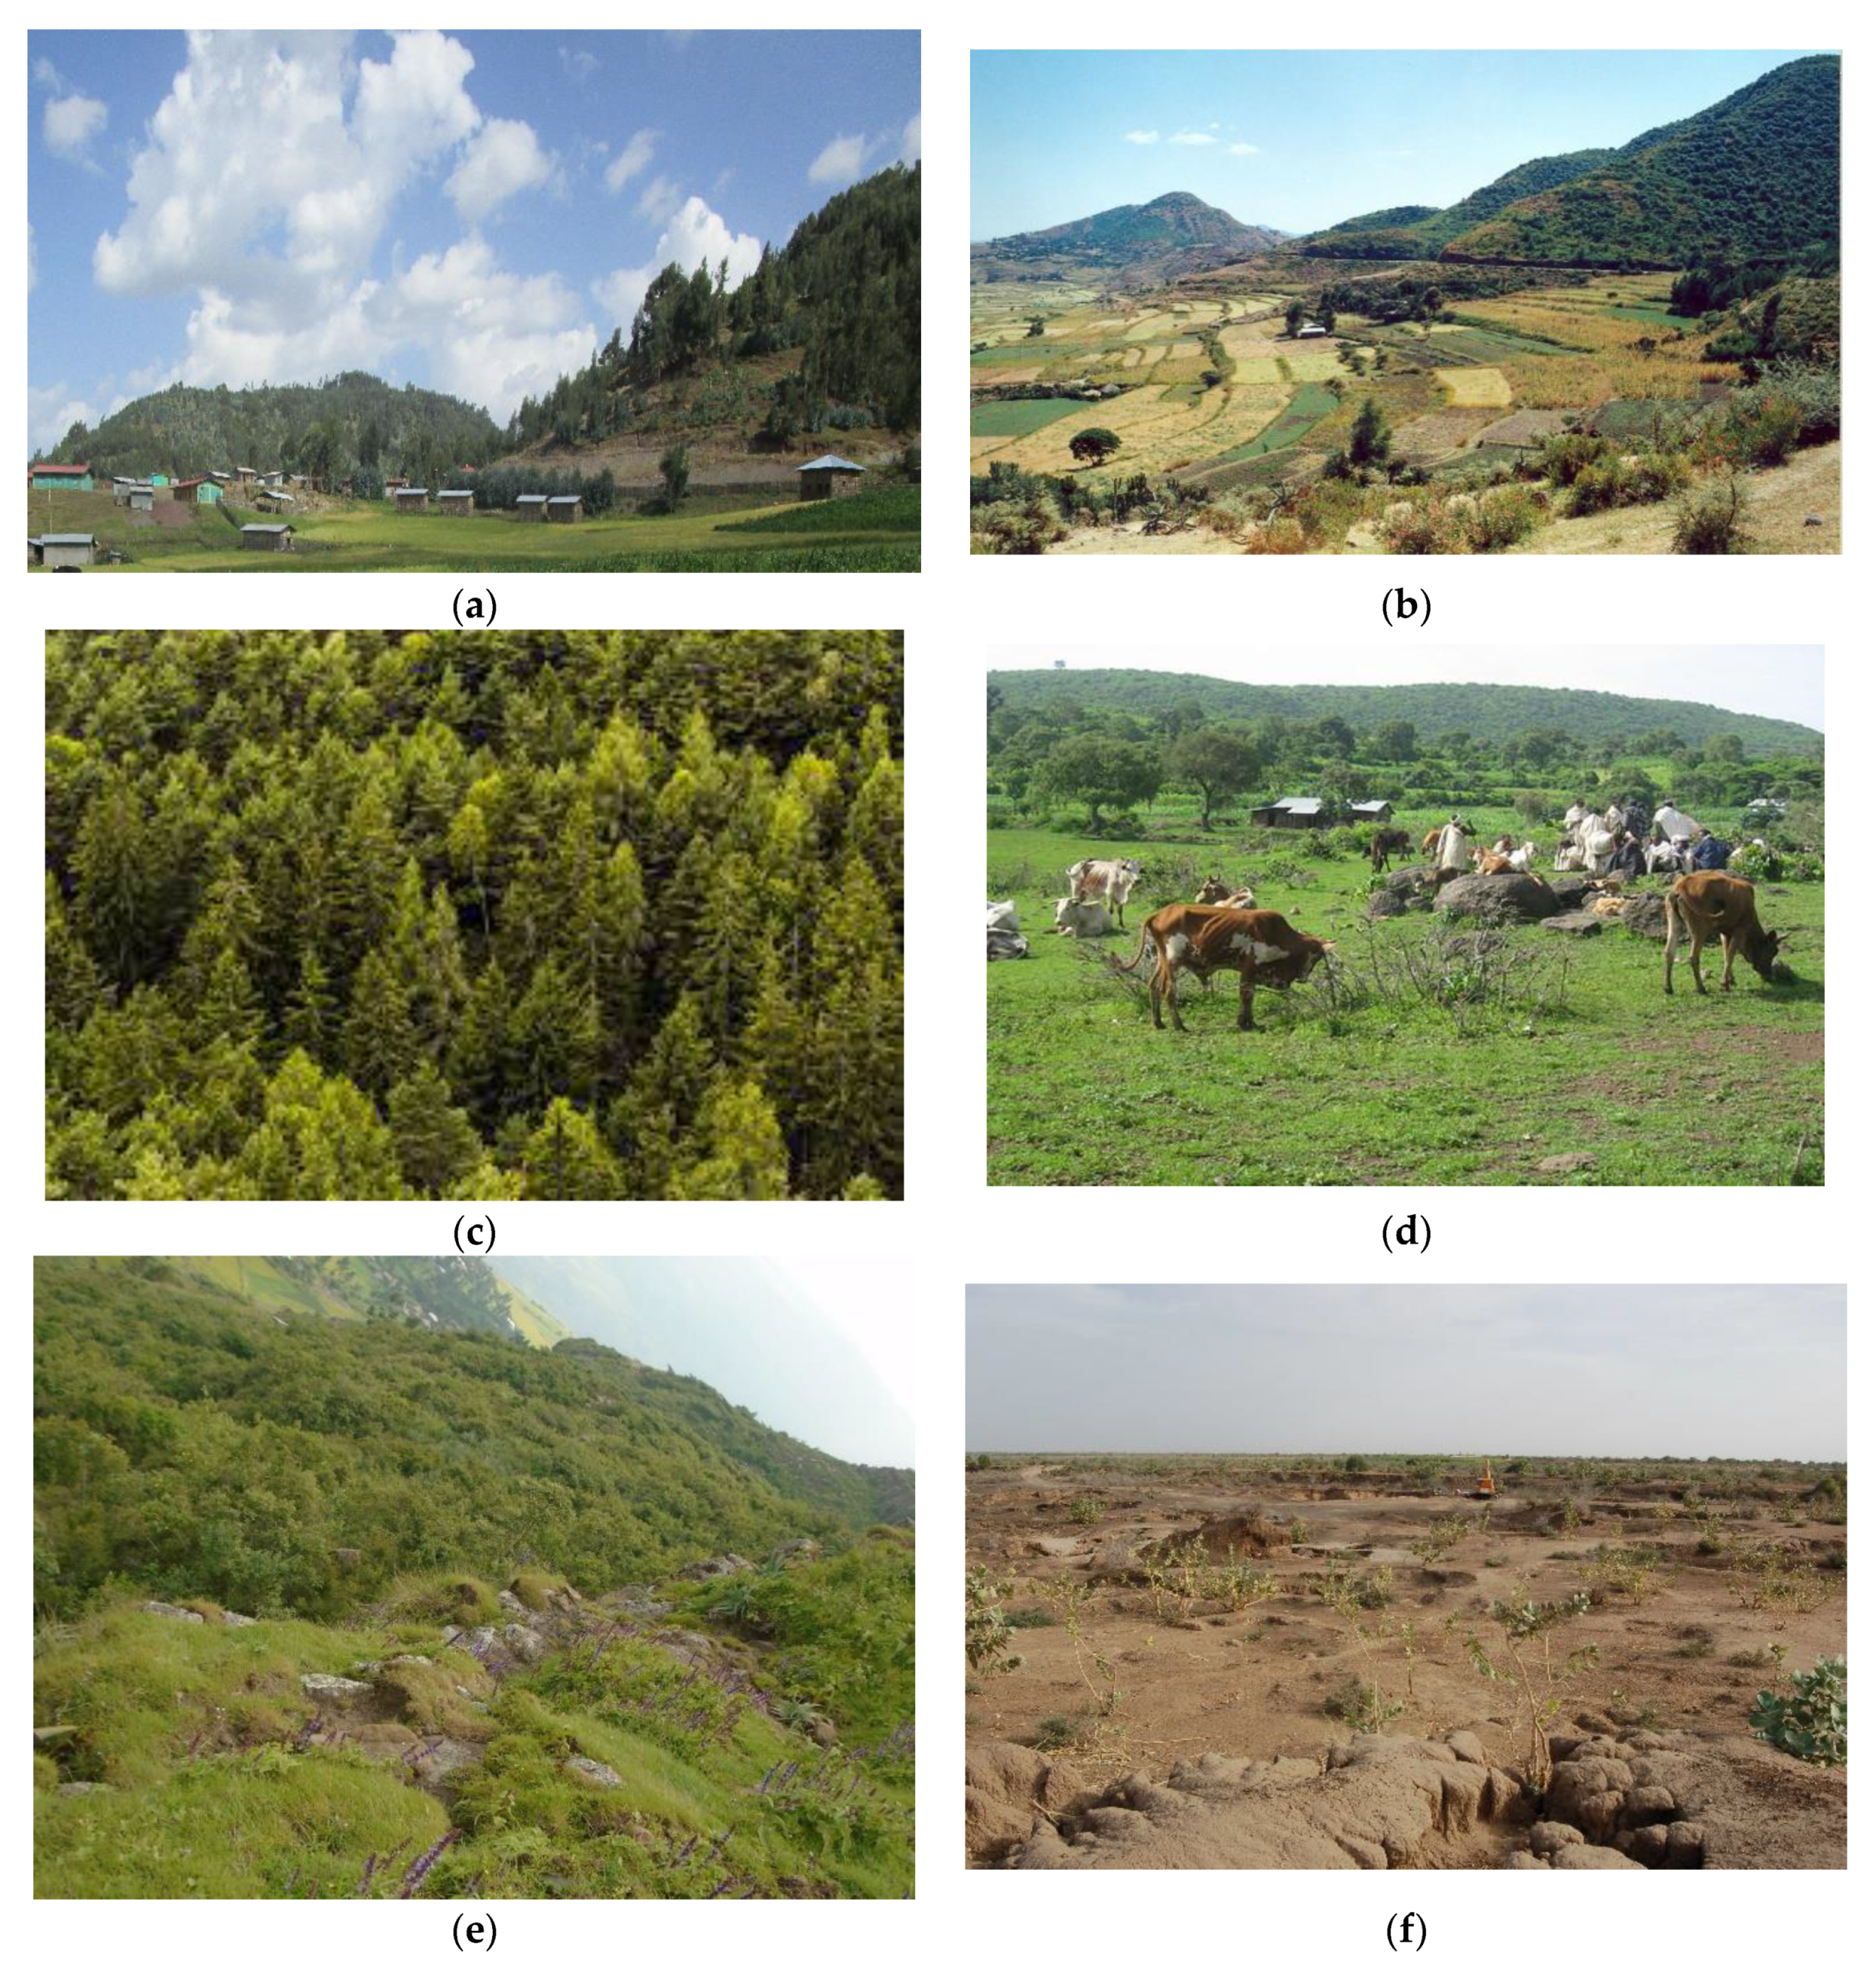
2.1. Description of the Study Area

Encompassing a 17,067.45 km2 area, South Wello is one of the ten zones (administrative tier of government below the regional state and above Woreda) in the Amhara National Regional State (ANRS). The zone lies around 11°8′ N and 39°38′ E (Figure 1). The agroecology [24,25] sub-divided into Kolla, Weyena Dega, Dega and Wunch, with 6.4%, 42%, 43.1%, and 8.1% coverage. Elevation in the zone varies between 927 to 4261 m.a.s.l with mean annual temperatures and rainfall of 15–20 °C and 500–900 mm, respectively. The zone’s overall population is estimated at 3,239,475 people, with a population density of 173.56 persons/km2 [26]. Two prominent river basins drain a significant part of the zone, Abay and Awash. These rivers drain 82.42% and 17.58% of the zone. Beshilo river, one of the significant tributary of the Blue Nile locally known as “Abay”, is the main feeder of the GERD (Great Ethiopian Renaissance Dam) drains significant parts of the zone. Soils in the zone are sandy, sandy clay, and sandy loam with moderate fertility.
According to the South Wello Agriculture and Natural Resource Management Bureau [27], agricultural productivity and food security attainment seem to be constrained by factors, such as erratic rain patterns, land degradation, land fragmentation, land sliding, crop pest and disease, deforestation, population growth, youth landlessness, and land sliding. It is common in the area to see farmers trying to grow as much as they can on their tiny patch of land. Rural households in the study area own an average of 0.7 ha of land. Compared with the national average of 1.01 ha, it is pretty tiny, and the average for the entire Amhara region is 0.7 ha. [27,28,29].
The research was carried out on two Woredas (a middle-level administrative tier of government, often equal to District, above Kebele and below zone) of South Wello; Dessie Zuria and Kutaber. The researchers purposefully identified six Kebeles from the three agro-ecologies of the two Woredas. Woredas and Kebeles were selected based on their susceptibility to land degradation, the presence of SWC interventions, and the free mobilisation campaigns. The biophysical and socio-economic characteristics of the two research Woredas are indicated in Table 1.

2.2. Research Approach, Data Collection and Method of Analysis

The choice of a research technique is primarily determined by the concept of the investigation issue or issue being addressed, the researcher’s close interactions, and the groups of onlookers for the study [30]. Any researcher interested in embracing an inquiry should concentrate on the problem instead of proposing the research approach [31]. This study employs a pragmatic approach of global thinking that seeks to answer issues that are, by definition, problem-centred, pluralistic, grounded in real-world practice, and the result of actions. Mixed methods research was chosen as a research methodology because it investigates the engagement and gathering of quantitative and qualitative data and employs various designs containing philosophical assumptions and theoretical orientations. According to [30], the basic premise of this application is that the combination of qualitative and quantitative approaches entails a more comprehensive understanding of the research subject than either approach alone. The research followed an exploratory path entirely based on collecting qualitative data first and proceeding with quantitative data. It utilised spatial and non-spatial data collected from primary and secondary sources. The study has triangulated the data obtained from two sources using different data verification tools. The overall data collection procedure, tools and type of data are indicated in the below flow chart (Figure 2).

2.3. Socio-Economic Data

Both qualitative and quantitative data types were collected using different instruments. Key informants interviews (KII), focus group discussions (FGD), household questionnaires, document reviews, and participatory rural appraisal (PRA) techniques, such as the pair-wise matrix and transact walk, were among the instruments deployed. The fieldwork was started by conducting KIIs [30,31]. Regarding the trends of LULCC and the determinants, progressive farmers, Kebele officials, Development Agents (DAs), subject matter specialists (SMSs) working for different Woreda offices (agriculture, land and natural resource management), and community representatives were interviewed. Notable LULC types were identified during these sessions, and fundamental causes responsible for the predicted changes were listed. In addition, discussants for the subsequent FGD sessions were chosen. Next to KII, twelve FGD sessions, two in each kebele, composed of 5–8 participants. Precautions were made while selecting participants for the discussion. To the extent possible, each FGD accommodated balances regarding age, religion, gender, wealth, education, and farmers’ status to be expressed by their participation in extension (model and non-model) and other community-based responsibilities. For the household survey, a total of 402 household heads from six Kebeles, three agro-ecologies and two Woredas were proportionally selected and interviewed (Table 2). In addition, transact walk was carried out in different watersheds, representing various agro-ecologies, and photos of representative land uses were taken for further triangulation. Six community workshops, one in each Kebele, were organised. Finally, the study triangulated and validated the opinions that were collected while conducting the previous tools. In addition, documents, including laws and bylaws, regional and federal proclamations and guidelines, reports, and memos, have been denoted. Data analysis was performed using SPSS and STATA software, and descriptive statistics, like percentages, graphs, figures, and tables, were created.

2.4. Spatial Data

2.4.1. Data Sets

For classification and change detection analysis, data from many sources were used. Free medium resolution satellite imageries (Landsat 7 and Landsat 8) were employed. LULC changes and satellite images from several sensors representing numerous periods were recorded. Images from the same season were chosen to limit the impact of seasonal differences on classification results [32,33,34]. Thus, ten cloud-free satellite images were acquired for the years 2000, 2005, 2010, 2015 and 2020. We downloaded the images on 19 October 2019 from the United States Geological Survey (USGS earth explorer (https://earthexplorer.usgs.gov, accessed on 10 October 2019) and GloVis (https://glovis.usgs.gov, accessed on 10 October 2019). The reflective Landsat bands with 30-m spatial resolution were used to obtain the multi-temporal LULCC information. To facilitate the classification process, aerial photos of 2014, ancillary data, like TopoMap, and the boundaries of rivers, towns, Woredas, and Kebeles, were utilised. Different socio-economic data were also used to robust the data set (Table 1). The detailed description of the dataset used in this study is shown in Table 3.

2.4.2. Ground Truth Data

Ground truth is a method by which the contents of “pixel” on a satellite image are compared with reality to verify the contents of the “pixel” on the image [35]. This allows supervised classification to assist accuracy done with the remote sensing software and thus minimise errors in the determining category. Interviewing local elders about known sites in the area provided reference data. In general, reference data were collected in two ways. First, the reference sample data were collected using GPS measurements. Therefore, 200 reference points were collected from the different LULC. The field survey was carried out from October 2019 to January 2020. In addition, 50 pieces of reference data were gathered by interpreting Google earth images and aerial photographs. A total of 250 reference points were acquired for the LULC type classification. Following the principles of [34,36,37], a minimum of 12 reference points (each point representing a minimum of 50 pixels) were developed for each LULC type. 75 % of the reference datasets were used for classification, and the remaining datasets were used for accuracy assessment. Reference points for LULC classification of the years 2000, 2005, 2010 and 2015 were extracted from historical Google earth imageries and aerial photographs.

2.4.3. Image Pre-Processing

A raw digital image cannot be used as a map unless corrected accordingly [37]. Radiometric and geometrical correction of raw data is essential. Two factors can cause a raw digital image’s geometrical distortion. The first distortion is systematic (predictable), while the second form is random (unpredictable). The former is caused by the Earth rotating from west to east, whereas the satellite rotates from north to south. As a result, the entire scene image has shrunk across the south to west and from north to east. As a result, the whole image of the scene has shrunk south to west and north to the east. This image can be rectified by gathering ground control points (GCP) with either a corrected image or a geo-referenced topographic map of the exact location. The visible, near-infrared (NIR), and shortwave infrared (SWIR) bands of Landsat 7 and 8 imageries were stacked using the ERDAS IMAGINE 10 software layer to produce a false colour composition image of the study area. The stacked image’s digital pixel number (DN) values were converted to radiance [38]. Following [39], the atmospheric correction was done to remove the atmospheric effects on the stacked images.

2.4.4. Image Processing and Classification

A thematic map is an image information representation that depicts the spatial distribution of a specific theme [37]. Remotely sensed earth data can be examined to derive meaningful information for a variety of uses. The overall objective of image classification procedures is to automatically categorise all pixels in an image into land use/land cover classes or themes [39,40,41]. All imageries were obtained during the dry season, where the phonological stages of plant covers were not too different between dates [42,43]. This period, which follows the harvests, may be considered the best time to distinguish the various LULC types.
Several factors influence the selection of an appropriate classifier. These include the accuracy of the topographic map, the rate and scale of human intervention, time required to train the classifier, and the classifier’s complexity [42]. The maximum likelihood algorithm classification (MLC) was applied to create a land-use classification of five different periods. MLC has typically been utilised as a starting point for remotely sensed data classification [44,45,46]. For example, [47] used MLC to assess the value of Landsat data for mapping forest rehabilitation. Many factors contribute to the most significant likelihood classifier’s popularity [48,49]. First, the maximum likelihood decision rule appears intuitively appealing since it selects the most “likely” option among possible outcomes. Second, the decision rule has a well-developed theoretical background, is mathematically tractable, and statistically desirable by many criteria for normally distributed data. Third, MLC can easily incorporate co-varying data, which is typical with satellite image data. Finally, maximum probability classifiers have been shown to work effectively across various land cover types, circumstances, and satellite systems [48,49,50]. Simple estimates of classifier accuracy, such as overall accuracy and the Kappa statistic, are described to demonstrate that the Kappa statistic is a better measure of classifier accuracy than overall accuracy. Nonetheless, as the accuracy assessments measured in the Kappa coefficient value span between 84.35% and 87.78%, MCL has demonstrated its relevance in measuring the LULC trends intended to be answered by this research.
Both unsupervised and supervised image classification approaches were used. The unsupervised classification was performed before the field survey, whereas the supervised image classification was computed after the training sample was collected in the field survey. After assigning the signature value (training area) in the supervised image classifications, a spatial merging approach was used to achieve a more homogenous appearance of the individual classes. This approach is used to merge neighbouring regions based on their spatial features [51]. Finally, using ERDAS IMAGINE 10, the classified images’ accuracy was assessed against the Kappa coefficient value where producer accuracy and user accuracy align side by side [45,46]. The LULC change classification procedure followed in the research is illustrated in Figure 3.
Based on the information obtained and the procedures followed, the study adopted a classification scheme consisting of six land-use types (agricultural land, forests, area closure, grazing land, settlement, and bare land) (Table 4 and Figure 4).

2.4.5. Change Detection

It is critical to investigate changes in land use/land cover to take appropriate management action. In remote sensing, change detection is used to examine the differences in an object’s status utilising multi-temporal spatial data sets. The premise behind satellite imagery is to detect changes in land use, and the land cover reflects themselves as variances in spectral brightness [18]. There are three primary methods of change detection in remote sensing: image subtraction, image ratio approach, and change detection after categorisation [52]. Image subtraction is used to detect changes in pixels based on their grey values. The image ratio method, as the name suggests, is used to determine the ratios of pixels in each band of an image [53]. As this is the most apparent method carried out after independent image processing and classification for different periods [18], post-classification change detection was selected for this particular work.

3. Results

3.1. Accuracy Assessment

Satellite imagery was acquired from Landsat 7 for 2000, 2005, and 2010 and from Landsat 8 for 2015 and 2020. OLI multispectral imageries used with a spectral resolution of 30-m were acquired from USGS (Table 3). An excellent thematic map gives an unbiased representation of the land cover of the region it portrays. In a statistical context, accuracy encompasses bias and correctness, and the distinction between the two is sometimes important as one may be alternated for the other [47,48]. The term accuracy is commonly used in thematic mapping from remotely sensed data to clarify the extent of the ‘correctness’ of a map or classification. As a result, this reflects accuracy and is commonly understood to represent the degree to which the resulting image classification coincides with reality or corresponds to the ‘truth’ [49,50]. Based on this assumption, the finding of the accuracy of LULC lies between 84.35–87.78% (Table 5) with a Kappa coefficient ranging from 0.82 to 0.86, which is under agreement with the pre-determined standard per individual LULC class, i.e., user accuracy (UA) and producer accuracy (PA) [45,51].

3.2. Change Matrix

The Change Matrix denotes a shift in area coverage. The Change Matrix indicates a change in area coverage measured by hectares and percentage for the five periods, 2000, 2005, 2010, 2015 and 2020, indicated below (Table 6).
The study revealed considerable LULC changes during 2000, 2005, 2010, 2015 and 2020 reference years. The satellite imagery result indicates increasing and decreasing changes in each of the six land-use types (Figure 5).
Among the six land use types identified (Table 6), settlement and agricultural land have shown a growth trend, and forests, grazing land, area closures, and bare land are found under shrinking trends. The primary means of livelihood and food in the study are generated from agriculture and its produces. Hence, agricultural land, a land-use type with the highest area coverage, constitutes a wide landmass at the initial and final years of the study, 2000–2020. In addition, the share of agricultural land use increased between the four periods. Agricultural land use increased enormously from 29.68% in 2000 to 35.77% in 2020. It has increased by 8.31%, 11.55%, 15.64% and 32.98% in the four periods (Table 6). The research revealed that the increments in this land-use resulted at the expense of other land uses, like forests, area closures, and grazing lands. Correspondingly, an area under settlement has shown a rise at a different degree in the four-period intervals. It increased from 9773.6 ha or 5.95% in 2000 to 10,586.61 ha or 6.4% in 2020. Bare land, which accounts for 9.89% of the total area, increased to 10.92 per cent in 2020. Changes between periods were calculated using the following formula [54].
Percentage   of   LULCC = Area   final   year Area   initial   year Area   initial   year
Nevertheless, other land uses, for instance, forest and area closure, decreased from 18.45% and 29.99% to17.8% and 17.38%. The satellite imagery data revealed a change in LULC between 2000 and 2020. Specifically, settlement, agriculture and grazing land have increased by 32 %, 16.51% and 19.97%. Contrary to this, forest and area closure decreased by 30 % and 19.73 %. Though insignificant, bare land has increased by 1.36 % (Table 7). Due to the diminishing trends of forest and area closure, other land uses, like agricultural land, settlement, and grazing land, have shown increasing tendencies. Despite a government-induced free labour mobilisation campaign, which takes place at the watershed level each year, the effect on bringing anticipated positive changes is insignificant.

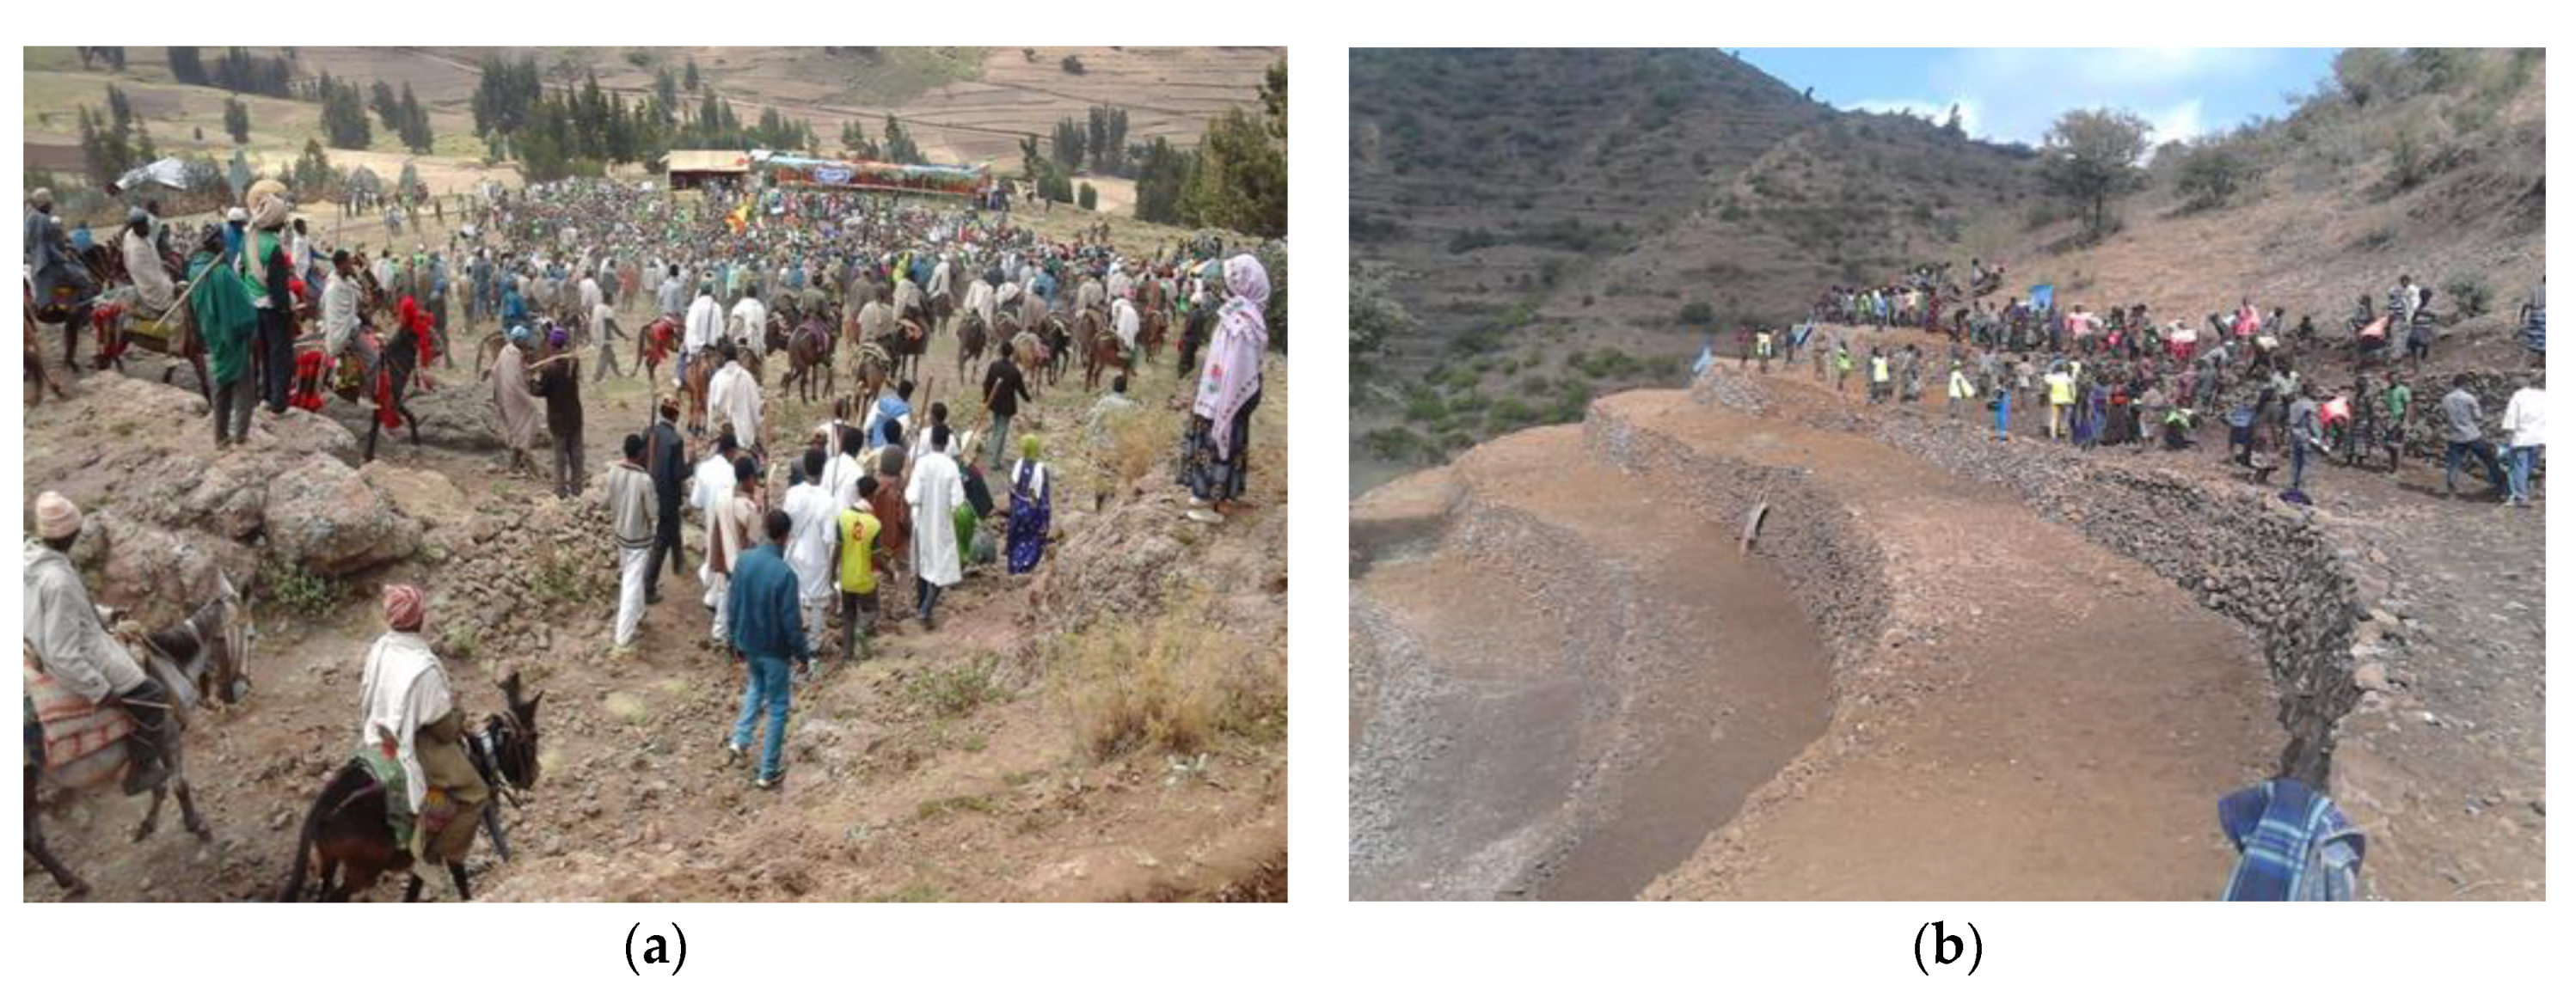
3.3. LULCC and Free Labour Mobilisation Campaign

The GoE was keen to rehabilitate degraded lands through a variety of mechanisms. The MERT program and the preceding “food for work and cash for work” were among the interventions in this regard. Due to concerns around sustainability and other related matters, the GoE came with a unique approach called the free labour mobilisation campaign. The campaign takes place annually, where farmers are assumed to be free from any on-farm activities (Figure 6). In areas where the problem of degradation is widespread, the campaign can take a month or two. During the campaign, many SWC measures are practised in selected watersheds. The campaign requires substantial human labour, material, experts, and locally available systems to check and balance farmers’ participation. However, changes in terms of area coverage and measures of sustainability were not in place.
From the below graph, it is possible to see that the trends of excluding eroded areas from the interference of animal and human beings and developing with various measures of SWCPs were reported to be 2478 ha in 2000 and reached 6607 ha in 2020 (Figure 7). It is undeniable that, in terms of symbolic data, the program has shown excellent area coverage, as clearly stipulated in the report. Though massive free labour mobilisations exist to sustain and expand the natural resource base, changes in terms of vegetation coverage are negligible. The information we obtained from the documentation of the respective offices and the data gathered from the satellite imagery has shown huge mismatches. The satellite imagery data showed a declining trend of area coverage diminishing from 48281 ha or 30% in 2000 to 28559.8 ha or 17.38% in 2020 for area closure and forest land uses.
Respondents have mentioned many factors responsible for the poor performance of the campaign. The practice of free grazing, lack of a sense of ownership, low cooperation among community members, over politicisations of the free labour mobilisations campaign, and the extended days of the campaign have negatively affected the efficiency and effectiveness of the program. In addition, the absence of laws and bylaws, poor management of schemes, and lack of tenure security have further aggravated the problem. The practice of data cooking by respective government officials working for different offices is assumed as a reason for such a mismatch. Subject matter specialists engaged in the KII session who insisted on keeping their names anonymous reported the presence of such a practice, which mainly emanates from the interests of political elites at a higher level.

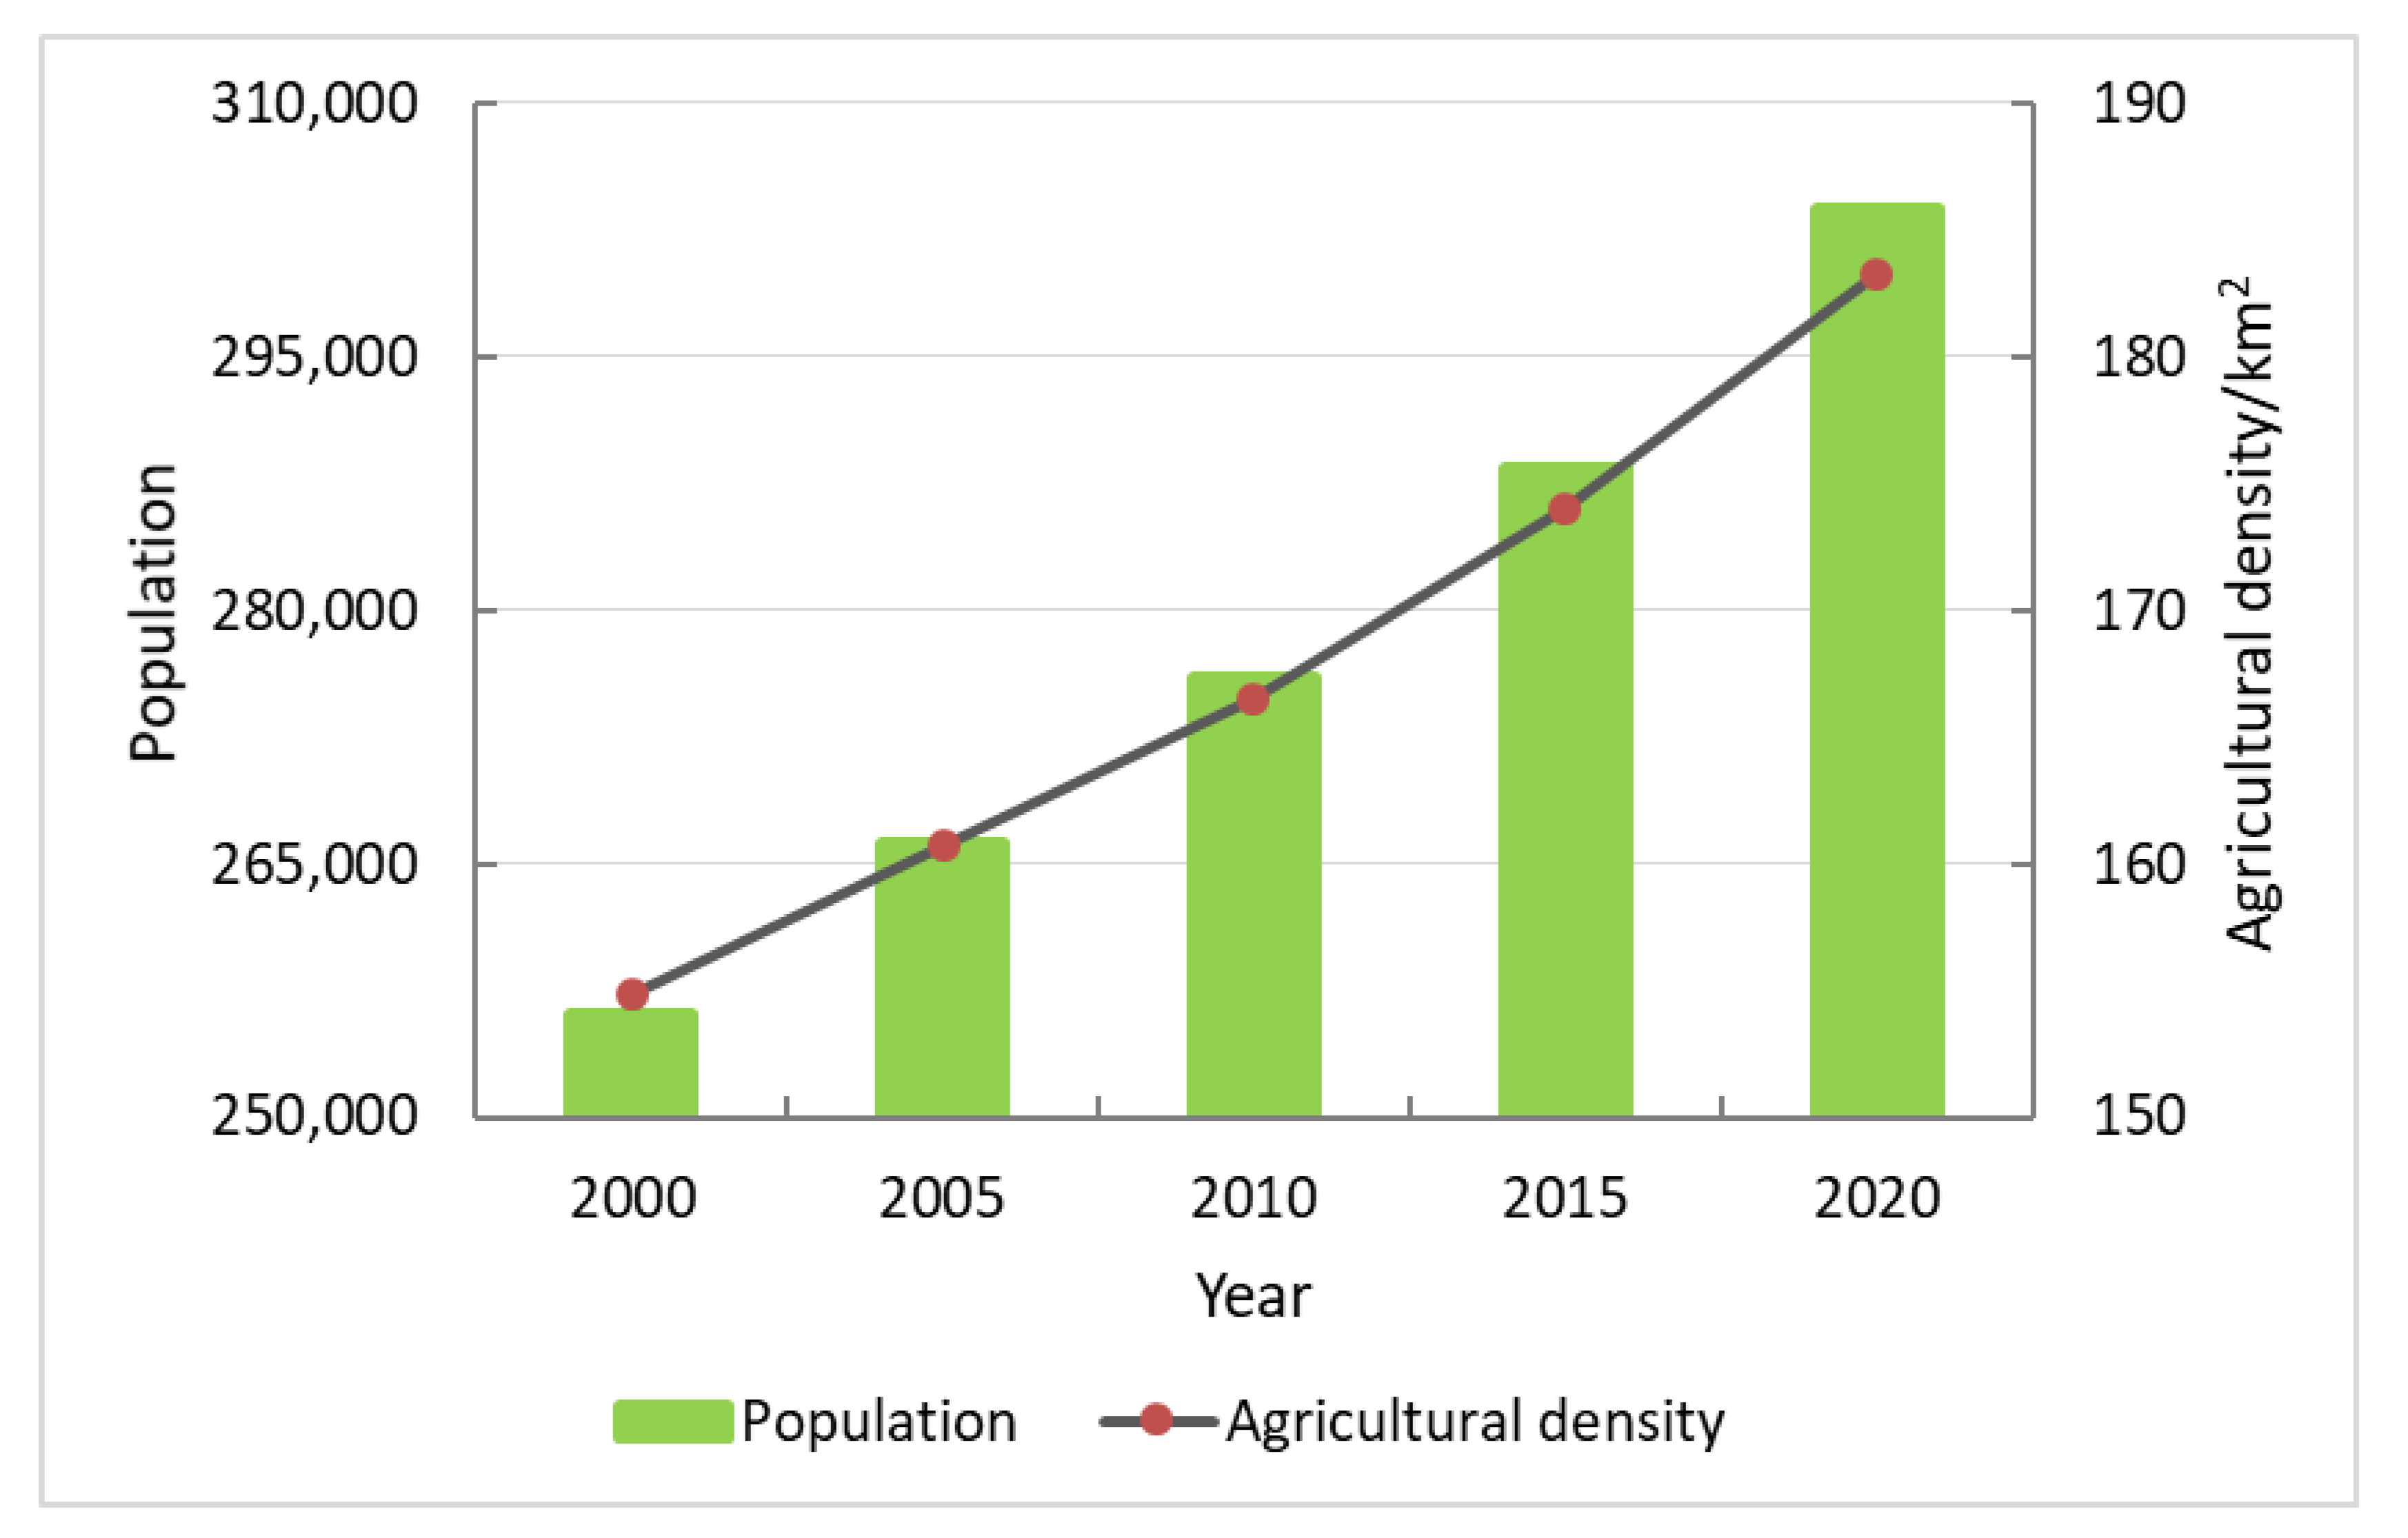
3.4. Drivers of Lulcc

Many factors are seen as responsible for the prevailing LULCC between 2000–2020. High population growth and the intention of young people to intrude and farm both forest and area closures are among the significant threats raised during respective discussions. Furthermore, high population growth, which increases at the rate of 2.9% [26], has negatively affected the agricultural land density of the studied area and has forced farmers to plough area closures, forestlands and high slope areas. Land, one of the farming community’s scarce resources, is dwindling in size from time to time and is incapable of filling the food basket of farming households. The study found that the average land holding is 0.75 ha/household in the two studied Woredas. This figure is by far less than the national average and is similar to the regional average, which is 1.01 ha and 0.7 ha, respectively (Table 8). Therefore, it is possible to portray that shrinking farm sizes has forced the community to farm closure areas, forest and high slope areas. Other land-related parameters, like the number of parcels, individual parcel sizes and walking distances, have prevented farmers from not devoting their time to the campaign. The full attention of farmers was tilted to produce food from such tiny plots to safeguard the household members from intermittently occurring seasonal and transitory food deficits.
Emerging jobless youth and the shrinkage of farmland because of land degradation and sharing among family members have increased agricultural density from 154.84/km2 in 2000 to 183.3/km2 in 2020 (Figure 8). Population growth, the resultant farmland shortage, and failure to allocate farm plots to landless people have contributed significantly to such undesirable LULCC. As mentioned in KII and FGD sessions, landless youth have been observed illegally farming area closures and collecting and selling fuelwood and grass without having the community’s consent, which are recurring illegal practices in each watershed.
South Wello, in general, and the two specific research Woredas are known for their crop-livestock system. There is a back and forth interdependence between the two systems. The livestock supports the crop sector by providing traction power, manure and social capital attainment. In turn, the crop sector provides crop residue to be used as animal feed and cash from the sale of animals is mainly used to purchase seed, agricultural inputs, and other household expenditures. The zone has a high livestock potential expressed in the tropical livestock unit (TLU) [55]. The total livestock population of the zone in 2020 was estimated to be 2,124,679 [27]. The average livestock density is between 179.1–216.8/TLU/km2. The figure has put the zone first by having a large livestock population in Amhara Regional State.
Similarly, the study Woredas were found to have the highest livestock population. The finding of this research indicates the existence of a high TLU per the studied households. As indicated in Table 9, the average TLU in the study area is 3.06, with variation across agroecologies, 3.63 (Dega), 3.1 (Woyenadega), and 2.74 (Kolla). The observed high TLU resulted in widespread land degradation, deteriorated pasture due to overgrazing, compaction, and erosion. This problem was exacerbated in the study area, where ineffective regulations and poor livestock management led to grazing area closures, forests and SWCs schemes illegally.
A large TLU, coupled with free grazing management, has caused a significant burden on area closures and forest schemes. Data obtained from qualitative and quantitative sources reveal that free grazing is one of the main problems for the poor expansion of these schemes (Figure 9). Research by [55] has simila which indicates how large livestock holdings and uncontrolled grazing affects the protection and development of SWC schemes.
During KII and FGD sessions, informants listed factors accountable for the low expansion of closure areas and natural and artificial forests. The discussants identified nine factors that mainly constrain the development and sustainability of the schemes. According to the informants and discussants, a lack of cooperation, losing a sense of ownership, unrestricted grazing, absence of laws and bylaws, lack of training, poor representation of women, travel distance to the campaign places, utilisation of the event for matters beyond the scope of the campaign, conflicts of interest, and the extended days of the campaign were the major problems. Summary of the factors collected by different qualitative tools were brought to the attention of the community workshop, allowing participants to rank them using a PRA tool called the pair-wise matrix (Table 10).
Among the nine long listed variables (Table 10), unrestricted grazing, extended campaign days, politicisations, losing a sense of ownership, and lack of cooperation among community members took the rank from 1–5. The area under study has undergone a complex LULCC between 2000 and 2020. Agriculture and settlement land-use types significantly and grazing land comparatively have shown an increase. Unlike forests and area closures, which were in declining trends, grazing land and bare land are between the two, showing up and down scenarios. Findings from the household surveys, KII and FGD, were brought to the attention of the community workshop participants. A combination of factors are identified as significant determinates of the change. Specifically, unrestricted grazing, losing a sense of ownership, the over politicisations of the campaign, extended campaign days, lack of cooperation, and conflicts of interest were among the findings. The FGD discussant also raised the ever-increasing number of jobless youth and their demand to have farm plots from their own family or communal lands, forcing them to plough area closures and forests. They also stressed that the jobless youth were also seen cutting and selling wood and grass from area closures and forests to make money for their interests.
Individual household heads were interviewed using household questionnaires to reflect their views regarding the significant determinants of LULCC in their area. The percentages and rank were derived based on how the respondents selected the variables using the Likert scale. Based on what has been raised in different sessions and the information obtained from reports and pieces of literature, a household survey was undertaken to investigate the problem of free labour mobilisation. Ten constraints were identified and deliberately included in the questioner to obtain the respondents’ responses based on the Likert scale. Of the 402 respondents, 223 believe that the campaign had passed with many problems in the last two decades. However, the remaining 179 households believed that the campaign had no problem.
The finding of the household survey identified six critical problems of the campaign: losing a sense of ownership; the intention of farmers to start the campaign first from their vicinity; shortage of seeds, seedlings, and cuttings; absence of solid laws and bylaws; lack of cooperation; and using the labour campaign for other political agendas. The shortage of farm tools, poor representation of women and the risk of rodent infestations were put under a lesser priority scenario (Table 11). The household survey result coincided with problems raised while undertaking KII, FGD, and community workshops, except for minor mismatches.
The research has drawn similar results from satellite imagery and the information collected through other qualitative and quantitative techniques. This research ascertains that RS has the potential and robustness to study societal problems and provide timely, expert-supported judgments. The research finding ascertains that RS analysis provides valuable insights into land use/cover changes processes at multiple spatial and temporal scales. In addition, this research has shown the importance of using different data sources that are more suitable and coherent for triangulation and refined findings.

4. Discussion

It is inevitable to observe LULCC occurring in non-linear form due to complex and interweaved anthropogenic and natural processes. Transformation of land is a trend that will continue to unfold, as most of the intervention was raised from the very egocentric nature of human beings and their descendants [56,57,58]. Ever since the history of humanity, land devoted to human use has grown considerably, and increases in the production of commodities have further accelerated the use and abuse of land resources [51]. This situation calls for a more efficient, effective, transparent and integrated land administration and management approach to address the rising demands of lands resulting from environmental concerns and technical advancements [57]. GoE and development actors have every possibility of safeguarding land from degradation. Free labour mobilisation could be one such intervention in this regard.
The multi-temporal satellite imagery and other qualitative methods reveal that the study area has undergone prominent LULCC. Between 2000 and 2020, agricultural land and settlement increased at the expense of area closures and forests. In research done in the same basin, the same was found by [23]. In addition, a study undertaken on Teleyayen watershed revealed that agricultural lands and settlements rose by 81% between 1986 and 2015, whereas forest lands decreased by 0.2% from 3.8% in 1973 to 3.4% in 1986 and 0.2% in 2015 [58]. A study done in the Northern Gojam sub-basin by [59] ascertained that agricultural land had exhibited a gross increase of 17.2% between 1994–2007. Findings by many other scholars at different temporal and spatial dimensions have put forward similar results [56,60,61,62]. High population growth and the emerging landless youth have forced the community to plough forest, area closures and grazing lands. It is common to see farmers ploughing high terrain areas with a high rate of soil erosion and land degradation. In addition, the dwindling size of farm plots has forced farmers to cultivate high slop areas, further exacerbating land degradation and nutrient depletion. This research reveals that the average landholding per household in the study area is relatively smaller than the national average. The research finds that the number of plots per household and the size of individual plots were found to be 4.6 and 0.198 ha, respectively. They had such a tiny plot of land remains challenging for a household to fill its food basket. The finding of this research aligns with other researchers’ results. For instance, the 2007 Population and Housing Census [63] identified land shrinkage as major problem of smallholder agriculture in Ethiopia, where average landholding had decreased from 1.2 ha in 2007 to 0.6 ha in 2015. Similar research by [64] identified farmland shrinkage as one of the factor hindering smallholders agriculture.
In addition to this, the practice of free grazing and having much livestock per household remains a problem for the development of forest and area closures. Unquestionably, livestock plays a pivotal contribution to the crop-livestock farming system by contributing draught power and manure to the crop sector. However, having huge numbers of livestock and an unmanaged grazing system has negatively affected the intended land use in the study area. Shrinking grazing land coupled with the ever-growing livestock population is likely to lead to massive overstocking, overgrazing, and the over browsing of pasture and herbs. Unlike this, some scholars argue that free grazing will pave a mechanism for increasing soil fertility through manure dropped in the field while grazing [65]. In the high lands of Ethiopia, where animal dung is used as a source of energy for household purposes, the previous idea remains unfeasible and ineffective.
Very significantly, the diminishing size seen in forests and area closures and the poor performance of the free labour mobilisation campaign can be linked to many related factors raised by the community. This study identified extended campaign days, over politicisation of the movement, losing a sense of ownership, and lack of cooperation as significant bottlenecks. Extended campaign days, which occur for between 30 and 60 days, have prevented farmers from performing some social obligations and off-farm activities that sometimes can be a source of cash income. Secondly, engaging oneself for the days mentioned can make the farmer burned out and exhausted. Losing a sense of ownership and lack of cooperation among community members can also be linked with a lack of tenure security which has a gap on as how mange and utilize the natural resources, like grass, wood, and other products from the schemes. It is a kind of ad-hoc appearing campaign that lacks appropriate awareness creation, and which fails to participate the community in all stages of the planning and implementation process. A study by Ayal and others stipulated that indigenous knowledge is important and can solve grassroots problems [66]. Contrary to this, the campaign’s overall direction and leadership were given by government officials coming from the Woredas office. The campaign was over-politicised and became a medium where other governments and political parties’ agendas were communicated. As one of the community’s felt need, community leaders, the elderly, and religious elites have not been allowed to discuss and decide on the matters. A study by [67,68,69] identified poor community representation as one of the factors hindering free labour mobilisation campaigns by focusing on a top-down implementation approach. Similarly, the necessity for economic incentives, the nature of some schemes, the already dwindling farmlands and grazing grounds, top-down implementation approach, lack of a legal framework to determine ownership, lack of training, and viewing the campaign as government-induced and enforced task were reported as the hurdles of the program [70].
Moreover, lack of firm and binding rules and bylaws was commonly cited as a reason for inadequate management and utilisation of area closures and forest resources in the studied micro-catchments. According to data acquired from many sources, many of the shared resources suffer from the tragedy of the commons. Even though the GoE and CANRS (Council of Amhara National Regional State) have passed bills and guidelines on watershed development and management [71,72,73,74], as these bills are at their initial stages, they are unable to protect shared natural resources, and uplift the benefit of the respective communities. Furthermore, community-based organisations (CBOs) and social and religious arrangements at the grassroots level were not empowered to draft and implement their own bylaws.
The demographic trends of the research area and similar locations have identical manifestations of population trends explianed by a high proportion of youth. This group requires job opportunities, land to till and other means of livelihood to the extent possible. Parallel to the emerging youth population, communities’ interest in maximising the benefit from common-pool resources remains a bottleneck to sustainable land resource management. As clearly stipulated in the thesis of Hardin (1968), “the tragedy of the commons” is a phenomenon, persisting everywhere, that is known to hinder the sustainability of land resources and services coming from it. The community alone cannot prevent such issues [75]. The responsibility lies both on the respective governments and end-users of the resource to put in place and implement appropriate and governing policies. Many governments’ policies across the nations do not have a clear stand on which population theory to follow. The group of scholars who advocate Malthusian theory [76] prescribe population restriction policy for better and sustainble use of natural resppurse as opposed to Boserupian theory [77], which looks population as an asset of a nation that has shown an exemplary manifestation in economic development scenarios manifested by ‘Asian tigers”, China and India. As there is no one-size-fits-all model, the GoE should base its population policy that supports the sustainable use of natural resources,, which can be achieved through adequate utilisation and protection of the natural resource base. This could further serves as a springboard to sustainable development and the green economy policy that GoE aspire to revitalise. Nonetheless, it has to be soon translated to a variety of quality life parameters, one of which could be access to uninterrupted and sustainable eco-system services.

5. Conclusions and Future Work

The reasons for the poor performance of the free labour mobilisation campaigns were high population growth, unrestricted grazing, a lack of sense of ownership and low intent to protect the schemes, over politicisation of the campaign and the use of the campaign for non-SWC activities, and engaging farmers on the campaign for extended days and the resulting burnout. Furthermore, widespread trends of free grazing possess a lion’s share of responsibility for the observed resource degradation. The problem is further compounded by the presence of landless youth and their unlimited intent to earn cash from the sale of wood and grass. Land, which is completely under the federal government’s control, has adversely affected the interest of farmers to invest in SWC activities because of the prevailing tenure insecurity. In addition, poor enforcement and the absence of laws and bylaws also have their own share for the recorded poor result.
To avoid further deterioration of suitable LULC and improve the quality of the eco-system through well-coordinated free labour mobilisations, emphasis should be given to the following remedial actions. Awareness creation and training of community members on environmental education and family planning, introduction of a cut-and carry grazing system, destocking and restocking animals accordingly, job creation, amendment of the existing land tenure policy, introduction of workable SWC practices, scaling up of evidence-based best practices observed while implementing the previous campaigns, boosting community participation, and enforcing laws and bylaws have been recommended as a way forward.
Finally, this study highlights the importance of incorporating remote sensing and GIS technologies to interpolate and magnify quantitative information with qualitative local understandings to improve our knowledge of land use/cover change and mass mobilisation movements to reduce environmental degradation and bring sustainable use of natural resources.
The study could add scarce information we had related to free labour mobilisations, watershed campaigns, and sustainable land management. Correspondingly, besides its input to academia, it also helps GoE and other development actors incorporate better watershed management and free labour mobilisations in policy formulation, planning, and decision-making. The following research challenge will be identifying SWC practices most acceptable by farmers and exploring drivers of adoption and extent of sustainability using farm-level indicators.

Author Contributions

All authors made substantial contributions to the conception and design of the study. B.T. Performed tool development, data collection, data analysis and wrote the draft paper. J.Z., B.S. and M.L. guided the research and reviewed the manuscript. All authors have read and agreed to the published version of the manuscript.

Funding

This study was supported by the Dutch organisation for internationalisation in education (Nuffic), University of Twente, Faculty of Geo-information Science and Earth Observation (ITC), and Ministry of Science and Higher Education of Ethiopia (MoSHE) under the Ethiopian Educational Network to Support Agricultural Transformation (EENSAT) project (CF13198, 2016).

Institutional Review Board Statement

Not applicable.

Informed Consent Statement

Not applicable.

Data Availability Statement

Data will be made available on DANS (Data Archiving and Networking service) of the University of Twente.

Acknowledgments

We are grateful to PGM-ITC-UT and EENSAT Project coordination office. The authors would like to thank data collectors, event organisers, respective government organisations, and the community for sharing their local understanding. Our gratitude goes to the Africa Disaster Risk Management Centre (ADRMC) and its staff for the logistic and technical support provided during the fieldwork.

Conflicts of Interest

The authors declare no conflict of interest.

References

  1. Pieri, C.; Dumanski, J.; Hamblin, A.; Young, A. Land quality indicators: Research plan. Agric. Ecosyst. Environ. 2000, 315, 93–102. [Google Scholar]
  2. Diagana, B. Land Degradation in SubSaharan Africa: What Explains the Widespread Adoption of Unsustainable Farming Practices? Department of Agricultural Economics and Economics, Montana State University: Bozeman, MT, USA, 2003. [Google Scholar]
  3. GEF (Global Environment Forum). Report on Global Trends of Land Degradation; GEF: Tokyo, Japan, 2005. [Google Scholar]
  4. Sivakumar, M.V.K.; Stefanski, R. Climate and Land Degradation—An Overview. In Climate and Land Degradation; Sivakumar, M.V.K., Ndiang’Ui, N., Eds.; Springer Science & Business Media: Berlin, Heidelberg, 2007; pp. 105–135. [Google Scholar]
  5. Le, Q.B.; Nkonya, E.; Mirzabaev, A. Biomass Productivity-Based Mapping of Global Land Degradation Hotspots. In Economics of Land Degradation and Improvement—A Global Assessment for Sustainable Development; Nkonya, E., Mirzabaev, A., von Braun, J., Eds.; Springer Science & Business Media: Berlin, Heidelberg, 2016; pp. 55–84. [Google Scholar]
  6. Mulugeta, M. Resettlement and Food Security Nexus in Ethiopia: A Case from Nonno Resettlement Sites, Central Ethiopia. Ehtiop. J. Soc. Sci. Human. 2012, 8, 75–84. [Google Scholar]
  7. Moges, D.M.; Taye, A.A. Determinants of farmers’ perception to invest in soil and water conservation technologies in the North-Western Highlands of Ethiopia. Int. Soil Water Conserv. Res. 2017, 5, 56–61. [Google Scholar] [CrossRef]
  8. Zewdie, W.; Csaplovics, E. Identifying Categorical Land Use Transition and Land Degradation in Northwestern Drylands of Ethiopia. Remote Sens. 2016, 8, 408. [Google Scholar] [CrossRef] [Green Version]
  9. Ethiopia Forest and Climate Change Commission. Ethiopia State and Outlook of the Environment 2017; EFCCC: Addis Ababa, Ethiopia, 2018. [Google Scholar]
  10. Tolossa, D. Causes of Seasonal Food Insecurity in Oromiya Zone of Amhara Region: Farmers’ View. In Proceedings of the International Conference on Contemporary Development Issues in Ethiopia, Kalamazoo, MI, USA, 16–18 August 2001. [Google Scholar]
  11. Charlton, K.E.; Rose, D. Nutrition among older adults in Africa: The situation at the beginning of the millenium. J. Nutr. 2001, 131, 2424S–2428S. [Google Scholar] [CrossRef] [PubMed] [Green Version]
  12. FAO; IWFP; FAD; UNICEF. The State of Food Security and Nutrition in the World 2018. Building Climate Resilience for Food Security and Nutrition; FAO: Rome, Italy, 2018. [Google Scholar]
  13. Amede, T.; Kassa, H.; Zeleke, G.; Shiferaw, A.; Kismu, S.; Teshome, M. Working with Communities and Building Local Institutions for Sustainable Land Management in the Ethiopian Highlands. Mt. Res. Dev. 2007, 27, 15–19. [Google Scholar] [CrossRef] [Green Version]
  14. Liping, C.; Yujun, S.; Saeed, S. Monitoring and predicting land use and land cover changes using remote sensing and GIS techniques—A case study of a hilly area, Jiangle, China. PLoS ONE 2018, 13, e0200493. [Google Scholar] [CrossRef]
  15. Shiene, S.D. Effectiveness of Soil and Water Conservation Measures for Land Restoration in the Wello Area, Northern Ethiopian Highlands. Ph.D. Thesis, The Faculty of Agriculture, Rheinischen Friedrich-Wilhelms-Universität zu Bonn, Bonn, Germany, July 2012; p. 161. [Google Scholar]
  16. Amede, T. Opportunities and Challenges in Reversing land Degradation: The Regional Experience. In Natural Resources Degradation and Environmental Concerns in the Amhara National Regional State: Impact on Food Security, Tilahun Amede; Ethiopian Soils Science Society (ESSS): Addis Abeba, Ethiopia, 2003; pp. 173–183. [Google Scholar]
  17. Yang, X.; Lo, C.P. Using a time series of satellite imagery to detect land use and land cover changes in the Atlanta, Georgia metropolitan area. Int. J. Remote Sens. 2002, 23, 1775–1798. [Google Scholar] [CrossRef]
  18. Singh, A. Review Article Digital change detection techniques using remotely-sensed data. Int. J. Remote Sens. 1989, 10, 989–1003. [Google Scholar] [CrossRef] [Green Version]
  19. Son, M. Effects of Land Degradation on Agricultural Land Use: A Case Study of Smallholder Farmers Indigenous Knowledge on Land Use Planning and Management in Kalama Division, Machakos County. Master’s Thesis, South Eastern Kenya University, Kitui, Kenya, 23 February 2016. [Google Scholar]
  20. Yimer, M. The effect of sustainable land management (SLM) to ensure food security; local evidences from Tehuledere Woreda, ANRS, Northern Ethiopia. Sci. J. Crop. Sci. 2015, 4, 1–27. [Google Scholar]
  21. Food and Agriculture Organization of the United Nations. The State of Food Insecurity in the World Addressing Food Insecurity in Protracted Crises 2010 Key Messages; Food and Agriculture Organization: Quebec, QC, USA, 2010. [Google Scholar]
  22. Shekur, N. Sustainable Land Management (SLM): Adaptation Response to Climate Change, Cases in Ethiopia; Open Knowledge Repository: Washington, DC, USA, 2012. [Google Scholar]
  23. Sileshi, T. Land Degradation Vulnerability Assessment Using GIS and Remote Sensing in Beshilo River Basin, Ethiopia. Master’s Thesis, Norwegian University of Science and Technology, Trondheim, Norway, 2016; pp. 1–81. [Google Scholar]
  24. Simane, B.; Zaitchik, B.F.; Ozdogan, M. Agroecosystem Analysis of the Choke Mountain Watersheds, Ethiopia. Sustainability 2013, 5, 592–616. [Google Scholar] [CrossRef] [Green Version]
  25. Hurni, H. Agroecologial Belts of Ethiopia: Explanatory Notes on Three Maps at a Scale of 1:1,000,000; Centre for Development and Environment: Bern, Switzerland, 1998; p. 43. [Google Scholar]
  26. Central Statistics Authority. Population Projection of Ethiopia for All Regions At Wereda Level from 2014–2017; Central Statistics Agency: Addis Ababa, Ethiopia, 2017. [Google Scholar]
  27. SZANRMB. South Wello Zone Agriculture and Natural Recourse Management Bureau; Unpublished Report 2000–2020; 2020; pp. 1–78. [Google Scholar]
  28. DZWANRNO. Dessie Zuria Woreda Agriculture and Natural Resource Management Office; Unpublished Report 2000–2020; DZWANRNO: Dessi, Ethiopia, 2020; pp. 1–50. [Google Scholar]
  29. KWANRMO. Kutaber Woreda Agriculture and Natural Resource Management Office; Unpublished Report 2000–2020; KWANRMO: Kutaber, Ethiopia, 2020; pp. 1–50. [Google Scholar]
  30. Abowitz, D.A.; Toole, T.M. Mixed method research: Fundamental issues of design, validity, and reliability in construction research. J. Constr. Eng. Manag. 2010, 136, 108–116. [Google Scholar] [CrossRef]
  31. Wilson, B.L. Quantitative Qualitative Large-Scale Study. Sage J. 1985, 9, 627–643. [Google Scholar]
  32. Phiri, D.; Morgenroth, J. Developments in Landsat land cover classification methods: A review. Remote Sens. 2017, 9, 967. [Google Scholar] [CrossRef] [Green Version]
  33. Mishra, S.; Shrivastava, P.; Dhurvey, P. Change detection techniques in remote sensing: A review. Int. J. Wirel. Mob. Commun. Ind. Syst. 2017, 4, 1–8. [Google Scholar] [CrossRef]
  34. Al-doski, J.; Mansor, S.B.; Zulhaidi, H.; Shafri, M. Image Classification in Remote Sensing. J. Environ. Earth Sci. 2013, 3, 141–148. [Google Scholar]
  35. Foody, G.M. Status of land cover classification accuracy assessment. Remote Sens. Environ. 2002, 80, 185–201. [Google Scholar] [CrossRef]
  36. Lu, D.; Mausel, P.; Brondízio, E.; Moran, E. Change detection techniques. Int. J. Remote Sens. 2004, 25, 2365–2407. [Google Scholar] [CrossRef]
  37. Nizeyimana, E. Remote Sensing and GIS Integration; SECOND EDI; CRC Press: Boca Raton, FL, USA, 2020. [Google Scholar]
  38. Ziskin, D.; Baugh, K.E.; Hsu, F.-C.; Elvidge, C.D. Methods Used For the 2006 Radiance Lights. Proc. Asia-Pacific Adv. Netw. 2010, 30, 131. [Google Scholar] [CrossRef] [Green Version]
  39. Lillesand, T.M.; Kiefer, R.W. Remote Sensing and Image Interpretation, 3rd ed.; John Wiley & Sons: Hoboken, NJ, USA, 1994. [Google Scholar]
  40. Congalton, R.G.; Green, K. Assessing the Accuracy of Remotely Sensed Data: Principles and Practices; Routledge: Oxforshire, UK, 2019; pp. 42–67. [Google Scholar]
  41. Gilabert, M.; Conese, C.; Maselli, F. An atmospheric correction method for the automatic retrieval of surface reflectances from TM images. Int. J. Remote Sens. 1994, 15, 2065–2086. [Google Scholar] [CrossRef]
  42. Dewan, Y.A.; Yamaguchi, M. Using remote sensing and GIS to detect and monitor land use and land cover change in Dhaka Metropolitan of Bangladesh during 1960–2005. Environmental monitoring and assessment. Environ. Monit. Assess. 2009, 150, 1–4. [Google Scholar] [CrossRef] [PubMed]
  43. Evans, F.H. An investigation into the use of maximum likelihood classifiers, decision trees, neural networks and conditional probabilistic networks for mapping and predicting salinity. Master’s Thesis, School of Computing, Curtin University of Technology, Perth, Western Australia, 1998. [Google Scholar]
  44. Bolstad, P.V.; Lillesand, T.M. Rapid maximum likelihood classification. Photogramm. Eng. Remote Sens. 1991, 57, 67–74. [Google Scholar]
  45. Otukei, J.; Blaschke, T. Land cover change assessment using decision trees, support vector machines and maximum likelihood classification algorithms. Int. J. Appl. Earth Obs. Geoinf. 2010, 12, S27–S31. [Google Scholar] [CrossRef]
  46. Erbek, F.S.; Özkan, C.; Taberner, M. Comparison of maximum likelihood classification method with supervised artificial neural network algorithms for land use activities. Int. J. Remote. Sens. 2004, 25, 1733–1748. [Google Scholar] [CrossRef]
  47. Sonawane, K.R. Roboust Change Detection of Forests: A Case Study of Mountain Range from Ghatghar to Washere in Akole Tahsil, Ahmednagar District. Master’s Thesis, Agasti Arts, Commerce and Dadasaheb Rupwate Science College, Akole, India, 2015. [Google Scholar]
  48. Swain, P.H.; Davis, S.M. Remote sensing: The Quantitative Approach; McGraw-Hill College: New York, NY, USA, 1979. [Google Scholar]
  49. Richards, J.A. Remote Sensing Digital Image Analysis: An Introduction; Springer: New York, NY, USA, 1986. [Google Scholar]
  50. Lillesand, C.J.; Kiefer, T.R.W. Remote Sensing and Image Interpretation; John Wiley Sons: Hoboken, NJ, USA, 2015. [Google Scholar]
  51. Pettorelli, N.; Vik, J.O.; Mysterud, A.; Gaillard, J.-M.; Tucker, C.J.; Stenseth, N.C. Using the satellite-derived NDVI to assess ecological responses to environmental change. Trends Ecol. Evol. 2005, 20, 503–510. [Google Scholar] [CrossRef] [PubMed]
  52. Collins, J.B.; Woodcock, C.E. An assessment of several linear change detection techniques for mapping forest mortality using multitemporal Landsat TM data. Remote Sens. Environ. 1996, 56, 66–77. [Google Scholar] [CrossRef]
  53. Xu, L.; Zhang, S.; He, Z.; Guo, Y. The comparative study of three methods of remote sensing image change detection. In Proceedings of the 17th International Conference on geoinformatics, Fairfax, VA, USA, 12–14 August 2009; pp. 1–4. [Google Scholar] [CrossRef]
  54. Kindu, M.; Schneider, T.; Teketay, D.; Knoke, T. Land Use/Land Cover Change Analysis Using Object-Based Classification Approach in Munessa-Shashemene Landscape of the Ethiopian Highlands. Remote. Sens. 2013, 5, 2411–2435. [Google Scholar] [CrossRef] [Green Version]
  55. Rothman-Ostrow, P.; Gilbert, W.; Rushton, J. Tropical Livestock Units: Re-evaluating a Methodology. Front. Vet. Sci. 2020, 7, 973. [Google Scholar] [CrossRef] [PubMed]
  56. Degife, A.; Worku, H.; Gizaw, S. Environmental implications of soil erosion and sediment yield in Lake Hawassa watershed, south-central. Environ. Syst. Res. 2021, 10, 1–24. [Google Scholar] [CrossRef]
  57. Ali, Z.; Zevenbergen, J.; Tuladhar, A. Assessing the Quality Land Administration System in Pakistan Using Systematic Approach of Case Study Methodology. Am. J. Rural. Dev. 2014, 2, 40–45. [Google Scholar] [CrossRef] [Green Version]
  58. Agidew, A.-M.A.; Singh, K.N. The implications of land use and land cover changes for rural household food insecurity in the Northeastern highlands of Ethiopia: The case of the Teleyayen sub-watershed. Agric. Food Secur. 2017, 6, 1–14. [Google Scholar] [CrossRef] [Green Version]
  59. Ewunetu, A.; Simane, B.; Teferi, E.; Zaitchik, B.F. Land cover change in the blue Nile river headwaters: Farmers’ perceptions, pressures, and satellite-based mapping. Land 2021, 10, 68. [Google Scholar] [CrossRef]
  60. Centeral Statistics Agency. Population Projections for Ethiopia 2007–2037; Central Statistical Agency of Ethiopia: Addis Ababa, Ethiopia, 2013; p. 188. [Google Scholar]
  61. Ethiopia Agricultural Research Organization; UoW-University of Wollo-Livestock. Research in Watershed Management South WoUo; International Livestock Research Institute: Addis Ababa, Ethiopia, 2000. [Google Scholar]
  62. Mulugeta, M.; Tesfaye, B.; Ayano, A. Data on spatiotemporal land use land cover changes in peri-urban Addis Ababa, Ethiopia: Empirical evidences from Koye-Feche and Qilinto peri-urban areas. Data Brief 2017, 12, 380–385. [Google Scholar] [CrossRef] [PubMed]
  63. Central Statistics Agency. Population Projection of Ethiopia for all Regions at Wereda Level from 2014–2017; Central Statistics Agency: Addis Ababa, Ethiopia, 2013. [Google Scholar]
  64. Belay, K.; Abebaw, D. Challenges facing agricultural extension agents: A case study from South-western Ethiopia. African Dev. Rev. 2004, 16, 139–168. [Google Scholar] [CrossRef]
  65. Demissie, F.; Yeshitila, K.; Kindu, M.; Schneider, T. Land use/Land cover changes and their causes in Libokemkem District of South Gonder, Ethiopia. Remote Sens. Appl. Soc. Environ. 2017, 8, 224–230. [Google Scholar] [CrossRef]
  66. Ayal, D.Y.; Desta, S.; Gebru, G.; Kinyangi, J.; Recha, J.; Radeny, M. Opportunities and challenges of indigenous biotic weather forecasting among the Borena herders of southern Ethiopia. SpringerPlus 2015, 4, 617. [Google Scholar] [CrossRef] [PubMed] [Green Version]
  67. Bewket, W. Towards integrated watershed management in highlands Ethiopia: The Chemoga watershed case study. Ph.D. Thesis, Wageningen University and Research Centre, Wageningen, The Netherlands, 2003. [Google Scholar]
  68. Hurni, K.; Gete, Z.; Menale, K.; Berhan, T.; Tibebu, K.; Ermias, T.; Aderajew, M.; Deme, T.; Mohamed, A.; Yohhanes, D.; et al. The Economics of Land Degradation. Ethiopia Case Study. In Soil Degradation and Sustainable Land Management in the Rainfed Agricultural Areas of Ethiopia: An Assessment of the Economic Implications; Water and Land Resource Centre (WLRC): Addis Ababa, Ethiopia; Centre for Development and Environment (CDE): Bern, Switzerland; Deutsche Gesellschaft für Internationale Zusammenarbeit (GIZ): Bonn, Germany, 2015; p. 94. [Google Scholar]
  69. Zeleke, G.; Kassie, M.; Pender, J.; Yesuf, M. Stakeholder Analysis for Sustainable Land Management (SLM) in Ethiopia: Assessment of Opportunities, Strategic Constraints, Information Needs, and Knowledge Gaps; International Food Policy Research Institute, Environmental Economics Policy Forum for Ethiopia: Washington, DC, USA, 2006. [Google Scholar]
  70. Bishaw, B. Deforestation and Land Degredation in the Ethiopian Highlands: A Strategy for Physical Recovery. Northeast. Afr. Stud. 2001, 8, 7–25. [Google Scholar] [CrossRef]
  71. CANRS. Council of Amhara Regional State. Watershed Administration and Use System Proclamation No. 173/2018; ZIKRE HIG: Bahirdar, Ethiopia, 2018; pp. 1–54. [Google Scholar]
  72. The Federal Democratic Republic of Ethiopia, House of Representatives. Development, Management and Utilization of Community Watersheds Proclamation, No.1223/2020; The Federal Democratic Republic of Ethiopia, House of Representatives: Addis Ababa, Ethiopia, 2020. [Google Scholar]
  73. Ministry of Agriculture and Rural Development, The Federal Democratic Republic of Ethiopia. Community-Based Participatory Watershed Development: A Guideline; Ministry of Agriculture and Rural Development: Addis Ababa, Ethiopia, 2005.
  74. Council of Amhara Regional State. The Revised Rural Land Administration and Use Determination Proclamation of and Use Determination Proclamation of the Amhara National Regional State, Proclamation No.252/2017; ZIKRE HIG: Bahirdar, Ethiopia, 2017; Volume 14, pp. 1–81. [Google Scholar]
  75. Hardin, G. The Tragedy of the Commons. Am. Assoc. Adv. Sci. 1968, 162, 1243–1248. [Google Scholar] [CrossRef] [PubMed] [Green Version]
  76. Malthus, T. An Essay on the Principle of Population, as it Affects the Future Improvement of Society with Remarks on the Speculations of Mr. Godwin, M. Condorcet, and Other Writers; Cambridge University Press: Cambridge, UK, 2007. [Google Scholar]
  77. Boserup, E. Environment, Population, and Technology in Primitive Societies. Popul. Dev. Rev. 1976, 2, 21–36. [Google Scholar] [CrossRef] [Green Version]
Figure 1. Location map of the study area: (a) The horn, Ethiopia and Amhara region; (b) South wello; and (c) Kutaber and Dessie Zuria woredas and the six study kebeles.
Remotesensing 13 05078 g001
Figure 2. Research flowchart.
Remotesensing 13 05078 g002
Figure 3. A diagram showing the LULC change classification procedure.
Remotesensing 13 05078 g003
Figure 4. Photographs of different land-use types: (a) Settlement; (b) Agriculture; (c) Forest; (d) Grazing land; (e) Area closure; and (f) Bare land. Photo Credit: South Wello Agriculture and Natural Resource Management office and the authors.
Remotesensing 13 05078 g004
Figure 5. Land Use Land Cover Change between periods; (a) 2000; (b) 2005; (c) 2010; (d) 2015; and (e) 2020.
Remotesensing 13 05078 g005aRemotesensing 13 05078 g005b
Figure 6. Scene of the campaign: (a) Community members mobilising to watersheds; and (b) Farmeres on SWC duties.Photo credit: Bichaye Tesfaye.
Remotesensing 13 05078 g006
Figure 7. Land covered by area closure and afforestation programs 2000–2020. Source: South Wello Agriculture and Natural Resource Bureau.
Remotesensing 13 05078 g007
Figure 8. Population trends and agricultural density.
Remotesensing 13 05078 g008
Figure 9. (a) Photos showing animal grazing within SWCs schemes;and (b) Trends of free grazing. Photo credit: Bichaye Tesfaye.
Remotesensing 13 05078 g009
Table 1. Fact sheet of the study Woredas.
Biophysical and
Socio-Economic Characteristics
KutaberDessie Zuria
Northing11°19′60.00″11°09′60.00″
Easting 39°14′60.00″39°19′60.00″
Altitude (m)1500–29301649–3817
Area (km2)719.92937.32
Mean rainfall (mm)11101200
Mean minimum temperature (°C)6.565
Mean Maximum temperature (°C) 23.1325
Agroecology in (%)Dega 41%, Weynadega 55% and Kolla 4%.Dega 47%, Weyena dega 45%, Kolla 2% and wurch 8%.
Landscape in (%)Plain 10%, undulating 59%, mountainous 22% and rift 9%.Plain 15%, undulating 35%, mountainous 45%, and rift 5%.
No. of rural Kebeles2232
Soil types (%) Lithosols 22.5%, Regosols 16%, Rock surface 24%, Vertisols 2%, and Cambisols 36%.Cambisols 45.5%, Regosols 34% Lithosols 13.5%, and Rock surface 7.4%.
Population 117,163186,631
Land tenure PublicPublic
Extension support serviceYesYes
Major enterpriseWheat, barley, beans, peas, and tefWheat, barley, beans, peas, and tef
Farming systemCrop-livestock Crop-livestock
Source: Documentation of Dessie Zuria and Kutaber Agriculture and Natural Resource Management offices.
Table 2. Data collection tools.
WoredasDessie ZuriaKutaberTotal
KebeleDerebaAsgedoMitikolloHaroyeeGoromenderKundi
AgroecologyDegaWoyenadegaKollaDegaWoyenadegaKolla
Total household’s of study kebeles6321100686731103820456232
Number of household heads proportionally selected for household survey4073444767132402
KII35335625
FDG22222212
Community workshop1111116
Table 3. Summary of the dataset.
SatelliteSensorPath/RowAcquisition Date and Pixel ResolutionBands Used
Landsat 7ETM168/052 and 168/05320/01/2000, 30 mB1-Blue, B2-Green, B3-Red, B4-NIR
Landsat 7ETM168/052 and 168/05302/02/2005, 30 m
Landsat 7ETM168/052 and 168/05315/01/2010, 30 m
Landsat 8OLI168/052 and 168/05306/02/2015, 30 mB2-Blue, B3-Green, B4-Red, B5-NIR
Landsat 8OLI168/052 and 168/05319/01/2020. 30 m
Other Ancillary Data
Data Type Sensor Acquisition DateResolutionBands Used
Aerial photo Camera-20140.25RGB
TopoMap--2000, 2014
Ancillary data (boundaries of Kebeles, Woredas, roads and towns) from CSA--October 2019–January 2020--
Google earth map--January 20200.4RGB
Table 4. Description of land use types.
Land-Use TypeDescription
Agricultural landAreas of land ploughed/prepared for the growing of rain-fed crops. This includes areas currently under crop and fallow, as well as land under preparation
ForestAreas covered with a thick growth of trees that include evergreen forests, mixed forest land, deciduous forest lands, plantation of indigenous species of trees
Area closureArea of natural vegetation protected from the intrusion of major degradation agents, such as human and animal
Grazing land Areas covered with small grasses, scattered bushes and trees, and wetland which are, intermittently, used for grazing
Settlement Rural housing and fencings
Bare land Land surface without vegetation cover or with rock outcrops and quarries
Table 5. Accuracy Assessment of LULC Classifications.
Year20002005201020152020
LULUPAUAPAUAPAUAPAUAPAUA
Settlement94.491.092.489.089.783.393.989.791.183.8
Agricultural Land84.484.484.684.686.482.284.084.082.384.0
Forest87.591.888.987.082.590.491.987.287.187.2
Grazing Land85.780.080.484.084.080.884.085.784.084.0
Area Closure80.487.292.491.080.087.081.386.781.687.0
Bare land90.586.485.789.3684.682.585.286.886.884.6
Overall Accuracy87.287.884.486.885.0
Kappa0.860.860.820.850.83
Table 6. LULCC matrix.
Class NameYear
20002005201020152020
% Area (ha)%Area (ha)%Area (ha)%Area (ha)%Area (ha)
Settlement5.959773.66.410,586.617.211,808.98.313,657.711.0018,161.3
Agricultural land29.6848,770.630.249,566.233.454,922.735.858,789.541.6068,500
Forest18.4530,328.819.231,533.419.0 31,21417.829,245.312.4020,464.3
Grazing land6.0499325.59086.85.48898.45.48826.46.3510,434.7
Area closure29.9949,281.929.348,202.226.543,482.921.835,880.817.3828,559.8
Bare land9.8916,252.89.415,364.88.514,01310.917,94011.0018,219.8
Total100164,339.9100164,339.9100164,339.91100164,339.9100164,340
Table 7. Land Use Land Cover Change between Periods.
Change in Hectare (ha) and Percent (%)
Land-Use Type 2000–20052005–20102010–20152015–2020
ha%ha%ha%ha%
Settlement813+8.311223.29+11.551848.06+15.654503.42+32.98
Agriculture795.51+1.635356.53+10.83866.85+7.09710+16.51
Forest1204.56+3.9−319−1.02−1968.75−6.3−8781−30.03
Grazing land−845.28−8.51−188.37−2.07−72−0.801608.3+10.22
Area closure−1079.73−2.19−4719.33−9.8−7602.03−17.48−279.81−19.73
Bare land−888.03−5.4−1351.8−8.73926+28279.81+1.56
Table 8. Land related information by household, agroecology, Woreda, and study area.
Agroecology
/Area
Landholding Size
/Household/ha
Number of Parcels/
Household/ha
Parcel Size in haWalking Distance in Minutes
Dega0.854.9890.21812.5
Woyena dega0.7814.9360.20216.6
Kolla0.6663.9860.18211.7
Kutaber0.715.150.1714.959
Dessie Zuria0.8283.7260.24212.427
Total Study area0.7564.6110.19813.968
Table 9. Livestock holding per household in TLU.
SettingsAgroecologyWoredaStudy Area
Dega
(High Lands)
Woyenadega
(Midlands)
Kolla
(Lowlands)
KutaberDessie Zuria
Livestock holding in TLU3.633.12.743.073.143.06
Table 10. Pair-wise matrix on determinants of LULCC.
DeterminantsLCLSOFGALBLTPRWPCCIECDScoreRank
Lack of cooperation (L) LSOFGLCLCLCPCCIECD45
Losing a sense of Ownership (LSO) FGLSOLSOLSOPCLSOECD54
Free grazing
(FG)
FGFGFGFGFGFG81
Absence of bylaws (ALB) ABABPCCIECD27
Lack of training
(LT)
LTPCCIECD18
Poor representation of women (PRW) PCCIECD09
The politicisations of the campaign (PC) PCECD63
Conflict of interest (interest (CI) ECD36
Extended campaign days (ECD) 72
Table 11. Constraints of free labour mobilization campaign.
Constraints of SWCNSumRankMeanStd. DeviationCV
Losing sense of ownership22347712.141.1720.547664
Some farmers intention to
start the program from
their vicinity
22348822.191.1390.520091
Shortage of seedlings, seeds
and cuttings
22351332.31.1410.496087
Absence of solid laws
and bylaws
22355342.480.9860.397581
Lack of cooperation22356452.531.1730.463636
Using the labour campaign
for other political agendas
22358162.611.0680.409195
Shortage of farm tools22359572.671.3070.489513
Poor representation of women22359582.670.9190.344195
Risk of rodents infestation22367593.031.150.379538
Lack of training223746103.351.1860.35403
Publisher’s Note: MDPI stays neutral with regard to jurisdictional claims in published maps and institutional affiliations.

