
Quantifying Influences of Natural and Anthropogenic Factors on Vegetation Changes Based on Geodetector: A Case Study in the Poyang Lake Basin, China


Abstract
:
1. Introduction
2. Materials and Methods
2.1. Study Area
2.2. Data Sources
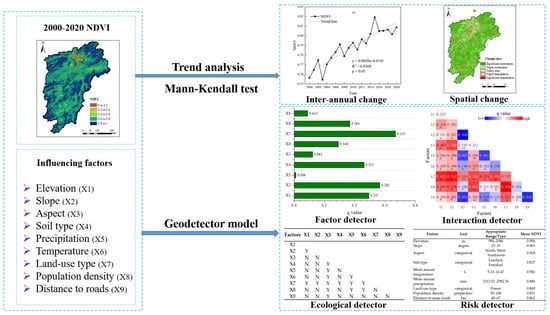
2.3. Methodology
2.3.1. Trend Analysis
2.3.2. Factors Selection
2.3.3. Geodetector Model
3. Results
3.1. Spatiotemporal Changes of the NDVI in the PYLB
3.2. Quantitative Attribution Analysis of the Vegetation Changes
3.2.1. Influence of Natural and Anthropogenic Factors
3.2.2. Interaction Effects between Factors
3.2.3. Significant Differences between Factors
3.2.4. Optimal Types or Ranges of Factors for Vegetation Growth
3.3. Effect of Land Use Conversion on Vegetation
4. Discussion
4.1. Characteristics of Vegetation Change in the PYLB
4.2. Influences of Driving Factors on Vegetation Change
4.2.1. Influences of Anthropogenic Factors on Vegetation Change
4.2.2. Influences of Natural Factors on Vegetation Change
4.3. Interactive Effects of Natural and Anthropogenic Factors on Vegetation Change
4.4. Implication and Limitations
5. Conclusions
Author Contributions
Funding
Institutional Review Board Statement
Informed Consent Statement
Data Availability Statement
Acknowledgments
Conflicts of Interest
References
- Piao, S.L.; Wang, X.H.; Ciais, P.; Zhu, B.; Wang, T.; Liu, J. Changes in satellite-derived vegetation growth trend in temperate and boreal Eurasia from 1982 to 2006. Glob. Chang. Biol. 2011, 17, 3228–3239. [Google Scholar] [CrossRef]
- Fu, Y.H.; Zhao, H.; Piao, S.; Peaucelle, M.; Peng, S.; Zhou, G.; Ciais, P.; Huang, M.; Menzel, A.; Penuelas, J.; et al. Declining global warming effects on the phenology of spring leaf unfolding. Nature 2015, 526, 104–107. [Google Scholar] [CrossRef] [Green Version]
- Qian, C.; Shao, L.Q.; Hou, X.H.; Zhang, B.B.; Chen, W.; Xia, X.L. Detection and attribution of vegetation greening trend across distinct local landscapes under China’s Grain to Green Program: A case study in Shaanxi Province. Catena 2019, 183, 104182. [Google Scholar] [CrossRef]
- Zhou, Z.Q.; Ding, Y.B.; Shi, H.Y.; Cai, H.J.; Fu, Q.; Liu, S.N.; Li, T.X. Analysis and prediction of vegetation dynamic changes in China: Past, present and future. Ecol. Indic. 2020, 117, 106642. [Google Scholar] [CrossRef]
- Pettorelli, N.; Vik, J.O.; Mysterud, A.; Gaillard, J.M.; Tucker, C.J.; Stenseth, N.C. Using the satellite-derived NDVI to assess ecological responses to environmental change. TRENDS Ecol. Evol. 2005, 20, 503–510. [Google Scholar] [CrossRef]
- Chen, C.; Park, T.; Wang, X.; Piao, S.; Xu, B.; Chaturvedi, R.K.; Fuchs, R.; Brovkin, V.; Ciais, P.; Fensholt, R.; et al. China and India lead in greening of the world through land-use management. Nat. Sustain. 2019, 2, 122–129. [Google Scholar] [CrossRef] [PubMed]
- Piao, S.; Wang, X.; Park, T.; Chen, C.; Lian, X.; He, Y.; Bjerke, J.W.; Chen, A.; Ciais, P.; Tømmervik, H.; et al. Characteristics, drivers and feedbacks of global greening. Nat. Rev. Earth Environ. 2019, 1, 14–27. [Google Scholar] [CrossRef]
- Zhu, L.; Meng, J.; Zhu, L. Applying Geodetector to disentangle the contributions of natural and anthropogenic factors to NDVI variations in the middle reaches of the Heihe River Basin. Ecol. Indic. 2020, 117, 106545. [Google Scholar] [CrossRef]
- Zhang, Y.; Gao, J.; Liu, L.; Wang, Z.; Ding, M.; Yang, X. NDVI-based vegetation changes and their responses to climate change from 1982 to 2011: A case study in the Koshi River Basin in the middle Himalayas. Glob. Planet. Chang. 2013, 108, 139–148. [Google Scholar] [CrossRef]
- Sun, W.; Song, X.; Mu, X.; Gao, P.; Wang, F.; Zhao, G. Spatiotemporal vegetation cover variations associated with climate change and ecological restoration in the Loess Plateau. Agric. For. Meteorol. 2015, 209–210, 87–99. [Google Scholar] [CrossRef]
- Yang, L.; Shen, F.; Zhang, L.; Cai, Y.; Yi, F.; Zhou, C. Quantifying influences of natural and anthropogenic factors on vegetation changes using structural equation modeling: A case study in Jiangsu Province, China. J. Clean Prod. 2021, 280, 124330. [Google Scholar] [CrossRef]
- Leroux, L.; Bégué, A.; Lo Seen, D.; Jolivot, A.; Kayitakire, F. Driving forces of recent vegetation changes in the Sahel: Lessons learned from regional and local level analyses. Remote Sens. Environ. 2017, 191, 38–54. [Google Scholar] [CrossRef] [Green Version]
- Tian, F.; Fensholt, R.; Verbesselt, J.; Grogan, K.; Horion, S.; Wang, Y. Evaluating temporal consistency of long-term global NDVI datasets for trend analysis. Remote Sens. Environ. 2015, 163, 326–340. [Google Scholar] [CrossRef]
- Fensholt, R.; Rasmussen, K.; Nielsen, T.T.; Mbow, C. Evaluation of earth observation based long term vegetation trends—Intercomparing NDVI time series trend analysis consistency of Sahel from AVHRR GIMMS, Terra MODIS and SPOT VGT data. Remote Sens. Environ. 2009, 113, 1886–1898. [Google Scholar] [CrossRef]
- Petus, C.; Lewis, M.; White, D. Monitoring temporal dynamics of Great Artesian Basin wetland vegetation, Australia, using MODIS NDVI. Ecol. Indic. 2013, 34, 41–52. [Google Scholar] [CrossRef]
- Liu, C.; Li, W.; Wang, W.; Zhou, H.; Liang, T.; Hou, F.; Xu, J.; Xue, P. Quantitative spatial analysis of vegetation dynamics and potential driving factors in a typical alpine region on the northeastern Tibetan Plateau using the Google Earth Engine. Catena 2021, 206, 105500. [Google Scholar] [CrossRef]
- Peng, W.; Kuang, T.; Tao, S. Quantifying influences of natural factors on vegetation NDVI changes based on geographical detector in Sichuan, western China. J. Clean Prod. 2019, 233, 353–367. [Google Scholar] [CrossRef]
- Nie, T.; Dong, G.; Jiang, X.; Lei, Y. Spatio-Temporal Changes and Driving Forces of Vegetation Coverage on the Loess Plateau of Northern Shaanxi. Remote Sens. 2021, 13, 613. [Google Scholar] [CrossRef]
- Zheng, K.; Tan, L.; Sun, Y.; Wu, Y.; Duan, Z.; Xu, Y.; Gao, C. Impacts of climate change and anthropogenic activities on vegetation change: Evidence from typical areas in China. Ecol. Indic. 2021, 126, 107648. [Google Scholar] [CrossRef]
- Huo, H.; Sun, C.P. Spatiotemporal variation and influencing factors of vegetation dynamics based on Geodetector: A case study of the northwestern Yunnan Plateau, China. Ecol. Indic. 2021, 130, 108005. [Google Scholar] [CrossRef]
- Fan, X.; Liu, Y.; Tao, J.; Wang, Y.; Zhou, H. MODIS detection of vegetation changes and investigation of causal factors in Poyang Lake basin, China for 2001–2015. Ecol. Indic. 2018, 91, 511–522. [Google Scholar] [CrossRef]
- Qu, S.; Wang, L.C.; Lin, A.W.; Zhu, H.J.; Yuan, M.X. What drives the vegetation restoration in Yangtze River basin, China: Climate change or anthropogenic factors? Ecol. Indic. 2018, 90, 438–450. [Google Scholar] [CrossRef]
- Hao, J.; Xu, G.; Luo, L.; Zhang, Z.; Yang, H.; Li, H. Quantifying the relative contribution of natural and human factors to vegetation coverage variation in coastal wetlands in China. Catena 2020, 188, 104429. [Google Scholar] [CrossRef]
- Zhao, M.; Running, S.W. Drought-induced reduction in global terrestrial net primary production from 2000 through 2009. Science 2010, 329, 940–943. [Google Scholar] [CrossRef] [Green Version]
- Zhu, Z.; Piao, S.; Myneni, R.B.; Huang, M.; Zeng, Z.; Canadell, J.G.; Ciais, P.; Sitch, S.; Friedlingstein, P.; Arneth, A.; et al. Greening of the Earth and its drivers. Nat. Clim. Chang. 2016, 6, 791–795. [Google Scholar] [CrossRef]
- Yan, Y.; Liu, X.; Wen, Y.; Ou, J. Quantitative analysis of the contributions of climatic and human factors to grassland productivity in northern China. Ecol. Indic. 2019, 103, 542–553. [Google Scholar] [CrossRef]
- Li, J.; Wang, Z.; Lai, C.; Wu, X.; Zeng, Z.; Chen, X.; Lian, Y. Response of net primary production to land use and land cover change in mainland China since the late 1980s. Sci. Total Environ. 2018, 639, 237–247. [Google Scholar] [CrossRef] [PubMed]
- Wu, S.; Zhou, S.; Chen, D.; Wei, Z.; Dai, L.; Li, X. Determining the contributions of urbanisation and climate change to NPP variations over the last decade in the Yangtze River Delta, China. Sci. Total Environ. 2014, 472, 397–406. [Google Scholar] [CrossRef] [PubMed]
- Pei, F.; Li, X.; Liu, X.; Wang, S.; He, Z. Assessing the differences in net primary productivity between pre- and post-urban land development in China. Agric. For. Meteorol. 2013, 171–172, 174–186. [Google Scholar] [CrossRef]
- Wang, C.; Jiang, Q.; Engel, B.; Mercado, J.A.V.; Zhang, Z. Analysis on net primary productivity change of forests and its multi–level driving mechanism—A case study in Changbai Mountains in Northeast China. Technol. Forecast. Soc. Chang. 2020, 153, 119939. [Google Scholar] [CrossRef]
- Chen, T.; Bao, A.; Jiapaer, G.; Guo, H.; Zheng, G.; Jiang, L.; Chang, C.; Tuerhanjiang, L. Disentangling the relative impacts of climate change and human activities on arid and semiarid grasslands in Central Asia during 1982–2015. Sci. Total Environ. 2019, 653, 1311–1325. [Google Scholar] [CrossRef] [PubMed]
- Ouyang, Z.; Zheng, H.; Xiao, Y.; Polasky, S.; Liu, J.; Xu, W.; Wang, Q.; Zhang, L.; Xiao, Y.; Rao, E.; et al. Improvements in ecosystem services from investments in natural capital. Science 2016, 352, 1455–1459. [Google Scholar] [CrossRef] [PubMed]
- Tong, X.W.; Brandt, M.; Yue, Y.M.; Horion, S.; Wang, K.L.; De Keersmaecker, W.; Tian, F.; Schurgers, G.; Xiao, X.M.; Luo, Y.Q.; et al. Increased vegetation growth and carbon stock in China karst via ecological engineering. Nat. Sustain. 2018, 1, 44–50. [Google Scholar] [CrossRef]
- Piao, S.; Yin, G.; Tan, J.; Cheng, L.; Huang, M.; Li, Y.; Liu, R.; Mao, J.; Myneni, R.B.; Peng, S.; et al. Detection and attribution of vegetation greening trend in China over the last 30 years. Glob. Chang. Biol. 2015, 21, 1601–1609. [Google Scholar] [CrossRef] [PubMed]
- Xu, C.; McDowell, N.G.; Fisher, R.A.; Wei, L.; Sevanto, S.; Christoffersen, B.O.; Weng, E.; Middleton, R.S. Increasing impacts of extreme droughts on vegetation productivity under climate change. Nat. Clim. Chang. 2019, 9, 948–953. [Google Scholar] [CrossRef] [Green Version]
- Gu, Z.; Duan, X.; Shi, Y.; Li, Y.; Pan, X. Spatiotemporal variation in vegetation coverage and its response to climatic factors in the Red River Basin, China. Ecol. Indic. 2018, 93, 54–64. [Google Scholar] [CrossRef]
- Zhang, F.Y.; Zhang, Z.X.; Kong, R.; Chang, J.; Tian, J.X.; Zhu, B.; Jiang, S.S.; Chen, X.; Xu, C.Y. Changes in Forest Net Primary Productivity in the Yangtze River Basin and Its Relationship with Climate Change and Human Activities. Remote Sens. 2019, 11, 1451. [Google Scholar] [CrossRef] [Green Version]
- Wang, J.-F.; Zhang, T.-L.; Fu, B.-J. A measure of spatial stratified heterogeneity. Ecol. Indic. 2016, 67, 250–256. [Google Scholar] [CrossRef]
- Chen, T.; Xia, J.; Zou, L.; Hong, S. Quantifying the Influences of Natural Factors and Human Activities on NDVI Changes in the Hanjiang River Basin, China. Remote Sens. 2020, 12, 3780. [Google Scholar] [CrossRef]
- Wang, J.-F.; Hu, Y. Environmental health risk detection with GeogDetector. Env. Model. Softw. 2012, 33, 114–115. [Google Scholar] [CrossRef]
- Zhou, Y.; Li, X.; Liu, Y. Land use change and driving factors in rural China during the period 1995–2015. Land Use Policy 2020, 99, 105048. [Google Scholar] [CrossRef]
- Gao, J.; Wang, H. Temporal analysis on quantitative attribution of karst soil erosion: A case study of a peak-cluster depression basin in Southwest China. Catena 2019, 172, 369–377. [Google Scholar] [CrossRef]
- Yang, J.; Song, C.; Yang, Y.; Xu, C.; Guo, F.; Xie, L. New method for landslide susceptibility mapping supported by spatial logistic regression and GeoDetector: A case study of Duwen Highway Basin, Sichuan Province, China. Geomorphology 2019, 324, 62–71. [Google Scholar] [CrossRef]
- Xu, D.; Lyon, S.W.; Mao, J.; Dai, H.; Jarsjö, J. Impacts of multi-purpose reservoir construction, land-use change and climate change on runoff characteristics in the Poyang Lake basin, China. J. Hydrol. Reg. Stud. 2020, 29, 100694. [Google Scholar] [CrossRef]
- Liu, H.; Zheng, L.; Liao, M. Dynamics of Vegetation Change and Its Relationship with Nature and Human Activities—A Case Study of Poyang Lake Basin, China. J. Sustain. For. 2020, 40, 47–67. [Google Scholar] [CrossRef]
- Liu, F.H.; Xu, C.Y.; Yang, X.X.; Ye, X.C. Controls of Climate and Land-Use Change on Terrestrial Net Primary Productivity Variation in a Subtropical Humid Basin. Remote Sens. 2020, 12, 3525. [Google Scholar] [CrossRef]
- Tan, Z.; Tao, H.; Jiang, J.; Zhang, Q. Influences of Climate Extremes on NDVI (Normalized Difference Vegetation Index) in the Poyang Lake Basin, China. Wetlands 2015, 35, 1033–1042. [Google Scholar] [CrossRef]
- Zhang, Z.; Chen, X.; Xu, C.-Y.; Hong, Y.; Hardy, J.; Sun, Z. Examining the influence of river–lake interaction on the drought and water resources in the Poyang Lake basin. J. Hydrol. 2015, 522, 510–521. [Google Scholar] [CrossRef]
- Holben, B.N. Characteristics of maximum-value composite images from temporal AVHRR data. Int. J. Remote Sens. 2007, 7, 1417–1434. [Google Scholar] [CrossRef]
- Jiang, L.; Guli, J.; Bao, A.; Guo, H.; Ndayisaba, F. Vegetation dynamics and responses to climate change and human activities in Central Asia. Sci. Total Environ. 2017, 599–600, 967–980. [Google Scholar] [CrossRef] [PubMed]
- Tong, X.; Wang, K.; Yue, Y.; Brandt, M.; Liu, B.; Zhang, C.; Liao, C.; Fensholt, R. Quantifying the effectiveness of ecological restoration projects on long-term vegetation dynamics in the karst regions of Southwest China. Int. J. Appl. Earth Obs. Geoinf. 2017, 54, 105–113. [Google Scholar] [CrossRef] [Green Version]
- Qu, S.; Wang, L.C.; Lin, A.W.; Yu, D.Q.; Yuan, M.X.; Li, C.A. Distinguishing the impacts of climate change and anthropogenic factors on vegetation dynamics in the Yangtze River Basin, China. Ecol. Indic. 2020, 108, 105724. [Google Scholar] [CrossRef]
- Peng, J.; Jiang, H.; Liu, Q.; Green, S.M.; Quine, T.A.; Liu, H.; Qiu, S.; Liu, Y.; Meersmans, J. Human activity vs. climate change: Distinguishing dominant drivers on LAI dynamics in karst region of southwest China. Sci. Total Environ. 2021, 769, 144297. [Google Scholar] [CrossRef] [PubMed]
- Ge, W.; Deng, L.; Wang, F.; Han, J. Quantifying the contributions of human activities and climate change to vegetation net primary productivity dynamics in China from 2001 to 2016. Sci. Total Environ. 2021, 773, 145648. [Google Scholar] [CrossRef]
- Song, Y.; Wang, J.; Ge, Y.; Xu, C. An optimal parameters-based geographical detector model enhances geographic characteristics of explanatory variables for spatial heterogeneity analysis: Cases with different types of spatial data. GISci. Remote Sens. 2020, 57, 593–610. [Google Scholar] [CrossRef]
- Wang, X.; Wang, B.; Xu, X.; Liu, T.; Duan, Y.; Zhao, Y. Spatial and temporal variations in surface soil moisture and vegetation cover in the Loess Plateau from 2000 to 2015. Ecol. Indic. 2018, 95, 320–330. [Google Scholar] [CrossRef]
- Liu, L.; Wang, Y.; Wang, Z.; Li, D.; Zhang, Y.; Qin, D.; Li, S. Elevation-dependent decline in vegetation greening rate driven by increasing dryness based on three satellite NDVI datasets on the Tibetan Plateau. Ecol. Indic. 2019, 107, 105569. [Google Scholar] [CrossRef]
- Yin, J.; Zhang, C.; Zhang, C. Clinate feature analysis about extraordinary drought in jiangxi in 2003. Jiangxi Meteorol. Technol. Sci. 2005, 28, 19–22. [Google Scholar]
- Ma, L.; Sun, G.; Ma, Y.; Wang, J.; Shu, J. A study on the influence of extreme weather and climate on tourism: A case on snowstorm in 2008. Resour. Sci. 2010, 32, 107–112. [Google Scholar]
- Wu, S.; Hu, Z.; Wang, Z.; Cao, S.; Yang, Y.; Qu, X.; Zhao, W. Spatiotemporal variations in extreme precipitation on the middle and lower reaches of the Yangtze River Basin (1970–2018). Quat. Int. 2021, 592, 80–96. [Google Scholar] [CrossRef]
- Meng, X.; Gao, X.; Li, S.; Lei, J. Spatial and Temporal Characteristics of Vegetation NDVI Changes and the Driving Forces in Mongolia during 1982–2015. Remote Sens. 2020, 12, 603. [Google Scholar] [CrossRef] [Green Version]
- Li, Z.; Chen, Y.; Li, W.; Deng, H.; Fang, G. Potential impacts of climate change on vegetation dynamics in Central Asia. J. Geophys. Res. Atmos. 2015, 120, 12345–12356. [Google Scholar] [CrossRef]


| Categories | Factors | Code | Unit |
|---|---|---|---|
| Fundamental natural environment | Elevation | X1 | m |
| Slope | X2 | degree | |
| Aspect | X3 | categorical | |
| Soil type | X4 | categorical | |
| Climate change | Mean annual precipitation | X5 | mm |
| Mean annual temperature | X6 | °C | |
| Anthropogenic activity | Land-use type | X7 | categorical |
| Population density | X8 | people/km2 | |
| Distance to main roads | X9 | km |
| Categories \Factors | Elevation m | Slope Degree | Aspect | Soil Type | Mean Annual Precipitation mm |
| 1 | −107–126 | 0–2 | Gentle slope | Leached | 1475.32–1683.01 |
| 2 | 126–265 | 2–6 | North slope | Primary | 1683.01–1843.23 |
| 3 | 265–433 | 6–15 | Northeast slope | Semi-hydromorphic | 1843.23–1979.71 |
| 4 | 433–652 | 15–25 | East slope | Anthropogenic | 1979.71–2116.19 |
| 5 | 652–984 | 25–35 | Southeast slope | Ferralsol | 2116.19–2312.02 |
| 6 | 984–2086 | 35–46 | South slope | Urban | 2312.02–2982.56 |
| 7 | Southwest slope | Lakes and reservoirs | |||
| 8 | West slope | Rivers | |||
| 9 | Northwest slope | Islands | |||
| Categories \Factors | Mean Annual Temperature °C | Land-Use Type | Population Density Person/km2 | Distance to Main Roads km2 | |
| 1 | 9.23–14.47 | Cropland | 0–50 | 0–5 | |
| 2 | 14.47–16.26 | Forest | 50–100 | 5–10 | |
| 3 | 16.26–17.52 | Grassland | 100–200 | 10–20 | |
| 4 | 17.52–18.46 | Water area | 200–300 | 20–30 | |
| 5 | 18.46–19.31 | Construction land | 300–400 | 30–40 | |
| 6 | 19.31–20.66 | Unused land | >400 | 40–67 |
| Interaction Relationship | Interaction Types | Description |
|---|---|---|
| q(Xi∩Xj) < Min(q(Xi),q(Xj)) | Nonlinear-weaken | The impacts of single variables are nonlinearly weakened by the interaction of two variables. |
| Min(q(Xi),q(Xj)) < q(Xi∩Xj) < Max(q(Xi),q(Xj)) | Uni-variable weaken | The impacts of single variables are uni-variable weakened by the interaction of two variables |
| q(Xi∩Xj) = q(Xi) + q(Xj) | Independent | The impacts of single variables are independent. |
| Max(q(Xi),q(Xj)) < q(Xi∩Xj) < q(Xi) + q(Xj) | Bi-variable enhanced | The impacts of single variables are bi-variably enhanced by the interaction of two variables. |
| q(Xi∩Xj) > q(Xi) + q(Xj) | Nonlinear-enhanced | The impacts of single variables are nonlinearly enhanced by the interaction of two variables. |
| Year | 2000 | 2020 | 2000–2020 | |||
|---|---|---|---|---|---|---|
| NDVI | Area km2 | Proportion % | Area km2 | Proportion % | Area Change km2 | Proportion % |
| [0–0.2) | 1668 | 1.03 | 648 | 0.40 | −1020 | −0.63 |
| [0.2–0.4) | 1419 | 0.88 | 2045 | 1.26 | 626 | 0.38 |
| [0.4–0.6) | 7597 | 4.69 | 5889 | 3.63 | −1708 | −1.06 |
| [0.6–0.8) | 87,334 | 53.89 | 48,186 | 29.73 | −39,148 | −24.16 |
| [0.8–1.0] | 64,040 | 39.52 | 105,289 | 64.97 | 41,249 | 25.45 |
| Factors | X1 | X2 | X3 | X4 | X5 | X6 | X7 | X8 | X9 |
|---|---|---|---|---|---|---|---|---|---|
| X1 | |||||||||
| X2 | Y | ||||||||
| X3 | N | N | |||||||
| X4 | N | N | Y | ||||||
| X5 | N | N | Y | N | |||||
| X6 | N | N | Y | N | Y | ||||
| X7 | Y | Y | Y | Y | Y | Y | |||
| X8 | N | N | Y | N | Y | Y | N | ||
| X9 | N | N | Y | N | N | N | N | N |
| Factors | Unit | Appropriate Range/Type | Mean Value of NDVI |
|---|---|---|---|
| Elevation | m | 984–2086 | 0.906 |
| Slope | degree | 25–35 | 0.903 |
| Aspect | categorical | North; West; Northwest | 0.818 |
| Soil type | categorical | Leached; Ferralsol | 0.837 |
| Mean annual temperature | °C | 9.23–14.47 | 0.906 |
| Mean annual precipitation | mm | 2312.02–2982.56 | 0.886 |
| Land-use type | categorical | Forest | 0.849 |
| Population density | people/km2 | 50–100 | 0.851 |
| Distance to main roads | km | 40–67 | 0.862 |
| 2000\2020 | Cropland | Forest | Grassland | Water Area | Construction Land | Unused Land |
|---|---|---|---|---|---|---|
| Cropland | 0.031(13.80) | 0.053(9.49) | 0.061(0.92) | 0.038(1.00) | −0.058(1.65) | 0.028(<<0.01) |
| Forest | 0.057(9.57) | 0.059(49.45) | 0.061(2.10) | 0.070(0.63) | −0.044(0.84) | 0.052(<<0.01) |
| Grassland | 0.063(1.00) | 0.065(1.96) | 0.073(1.28) | 0.075(0.10) | −0.010(0.10) | 0.055(<<0.01) |
| Water area | 0.038(1.00) | 0.078(0.57) | 0.085(0.10) | 0.123(2.66) | −0.019(0.16) | \ |
| Construction land | 0.012(0.83) | 0.031(0.29) | 0.029(0.05) | −0.003(0.09) | −0.043(0.35) | \ |
| Unused land | 0.083(<<0.01) | 0.071(0.01) | \ | \ | −0.185(<<0.01) | 0.169(<<0.01) |
Publisher’s Note: MDPI stays neutral with regard to jurisdictional claims in published maps and institutional affiliations. |
© 2021 by the authors. Licensee MDPI, Basel, Switzerland. This article is an open access article distributed under the terms and conditions of the Creative Commons Attribution (CC BY) license (https://creativecommons.org/licenses/by/4.0/).
Share and Cite
Wang, Y.; Zhang, Z.; Chen, X. Quantifying Influences of Natural and Anthropogenic Factors on Vegetation Changes Based on Geodetector: A Case Study in the Poyang Lake Basin, China. Remote Sens. 2021, 13, 5081. https://doi.org/10.3390/rs13245081
Wang Y, Zhang Z, Chen X. Quantifying Influences of Natural and Anthropogenic Factors on Vegetation Changes Based on Geodetector: A Case Study in the Poyang Lake Basin, China. Remote Sensing. 2021; 13(24):5081. https://doi.org/10.3390/rs13245081
Chicago/Turabian StyleWang, Yiming, Zengxin Zhang, and Xi Chen. 2021. "Quantifying Influences of Natural and Anthropogenic Factors on Vegetation Changes Based on Geodetector: A Case Study in the Poyang Lake Basin, China" Remote Sensing 13, no. 24: 5081. https://doi.org/10.3390/rs13245081