Abstract
Measurements of the Doppler signature in UHF-band of a human moving in outdoor sites are presented in this paper. A radar campaign has been carried out, observing a subject walking and running outside, near and within a forest. A bistatic radar has been employed working in continuous wave (CW) at 1 GHz and 435 MHz. The spectrograms acquired in VV polarization are shown and discussed. This study aims to prove the feasibility of detecting people moving in forested areas at low frequencies. Besides, we highlight the impact of the frequencies and the different sites on the Doppler spectrum of the human motions. The Doppler frequency signature of the moving man has been well detected at 1 GHz and 435 MHz for each motor activity and scene. The working frequency 435 MHz has proved to be more efficient for the detection and classification of the physical activities.
1. Introduction
In the last decade, the growing demand for surveillance and security operations has renewed a significant interest in radar technology. In particular, Doppler radars have been widely used for the identification and monitoring of human subjects.
The movements of the human body, in addition to the micro-motions, such as limb swings or torso bobbing, induce frequency shifts around the carrier frequency of the reflected signal. It follows that the Doppler signature of a human movement is a distinctive characteristic [1]. The research studies first focused on the analysis of the micro-Doppler effect of the moving human by using a walking model [2]. Hence, the Doppler gait signature has been extensively analyzed in the frequency domain, observing the spectrograms acquired by simulation at 10.52 GHz [3] and by experimental tests at 9.68 GHz [4] and 12.5 GHz [5] for instance.
Then, automatic target recognition algorithms have been developed to classify different moving targets and their motions. Kim et al. provided a classification based on micro-Doppler features of the various human activities such as walking, running, crawling, boxing, and sitting by using a support vector machine (SVM) [6] and a deep convolutional neural network (DCNN) [7]. The physical activities have been measured by using a Doppler radar, working in monostatic configuration at 2.4 GHz and 7.25 GHz, respectively. He et al. classified the walk, run, jump, circle, and box of six subjects at 4 GHz, by implementing a multiscale residual attention network (MRA-Net) [8]. Yang et al. analyzed the Doppler signature of people walking with no bag or walking carrying baggage with one hand or both. Doppler features such as period, offset, and Doppler bandwidth have been extracted, and an SVM has been used for the classification. The analysis has been carried out in the X- and K-band, and experimental data have been provided [9]. Bilik et al. [10] focused on distinguishing people from animals and wheeled vehicles using the analysis of the moving target. The targets have been recorded by a 9 GHz ground surveillance pulse-Doppler radar, and the corresponding spectrograms have been used for the classification. Otero [11] and Andrić [12] have proposed, at 10.525 GHz and 16.8 GHz, respectively, the cadence frequency and the stride length analysis to distinguish different physical activities performed simultaneously from a group of people. Björklund [13] used a 77 GHz radar in monostatic configuration to detect and classify the two persons’ micro-Doppler signature moving in different ways and directions. Recently, full polarimetric radar data have been collected in the Ku-, Ka- and W-bands for the detection and classification of potential threats among people walking, running [14,15], or carrying something in their arms [16,17].
Doppler-based techniques have also been employed to detect human targets in urban centers. The complex background environment plays a critical role in tracking humans in open-air sites. The main challenge is to deal with the multipath propagation that may induce a wrong location of the target that seems consequently to be further away; ghost responses can also appear in the Doppler images [18]. The Doppler signatures of moving subjects in urban multipath environments have been analyzed by the ray-tracing propagation method at 16.9 GHz [19]. Experimental tests have been performed by using Doppler radars working in CW at 10 GHz, in monostatic [20] and quasi-monostatic configuration [21].
Similarly, the micro-Doppler response of humans moving within forested areas is an active research topic with many unsolved problems, such as the impact of the forest components and their possible interaction with the human body. Garcia-Rubia et al. [22] investigated at 5 GHz the first-order mutual coupling effects between the forest and a moving subject on the received Doppler signature. The forest, represented by trunks and branches, as well as the human body, have been modeled as being perfectly conductive. The backscattered fields have been calculated by using the Method of Moments Fast Multipole Method (MoM-FMM). However, the proposed representation is far from a real scenario, as both forest and human components are complex dielectric structures. Therefore, the influence of the forest on the signal reflected by a moving human needs further investigation. The radar applications involving penetrating lossy materials operate mostly at low frequencies [23,24]. Davis [25] has highlighted more efficient radars operating in L-band (1.3 GHz) and in UHF-band (400 MHz) to detect vehicles moving under heavily foliated regions. Dogaru et al. [26] instead have performed a spectrogram analysis at 300 MHz, analyzing the coupling effects between parts of the body moving in free space. These studies are based on numerical tests that do not consider surrounding cluttered environments. Moreover, no measurements have been carried out.
Therefore, the authors aim is to analyze at low frequencies and through experimental tests the Doppler spectrum of a man moving within a forested area. A campaign of measurements has been performed, observing a human walking and running in three outdoor scenarios: outside, near, and within the forest. Doppler spectrograms have been used in order to analyze the impact of the surrounding environment on the frequency signature of the moving target. A bistatic CW radar system has been employed at 1 GHz and 435 MHz in order to avoid the leakages introduced by the circulator, usually employed in a monostatic configuration [27,28,29].
The paper is organized as follows. The bistatic radar system used for the measurements is described in Section 2. A preliminary study of the frequency signature of the walk, the run, and the extraction of the Doppler features are discussed in Section 3. The measurement setup and the spectrograms of the moving target analyzed for each scene, and working frequency are described in Section 4. A discussion concerning the possibility of distinguishing the chosen physical activities through the collected Doppler features is deepened in Section 5. Finally, the conclusions are presented in Section 6.
2. Radar Setup
A description of the transmitting (TX) and receiving (RX) units used for the radar measurements are given in this section. The radar sensors’ parameters are listed in Table 1.

Table 1.
Radar settings at the working frequencies = 1 GHz and = 435 MHz.
Log-periodic and Yagi antennas have been employed to work in CW at 1 GHz and 435 MHz, respectively. The TX and RX antennas have been mounted at 1.35 m above the ground and located at 0 azimuth and 0 elevation. RG213 coaxial cables have been used to feed the antennas, whose features are shown in Table 1.
The baseline distance L between the radars has been chosen to minimize as far as possible the mutual coupling of the antennas. At low frequencies, indeed, the intensity of the interactions between close sensors is no longer negligible, and therefore it may mask the weak reflected signal. Hence, the scattering parameter has been measured at 435 MHz, spacing out the Yagi antennas, vertically polarized, at 2.5 m, 5 m, 10 m, and 16 m, respectively, from each other. Table 2 shows the decrease of the coefficient as the distance between the antennas increases. Previous studies presented in [6,22] showed Doppler signatures of humans moving in clutter environments with an average intensity of −50 dB. Consequently, L = 16 m has been chosen, as is lower than the expected Doppler signal detectable by the radar system. The chosen L guarantees a negligible mutual coupling for our measurements.
Table 2.
Measured at 435 MHz.
The radar configuration adopted for each scene and working frequency is depicted in Figure 1. The cooperating target has started and completed his activities at the distances R corresponding to 40 m and 10 m, respectively, away from the antennas. The near-field and the far-field regions around the antennas and the target have been calculated [30]. The results are listed in Table 3 and Table 4, corresponding to the working frequencies and .
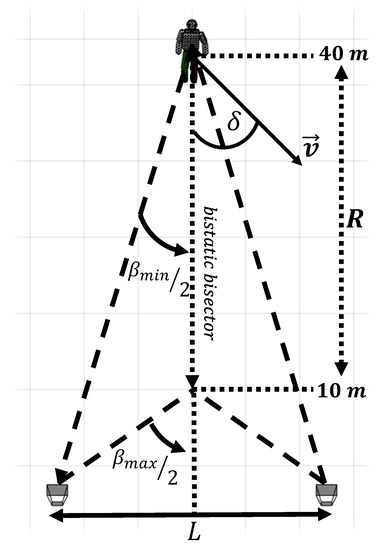
Figure 1.
Bistatic geometry and parameters for bistatic radar operations.
Table 3.
Near and Far Field regions around the antennas and the target at = 1 GHz.
Table 4.
Near and Far Field regions around the antennas and the target at = 435 MHz.
The results shown in Table 3 and Table 4, combined with the chosen distances R, highlight that both the Yagi and Log-periodic antennas have been placed in far-field region respect to the moving target. Conversely, the moving subject is in the far-field region from the antennas along the entire path at 435 MHz, and up to 20 m at 1 GHz. Finally, the chosen L and R outline a tracking area, characterized by a bistatic angle linearly varying from 42.6 to 77.4.
A block diagram of the employed radar system is depicted in Figure 2. The received signal has been filtered, amplified and down-converted to an intermediate frequency = 15 MHz. The resulting signal is the input of an ICS-554B-MN model, composed of four 14-bit analog device converters (ADCs) working at 100 MHz, and four Graychip GC4016 quad digital down-converters (DDC) chips, containing four identical down-conversion channels. Every single channel contains a numerically-controlled oscillator (NCO) and a mixer, followed by a 5 stage Cascade Integrate Comb (CIC) filter, a Compensation finite impulse response (CFIR) filter, a Programmable FIR (PFIR) filter, and a re-sampler. The architecture of the DDC is depicted in Figure 3. The DDC circuit accepts 14-bit inputs and produces 24-bit outputs.
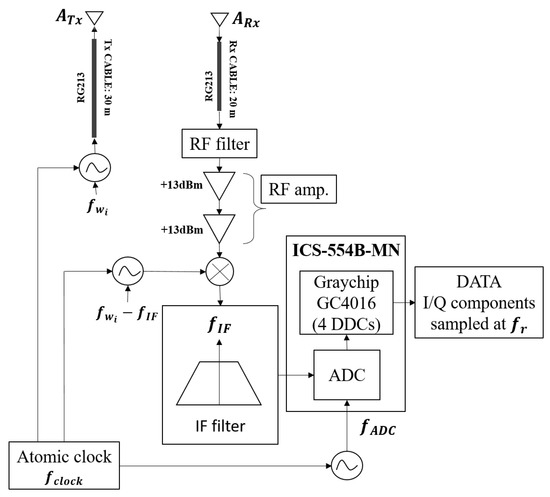
Figure 2.
Block diagram of the radar system working at = [1 GHz, 435 MHz].
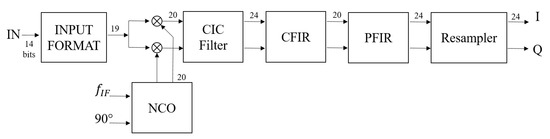
Figure 3.
GC4016 Block Diagram: DDC Single Channel.
Therefore, the signal, centered at , is captured by the ADC, converted in 14-bit samples, and sent to the DDC unit. The NCO and the mixer down convert the signal to baseband, whereas the CIC, CFIR, and PFIR in sequence low pass filter and isolate the down-converted signal. In the end, the signal is sampled with a repetition frequency = 10 kHz.
The CIC, CFIR, and PFIR filters are configured in a SPLITIQ mode, and two channels of the Graychip GC4016 are used in parallel. Consequently, the real half of the complex output data is processed in one channel and the imaginary half in the other, obtaining the in-phase (I) and quadrature-phase (Q) components of the signal.
An atomic clock has been used to synchronize the local oscillators (LOs) employed in the radar system, setting a clock frequency = 10 MHz.
3. Simulated Doppler Features of Moving Persons
The bistatic Doppler frequency modulations of the walk and the run have been first analyzed in simulation. The purpose was to characterize the Doppler frequencies of the human motions by the extraction of representative features. The simulation setup, the extracted bistatic Doppler features, and the data processing directions for the measured signals are deepened in this section.
3.1. Simulations
Four subjects have been simulated, with speeds ranging from 0.8 m/s to 1.4 m/s for the walk and from 3.1 m/s to 3.7 m/s for the run. To simulate the motions, we used the Vicon motion capture system’s data at 120 Hz [31]. The motion trajectories of the target have been then translated in relative angles and distances. Equivalent 3D human models of height 1.76 m have been implemented using the body gestures corresponding to the walk and the run. The dummies have been modeled as having 11 body parts represented by geometric shapes, and their sizes have been chosen to be equivalent to the average human body sizes [32,33].
The Doppler frequency modulations of each body part have been analytically calculated for each activity and working frequency, according to the equation of the bistatic Doppler shift [34], defined as follows
denotes the target bistatic Doppler frequency for stationary transmitter and receiver, the vector velocity, the wavelength related to the chosen working frequency, the bistatic angle, and the aspect angle of . When the simulated subjects walk or run straight to the antennas, is equal to zero and is parallel to the bistatic bisector (Figure 1). Consequently, the factor in (1) can be viewed as a bistatic Doppler reduction factor with reference to a maximum value found for = 0. [35]
The individual Doppler contributions of the torso, arms and legs, of a man walking at 1.2 m/s and running at 3.2 m/s, calculated at 1 GHz and 435 MHz, are shown in Figure 4 and Figure 5 as representative cases. The motions have been analyzed as a function of . Three main aspects arise from the first analysis of the Doppler frequencies of the moving man:
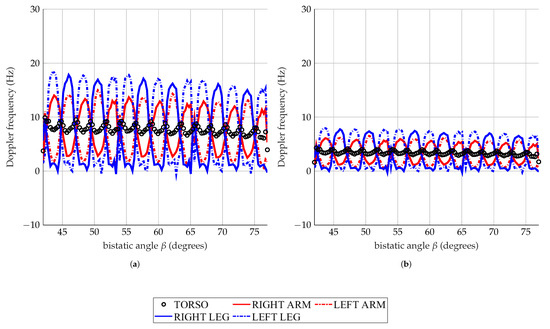
Figure 4.
Simulated man walking at 1.2 m/s. Doppler frequencies of the torso, arms, and legs analyzed at 1 GHz (a), and 435 MHz (b).
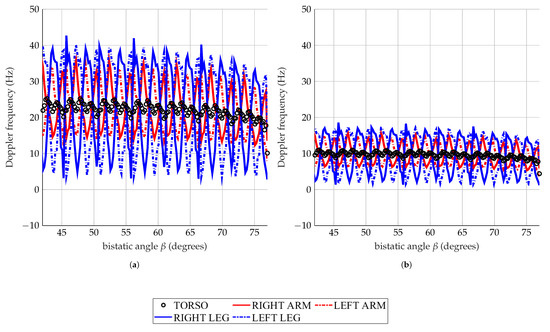
Figure 5.
Simulated man running at 3.2 m/s. Doppler frequencies of the torso, arms, and legs analyzed at 1 GHz (a), and 435 MHz (b).
- A low working frequency implies a lower Doppler bandwidth, and the contributions of the different body parts are more superimposed and less distinguishable from each other.
- The maximum value of the Doppler displacements detectable at each instant of time decreases as the bistatic angle increases.
3.2. Doppler Features
As already presented by Y. Kim and H. Ling in [6], four Doppler features have been chosen to characterize the frequency response of the motor activities: (1) the torso Doppler frequency, (2) the period, (3) the total bandwidth (BW) of the Doppler signal, and (4) the offset. The Doppler features of the walk and the run, analyzed at = 1 GHz and = 435 MHz, are listed in Table 5 and Table 6, respectively.
Table 5.
Simulated intervals of the Doppler features of the walk.
Table 6.
Simulated intervals of the Doppler features of the run.
The features have been automatically extracted from the data shown in Figure 4 and Figure 5 as presented in the previous work [36]. The torso Doppler frequency (1) is related to the speed of the monitored subject. The Doppler monotonic patterns of the torso observed around 8 Hz and 3.4 Hz in Figure 4, and at 21.3 Hz and 9.3 Hz in Figure 5, denote the same walking (1.2 m/s) and running (3.2 m/s) speeds, according to (1). The simulated speeds are indeed independent of the working frequencies and . Feature (2) is the period of the Doppler response from the torso. It corresponds to the legs’ half swings rate, and it is independent of the working frequencies, as highlighted by Table 5 and Table 6. The total BW of the Doppler signal (3) is provided by the highest speeds of the limbs. Whereas, the offset (4) outlines the asymmetry between the forward and backward motions of the arms and the legs. For the calculation of the features (3) and (4), two envelopes are identified: the high-frequency envelope (HFE) and the low-frequency envelope (LFE). Figure 6 shows the two extracted frequency envelopes by processing the Doppler spectrum relative to the walk, analyzed at 1 GHz. HFE is made up of the highest Doppler frequency, whereas LFE is made up of the lowest Doppler frequency. Thus, the total BW (3) is calculated as the averaged difference between the highest frequency of HFE and the lowest frequency of LFE. The offset (4) is the mean value between the largest frequency of HFE and the smallest of LFE.
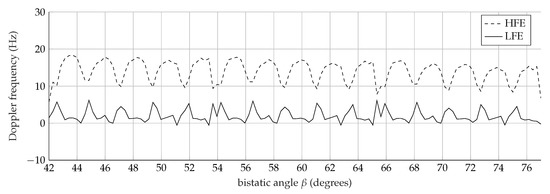
Figure 6.
Frequency envelopes extracted from the Doppler spectrum of the walk analyzed at 1 GHz: the high-frequency envelope (HFE) (dashed line), the low-frequency envelope (LFE) (continuous line).
3.3. Data Processing Directions
The values predicted by simulations give useful directions for the data processing. For instance, the sampling frequency has to be at least twice the highest detected Doppler frequency to avoid aliasing in the spectrogram [37]. Consequently using (1), is directly related to the maximum speed as follows
c is the speed of the light and the working frequency. The highest Doppler frequency of about 40 Hz has been calculated by analyzing the legs’ swings during the run at = 1 GHz, as observed in Figure 4. Using (1) we estimated a = 6.13 m/s. It follows that a higher than 80 Hz has to be chosen to detect the maximum speed of the observing subject, according to (2).
The choice of the frequency resolution in the time-frequency analysis depends on the lowest detectable Doppler shift. Feature (1) listed in Table 6 highlights that the lowest Doppler frequency is equal to 2.4 Hz, corresponding to the movement of the torso in the walking analysis at 435 MHz. It means that at least a of about 2 Hz is required to highlight the Doppler contributions of the moving body parts.
4. Measurements
The aim of the measurements is twofold: to analyze in the UHF-band the Doppler spectrum of the moving person; to investigate the effects of the surrounding dynamic environment in the Doppler signal collected by the radar. Three different outdoor scenarios have been chosen for this purpose: an open ground (Figure 7a), a grass field with the presence of a row of trees (Figure 7b), and a forest (Figure 7c). A cooperating target of size 1.74 m × 0.45 m has been measured at low frequencies performing a walk and a run. The motor activities have been carried out for each outdoor scene by using the same setup. Thus, the target has walked 30 m and been observed for 30 s. A different methodology has been chosen for the run. The subject was asked to stay still for 6 s after the beginning of the measure, then to run 30 m and to conclude the activity in still position until the end of the measurement. In what follows, represents the signal collected without the target, and stands for the signal collected with the target. These signals have been separately recorded for each chosen scene, frequency, polarization, and motor activity.
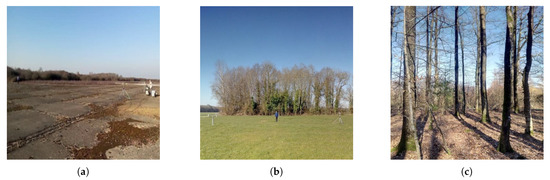
Figure 7.
Analyzed outdoor scenarios: (a) an open ground, (b) a grass field with a row of trees, and (c) a forest.
The Doppler spectrograms related to the VV polarization are shown and described in this section.
4.1. Signal Processing
The signals and have been first processed as follows
We neglect the possible mutual interactions between the body parts and the surrounding environment. Therefore we assume that the resulting signal corresponds approximately to the signal reflected by the target alone. Moreover, a high pass filter with a cut-off frequency = 0.1 Hz has been applied to to suppress the stationary background. We could consider that the analyzed radar signal given by (3) is a sum of N several components:
where each component is the phase, frequency modulated, related to each target displacements. These components can be associated with the corresponding mean radial velocity v, such as where . Thus, the Doppler frequency can be associated with the general mean velocity of one of N scattering components of the moving human subject, such as the head, torso, arms, legs, etc. The Time-Frequency distributions’ goal is to estimate the instantaneous frequencies associated with those movements allowing the recovery of the different instantaneous frequency components. Ideally, the energetic time-frequency distribution (Cohen Class [38], Affine Class [39]) is built to perfectly localize the energy of the analyzed signal on Dirac components :
One of the most popular class of time-frequency distributions is the Cohen class defined as:
where is a kernel generally chosen by the user and satisfying . The choice leads to the well known Wigner-Ville distribution [40]. This latter suffers from generating interferences between all the components [41,42].
When the kernel is chosen to be the ambiguity function of a given time window instead, i.e.,
the corresponding Time-Frequency distribution is leading to the so-called Short-Time Fourier Transform distribution (STFT), which has been here used to analyze the Doppler spectrum’s time variation of the measured signal:
being the input complex signal in I-Q components at the time t, the smoothing window. The STFT is a time-varying power spectral density (PSD) of the data. A Hanning window for has been applied with a coherent processing interval (CPI) equal to 0.5 s, which implies a frequency resolution = 2 Hz. A time stride of 10 ms is also applied to provide high resolution in both the frequency and time axes. Thus the spectrograms have an 80% overlap in the time series. The results are plotted in dB scale, where the x-axis represents the slow time, and the y-axis the Doppler frequency shift. The modulation of is related to as follows
where is
depends on the bistatic Doppler reduction factor and it varies from 6.21 m to 5.20 m and from 2.70 m to 2.26 m for and respectively, as shown in Figure 8. These values have been used to retrieve the corresponding speeds from the Doppler frequencies shown in the measured spectrograms.
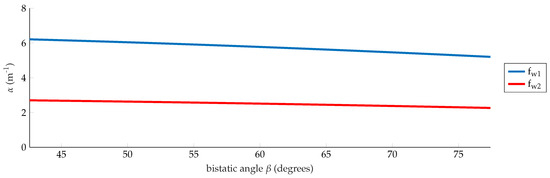
Figure 8.
Scale factor at = 1 GHz and = 435 MHz.
Furthermore, a threshold equal to −80 dB has been applied to the Doppler images to reduce the noise clutter.
4.2. Subject Walking and Running Outside the Forest
The first analysis focuses on the Doppler spectrum of the cooperating target walking straight toward the antennas in an open ground, measured at 1 GHz. The corresponding spectrogram is shown in Figure 9a and the extracted Doppler features are listed in the second column of Table 7. The subject has walked approximately 30 s traveling 30 m, with a supposed average speed of 1 m/s. The Doppler shifts are principally positive, meaning a target approaching the radar system. The spectrogram is characterized by a high-intensity pattern zigzag-shaped, starting from 15 s. This pattern is due to the acceleration and deceleration of the human’s chest from which the torso Doppler frequency (1) = 5.65 Hz has been extracted. Feature (1) implies a speed of 0.85 m/s, according to (1), which is close to the supposed walking speed. The spikes, detected with an intensity around −70 dB at the lower and upper edges of the pattern, can be related to the contributions of the limbs [6,7]. The speeds of the limb motions determine a total BW (3) of 25.6 Hz. The offset (4) equal to 12.8 Hz highlights the asymmetry between the forward and backward motions of the limbs during the walk, as observed in the total Doppler pattern shown in Figure 9a. Nearly all the extracted values fall within the simulated ranges at 1 GHz, and consequently, the monitored activity has been classified as walking motion.
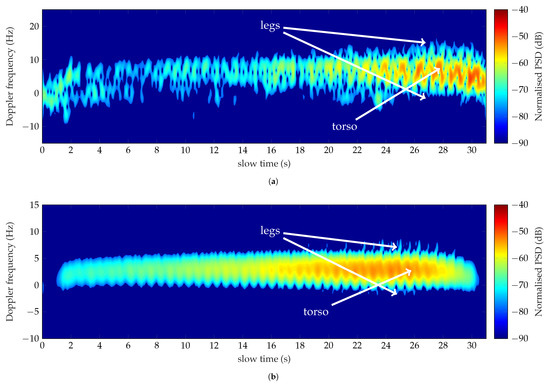
Figure 9.
Doppler spectra of a man walking outside the forest analyzed at 1 GHz (a) and 435 MHz (b).
Table 7.
Measured and simulated Doppler features of a subject walking outside the forest, analyzed at 1 GHz and at 435 MHz.
Figure 9b shows the Doppler signature of the walk measured at 435 MHz. The subject covered 30 m in approximately 28 s with an average speed of 1.07 m/s. It is important to notice the change in the spectrogram respect to the one depicted in Figure 9a. It could be attributed to the mutual coupling between the body parts that cannot be neglected at this frequency [26]. It follows that the contributions of the different body parts are no longer distinguishable from each other. The Doppler returns of the arms, and the legs superimpose the regular zigzag pattern produced by the chest. Tiny and weak intensity spikes are observed at the end of the monitored activity when the target is at 10 m from the antennas. Despite the scattering phenomenology, the extracted Doppler features, presented in the third column of Table 7, are in good accordance with the simulated values. The feature (1) = 2.87 Hz corresponds to a velocity of about 1 m/s, in agreement with the target’s speed. The features (2)–(4) prove the unique Doppler signature of the walk at the chosen frequency, highlighting its slow and non-uniform movement.
The Doppler spectrum of the run measured at 1 GHz is shown in Figure 10a. The spectrogram reflects the different methodology explained in Section 4. The cooperating target has run 30 m for approximately 15 s with an average speed of 2 m/s. The acceleration and deceleration of the monitored target are well outlined by the green-orange pattern related to the torso’s Doppler echoes. The cyan spikes around the main pattern are related to the highest speeds achieved by the limbs. The classification of the monitored activity has been carried out, taking into account the time interval from 8 s to 18 s, during which the target’s speed appears quite constant in Figure 10a. The Doppler characteristics are listed in the second column of Table 8. The torso Doppler frequency (1) = 15.1 Hz implies a speed of 2.31 m/s, lower than the simulated speeds for the run described in Section 3. It follows that the measured features are lower than the simulated ones except for feature (2). The period indeed depends on the legs’ swings, and a difference of 0.7 m/s respect to the lowest simulated speed induces a negligible error on the detected value.
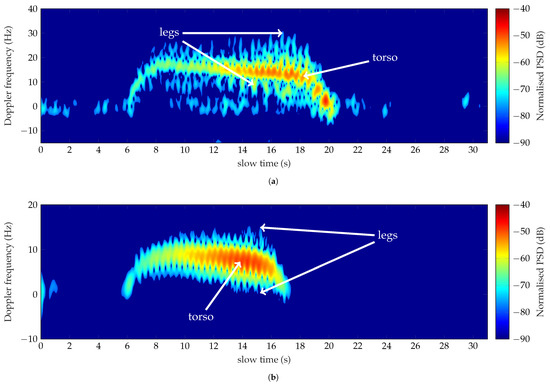
Figure 10.
Doppler spectra of a man running outside the forest analyzed 1 GHz (a) and 435 MHz (b).
Table 8.
Measured and simulated Doppler features of a subject running outside the forest analyzed at 1 GHz and at 435 MHz.
The spectrogram corresponding to the run analyzed at 435 MHz is shown in Figure 10b. The subject has covered a distance of 30 m in approximately 11 s, with an averaged speed of 2.54 m/s. The run is well detected, as observed in Figure 10b. The strongest returned signal comes from the contributions of the main reflecting area of the body, composed by the head, the torso, and the arms. The periodic spikes observed at the red Doppler pattern’s external edges correspond to the frequency shifts due to the swings of the legs. The Doppler features, presented in the third column of Table 8, characterize the spectrum in the time interval 8 s–16 s, where a constant speed is assumed. A speed of 2.82 m/s has been measured by the extraction of the feature (1). The detected speed is again outside the range of the simulated running speeds. It explains the mismatch between the simulated values shown in Table 8, except for feature (2).
The measured speeds, both at 1 GHz and 435 MHz, can be linked to a moderate run, and the failure to classify the activity is due to a database that does not include different running techniques such as footing or jogging.
4.3. Subject Walking and Running near the Forest
The second test focused on measuring the backscattered signal of a person walking and running on a grass field. In detail, the subject moved away from the antennas and toward a row of trees. Figure 11a shows the spectrogram of the walk analyzed at 1 GHz. The corresponding Doppler features are listed in absolute value in the second column of Table 9.
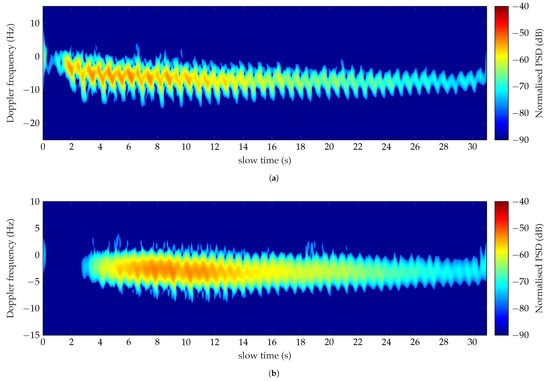
Figure 11.
Doppler spectra of a man walking toward a row of trees analyzed at 1 GHz (a) and 435 MHz (b).
Table 9.
Measured and simulated Doppler features of a subject walking near the forest analyzed at 1 GHz and 435 MHz.
The walking away the radar has caused the negative Doppler shifts centered at −8 Hz, as observed in Figure 11a. The spectrum exhibits a periodic trend saw-tooth shaped, well detected for the total observation time. The target has traveled 30 m in approximately 30 s with a speed of 1 m/s. The absolute value of the detected torso Doppler frequency is 6.7 Hz, which corresponds to a speed of 0.98 m/s, in accordance with the estimated speed. The backward motions of the limbs are more detected than those forward, identified in the negative Doppler frequencies by the cyan spikes. Their movements are asymmetric with an offset (4) of 9.81 Hz, and they determine a total BW (3) of 19.61 Hz. The measured features follow the simulated ranges presented in Table 9, allowing the classification of the monitored activity as a walk.
The same activity has been detected and classified at 435 MHz, as depicted in Figure 11b. The subject has walked for 28 s with a speed of 1.06 m/s. The uniform pattern, dictated by the new scattering phenomenology occurring at low frequency, is centered around −3 Hz. According to (1), the resulting measured speed is 1.04 m/s, and in good agreement with the expected value. The contributions of the limbs, characterized by a total BW (3) of 13 Hz and an offset (4) of 6.49 Hz, are observed in the time interval from 4 s to 19 s. The measured values listed in the third column of Table 9 comply with the simulated dataset. Consequently, the activity has been again recognized as a walking activity.
The analysis at 1 GHz and 435 MHz of the person walking outside and near the forest allow us to draw preliminary conclusions. The radar system can detect and classify the retrieved signal of the walk regardless of the path, toward and from the antennas. The asymmetry of the activity, characterized by an offset different from 0 Hz, may be linked more to the ability of the system to detect the forward and backward motions of the limbs than to the movements itself. The walk’s Doppler spectrum is not distorted by the background of the two chosen scenes, allowing the proper characterization and classification of the monitored activities.
Reversely, the contribution of the surrounding environment has been observed in the analysis of the Doppler frequency signature of the run at 1 GHz. The corresponding spectrogram is shown in Figure 12a. The subject has run toward the row of trees in approximately 18 s. A constant speed gait is observed in the time interval 11 s–21 s, which has been used to derive the Doppler features. The measured values are listed in Table 10. The motions of the torso cause a zigzag pattern detected until 20 s in the Doppler spectrum. The measured torso Doppler frequency is equal to 14.41 Hz, which identifies a speed of 2.2 m/s. The extracted feature (2) corresponds to the period associated with the run motion. Features (1), (3) and (4) instead, listed in Table 10, are not in agreement with those presented in the simulated dataset. This issue could be associated both to the low speed and to the presence of echoes not related to the man activity. The measurements have also been performed in the presence of moderate wind. Therefore, the slight movements of the undergrowth, among the tracked path, have caused the weak Doppler shifts around the zero-Doppler, observed in Figure 12a. Consequently, the routine process makes a mistake when evaluating the total Doppler bandwidth and the offset of the measured motor activity.
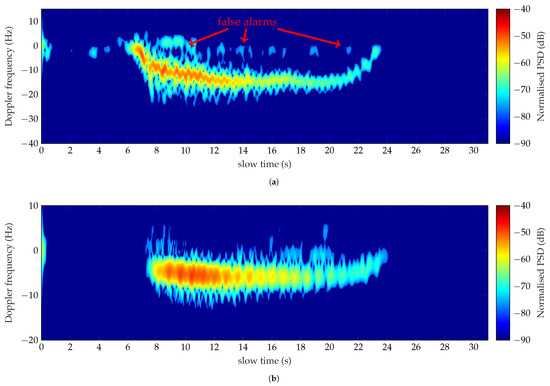
Figure 12.
Doppler spectra of a man running toward a row of trees analyzed at 1 GHz (a) and 435 MHz (b).
Table 10.
Measured and simulated Doppler features of a subject running near the forest analyzed at 1 GHz and 435 MHz.
Conversely, the running activity has been well detected and classified at 435 MHz. The Doppler spectrum is depicted in Figure 12b, whereas the corresponding characteristics are listed in the third column of Table 10. The target has run 30 m in 16.85 s with an average speed of 1.78 m/s. Feature (1) = 5.55 Hz (Table 10) denotes a speed of 1.95 m/s, thus in quite an agreement with the estimated one. The spectrum does not seem affected by the contribution of the external environment. At 435 MHz, indeed, the wavelength is higher than the undergrowth size, making the Doppler echoes of the surrounding vegetation undetectable. Consequently, the classification process is not affected by false alarms. The backward and forward motions of the limbs are well detected despite the low working frequency. It follows that the features, (3) and (4) listed in Table 10 fall within the simulated ranges.
4.4. Subject Walking and Running within the Forest
In the end, the Doppler signature analysis of the chosen motor activities has been carried out in a forest, a more complex and cluttered environment. The spectrogram of the man walking toward the radar, analyzed at 1 GHz, is shown in Figure 13a.
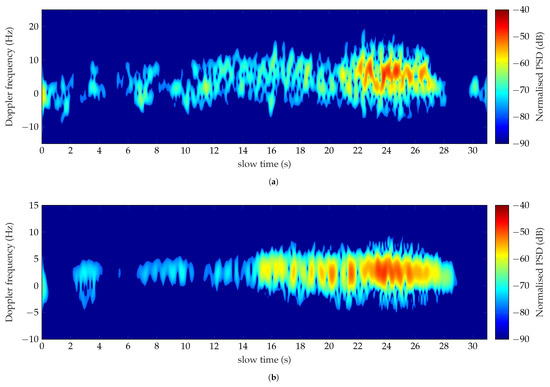
Figure 13.
Doppler spectra of a man walking within the forest analyzed at 1 GHz (a) and 435 MHz (b).
The walk among the trees has been completed in approximately 28 s with a speed of about 1.08 m/s. The Doppler spectrum looks fragmented, and it is characterized by a weak intensity around −70 dB. An explanation is that most of the human body parts are shadowed by the trees presented among the path.
Consequently, the backscattered signals are undetectable by our system, being weaker in magnitude. A typical swinging trend of the walk is observed in Figure 13a only starting from 21 s. The corresponding Doppler characteristics are listed in the second column of Table 11. Although the features (2) and (3) have been recognized as relative to the walking activity, the detection of the speed failed. A strong asymmetry between the forward and backward motions of the limbs is outlined by an offset (4) equal to 14.19 Hz, which is higher than the simulated values shown in Table 11. The asymmetry may be linked to the movements of the target performed in order to avoid the collision with the adjacent branches and trees that entailed an uneven walk toward the antennas.
Table 11.
Measured and simulated Doppler features of a subject walking within the forest analyzed at 1 GHz and 435 MHz.
Furthermore, the analyzed torso Doppler frequency, equal to 3.48 Hz, denotes a velocity of 0.5 m/s, which corresponds to the half the speed performed by the subject. The error could be linked to the obstructing effects of the trees observed in Figure 14 in the time interval 1 s–6 s and 8 s–11 s, respectively. The speeds (continuous line) have been calculated according to (8), once the highest torso Doppler frequencies presented in Figure 13a have been extracted for each time bin. Therefore, further evaluation has been carried out interpolating all the points higher than 0.5 m/s, as depicted in Figure 14 by the cross markers. The mean value of the speed trend represented by the red dotted line is equal to 1 m/s, which is close to the velocity employed by the target.
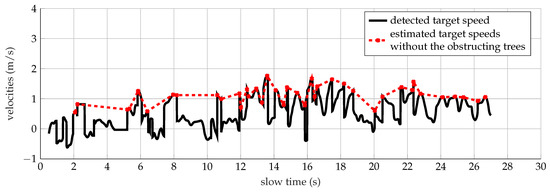
Figure 14.
Detected (continuous line) and estimated (cross markers) speeds of a target walking within the forest analyzed at 1 GHz.
A promising result has been obtained instead, analyzing the walk into the wood at 435 MHz. The spectrogram is shown in Figure 13b. The walk has been completed in 27 s with a supposed average speed of 1.12 m/s. The strongest return is associated with the bobbing torso, whereas the tiny cyan spikes are related to the motions of the legs approaching the radar. Although fragmented spots characterize the first part of the spectrum, the observed physical activity has been detected and classified as a walk. The results listed in the third column of Table 11 match with the simulated ranges. The torso Doppler (1) equal to 2.58 Hz is related to a speed of 0.89 m/s that is in quite an agreement with the estimated value. Further analysis on the detected speed evaluation has been carried out extracting the Doppler frequencies of the spectrogram shown in Figure 13b, relative to the points with the highest intensities. The continuous black line depicted in Figure 15 represents the corresponding radial speeds calculated using (8). The trees’ obscuring effects are observed in the time interval 4 s–6 s and 10 s–12 s, which affect the calculation of the average speed equal to 0.89 m/s. Interpolating all the points higher than 0.9 m/s (red markers Figure 15) instead, the mean value of the speed increases up to 1.12 m/s, which corresponds with the subject’s estimated speed.
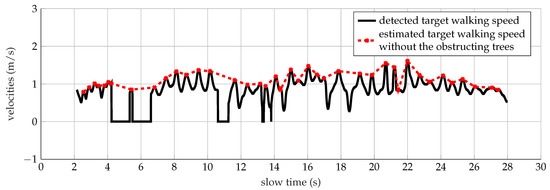
Figure 15.
Detected (continuous line) and estimated (cross markers) speeds of a target walking within the forest analyzed at 435 MHz.
The Doppler signature of the run into the forest, analyzed at 1 GHz, is shown in Figure 16a. The run has been performed in approximately 17 s with a supposed average speed of 1.76 m/s. The spectrum looks strongly distorted, as observed in Figure 16a. The contribution of the torso is detectable exclusively when the target is close to the radar. Fragmentation of the Doppler spectrum is highlighted. Here again, the human body parts are shadowed by the trees. Besides, the mutual coupling between the body and the closest trees could be a predominant component of the total reflected signal. It follows that the Doppler spectrum is strongly distorted and not uniformly spread, as highlighted in Figure 13a and Figure 16a respectively. These issues affect the classification process of the motor activity as outlined by the disagreement between the measured and simulated Doppler features presented in the second column of Table 12. The effect of the surrounding environment can be observed on the modulation of the target measured velocities shown in Figure 17. The mean value of the detected speeds (continuous line) corresponds approximately to 1.1 m/s, hence lower than the supposed average speed. The obstructing trees are observed in the time interval 8 s–13 s and 16.7 s–18.3 s, respectively. Further evaluation has been carried out interpolating all the points higher than 1.5 m/s, as depicted in Figure 17 by the cross markers. The mean value of the speed trend represented by the red dotted line is equal to 1.88 m/s, which is close to the velocity employed by the target.
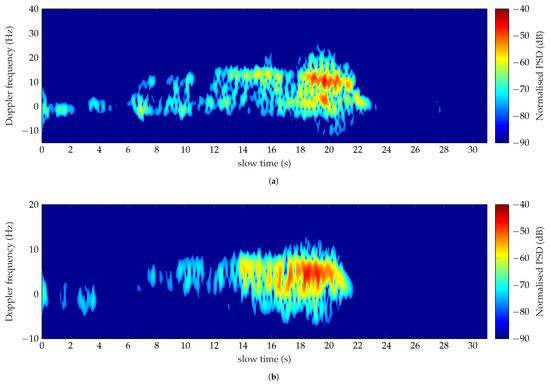
Figure 16.
Doppler spectra of a man running within the forest analyzed at 1 GHz (a) and 435 MHz (b).
Table 12.
Measured and simulated Doppler features of a subject running within the forest analyzed at 1 GHz and 435 MHz.
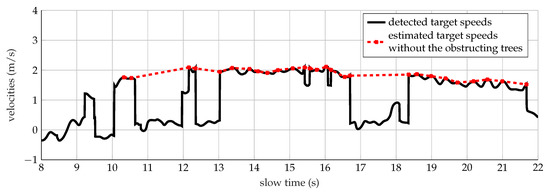
Figure 17.
Detected (continuous line) and estimated (cross markers) speeds of a target running within the forest analyzed at 1 GHz.
The run has been better detected and classified at 435 MHz. The results are shown in Figure 16b and listed in Table 12. The motor activity has been carried out in approximately 15.7 s, as observed in Figure 16b. Hence, a velocity corresponding to 1.99 m/s has been supposed. An average speed of 1.36 m/s has been detected by calculating the feature (1), so lower than the target’s speed. A speed of 1.89 m/s has been instead detected by adopting the methodology explained above for the analysis of the run at 1 GHz, and shown in Figure 18. The measured Doppler features (2)–(4) agree with the simulated values, listed in Table 6.
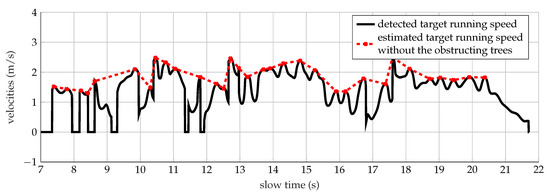
Figure 18.
Detected (continuous line) and estimated (cross markers) speeds of a target running within the forest analyzed at 435 MHz.
The overall conclusion is that the use of low frequencies proves to be more suitable for applications devoted to the detection and classification of human targets moving in forested areas. The measurements benefit of the wave foliage penetration, avoiding the occurrence of the false alarms due to the echoes of the surrounding vegetation. However, the presence of significant lossy dielectric obstacles, like represented by the trees, strongly affects the backscattered signal and, consequently, the processing of the Doppler spectrum.
5. Discussions
The measured results presented in the previous sections proved the feasibility of detecting people moving in forested areas at low frequencies. The walk and the run’s Doppler effects have been detected at 1 GHz and 435 MHz, even in the presence of echoes not related to the man activity or trees obstruction. Besides, four Doppler features have been extracted to characterize the frequency signature of the chosen physical activities.
The last study concerns the possibility of distinguishing the two types of movements, focusing on the validity of the main features we collected. In Figure 19, the differences between the walk’s Doppler features and the run at 1 GHz and 435 MHz in the three proposed scenes are shown. The error thresholds due to the frequency resolution of 2 Hz, and the 80% overlap that we adopt are depicted in the figures. The aim is to highlight the level of uncertainty indicating which measurements are reliable and which are not.
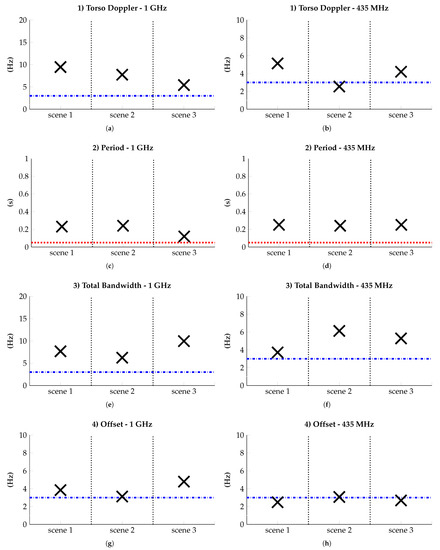
Figure 19.
Differences between the measured Doppler features of the walk and the run, analyzed at 1 GHz and 435 MHz in three outdoor scenarios: open ground (scene 1), grass field with a row of trees (scene 2), forest (scene 3). The results concerning the Torso Doppler (a,b), Period (c,d), Total Bandwidth (e,f), and Offset (g,h) are shown at 1 GHz, and 435 MHz, respectively. The dash-dot and dotted lines represent the error thresholds: the blue dash-dot line is the error due to the chosen frequency resolution and the spectral density threshold value. The red dotted line is the error due to the overlap of 80% applied in the short time Fourier transform.
Ideally, one parameter is needed to distinguish the two physical activities. In the end, the features torso Doppler (1), the total bandwidth (2) and the period (3) at 1 GHz, and the total bandwidth (2) and the period (3) at 435 MHz can be used for the same purpose.
Thus, the walk and the run can be detected, characterized, and distinguished from each other at low frequency in a forest environment.
6. Conclusions
We proposed to study the Doppler signature of moving people within forests, and to do so, we have collected at low frequencies radar measurements in different configurations. The Doppler signatures of a man walking and running, outside, near, and within the forest, have been analyzed.
The paper aims to prove the feasibility of performing micro-Doppler measurements at low frequencies taking advantage of the long-wavelength to detect micro-Doppler within the forest environment. By the way, performing Doppler detection of human movements using radar measurements, specifically at frequencies within L-band (0.5 to 1.5 GHz) and P-band (250 to 500 MHz), is a challenge to achieve technically. We had to consider a bistatic configuration to avoid the mutual coupling between the antennas first. We have then selected some standard features of the Doppler signature to classify the physical activities between walking and running. These measured features have then been compared to expected analytical values.
The observed motor activities are well detectable, whatever the type of outdoor site is. On the other hand, the accuracy of the characterization depends on the chosen frequency. Thus, working at 435 MHz has been proved to be suitable for the recognition and classification of the motor activities performed in a highly cluttered environment. Indeed, the slight movements performed by the undergrowth caused by the wind, for instance, are not detectable by the radar system working at this frequency. Consequently, the Doppler spectrum is less affected by these false alarms, unlike at 1 GHz.
Close trees have obscured the target moving within the forest at the beginning of the path. It follows that the Doppler spectrum is strongly distorted and fragmented, making its interpretation a tricky task. As a consequence, the extracted Doppler features of the run are lower than the expected ones. A first correction has been proposed to estimate this signature better.
Our study also established the feasibility of distinguishing the two physical activities using the Doppler features, whatever scene and low frequency are analyzed.
Author Contributions
Conceptualization: J.-P.O. and L.T.-L.; Data curation: G.M.; Formal analysis: G.M.; Investigation: G.M., I.D.H.S., M.M. and S.S.; Methodology: G.M., I.D.H.S., J.-P.O. and L.T.-L.; Project administration: G.M.; Resources: I.D.H.S., M.M. and S.S.; Software: G.M.; Supervision: I.D.H.S., J.-P.O. and L.T.-L.; Validation: G.M., I.D.H.S., M.M. and S.S.; Visualization: G.M.; Writing—original draft: G.M.; Writing—review & editing: I.D.H.S., J.-P.O. and L.T.-L. All authors have read and agreed to the published version of the manuscript.
Funding
This research received no external funding.
Acknowledgments
The authors wish to thank the Carnegie Mellon University - CMU Graphics Lab. The dataset of motions used in this study was obtained from mocap.cs.cmu.edu. The database was created with funding from NSF EIA-0196217.
Conflicts of Interest
The authors declare no conflict of interest.
Abbreviations
The following abbreviations are used in this manuscript:
| ADC | Analog Device Converter |
| BW | Bandwidth |
| CFIR | Compensation Finite Impulse Response |
| CIC | Cascade Integrate Comb |
| CPI | Coherent Processing Interval |
| CW | Continuous Wave |
| DCNN | Deep Convolutional Neural Network |
| DDC | Digital Down-Converter |
| HFE | High-Frequency Envelope |
| LFE | Low-Frequency Envelope |
| LO | Local Oscillator |
| MoM-FMM | Method of Moments Fast Multipole Method |
| MRA-Net | Multiscale Residual Attention Network |
| NCO | Numerically Controlled Oscillator |
| PFIR | Programmable Finite Impulse Response |
| PSD | Power Spectral Density |
| RX | Receiving |
| STFT | Short-Time Fourier Transform |
| SVM | Support Vector Machine |
| TX | Transmitting |
References
- Chen, V.; Li, F.; Ho, S.S.; Wechsler, H. Micro-Doppler effect in radar: Phenomenon, model, and simulation study. IEEE Trans. Aerosp. Electron. Syst. 2006, 42, 2–21. [Google Scholar] [CrossRef]
- Boulic, R.; Thalmann, N.M.; Thalmann, D. A global human walking model with real-time kinematic personification. Vis. Comput. 1990, 6, 344–358. [Google Scholar] [CrossRef]
- Geisheimer, J.L.; Greneker, E.F., III; Marshall, W.S. High-resolution Doppler model of the human gait. In Radar Sensor Technology and Data Visualization; Faust, N.L., Faust, N.L., Kurtz, J.L., Trebits, R., Eds.; International Society for Optics and Photonics (SPIE): Bellingham, WA, USA, 2002; Volume 4744, pp. 8–18. [Google Scholar]
- Van Dorp, P.; Groen, F. Human walking estimation with radar. IEE Proc. Radar Sonar Navig. 2003, 150, 356. [Google Scholar] [CrossRef]
- Ghaleb, A.; Vignaud, L.; Nicolas, J. Micro-Doppler analysis of wheels and pedestrians in ISAR imaging. IET Signal Process. 2008, 2, 301. [Google Scholar] [CrossRef]
- Kim, Y.; Ling, H. Human Activity Classification Based on Micro-Doppler Signatures Using a Support Vector Machine. IEEE Trans. Geosci. Remote Sens. 2009, 47, 1328–1337. [Google Scholar] [CrossRef]
- Kim, Y.; Moon, T. Human Detection and Activity Classification Based on Micro-Doppler Signatures Using Deep Convolutional Neural Networks. IEEE Geosci. Remote Sens. Lett. 2016, 13, 8–12. [Google Scholar] [CrossRef]
- He, Y.; Li, X.; Jing, X. A Mutiscale Residual Attention Network for Multitask Learning of Human Activity Using Radar Micro-Doppler Signatures. Remote Sens. 2019, 11, 2584. [Google Scholar] [CrossRef]
- Yang, L.; Chen, G.; Li, G. Classification of Personnel Targets with Baggage Using Dual-band Radar. Remote Sens. 2017, 9, 594. [Google Scholar] [CrossRef]
- Bilik, I.; Tabrikian, J.; Cohen, A. GMM-based target classification for ground surveillance Doppler radar. IEEE Trans. Aerosp. Electron. Syst. 2006, 42, 267–278. [Google Scholar] [CrossRef]
- Otero, M. Application of a continuous wave radar for human gait recognition. In Signal Processing, Sensor Fusion, and Target Recognition XIV; Kadar, I., Ed.; SPIE: Bellingham, WA, USA, 2005. [Google Scholar]
- Andrić, M.; Bujaković, D.; Bondžulić, B.; Simić, S.; Zrnić, B. Analysis of radar Doppler signature from human data. Radioengineering 2014, 23, 11–19. [Google Scholar]
- Björklund, S.; Petersson, H.; Nezirovic, A.; Guldogan, M.B.; Gustafsson, F. Millimeter-wave radar micro-Doppler signatures of human motion. In Proceedings of the 2011 12th International Radar Symposium (IRS), Leipzig, Germany, 7–9 September 2011; pp. 167–174. [Google Scholar]
- Tan, R.; Bender, R. Analysis of Doppler measurements of people. In Targets and Backgrounds XII: Characterization and Representation; Watkins, W.R., Clement, D., Eds.; SPIE: Bellingham, WA, USA, 2006. [Google Scholar]
- Rytel-Andrianik, R.; Samczynski, P.; Malanowski, M.; Gromek, A.; Gromek, D.; Meta, A.; Corucci, L. Simple X-band polarimetric micro-Doppler analyses of ground moving targets. In Proceedings of the 2015 Signal Processing Symposium (SPSympo), Debe, Poland, 12–14 September 2015. [Google Scholar]
- Vahidpour, M.; Sarabandi, K. Millimeter-Wave Doppler Spectrum and Polarimetric Response of Walking Bodies. IEEE Trans. Geosci. Remote Sens. 2012, 50, 2866–2879. [Google Scholar] [CrossRef]
- Tahmoush, D.; Silvious, J. Radar Measurement of Human Polarimetric Micro-Doppler. J. Electr. Comput. Eng. 2013, 2013, 1–5. [Google Scholar] [CrossRef]
- Setlur, P.; Amin, M.; Ahmad, F. Multipath Model and Exploitation in Through-the-Wall and Urban Radar Sensing. IEEE Trans. Geosci. Remote Sens. 2011, 49, 4021–4034. [Google Scholar] [CrossRef]
- Linnehan, R.; Schindler, J. Multistatic scattering from moving targets in multipath environments. In Proceedings of the 2009 IEEE Radar Conference, Pasadena, CA, USA, 4–8 May 2009. [Google Scholar]
- Sume, A.; Gustafsson, M.; Herberthson, M.; Janis, A.; Nilsson, S.; Rahm, J.; Orbom, A. Radar Detection of Moving Targets Behind Corners. IEEE Trans. Geosci. Remote Sens. 2011, 49, 2259–2267. [Google Scholar] [CrossRef]
- Gustafsson, M.; Andersson, A.; Johansson, T.; Nilsson, S.; Sume, A.; Orbom, A. Extraction of Human Micro-Doppler Signature in an Urban Environment Using a “Sensing-Behind-the-Corner” Radar. IEEE Geosci. Remote Sens. Lett. 2016, 13, 187–191. [Google Scholar] [CrossRef]
- Garcia-Rubia, J.M.; Kilic, O.; Dang, V.; Nguyen, Q.M.; Tran, N. Analysis of moving human micro-Doppler signature in forest environments. Prog. Electromagn. Res. 2014, 148, 1–14. [Google Scholar] [CrossRef]
- Sletten, M.A.; Brozena, J. FOPEN Target Detection via Joint Space/Angle Variation. IEEE Geosci. Remote Sens. Lett. 2016, 13, 762–766. [Google Scholar] [CrossRef]
- Liao, D.; Dogaru, T. Full-Wave Scattering and Imaging Characterization of Realistic Trees for FOPEN Sensing. IEEE Geosci. Remote Sens. Lett. 2016, 13, 957–961. [Google Scholar] [CrossRef]
- Davis, M.E. FOPEN radar design for sparse forest surveillance. In Proceedings of the 2016 IEEE Radar Conference (RadarConf), Philadelphia, PA, USA, 1–6 May 2016. [Google Scholar]
- Dogaru, T.; Le, C.; Kirose, G. Time-Frequency Analysis of a Moving Human Doppler Signature; Technical Report; Defense Technical Information Center: Fort Belvoir, VA, USA, 2009.
- Jankiraman, M. Design of Multi-Frequency CW Radars; Institution of Engineering and Technology: London, UK, 2007. [Google Scholar]
- Yoo, B.Y.; Park, J.H.; Yang, J.R. Quasi-Circulator Using an Asymmetric Coupler for Tx Leakage Cancellation. Electronics 2018, 7, 173. [Google Scholar] [CrossRef]
- Lee, H.L.; Lim, W.G.; Oh, K.S.; Yu, J.W. 24 GHz Balanced Doppler Radar Front-End With Tx Leakage Canceller for Antenna Impedance Variation and Mutual Coupling. IEEE Trans. Antennas Propag. 2011, 59, 4497–4504. [Google Scholar] [CrossRef]
- Balanis, C.A. Antenna Theory: Analysis and Design; John Wiley & Sons: New York, NY, USA, 2016. [Google Scholar]
- University, C.M. CMU Graphics Lab Motion Capture Database. Available online: mocap.cs.cmu.edu (accessed on 20 November 2020).
- Schwind, A.; Stephan, R.; Thuringian, M.A.H. Simulations and Measurements of the Bistatic Radar Cross Section of Vulnerable Road Users between 2 GHz and 6 GHz. In Proceedings of the 2018 IEEE MTT-S International Conference on Microwaves for Intelligent Mobility (ICMIM), Munich, Germany, 16–18 April 2018. [Google Scholar]
- Poston, A. Human Engineering Design Data Digest: Human Factors Standardization Systems; Human Factors Standardization SubTAG; Createspace Independent Publishing Platform: Scotts Valley, CA, USA, 2000. [Google Scholar]
- Willis, N.J. Bistatic Radar; SciTech Publishing: Raleigh, NC, USA, 2005; Volume 2. [Google Scholar]
- Johnsen, T.; Olsen, K.E. Bi-and Multistatic Radar; Technical Report; Norwegian Defence Research Establishment: Kjeller, Norway, 2006. [Google Scholar]
- Manfredi, G.; Ovarlez, J.P.; Thirion-Lefevre, L. Features Extraction of the Doppler Frequency Signature of a Human Walking at 1 GHz. In Proceedings of the 2019 IEEE International Geoscience and Remote Sensing Symposium, Yokohama, Japan, 28 July–2 August 2019. [Google Scholar]
- Skolnik, M. Radar Handbook; McGrawHill: New York, NY, USA, 1970. [Google Scholar]
- Cohen, L. Time-frequency distributions-a review. Proc. IEEE 1989, 77, 941–981. [Google Scholar] [CrossRef]
- Bertrand, J.; Bertrand, P. Affine time-frequency distributions. In Time-Frequency Signal Analysis—Methods and Applications; Longman-Cheshire: Cheshire, Australia, 1992; Volume 1992, pp. 118–140. [Google Scholar]
- Yourgrau, W.; van der Merwe, A.; Rudin, R.A. Perspectives in Quantum Theory: Essays in Honor of Alfred Lande. J. Electrochem. Soc. 1972, 119, 329C. [Google Scholar] [CrossRef]
- Fan, L.; Evans, D.H. Extracting instantaneous mean frequency information from Doppler signals using the Wigner distribution function. Ultrasound Med. Biol. 1994, 20, 429–443. [Google Scholar] [CrossRef]
- Ren, H.; Ren, A.; Li, Z. A new strategy for the suppression of cross-terms in pseudo Wigner–Ville distribution. Signal Image Video Process. 2014, 10, 139–144. [Google Scholar] [CrossRef]


Publisher’s Note: MDPI stays neutral with regard to jurisdictional claims in published maps and institutional affiliations. |
© 2021 by the authors. Licensee MDPI, Basel, Switzerland. This article is an open access article distributed under the terms and conditions of the Creative Commons Attribution (CC BY) license (http://creativecommons.org/licenses/by/4.0/).