Communication

Current Status and Variation since 1964 of the Glaciers around the Ebi Lake Basin in the Warming Climate

1
State Key Laboratory of Cryospheric Science, Northwest Institute of Eco-Environment and Resources, Chinese Academy of Sciences, Lanzhou 730000, China
2
Beacon Science & Consulting, Malvern, SA 5061, Australia
*
Author to whom correspondence should be addressed.
Remote Sens. 2021, 13(3), 497; https://doi.org/10.3390/rs13030497
Submission received: 29 December 2020 / Revised: 27 January 2021 / Accepted: 28 January 2021 / Published: 30 January 2021
(This article belongs to the Special Issue Remote Sensing for Climate Change)

Abstract

:
This work analyzed the spatial and temporal variations of the glaciers in the Ebi Lake basin during the period 1964 to 2019, based on the 1st and 2nd Chinese Glacier Inventories (CGI) and remote sensing data; this is believed to be the first long-term comprehensive remote sensing investigation on the glacier change in this area, and it also diagnosed the response of the glaciers to the warming climate by analyzing digital elevation modeling and meteorology. The results show that there are 988 glaciers in total in the basin, with a total area of 560 km2 and average area of 0.57 km2 for a single glacier. The area and number of the glaciers oriented north and northeast are 205 km2 (327 glaciers) and 180 km2 (265 glaciers), respectively. The glaciers are categorized into eight classes as per their area, which are less than 0.1, 0.1–0.5, 0.5–1.0, 1.0–2.0, 2.0–5.0, 5.0–10.0, 10.0–20.0, and greater than 20.0 km2, respectively. The smaller glaciers between 0.1 km2 and 10.0 km2 account for 509 km2 or 91% in total area, and, in particular, the glaciers smaller than 0.5 km2 account for 74% in the total number. The glacial area is concentrated at 3500–4000 m in altitude (512 km2 or 91.4% in total). The number of glaciers in the basin decreased by 10.5% or 116, and their area decreased by 263.29 km2 (−4.79 km2 a−1) or 32% (−0.58% a−1) from 1964 to 2019; the glaciers with an area between 2.0 km2 and 5.0 km2 decreased by the largest, −82.60 km2 or −40.67% in the total area at −1.50 km2 a−1 or −0.74% a−1), and the largest decrease in number (i.e., 126 glaciers) occurs between 0.1 km2 and 0.5 km2. The total ice storage in the basin decreased by 97.84–153.22 km3 from 1964 to 2019, equivalent to 88.06–137.90 km3 water (taking 0.9 g cm−3 as ice mass density). The temperature increase rate in the basin was +0.37 °C decade−1, while the precipitation was +13.61 mm decade−1 during the last fifty-five years. This analysis shows that the increase in precipitation in the basin was not sufficient to compensate the mass loss of glaciers caused by the warming during the same period. The increase in temperature was the dominant factor exceeding precipitation mass supply for ruling the retreat of the glaciers in the entire basin.

Graphical Abstract

1. Introduction

The cryosphere consists of snow, ice, and permafrost on and below the Earth’s land and ocean surfaces, and it is one of the major components in the climate system [1]. The accelerated shrinkage of the cryosphere in the context of global warming and the subsequent impacts on the sustainability of the Anthroposphere have attracted unprecedented attention and raised deep concern, because the High-Asian mountain glaciers are crucial for buffering against drought [2] and protecting life from drought [3]. These mountain glaciers are an essential part of the global cryosphere and have shown generally varying degrees of continuous retreat in recent decades [4,5,6]. As projected by the Intergovernmental Panel on Climate Change (IPCC), even in the mild emission scenario (RCP4.5), the Asian glaciers would disappear by ~50% by the end of the century [7].
China has the most developed mountain glaciers in low and middle latitudes [8], and these glaciers are a vital water resource in arid northwest China and High Asia [9]. As global temperatures increase, China’s glacial covers are generally in negative mass balance and showing a retreating and thinning trend [10,11,12]. The Xinjiang region is an arid and semi-arid area of China rich in mountain glaciers. The Tianshan and Altai Mountains are two main mountains developing concentrated mountain glaciers. The glaciers in the Tianshan Mountains had experienced rapid mass loss (averaged from −24.6 mm w.e. a−1 in 1957–1970 to −444.6 mm w.e. a−1 in 1971–2009) during the second half of the 20th century [13]; while in Altai, over a quarter of mountain glaciers were projected to shrink in RCP4.5 by 2100 [14].
The Ebi Lake basin is located in the northwestern Xinjiang region, China (Figure 1). The increasingly irrigated area and population in the basin over the last 60 years have led to increased water consumption in the basin, increasing tension between supply and demand, and the ecological degradation [15,16,17]. This lake had shrunk by 50% from 1955 to 2013, as reported by NASA in 2014 [18]. Another study stated that the water area of the Ebi Lake showed a significantly decreasing trend, although the precipitation was increasing from 2001 to 2016 [19]. Therefore, it is essential to assess the regional glaciers change in a timely manner to monitor glacier water resources and assess their impact on the water resource supply in the basin. This aspect’s research has conceptual and practical significances for water security, especially for industrial and agricultural production and economic development in this ecologically vulnerable area.
In recent years, numerous studies used the topographic maps and remote sensing data of the Tianshan Mountains, regional watersheds, and typical reference glaciers and revealed that the regional glaciers show retreating and thinning [20,21,22,23,24,25,26]. So far, very few studies on the glacier change status have been carried out in the Ebi Lake Basin. For example, Wang et al. used remote sensing data to partially reveal that there were around 450 glaciers in the Ebi Lake Basin, Tianshan, undergoing significant mass loss glacier changes from 1964 to 2004 [27]; Zhang et al. estimated the change of the Haxilegen 51 glacier in the basin from 1964 to 2006 and its response to climate [28]. To some extent, these studies explored the changes of an individual glacier or several glaciers in the basin. Still, the holistic and more detailed picture of these glaciers’ change is not complete and update.
Dramatic change has had been with these glaciers in number, area, and ice volumes from 1964 to 2009. According to the 1st CGI, there were 1104 glaciers with the total glacial area of 823 km2 and the ice storage of 47.54 km3 by 1964; while to the 2nd CGI, the number of glaciers here decreased to 1000, the glacier area to 598 km2, and the ice storage to 32.45 km3 by 2009 [8]. However, the update status of the varying glaciers and their association with the regional climate change during the most recent decade (2009–2019) is little known, which are crucial for policy-makers to take proper measures to adapt climate change and mitigate the impact of the change. Therefore, based on the first and second Chinese Glacier Inventories (CGIs) and the most updated glacier vector data released in 2019, this work assesses the glaciers’ change in the Ebi Lake Basin over the last 55 years (1964–2019), more systematically and accurately. Furthermore, we will discuss the response of glaciers in the basin to the warming climate and suggest the measures of how to use the regional water resource for sustainability rationally.

2. Materials and Methods
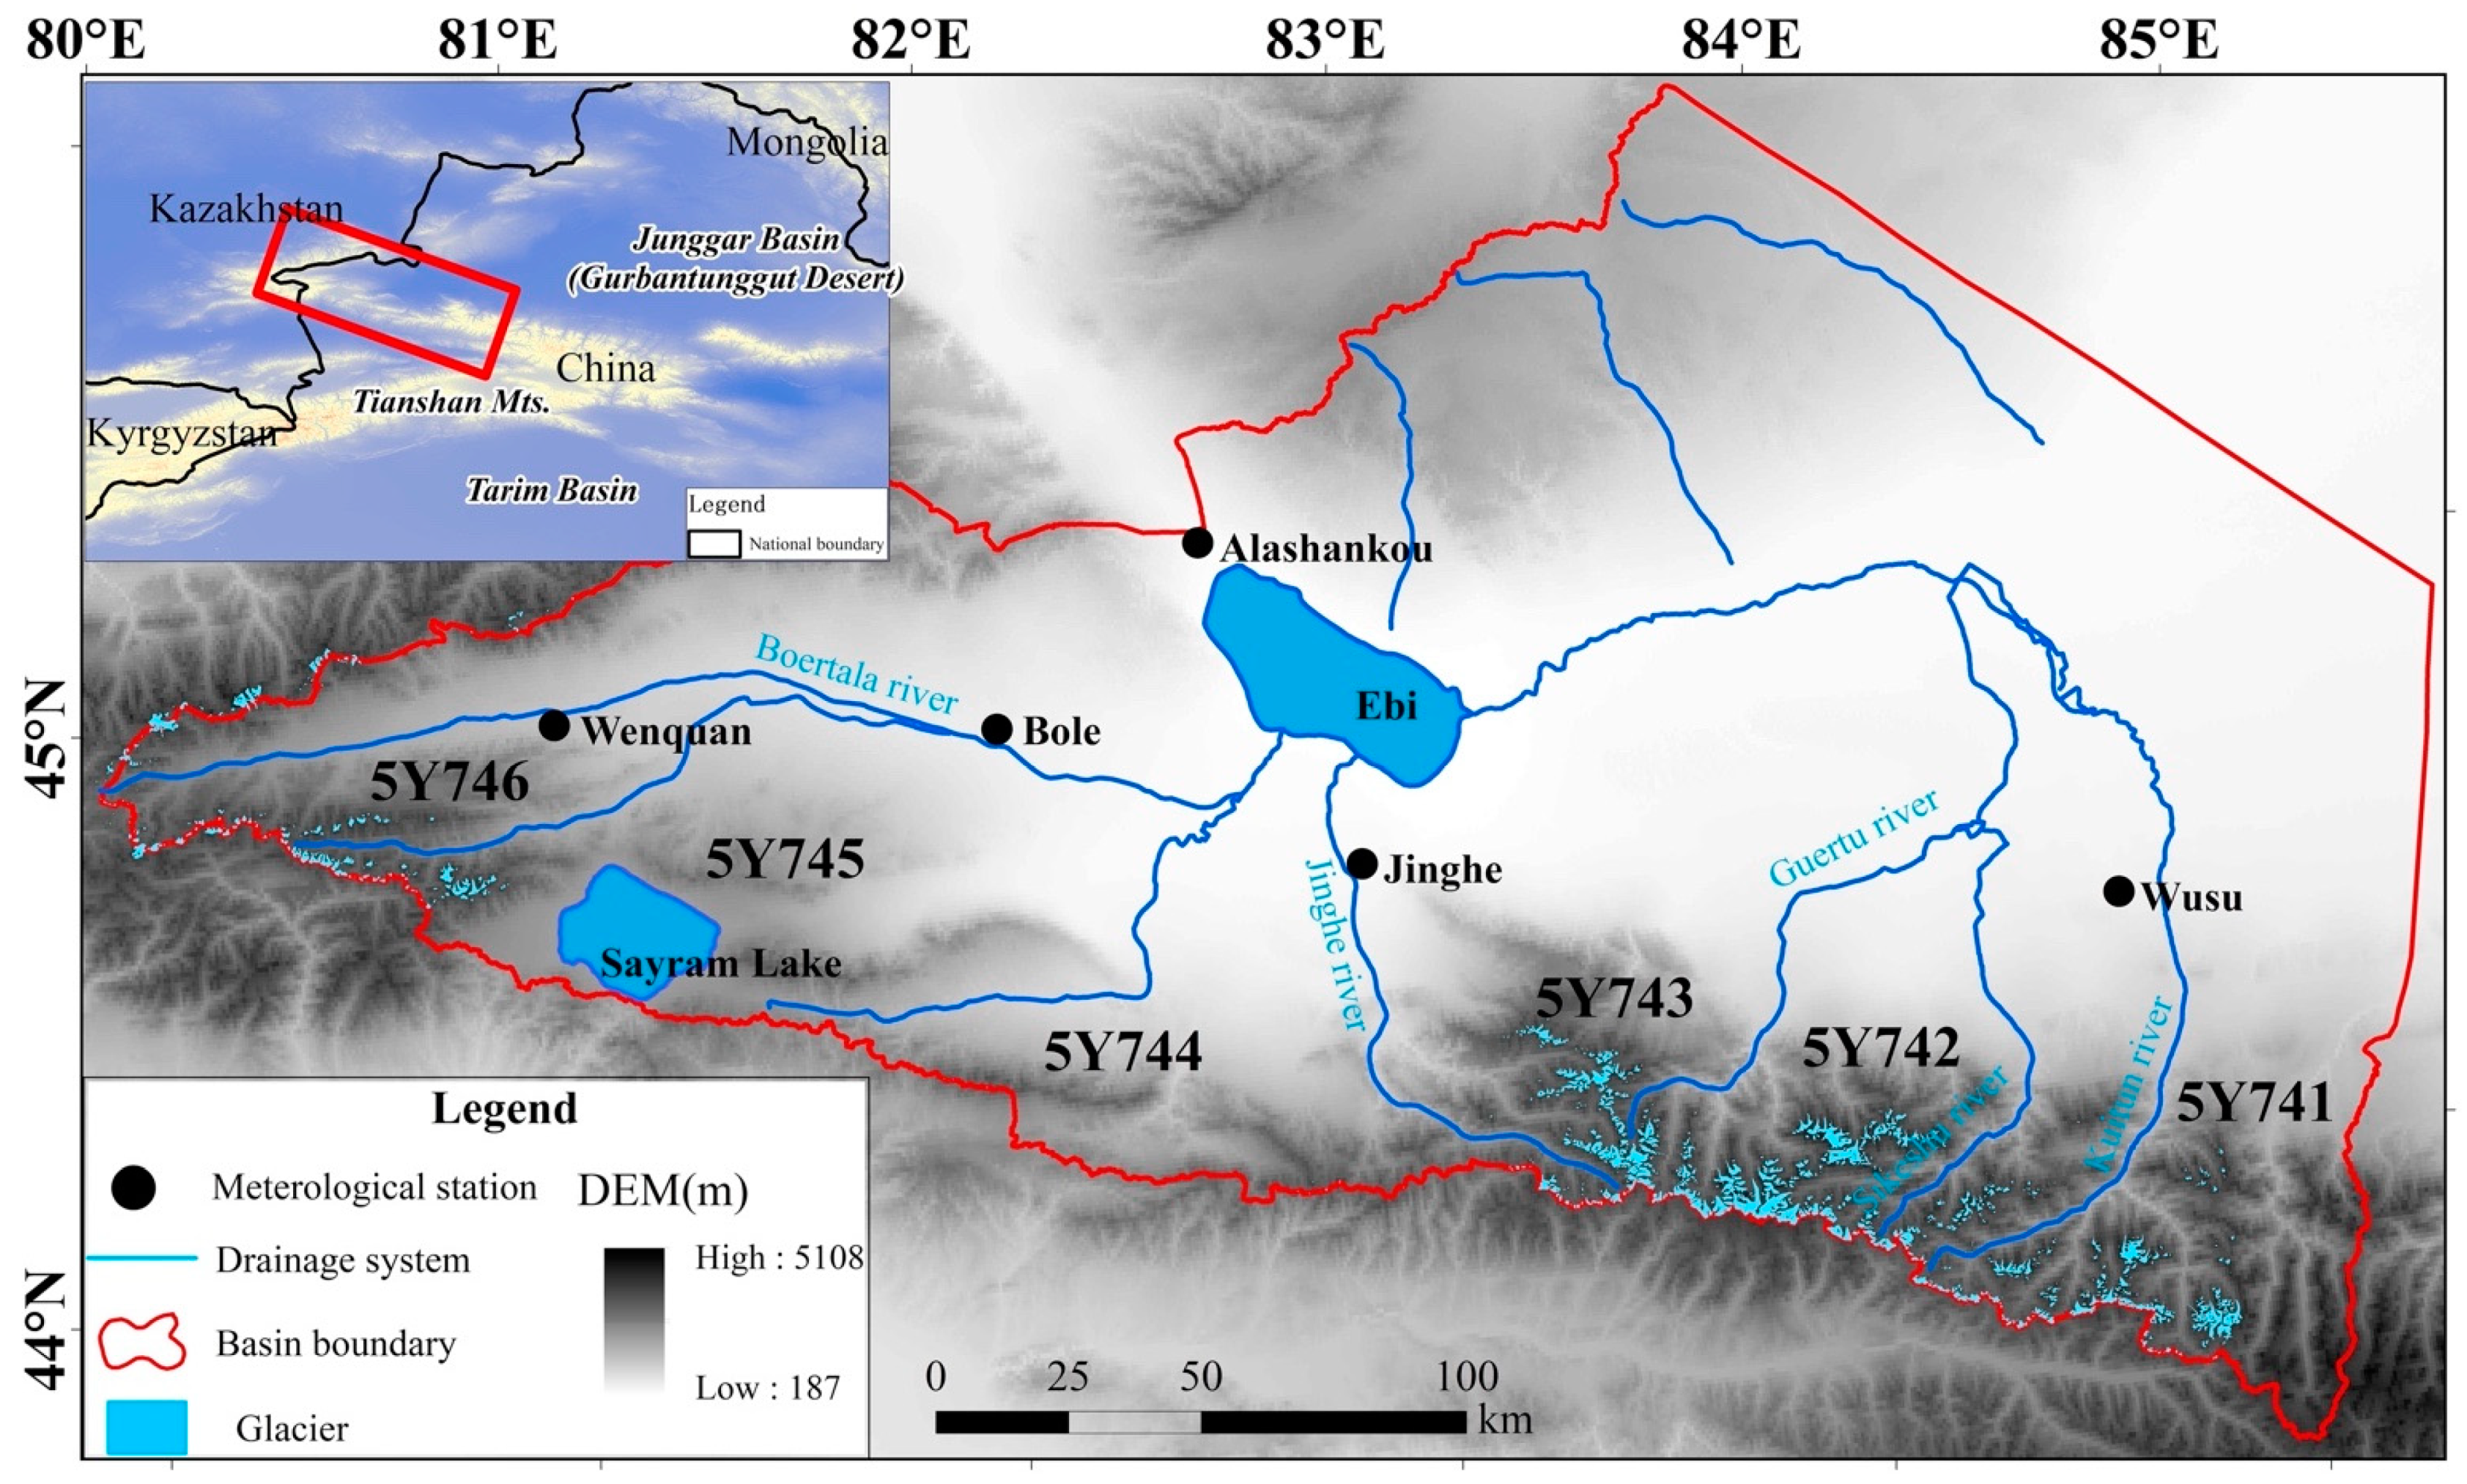
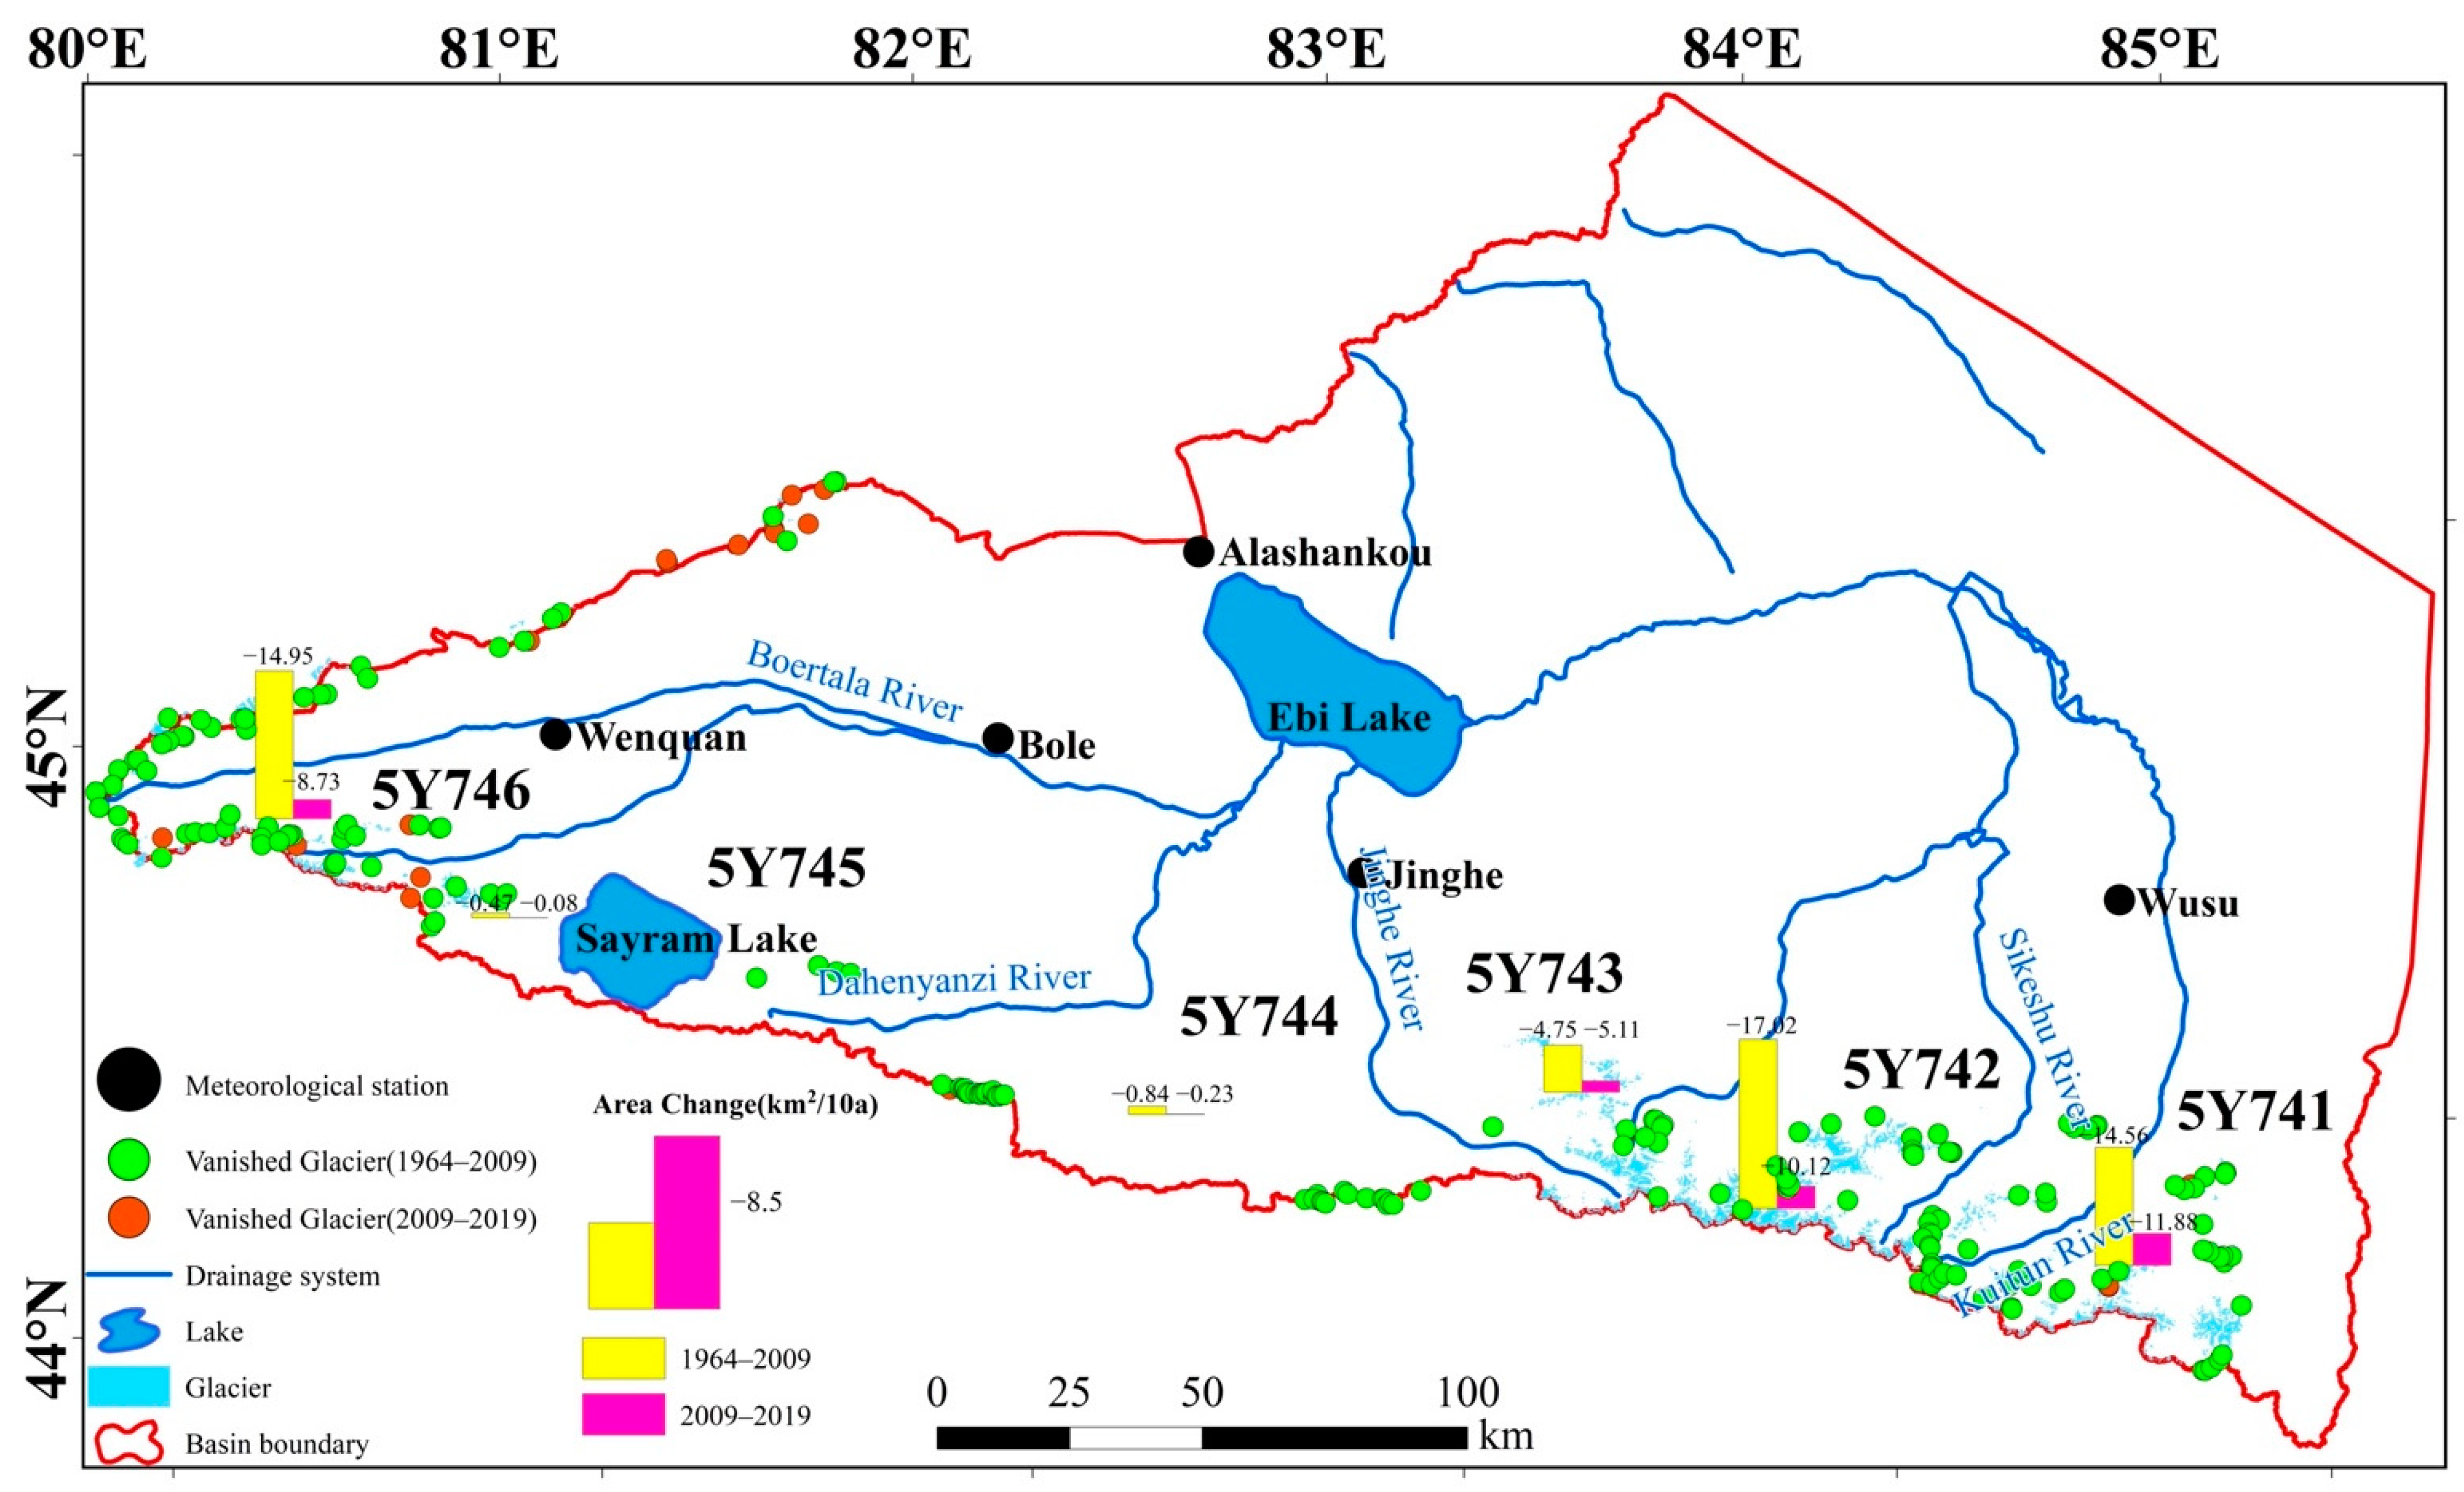
2.1. Study Area

The Ebi Lake Basin (43°38’~45°52’N, 79°53’~85°02’E) is this study area and located at the hinterland of Asia and Europe (Figure 1). The basin lies to the northern foothills of the western Tianshan Mountains and in the southwest of the Junggar Basin. It is surrounded by mountains from three sides—the north, west, and south—and in the east is China’s second largest desert, Gurbantunggut Desert. The basin is concurrently in the northern hemispheric temperate zone with the significantly continental arid climate, mostly windy weather. The annual average temperature in the basin moderates between 6.6 and 7.8 °C, the annual precipitation between 116.0 and 169.2 mm, and the potential evapotranspiration from 1500 to 2000 mm [29,30]. The Ebi Lake is the largest lake in the basin and is the largest saltwater lake with about 500 km2 in Xinjiang. The plains in the basin are accompanied with little precipitation and runoff, and mountain precipitation and snowmelt water from the peripheral alpine glaciers are the main sources of river runoff. The Ebinur Lake Basin (code 5Y74 in the CGIs) consists of six sub-basins, the Quitun River Basin (5Y741), the Sikeshu River Basin (5Y742), the Jing River Basin (5Y743), the Daheyanzi River Basin (5Y744), the Sailimu Lake Basin (5Y745), and the Bortala River Basin (5Y746) (Figure 1). The glaciers around the basin are typically continental glaciers developing along the valleys.

2.2. Data

2.2.1. Remote Sensing Images

At present, the publicly accessible high spatial resolution remote sensing images mainly include
  • Landsat-8 OLI remote sensing images (30 m),
  • Aster remote sensing images (15 m), and
  • Sentinel-2 MSI remote sensing images (10 m).
Here, we use the Sentinel-2 MSI remote sensing images to retrieve the most accurate interpretation of the glacier boundaries. The image data have a revisit spanning time of five days and were acquired from June to September of 2019, which was the melting season of the glaciers. We use the Google Earth Engine (GEE) platform, a cloud-based geospatial processing platform, to quickly and efficiently filter high-quality, cloud-free Sentinel-2 MSI remote sensing images (referring to the work in [31]) and avoid laborious data collection, storage, organization, and preprocessing work.

2.2.2. The 1st and 2nd CGIs Data

The first CGI data, completed in 2002, are mainly derived from the 1960s’ aerial-photographed topographic maps, and the watershed of the Ebi Lake basin includes 13 sheets of 1:50,000 topographic maps. Moreover, the second CGI data, released in 2014, integrate remote-sensing data, topographic maps, and digital elevation model data. Both times of CGI data are available on the National Tibetan Plateau Third Pole Environment Data Center (http://westdc.westgis.ac.cn/).

2.2.3. Digital Elevation Data
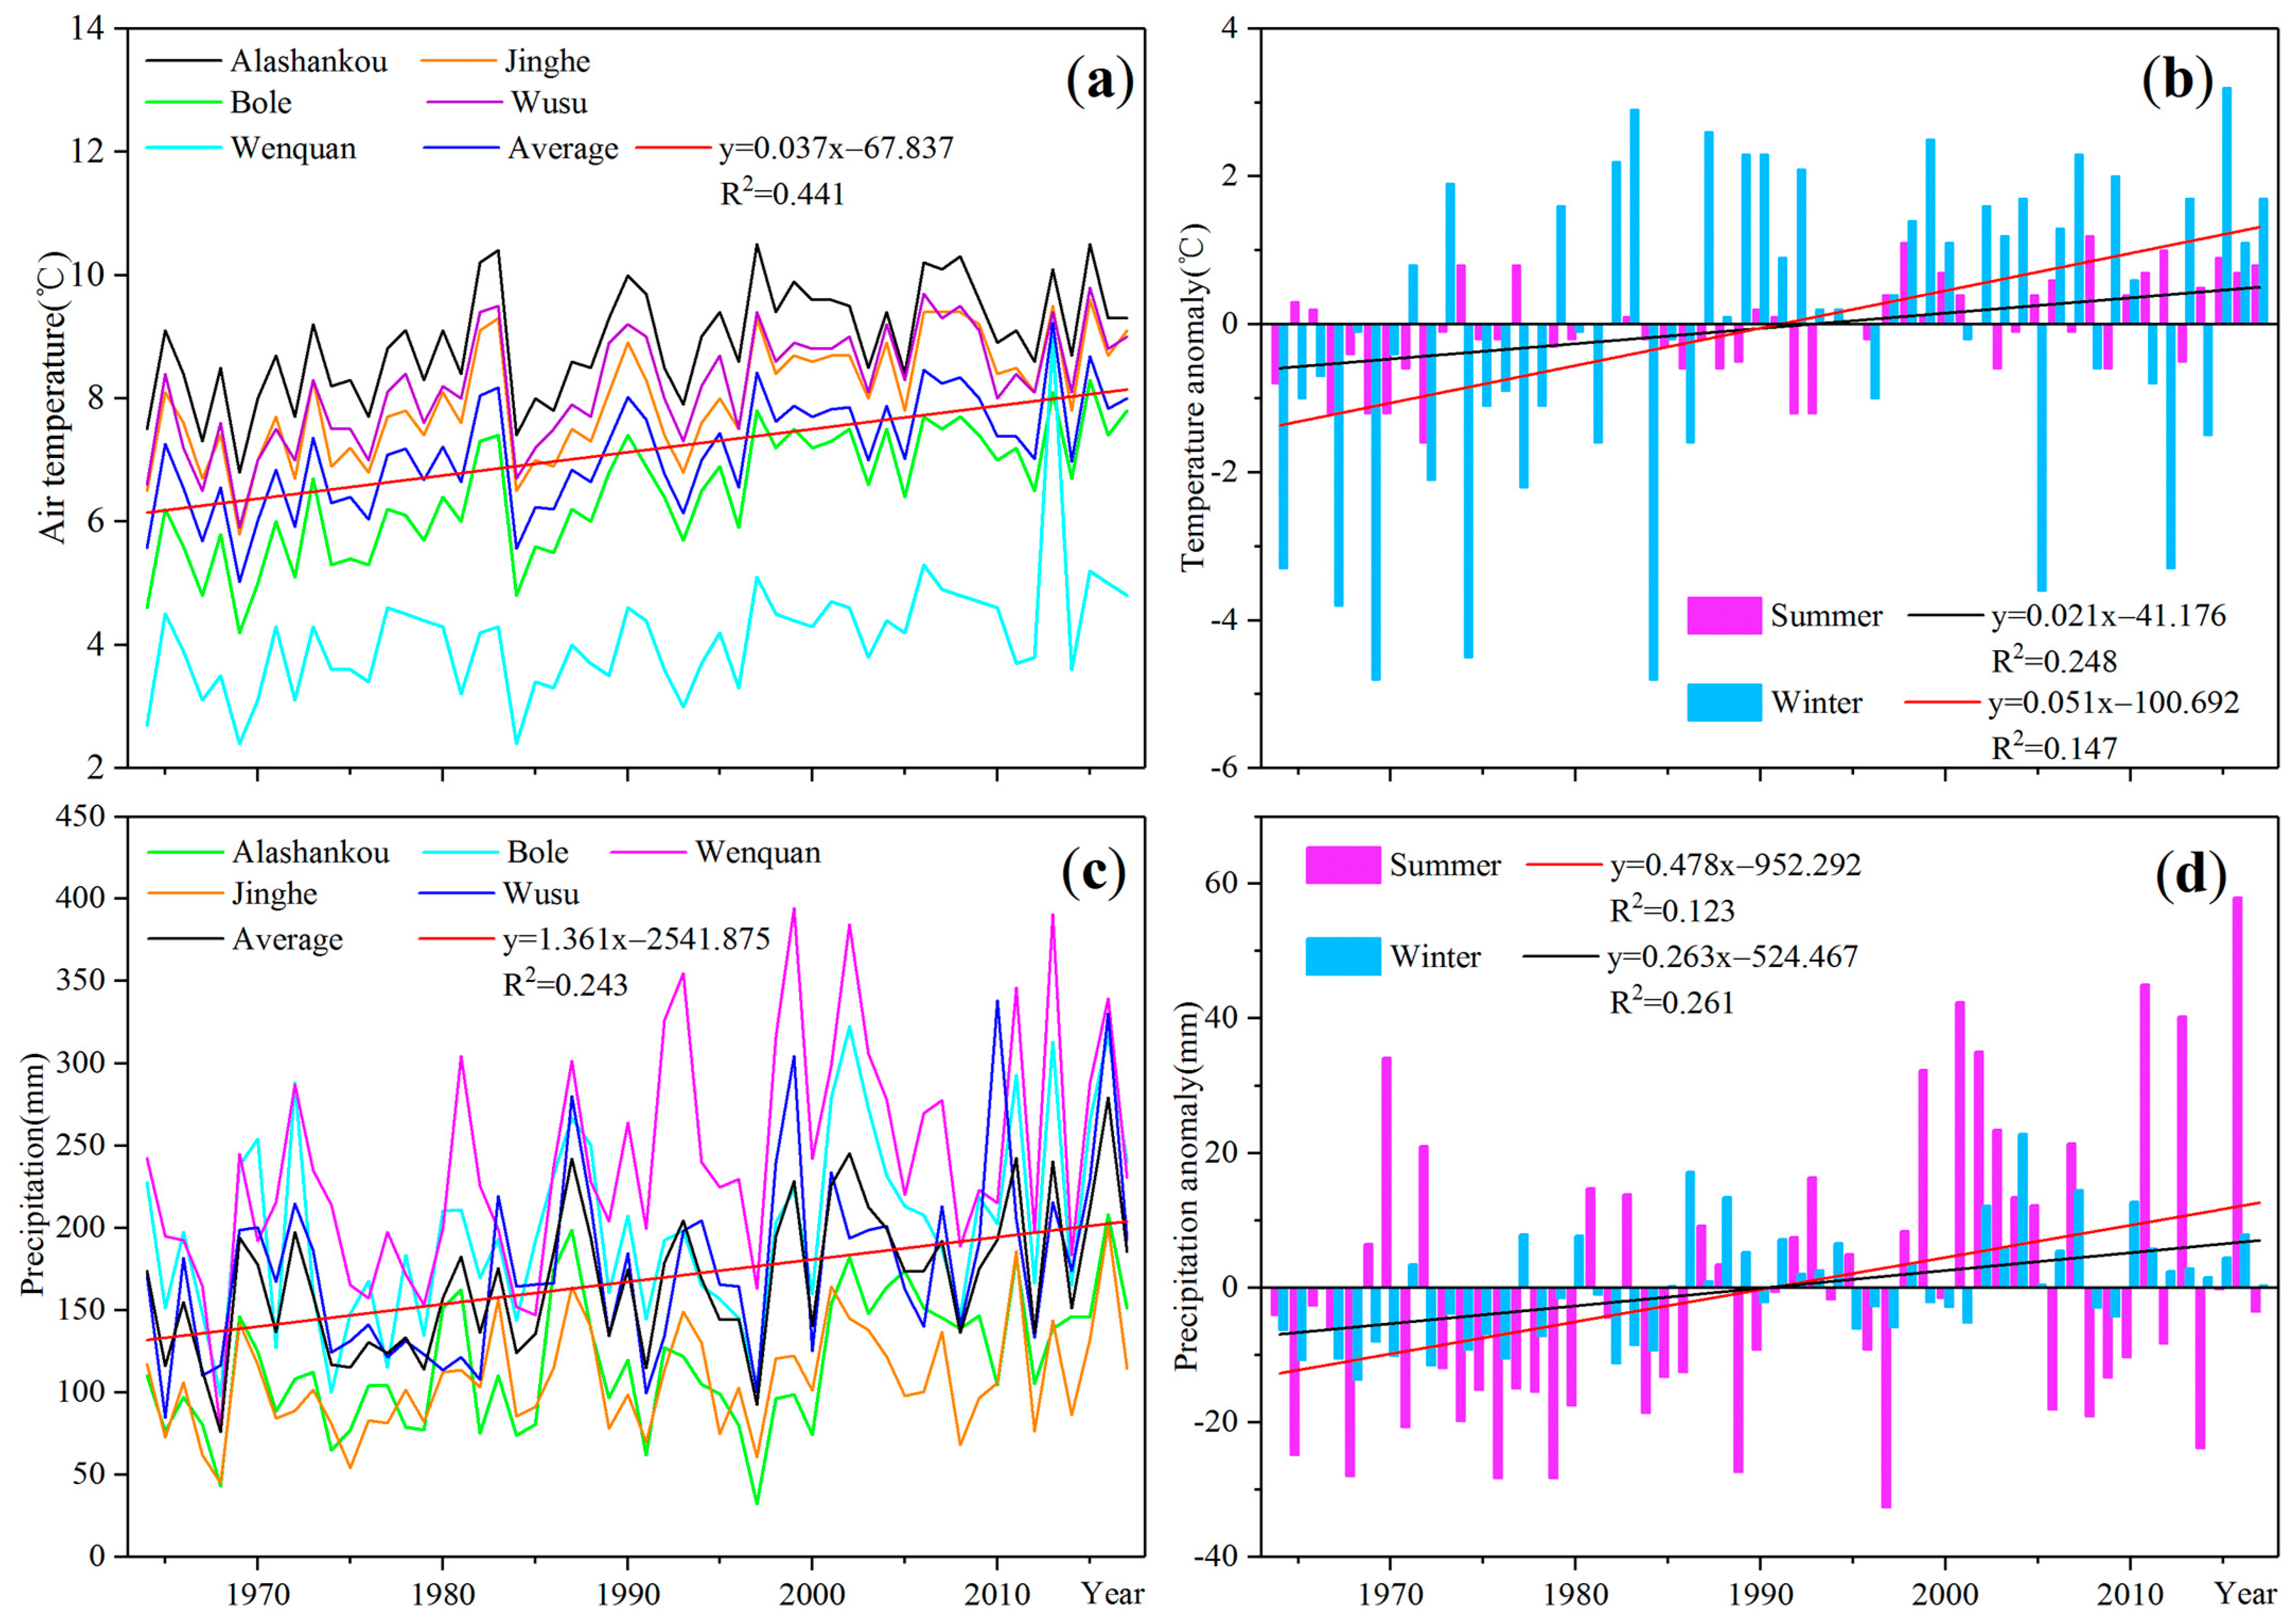
The digital elevation model is derived from the SRTM (Shuttle Radar Topography Mission), measured jointly by the NASA and the National Mapping Agency (NIMA), USA. This work uses the revised version 4.1 data with a spatial resolution of 90 m [32]. This version of SRTM data is provided by the CIAT (International Center for Tropical Agriculture) with a new interpolation algorithm. The nominal absolute elevation and planimetric accuracy of the data are ±16 m and ±20 m [33], respectively.

2.2.4. Meteorology

The meteorological data were obtained from the China Meteorological Data Service. (CMDS). The service provides the daily meteorological dataset collected from nearly 700 ground baseline stations in nationwide China. It can be accessed freely by registered educational and academic users, and here is the direct web link http://data.cma.cn/data/cdcdetail/dataCode/SURF_CLI_CHN_MUL_DAY_V3.0.html. In this work, the monthly temperature and precipitation data were retrieved from the CMDS dataset recorded by the five meteorological stations in the lower Ebi Lake Basin during 1964–2017 (Table 1).

2.3. Methods

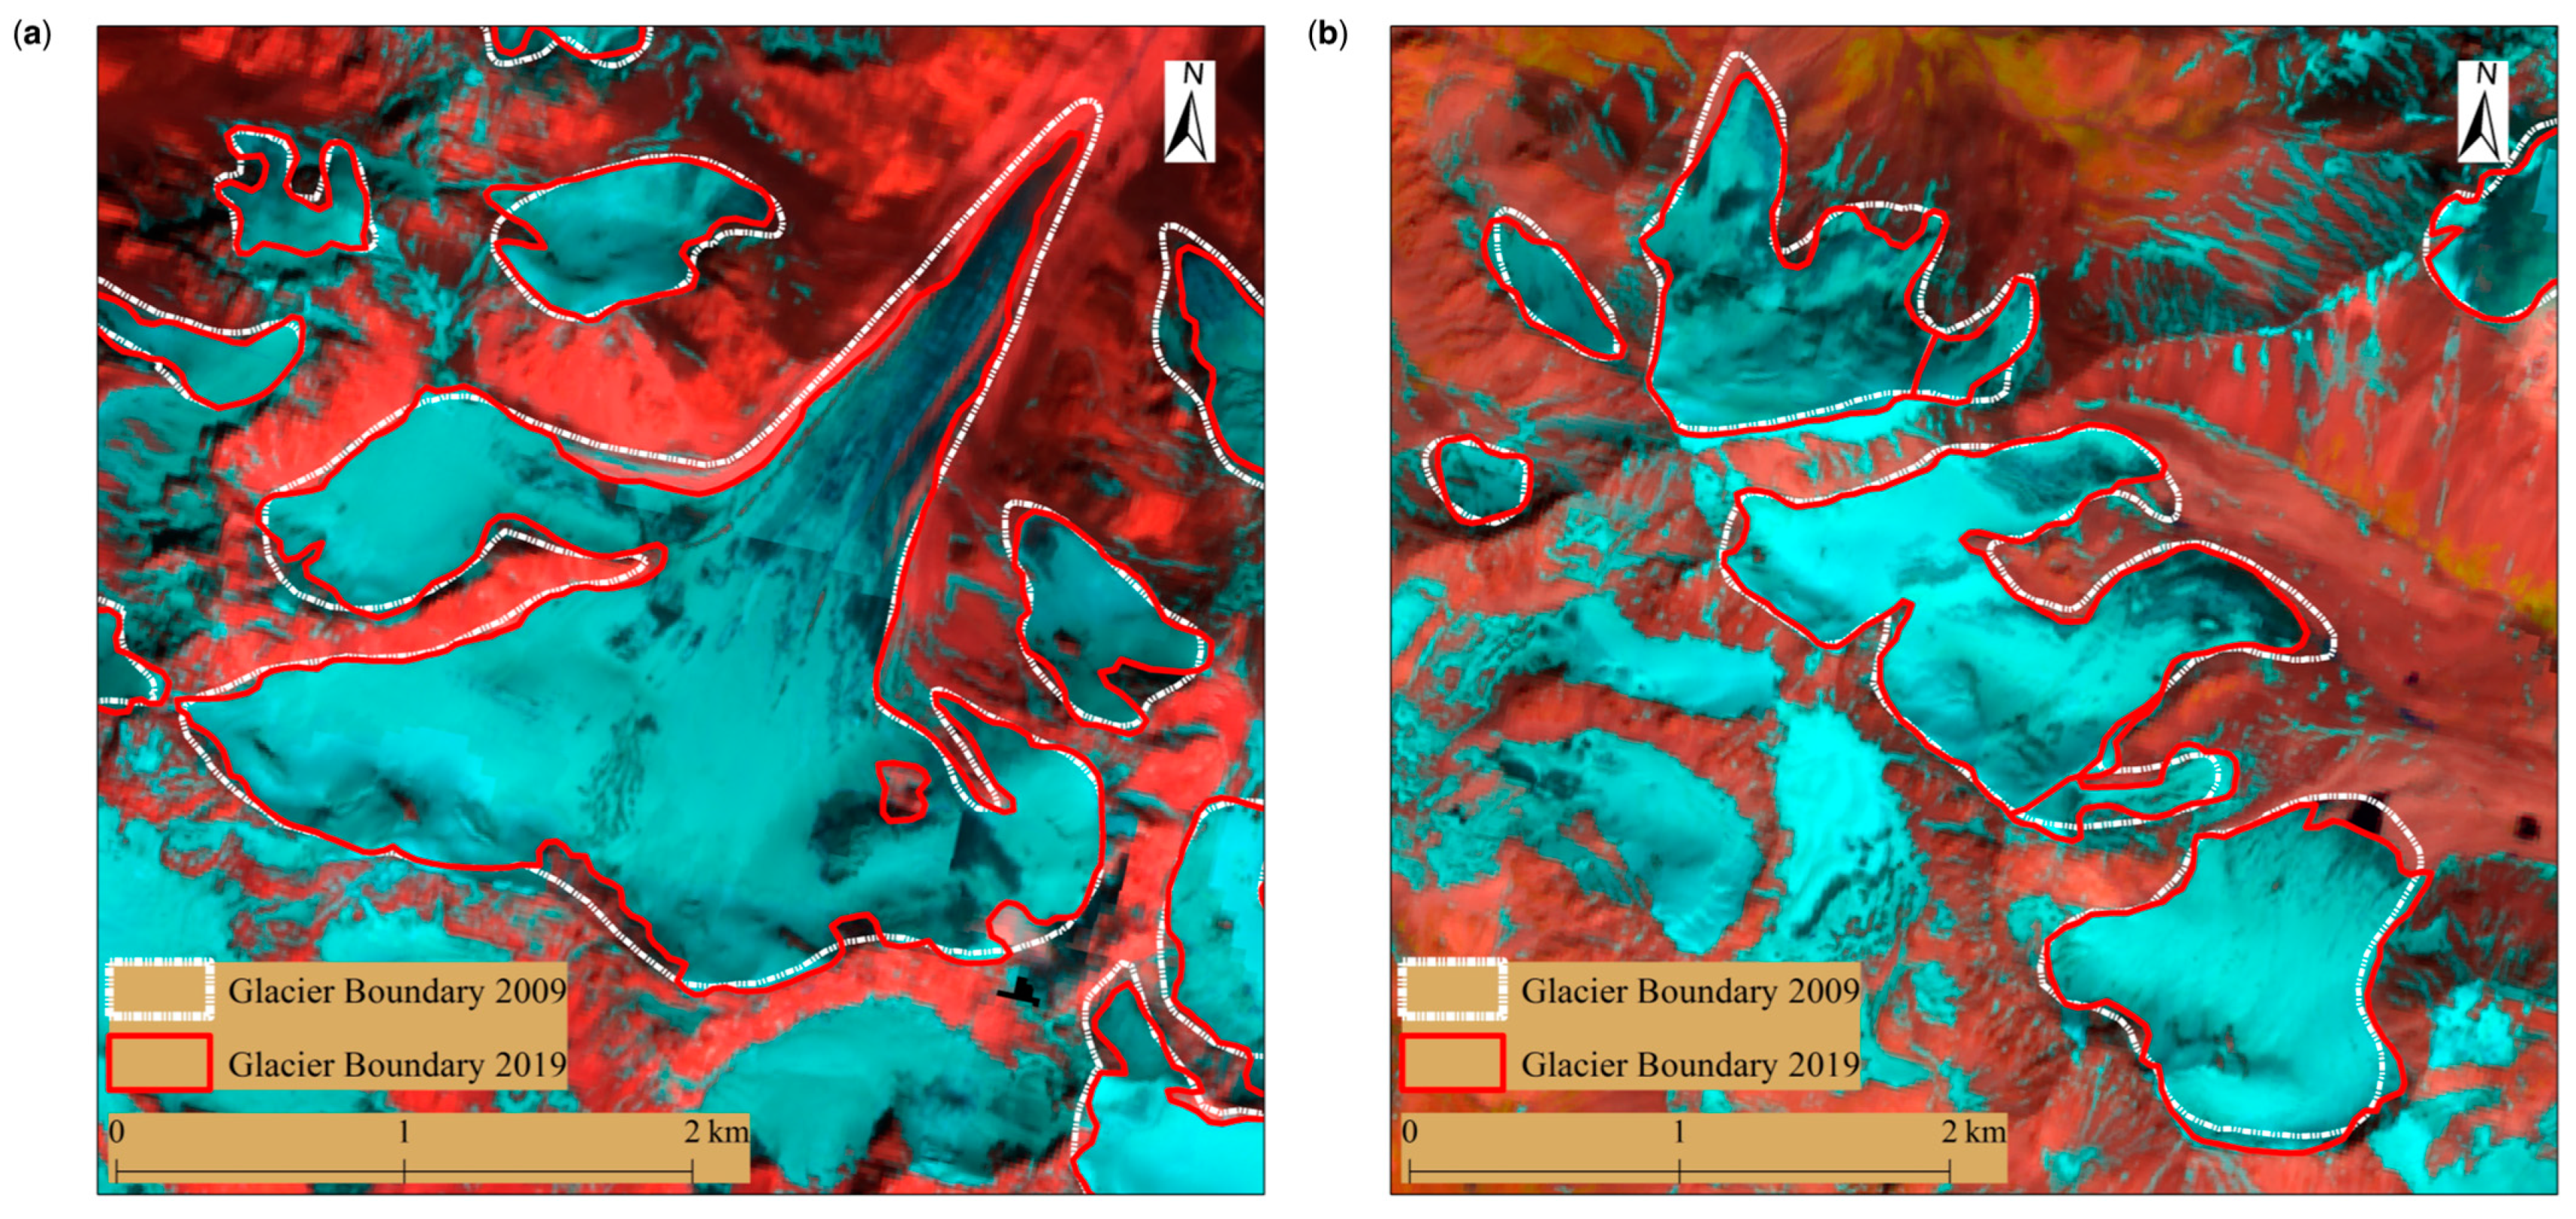
2.3.1. Confining Glacial Boundaries

Automatic interpretation methods applied to remotely sensed images for retrieving glacier boundaries are popular at present for simplifying and expediting the process [34]; however, the presence of snow, shadows, moraines, and water bodies makes it difficult to guarantee the accuracy of the automatic-interpretation methods in obtaining glacier boundaries. Visual interpretation is to obtain glacier-boundary information with remote sensing images based on existing glaciological knowledge, and this method is the most credible method to retrieve glacier boundaries [35]. Taking into account that the relatively small study area and accuracy, this study adopts visual interpretation for the latest remote sensing images to manually delineate glacier boundaries. With the ArcGIS version 10.5 software [36] and the first and second CGI cataloguing data, the glacier boundaries around the Ebi Lake Basin were vectorized and corrected by artificially visual interpretation in the Google Earth images, and the derived glacier boundaries were further amended with expert opinions.

2.3.2. Calculating Glacier Area and Volume

Changes in glacier area can be reflected by the difference in glacier area between the two periods, indicated by the rate of change in the glacier area and the relative rate of change in glacier area, using the following equation,
AC = (A1A0)/(t1 − t0),
and AAC = (A1A0)/[A0 × (t1 − t0)] × 100%,
where AC is the varying rate of glacier area (km2/a), AAC is the relative varying rate of glacier area (%/a), A is glacier area (km2), t indicates the year, and the subscript 0 and 1 indicate the starting and ending years for the specific glacial areas, respectively.
The glacier ice volume is not a directly approachable measurement here, because there were no direct measurements of ice thickness in most glaciers. This research used the volume–area empirical relationship by Gärtner-Roer et al. [37]:
V = c × Ae,
where V is glacier ice storage (km3), A is glacier area (km2), and c and e are the empirical coefficients by Gärtner-Roer et al. [37], respectively.

2.3.3. Assessing the Uncertainty

The accuracy evaluation of glacier boundaries obtained from remote sensing images is important but difficult to determine. In processing remote sensing images, errors mainly come from glacier boundary extraction uncertainties and image resolution and alignment errors. Glacier boundary extraction uncertainties can be reduced through field validation and glaciological experience, and the uncertainty in remotely sensed images can be calculated through the following formulas (4 [38] and 5 [20]) to calculate their error, based on the formula for calculating the uncertainty of glacier length and area variation [39,40,41].
U T = Σ λ 2 + Σ ε 2
and   U A = 2 U T   Σ λ 2 + Σ ε 2
where UT is the uncertainty of glacier length, λ is the impact resolution, ε is the alignment error of satellite images and the boundary layers, and UA is the uncertainty of glacier area. In this study, λ equals 10 m for the Sentinel-2 images, and ε equals ¼ pixel. The calculated length and area uncertainties in this study are ±12.5 m and ±0.00025 km2, respectively.

3. Results

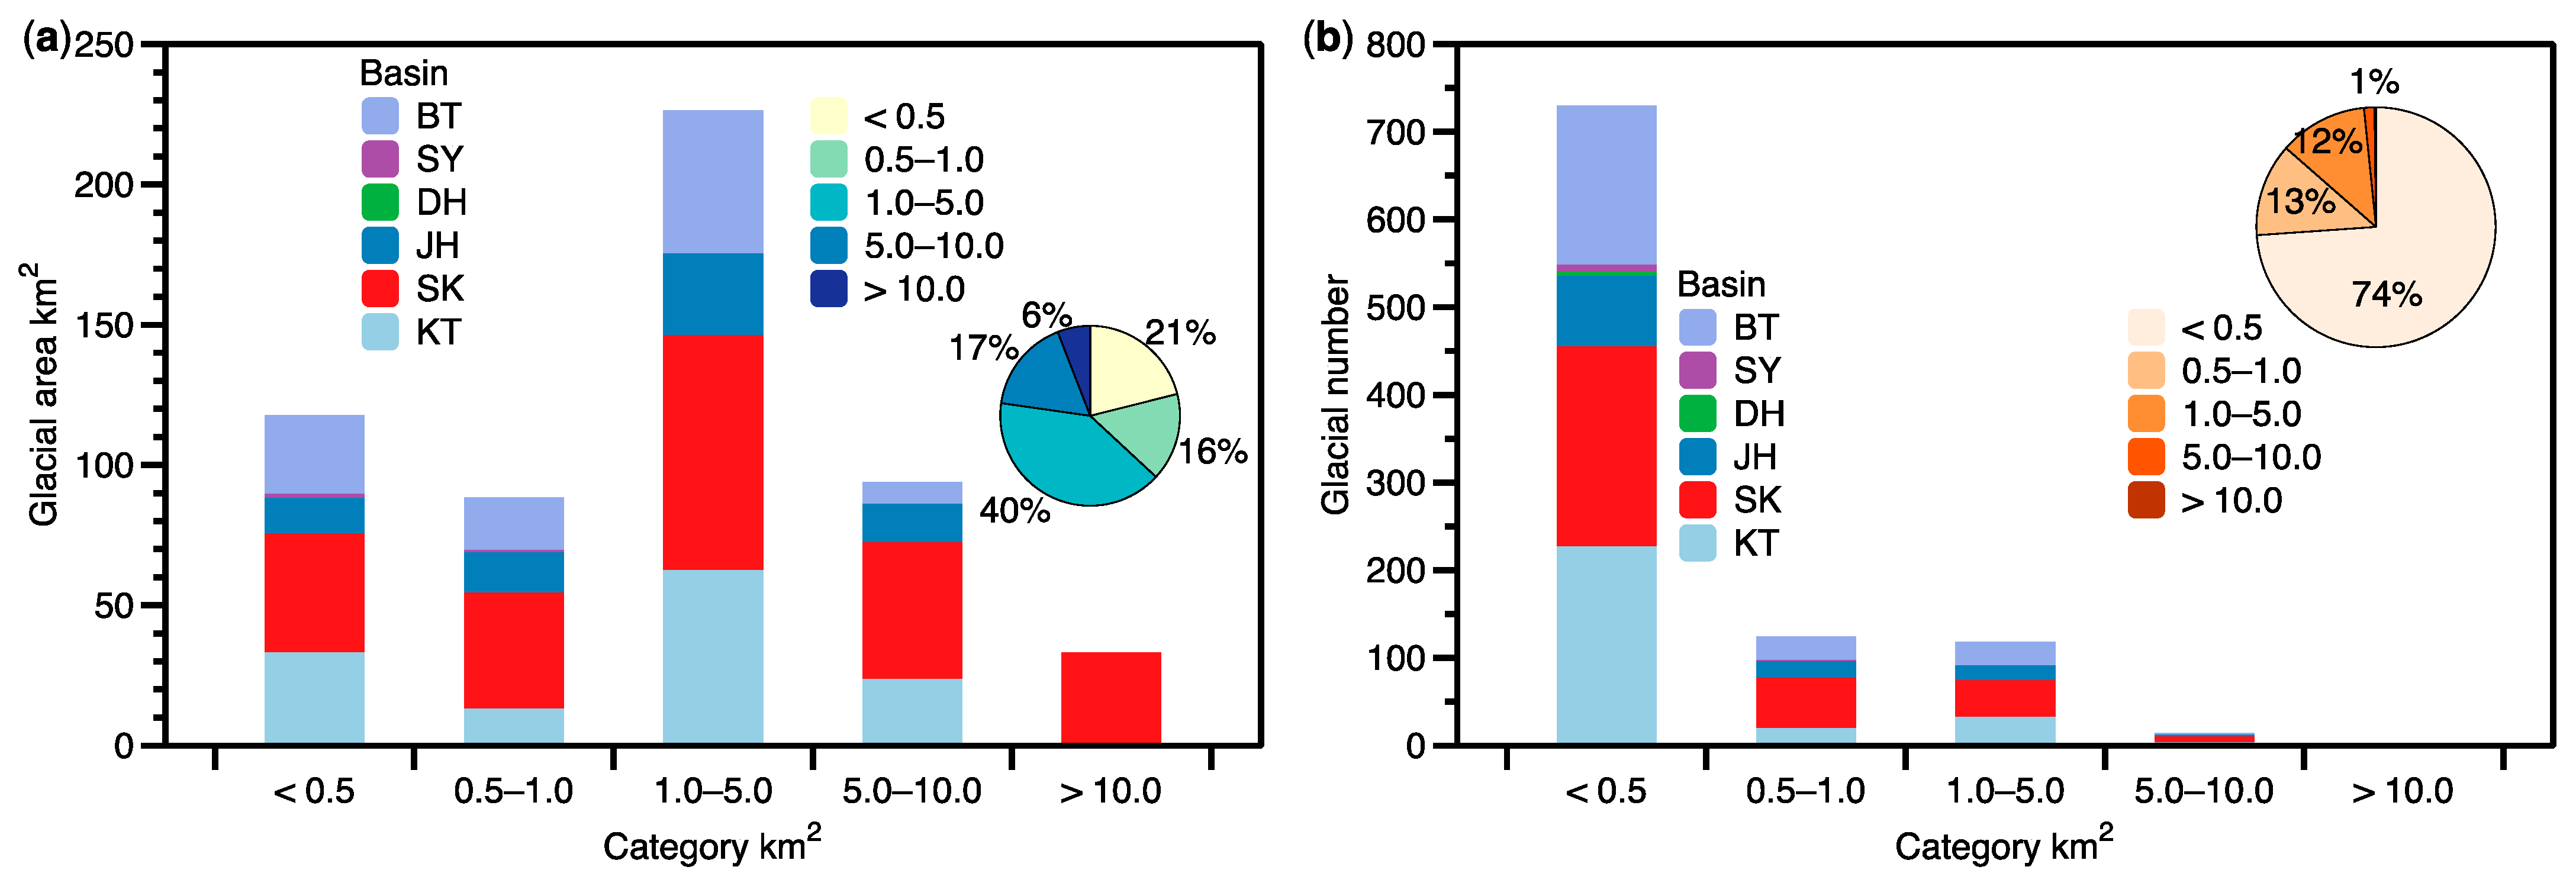
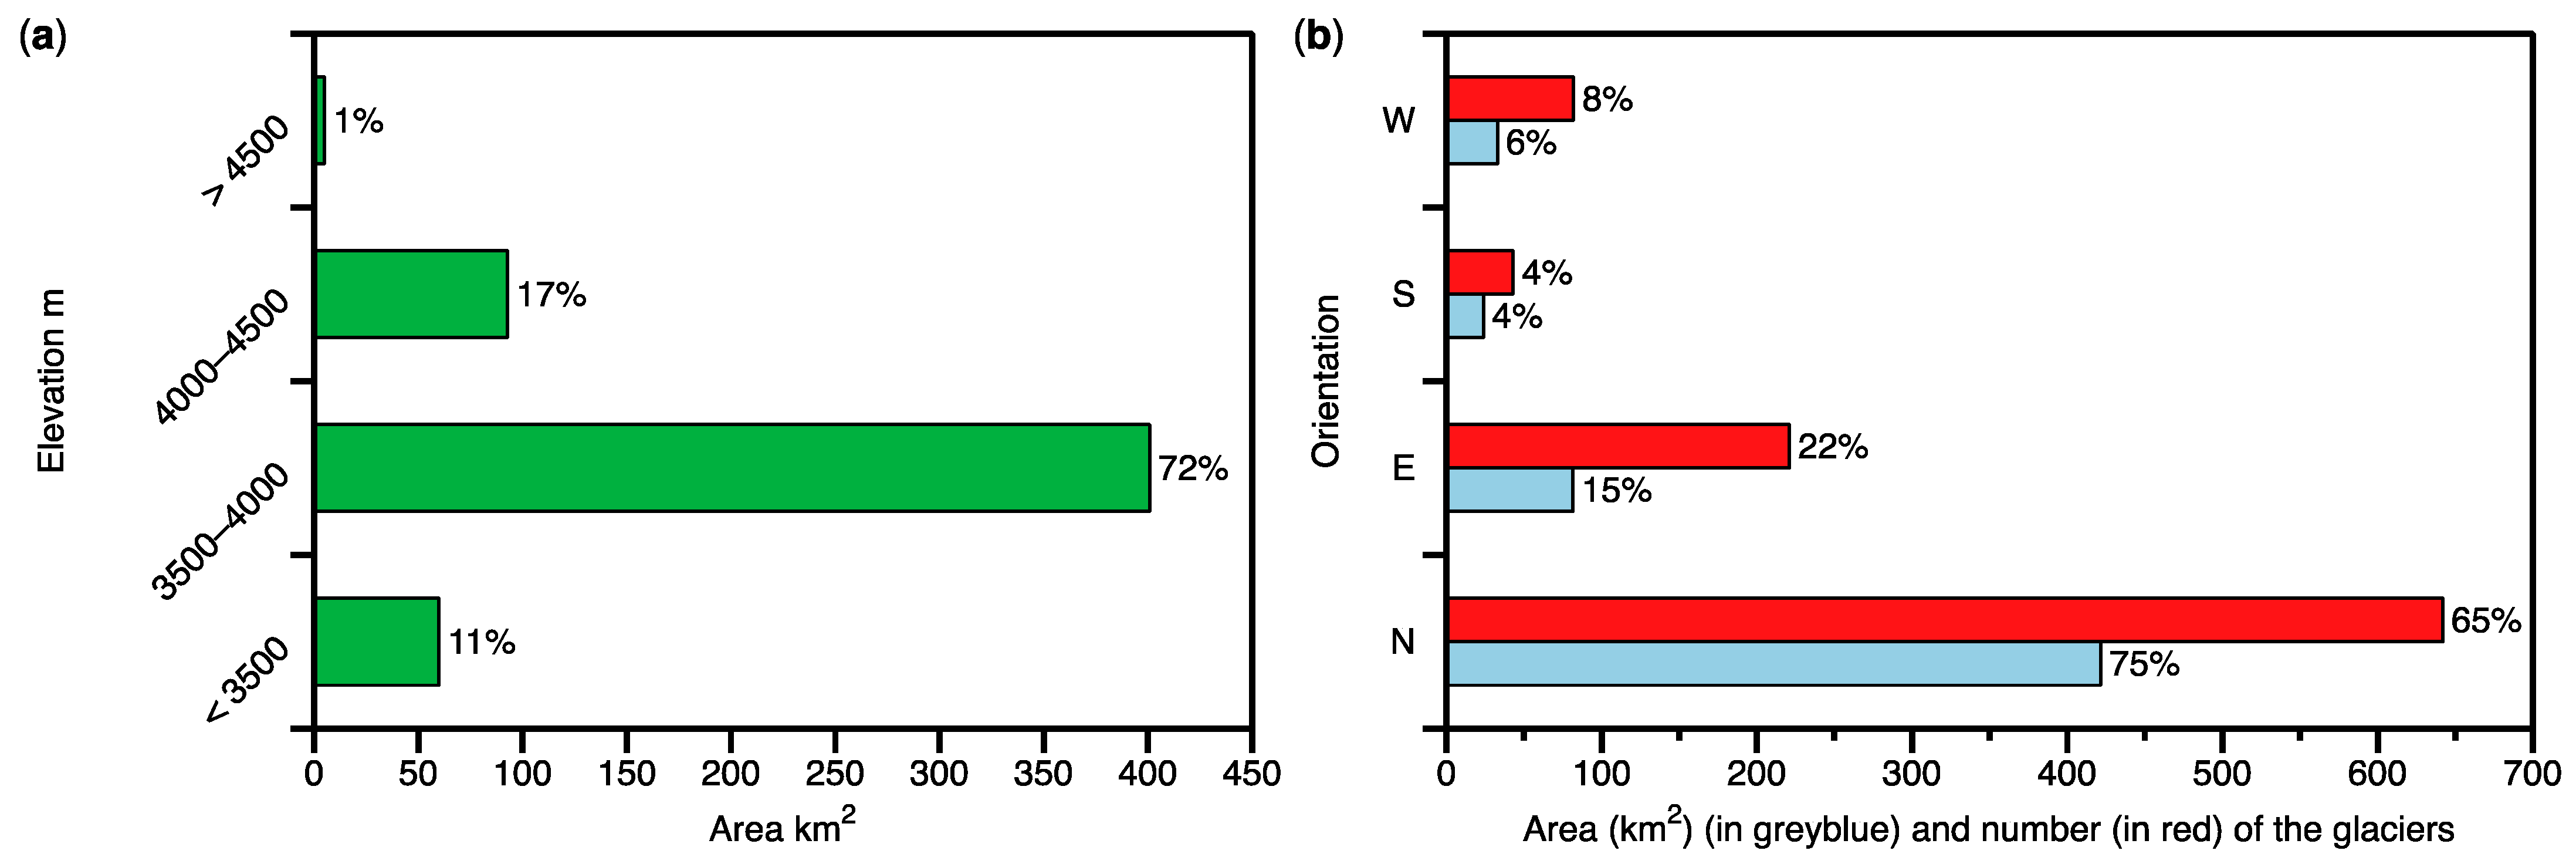
3.1. Updated Status of Glaciers in the Ebi Lake Basin in 2019

Overall, the number of glaciers in the Ebi Lake Basin investigated in 2019 was 988, with an area of ~560 km2, and the averaged area of a single glacier is 0.57 km2. The glaciers with the area between 1.0 and 5.0 km2 account for the largest share (40%) of the total glacier area in the study area, followed by those with areas of <0.5 km2 (21%), 5.0–10.0 km2 (17%), 0.5–1.0 km2 (16%), and >10.0 km2 (6%). The Sikeshu River Basin (5Y742) has the most extensively developed glaciers among the six sub-basins on all scales, while the Sayram Lake and Daheyanzi River basins have barely visible glaciers in Figure 1. The only two glaciers larger than 10 km2 are both located in the Sikeshu River Basin (Figure 2a). 74% of the glaciers in number have areas smaller than 0.5 km2 and are majorly located in the Kuitun, Sikeshu, and Bortala River sub-basins. The larger glaciers are much fewer distributed (Figure 2b). The glacial resources in the Ebi Lake basin are concentrated in four sub-basins (5Y741, 5Y742, 5Y743, and 5Y746), with the number of 974 (98.6%) and the area of ~557 km2 (99.6%), respectively.
In the Ebi Lake Basin, there is around 400 km2 of glaciers, accounting for 72% in a total spread from 3500 to 4000 m in elevation; 11% and 17% in area developed under 3500 m and between 4000 and 4500 m, respectively; and only 1% glacial area developed above 4500 m as of 2019 (Figure 3a). Most glaciers developed in the north (75% in area and 65% in number) and the east (15% in area and 22% in number) orientations (Figure 3b), implicated by the developing conditions of mountain glaciers if the north orientation indicates colder air masses, and the east implies richer water vapor sources in the Tianshan Mountains.

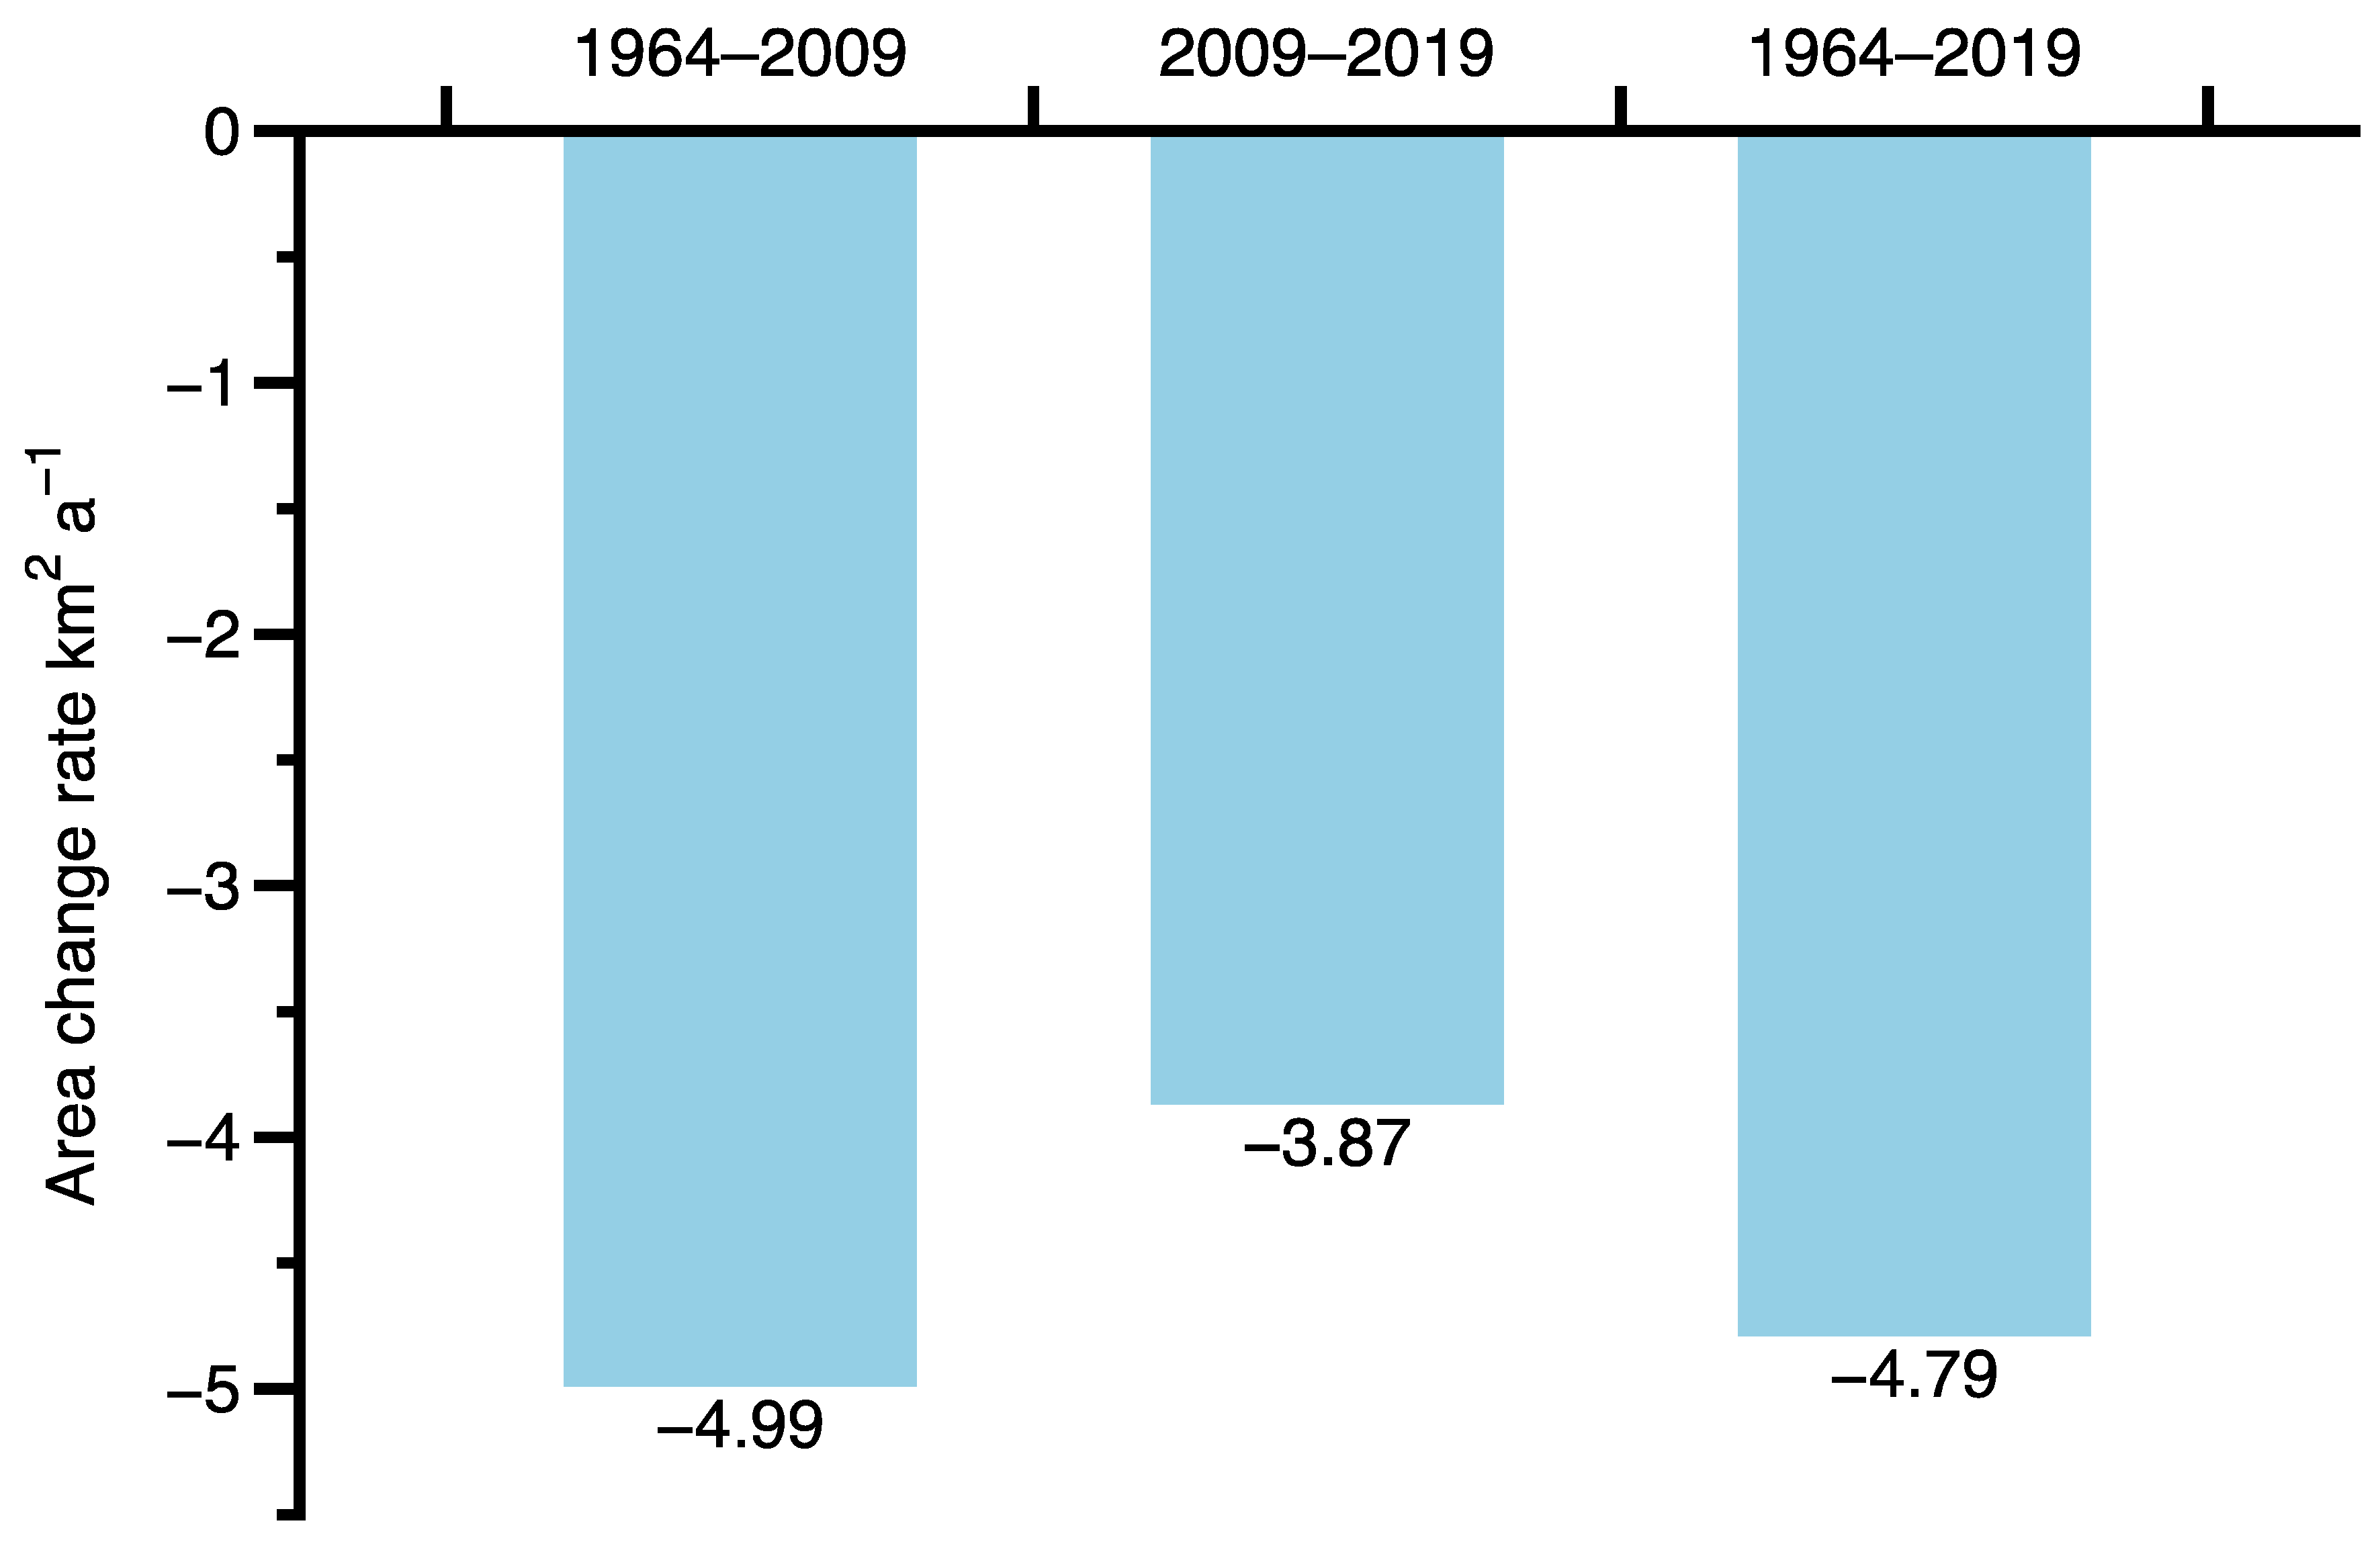
3.2. Changes of the Glaciers Relative to the 1st and 2nd CGIs

Table 2 present the glaciers in area and number investigated by the first and second CGIs (1964 and 2009, respectively) and this work up to 2019. The glaciers in the Ebi Lake Basin have changed a lot since the first and second CGIs either in area or in number. Almost all measures had decreased from the first CGI investigation to this work in 2019, except that the glacier number increased from 281 by the second CGI to 285 by this work. The sole exception was probably because of some separated glacier branches resulting from the shrinking area.
In more detail, the number of the Ebi Lake Basin’s glaciers decreased from 1104 to 998 (−2 a−1 or −2% a−1), and the area decreased by 263 km2 (−4.79 km2 a−1 or −0.58% a−1) during the period 1964–2019. The overall rate of glacier area decreasing during 1964–2019 was −4.79 km2 a−1, and the rate during 2009–2019 (−3.87 km2 a−1) was slower than that during 1964–2009 (−4.99 km2 a−1) (Figure 4). The shrinking rate of the glaciers in the Ebi Lake Basin was slowed by 22% or 1.12 km2 a−1 in the last decade, comparing with the period 1964–2009. Figure 5 shows some typical glacier boundaries in the basin defined by the second CGI and 2019 investigations, respectively. Compared with the boundary by 2009, the glacial area showed a general shrinkage in 2019.

4. Discussion

4.1. Spatial and Volume Variations of Glaciers in the Ebi Lake Basin since the 1st and 2nd CGIs

To understand the spatial variations of the Ebi Lake Basin’s glaciers, we show their varying rates in a geographic map (Figure 6). The area and number of glaciers in the individual sub-basin of the Ebi Lake basin showed a decreasing trend from 1964 to 2019. The Bortala River Basin (5Y746) had the largest decrease in glacier area (111.80 km2) with a rate of change of −2.03 km2 a−1, followed by the Sikeshu River Basin (5Y742) (−101.90 km2, or −1.85 km2 a−1) and the Quitun River Basin (5Y741) (−94.62 km2, −1.72 km2 a−1); the largest number of glaciers disappeared in the Sikeshu River Basin (5Y742) and the Daheyanzi River Basin (5Y744), losing 27 and 28 glaciers, respectively. From the analysis of the relative rate of glacier area change, the glaciers in the Daheyanzi River Basin (5Y744) were retreating fastest (−1.81 % a−1), followed by the Selimu Lake Basin (5Y745) with a retreating rate of −1.23 % a−1, and the glacier resources in the two sub-basins are on the verge of extinction. During 1964–2009, the vanished glaciers spread from west to east, while they concentrated in the west during 2009–2019.
This work used various methods to calculate the ice storages derived from different investigations and their variations in the basin (Table 3). The results show that the basin glacier ice reservation decreased by 97.84–153.22 km3 between 1964 and 2019, the equivalent water equivalent was 88.06–137.90 km3, taking 0.9 g cm−3 as ice density. The ice reservation decreased by 39.18%–41.23%, or −1.78~−2.79 km3 a−1. Compared with the glacier area reduction rate, the reduction rate of ice is greater, indicating that ice storage is more sensitive to regional warming. The glaciers in the basin are experiencing dramatic retreating and thinning.

4.2. Retreat of Glaciers in the Ebi Lake Basin Compared with the Greater Tianshan Region

In recent years, high-resolution satellite image data have been widely used in the dynamic monitoring of glaciers, and it has become possible to study glacier changes in large regions. To study the change of the glaciers in the Ebi Lake Basin in the greater Tianshan, this study compares the glacier changes here with those in the other typical mountains and watersheds of the Tianshan (Table 4). It is found that the trend of glaciers change in the Ebi Lake is consistent with the trends in other regions, that is, smaller-size glaciers have less reduction. In general, the glacial retreat rates in the greater Tianshan region were varying. The glaciers in the Ebi Lake basin retreated at a rate of 0.58% a−1, making the Ebi Lake Basin one of the fastest retreating areas in the Tianshan region. The glacier retreat rate in the western section of the Tianshan is larger, followed by the middle section and the smallest in the eastern section, and the glacier retreat rate on the northern slope is higher than on the southern slope. Regional climate variation (temperature and precipitation) and the individual glaciers’ sizes are the main influencing factors on glacier area in the Ebi Lake Basin. The number of glaciers in the region is dominated by those with an area of smaller than 0.5 km2 (730 glaciers, or 73.9% of the total number of glaciers).

4.3. Factors and Their Roles in the Change of Glaciers in the Ebi Lake Basin

Precipitation and temperature are the main factors affecting glacier development. The interannual changes of these two factors together determine the nature, development and evolution of glaciers. Temperature determines ablation, and precipitation affects accumulation. Therefore, it is prerequisite to study the climate in the watershed to project the glaciers’ evolution. As per the geography of the study area, this work selected five meteorological stations, i.e., Alashankou (51232), Bole (51238), Wenquan (51330), Jinghe (51334), and Wusu (51346), as the climatic reference for the study area (Figure 1).
The yearly average temperature and precipitation, and their anomalies at the five meteorological stations in winter and summer from 1964–2017, are shown in Figure 7. The temperature averaged from the five stations shows an increasing trend of 0.37 °C (10a)−1 (0.001 confidence level) from 1964 through 2017, 2.6 times as high as the global mean rate, i.e., 0.14 °C (10a)−1 from 1951 to 2012 [4]. The temperatures of the watershed in summer and winter both show increasing trends (0.51 °C (10a)−1 in winter and 0.21 °C (10a) −1 in summer, respectively), and the temperature increase in winter is 2.5 times faster than the summer. Similar to the temperature, precipitation records at all five weather stations show an average increasing trend (13.61 mm (10a)−1 at 0.001 confidence level); both summer and winter precipitation in the watershed show increasing, greater in summer (4.78 mm (10a)−1) than in winter (2.63 mm (10a)−1). The increasing temperature and precipitation trends in the Ebi Lake Basin are consistent with the climate shift theory from warm dry to warm wet in northwest China [55]. The mass loss of global mountain glaciers induced by a one degree increase in temperature needs 25–35% increase in precipitation to compensate for the loss [56]. In the context of this combined hydrothermal climate change in the Ebi Lake Basin, precipitation has increased, but temperature also increases to melt the glaciers, and the increased precipitation does not add enough mass to the glaciers and compensate for their mass loss. With increasing mass deficiency, glacier mass loss accelerates, and mass balance lines rise, leading to the widespread glacier retreat.

5. Conclusions

The number of glaciers in the Ebi Lake Basin in the 2019 ablation season was 988 with the total area of 559.77 km2. The glaciers in the basin are mainly characterized by individuals with the area between 0.1 and 10.0 km2 summed 509.05 km2, ~91% of the total glacial area in the basin. There are 730 glaciers smaller than 0.5 km2, accounting for 74% of the total number of glaciers in the basin. The glaciers are concentrated between 3500 m and 4000 m in elevation, with a total area of 512 km2, ~91% of the total.
During 1964–2019, the number and area of the Ebi Lake Basin’s glaciers had decreased by 116 (10.5%) and 263 km2 (32%) at the rate of −4.79 km2 a−1 or −0.58% a−1, respectively. Glaciers with an area between 2.0 and 5.0 km2 had the largest reduction of −82.60 km2 (~41%) with the rate of −1.5 km2 a−1 or −0.74% a−1. The glaciers in the basin were all in retreat from 1964 through 2019, and the glaciers lower than 3200 m disappeared in 2019, and those between 3500 m and 4000 m dominated the total glacial area. Those north- and northeast-oriented glaciers in the basin had the largest area and number. The glaciers in each sub-basin of the Ebi Lake basin showed a decreasing trend from 1964 to 2019; noticeably, these glaciers in the recent decade (2009–2019) showed a slower retreating trend, compared with the investigations by the first and second CGIs. The Bortala River Basin (5Y746) has the largest decrease in glacier area (111.80 km2) with a rate of −2.03 km2 a−1, followed by the Sikeshu River Basin (5Y742) (−101.90 km2 or −1.85 km2 a−1) and the Quitun River Basin (5Y741) (−94.62 km2 or −1.72 km2 a−1). The ice storage in the basin during the last 55 years had decreased by 97.84–153.22 km3. The equivalent water equivalent was 88.06–137.90 km3 with −1.78~−2.79 km3 a−1 or −0.71~−0.75 % a−1.
The temperature in the basin had increased by 0.36 °C (10a)−1 during 1964–2017, much faster than the global mean, and the annual precipitation in the basin also showed an increasing trend of 12.06 mm (10a)−1. The temperature and precipitation trends in the basin are consistent with the climate shift from warm-dry to warm-wet in northwest China. Although the precipitation in the basin has increased, the increase in precipitation was not sufficient to compensate for the mass loss of the glaciers by the increased temperatures, leading widespread retreating of the glaciers in the basin. This work may be the first report on the status of the glaciers in the Ebi Lake Basin and revealed their most recent change since the second China Glacier Investigation. The main points can be helpful for policymakers to take measures to mitigate the impact of climate change on the region.

Author Contributions

Conceptualization, L.W. and J.M.; methodology, L.W.; software, C.B. and J.M.; validation, L.W., C.B., and J.M.; formal analysis, C.B.; investigation, L.W.; resources, J.M.; data curation, L.W. and C.B.; writing—original draft preparation, L.W. and C.B.; writing—review and editing, J.M.; visualization, C.B.; supervision, J.M.; project administration, L.W.; funding acquisition, L.W. All authors have read and agreed to the published version of the manuscript.

Funding

This research is funded by the National Key Research and Development Program of China (grant number 2020YFF0304400), the Second Tibetan Plateau Scientific Expedition and Research (STEP) program (grant number 2019QZKK0201), the State Key Laboratory of Cryospheric Sciences (grant number SKLCS-ZZ-2020), and the Key Research Program of Frontier Sciences of Chinese Academy of Sciences (grant number QYZDB-SSW-SYS024).

Institutional Review Board Statement

Not applicable.

Informed Consent Statement

Not applicable.

Data Availability Statement

The data presented in this study are available on request from the corresponding author.

Acknowledgments

We thank the TPDC for providing the first and second CGI data; NASA, NIMA, and CIAT for providing the version 4.1 SRTM data; and the CMDS for providing the meteorology data. We also thank the two anonymous reviewers for their suggestions during the revising procedure.

Conflicts of Interest

The authors declare no conflict of interest.

References

  1. WGII. Climate Change 2014: Impacts, Adaptation, and Vulnerability-AR5 Summary for Policymakers. WGII AR5 Phase I Rep. Launch 2014, 1, 31. [Google Scholar]
  2. Pritchard, H.D. Asia’s glaciers are a regionally important buffer against drought. Nature 2017, 545, 169–174. [Google Scholar] [CrossRef] [PubMed]
  3. Pritchard, H.D. Asia’s shrinking glaciers protect large populations from drought stress. Nature 2019, 569, 649–654. [Google Scholar] [CrossRef] [PubMed]
  4. Intergovernmental Panel on Climate Change. Climate Change 2013—The Physical Science Basis: Working Group I Contribution to the Fifth Assessment Report of the Intergovernmental Panel on Climate Change; Cambridge University Press: Cambridge, UK, 2014. [Google Scholar] [CrossRef] [Green Version]
  5. Immerzeel, W.W.; Lutz, A.F.; Andrade, M.; Bahl, A.; Biemans, H.; Bolch, T.; Hyde, S.; Brumby, S.; Davies, B.J.; Elmore, A.C.; et al. Importance and vulnerability of the world’s water towers. Nature 2019, 577, 364–369. [Google Scholar] [CrossRef] [PubMed]
  6. Zemp, M.; Huss, M.; Thibert, E.; Eckert, N.; McNabb, R.; Huber, J.; Barandun, M.; Machguth, H.; Nussbaumer, S.U.; Gartner-Roer, I.; et al. Global glacier mass changes and their contributions to sea-level rise from 1961 to 2016. Nature 2019, 568, 382–386. [Google Scholar] [CrossRef]
  7. Kraaijenbrink, P.D.A.; Bierkens, M.F.P.; Lutz, A.F.; Immerzeel, W.W. Impact of a global temperature rise of 1.5 degrees Celsius on Asia’s glaciers. Nature 2017, 549, 257–260. [Google Scholar] [CrossRef]
  8. Liu, S.Y.; Yao, X.J.; Guo, W.Q.; Xu, J.L.; Shangguan, D.; Wei, J.; Bao, W.; Wu, L. The contemporary glaciers in China based on the Second Chinese Glacier Inventory. Acta Geogr. Sin. 2015, 70, 3–16. [Google Scholar] [CrossRef]
  9. Shi, Y.; Liu, S. Pre-estimation for the response of China glaciers to global warming in the 21st century. Chin. Sci. Bull 2000, 45, 434–438. [Google Scholar] [CrossRef]
  10. Sun, M.; Liu, S.; Yao, X.; Guo, W.; Xu, J. Glacier changes in the Qilian Mountains in the past half-century: Based on the revised First and Second Chinese Glacier Inventory. J. Geogr. Sci. 2018, 28, 206–220. [Google Scholar] [CrossRef] [Green Version]
  11. Xing, W.; Li, Z.; Zhang, H.; Zhang, M.; Liang, P.; Mu, J. Spatial-temporal variation of glacier resources in Chinese Tianshan Mountains since 1959. Acta Geogr. Sin. 2017, 72, 1594–1605. [Google Scholar]
  12. Yao, T.; Thompson, L.; Yang, W.; Yu, W.; Gao, Y.; Guo, X.; Yang, X.; Duan, K.; Zhao, H.; Xu, B. Different glacier status with atmospheric circulations in Tibetan Plateau and surroundings. Nat. Clim. Chang. 2012, 2, 663–667. [Google Scholar] [CrossRef]
  13. Liu, Q.; Liu, S. Response of glacier mass balance to climate change in the Tianshan Mountains during the second half of the twentieth century. Clim. Dyn. 2015, 46, 303–316. [Google Scholar] [CrossRef]
  14. Zhang, Y.; Enomoto, H.; Ohata, T.; Kitabata, H.; Kadota, T.; Hirabayashi, Y. Projections of glacier change in the Altai Mountains under twenty-first century climate scenarios. Clim. Dyn. 2016, 47, 2935–2953. [Google Scholar] [CrossRef]
  15. Ma, L.; Wu, J.; Abuduwaili, J. Variation in aeolian environments recorded by the particle size distribution of lacustrine sediments in Ebinur Lake, northwest China. SpringerPlus 2016, 5, 481. [Google Scholar] [CrossRef] [PubMed] [Green Version]
  16. Wu, J.; Yu, Z.; Wang, N. Possible solar forcing of 400-year wet–dry climate cycles in northwestern China. Clim. Chang. 2009, 96, 473–482. [Google Scholar] [CrossRef]
  17. Tao, S.; Fang, J.; Ma, S.; Cai, Q.; Xiong, X.; Tian, D.; Zhao, X.; Fang, L.; Zhang, H.; Zhu, J.; et al. Changes in China’s lakes: Climate and human impacts. Natl. Sci. Rev. 2019, 7, 132–140. [Google Scholar] [CrossRef] [Green Version]
  18. NASA. Shrinking Lake Ebinur. Available online: https://earthobservatory.nasa.gov/images/84785/shrinking-lake-ebinur (accessed on 27 January 2021).
  19. Liu, H.; Chen, Y.; Ye, Z.; Li, Y.; Zhang, Q. Recent Lake Area Changes in Central Asia. Sci. Rep. 2019, 9, 16277. [Google Scholar] [CrossRef] [Green Version]
  20. Farinotti, D.; Longuevergne, L.; Moholdt, G.; Duethmann, D.; Mölg, T.; Bolch, T.; Vorogushyn, S.; Güntner, A. Substantial glacier mass loss in the Tien Shan over the past 50 years. Nat. Geosci. 2015, 8, 716–722. [Google Scholar] [CrossRef]
  21. Liu, S.; Ding, Y.; Zhang, Y.; Shangguan, D.; Li, J.; Han, H.; Wang, J.; Xie, C. Impact of the glacial change on water resources in the Tarim River Basin. Acta Geogr. Sin. 2006, 61, 482–490. [Google Scholar]
  22. Wang, P.; Li, Z.; Cao, M.; LI, H.-l. Variation of Qingbingtan glacier No. 72 in Mt. Tuomuer region during past 45 years. Sci. Geogr. Sin. 2010, 30, 962–967. [Google Scholar]
  23. Wang, P.; Li, Z.; Li, H.; Wu, L.; Jin, S.; Zhou, P. Changes of ice-thickness and volume for representative glaciers in Tianshan Mountains in the past 50 years. Acta Geogr. Sin. 2012, 67, 929–940. [Google Scholar]
  24. Wang, S.; Zhang, M.; Li, Z.; Wang, F.; Li, H.; Li, Y.; Huang, X. Response of glacier area variation to climate change in Chinese Tianshan Mountains in the past 50 years. Acta Geogr. Sin. 2011, 66, 38–46. [Google Scholar]
  25. Xu, J.; Liu, S.; Guo, W.; Zhang, Z.; Wei, J.; Feng, T. Glacial area changes in the Ili River catchment (Northeastern Tian Shan) in Xinjiang, China, from the 1960s to 2009. Adv. Meteorol. 2015, 2015. [Google Scholar] [CrossRef]
  26. Li, K.; Li, Z.; Gao, W.; Wang, L. Recent glacial retreat and its effect on water resources in eastern Xinjiang. Chin. Sci. Bull 2011, 56, 3596–3604. [Google Scholar] [CrossRef] [Green Version]
  27. Wang, L.; Li, Z.; Wang, F.; Edwards, R. Glacier shrinkage in the Ebinur lake basin, Tien Shan, China, during the past 40 years. J. Glaciol. 2014, 60, 245–254. [Google Scholar] [CrossRef] [Green Version]
  28. Zhang, H.; Li, Z.; Wang, P.; Huai, B. Variation of Haxilegen No.51 Glacier at the Headwater of Kuitun River in Tianshan Mountains and its response to climate change. Arid Zone Res. 2015, 32, 88–93. [Google Scholar]
  29. Abuduwailil, J.; Zhaoyong, Z.; Fengqing, J. Evaluation of the pollution and human health risks posed by heavy metals in the atmospheric dust in Ebinur Basin in Northwest China. Environ. Sci. Pollut. Res. 2015, 22, 14018–14031. [Google Scholar] [CrossRef]
  30. Zhang, A.; Ding, J.; Zhang, J.; Dong, Y. The variation characteristics of actual evapotranspiration in the Ebinur Lake oasis and its relationship with landscape pattern. J. Glaciol. Geocryol. 2020, 42, 1–9. [Google Scholar]
  31. Gorelick, N.; Hancher, M.; Dixon, M.; Ilyushchenko, S.; Thau, D.; Moore, R. Google Earth Engine: Planetary-scale geospatial analysis for everyone. Remote Sens. Environ. 2017, 202, 18–27. [Google Scholar] [CrossRef]
  32. Reuter, H.I.; Nelson, A.; Jarvis, A. An evaluation of void-filling interpolation methods for SRTM data. Int. J. Geogr. Inf. Sci. 2007, 21, 983–1008. [Google Scholar] [CrossRef]
  33. Jarvis, A.; Reuter, H.; Nelson, A.; Guevara, E. Hole-Filled Seamless SRTM Data V4: International Centre for Tropical Agriculture. Srtm. Csi. Cgiar. Org Accessed 2008, 31. [Google Scholar]
  34. Tsagkatakis, G.; Aidini, A.; Fotiadou, K.; Giannopoulos, M.; Pentari, A.; Tsakalides, P. Survey of Deep-Learning Approaches for Remote Sensing Observation Enhancement. Sensors (Basel) 2019, 19, 3929. [Google Scholar] [CrossRef] [PubMed] [Green Version]
  35. Raup, B.; Racoviteanu, A.; Khalsa, S.J.S.; Helm, C.; Armstrong, R.; Arnaud, Y. The GLIMS geospatial glacier database: A new tool for studying glacier change. Glob. Planet. Chang. 2007, 56, 101–110. [Google Scholar] [CrossRef]
  36. Environmental Systems Research Institute. ArcGIS Desktop: Release 10; Environmental Systems Research Institute: Redlands, CA, USA, 2011. [Google Scholar]
  37. Gärtner-Roer, I.; Naegeli, K.; Huss, M.; Knecht, T.; Machguth, H.; Zemp, M. A database of worldwide glacier thickness observations. Glob. Planet. Chang. 2014, 122, 330–344. [Google Scholar] [CrossRef] [Green Version]
  38. Moore, J.C.; Grinsted, A.; Zwinger, T.; Jevrejeva, S. Semiempirical and process-based global sea level projections. Rev. Geophys. 2013, 51, 484–522. [Google Scholar] [CrossRef]
  39. Ye, Q.; Kang, S.; Chen, F.; Wang, J. Monitoring glacier variations on Geladandong mountain, central Tibetan Plateau, from 1969 to 2002 using remote-sensing and GIS technologies. J. Glaciol. 2006, 52, 537–545. [Google Scholar] [CrossRef] [Green Version]
  40. Silverio, W.; Jaquet, J.-M. Glacial cover mapping (1987–1996) of the Cordillera Blanca (Peru) using satellite imagery. Remote Sens. Environ. 2005, 95, 342–350. [Google Scholar] [CrossRef]
  41. Hall, D.K.; Bayr, K.J.; Schöner, W.; Bindschadler, R.A.; Chien, J.Y. Consideration of the errors inherent in mapping historical glacier positions in Austria from the ground and space (1893–2001). Remote Sens. Environ. 2003, 86, 566–577. [Google Scholar] [CrossRef]
  42. Chen, J.; Ohmura, A. Estimation of Alpine glacier water resources and their change since the 1870s. IAHS Publ. 1990, 193, 127–135. [Google Scholar]
  43. Macheret, Y.; Cherkasov, P.; Bobrova, L. Tolschina i ob’em lednikov Djungarskogo Alatau po danniy aeroradiozondirovaniya. Mater. Glyatsiologicheskikh Issled. Khronika Obs. 1988, 62, 59–71. [Google Scholar]
  44. Radić, V.; Hock, R. Regional and global volumes of glaciers derived from statistical upscaling of glacier inventory data. J. Geophys. Res. Earth Surf. 2010, 115, F01010. [Google Scholar] [CrossRef]
  45. Shiyin, L.; Wenxin, S.; Yongping, S.; Gang, L. Glacier changes since the Little Ice Age maximum in the western Qilian Shan, northwest China, and consequences of glacier runoff for water supply. J. Glaciol. 2003, 49, 117–124. [Google Scholar] [CrossRef] [Green Version]
  46. Grinsted, A. An estimate of global glacier volume. Cryosphere 2013, 7, 141. [Google Scholar] [CrossRef] [Green Version]
  47. Huai, B.; Li, Z.; Sun, M.; Zhou, P. Glaciers change in the Tailan River watershed in the last 40 years. Sci. Geogr. Sin. 2014, 34, 229–236. [Google Scholar]
  48. Wang, Y.; Hou, S.; Lu, A.; LIU, Y.-p. Response of glacier variations in the eastern Tianshan Mountains to climate change, during the last 40 years. Arid Land Geogr. 2008, 31, 813–821. [Google Scholar]
  49. Li, B.; Zhu, A.-X.; Zhang, Y.; Pei, T.; Qin, C.; Zhou, C. Glacier change over the past four decades in the middle Chinese Tien Shan. J. Glaciol. 2006, 52, 425–432. [Google Scholar] [CrossRef] [Green Version]
  50. Wang, L.; Li, Z.; Wang, F.; Li, H.; Wang, P. Glacier changes from 1964 to 2004 in the Jinghe River basin, Tien Shan. Cold Reg. Sci. Technol. 2014, 102, 78–83. [Google Scholar] [CrossRef]
  51. Chen, J.; Liu, C.; Jin, M. Application of the repeated aerial photogrammetry to monitoring glacier variation in the drainage area of the Urumqi River. J. Glaciolgy Geocryol. 1996, 18, 331–336. [Google Scholar]
  52. Gao, W.; Li, Z.; Li, K.; Zhang, M.-j. Glacier variation in the Kukesu River Basin during 1963–2004 based on remote sensing data and GIS techniques. Arid Land Geogr. 2011, 34, 252–261. [Google Scholar]
  53. Xu, C.; Wang, F.; Li, Z.; Wang, L.; Wang, P. Glacier variation in the Manas River Basin during the period from 1972 to 2013. Arid Zone Res. 2016, 33, 628–635. [Google Scholar]
  54. He, Y.; Yang, T.-b.; Du, J.; TIAN, H.-z. Glacier variation of past 22 years in Alatau Mountains of Central Asia based on GIS and RS. Res. Soil Water Conserv. 2013, 20, 130–134. [Google Scholar]
  55. Shi, Y.S.; Shen, Y.P.; Li, D.L.; Zhang, G.W.; Ding, Y.J.; Hu, R.J.; Kang, E.S. Discussion on the present climate change from warm-dry to warm-wet in northwest China. Quaternay Sci. 2003, 23, 152–164. [Google Scholar]
  56. Oerlemans, J. Extracting a Climate Signal from 169 Glacier Records. Science 2005, 308, 675. [Google Scholar] [CrossRef] [PubMed] [Green Version]
Figure 1. Study area with the Ebi Lake basin (5Y74) and related river and lake basins, where Kuitun River, Sikeshu River, Jinghe River, Daheyanzi River, Sayram Lake, and Bortala River sub-basins are annotated with their CGI codes of 5Y741, 5Y742, 5Y743, 5Y744, 5Y746, and 5Y746, respectively.
Remotesensing 13 00497 g001
Figure 2. The glacial areas (a) and numbers of glaciers (b) in each sub-basin categorized into <0.5, 0.5–1.0, 1.0–5.0, 5.0–10.0, and >10.0 km2, respectively, as of 2019. KT, SK, JH, DH, BT, and SY denote the Kuitun (5Y741), Sikeshu (5Y742), Jinghe (5Y743), Daheyanzi (5Y744), Bortala (5Y746) Rivers, and the Sayram Lake (5Y745) sub-basin, respectively. The percent shares of the glaciers in area and number are shown in the respective pie charts.
Remotesensing 13 00497 g002
Figure 3. (a) The distribution of glacier areas in elevation, and (b) that of glacier areas and numbers in orientation in the Ebi Lake basin investigated in 2019.
Remotesensing 13 00497 g003
Figure 4. The area changing rates of the glaciers in the Ebi Lake basin during 1964–2009, 2009–2019, and 1964–2019, respectively.
Remotesensing 13 00497 g004
Figure 5. The land cover images with two typical ice bodies of the Ebi Lake Basin, defined by (a) the second CGI and (b) 2019 investigations (retrieved from the Sentinel-2 satellite with the Google Earth Engine in 2019), where the greenish colors indicate the ice.
Remotesensing 13 00497 g005
Figure 6. Area changes of glaciers at drainage scale in the Ebinur Lake Basin.
Remotesensing 13 00497 g006
Figure 7. The interannual variations (a,c) and winter–summer anomalies (b,d) of temperature and precipitation in the Ebi Lake basin.
Remotesensing 13 00497 g007
Table 1. The locations of the five meteorological stations in the Ebi Lake Basin.
Code by CMDSNameLatitude (N)Longitude (E)Elevation (m)
51232Alashankou45°11′82°35′284.8
51238Bole44°54′82°04′531.9
51330Wenquan44°58′81°01′1354.6
51334Jinghe44°37′82°54′320.1
51346Wusu44°26′84°40′478.8
Table 2. Glaciers in area and number in the six drainage sub-basins as per three inventories.
Drainage Basin1st CGI (by 1964)2nd CGI (by 2009)This Work (in 2019)
NameCodeArea (km2)NumberArea (km2)NumberArea (km2)Number
Kuitun River5Y741201.12309147.67281133.11285
Sikeshu River5Y742336.25364259.66342249.54337
Jinghe River5Y74396.2012974.8111869.70118
Daheyanzi River5Y7444.17340.3870.155
Sayram Lake5Y7454.28132.1792.259
Bortala River5Y746181.04255113.75243105.02234
Ebi Lake5Y74823.061104598.441000559.77988
Note: The red underlined number indicates the increasing count.
Table 3. The glacier volumes in the Ebi Lake Basin estimated with different empirical approaches.
MethodIce Volume of Glaciers (km3)Glacier Volume Change (2019s—FCGI)Source
FCGISCGI2019s
A = 823.06 km2A = 598.44 km2A = 559.77 km2km3km3 a−1% a−1
V = 0.0285 * A1.357257.68167.21152.72−104.96−1.91−0.74[42]
V = 0.0298 * A1.379312.32201.25183.54−128.78−2.34−0.75[43]
V = 0.0365 * A1.375372.40240.29219.18−153.22−2.79−0.75[44]
V = 0.037 * A1.314250.66164.89151.04−99.62−1.81−0.72[38]
V = 0.04 * A1.35345.06224.41205.06−140.00−2.55−0.74[45]
V = 0.0433 * A1.29249.69165.52151.85−97.84−1.78−0.71[46]
Average297.97193.93177.23−120.74−2.20−0.74This work
Table 4. Comparison of the area change of the glaciers in the greater Tianshan range.
Study AreaStudy PeriodArea Change (km2)Rate of Change in AreaDataSource
Tianshan1960–2010−0.22% a−1 (−11.50%)[24]
Tailan River Basin1972–2011−50.06−0.22% a−1 (−11.50%)Topographic map, ETM+[47]
Gaizi River Basin1960–1999−188.1−0.26% a−1 (−10.00%)Topographic map, TM, ETM+[21]
Harlik mountains1959–2001−13.4−0.27% a−1 (−11.40%)Topographic map, TM, ETM+[48]
Kaidu River Basin1963–2000−38.5−0.31% a−1 (−11.60%)Topographic map, TM, ETM+[21]
Middle Tianshan Mountains1963–2000−7−0.35% a−1 (−13.00%)MSS, SPOT, ETM+[49]
Jinghe River Basin1964–2004−13.9−0.38% a−1 (−15.20%)Topographic map, ASTER[50]
Urumqi River Basin1962–1992−6.65−0.45% a−1 (−13.80%)Topographic map, Aerial photograph[51]
Kukesu River Basin1963–2004−50.06−0.46% a−1 (−18.99%)Topographic map, ASTER[52]
Bogda peak area1972–2005−31.2−0.49% a−1 (−21.60%)Topographic map, ASTER, SPOT[26]
Manas River Basin1972–2013−159.02−0.60% a−1 (−24.61%)TM, ETM+[53]
Alatau Mountains1990–2011−137.77−0.92% a−1 (−20.24%)TM, ETM+[54]
Ebinur Lake Basin1964–2019−263.29−0.58% a−1 (−31.90%)Topographic map, Sentinel2 MSIThis study
Publisher’s Note: MDPI stays neutral with regard to jurisdictional claims in published maps and institutional affiliations.

