Article

Polish Cadastre Modernization with Remotely Extracted Buildings from High-Resolution Aerial Orthoimagery and Airborne LiDAR

Institute of Geospatial Engineering and Geodesy, Faculty of Civil Engineering and Geodesy, Military University of Technology, 00-908 Warsaw, Poland
*
Author to whom correspondence should be addressed.
Remote Sens. 2021, 13(4), 611; https://doi.org/10.3390/rs13040611
Submission received: 24 January 2021 / Revised: 5 February 2021 / Accepted: 6 February 2021 / Published: 8 February 2021
(This article belongs to the Special Issue Remote Sensing for Land Administration 2.0)

Abstract

:
Automatic building extraction from remote sensing data is a hot but challenging research topic for cadastre verification, modernization and updating. Deep learning algorithms are perceived as more promising in overcoming the difficulties of extracting semantic features from complex scenes and large differences in buildings’ appearance. This paper explores the modified fully convolutional network U-Shape Network (U-Net) for high resolution aerial orthoimagery segmentation and dense LiDAR data to extract building outlines automatically. The three-step end-to-end computational procedure allows for automated building extraction with an 89.5% overall accuracy and an 80.7% completeness, which made it very promising for cadastre modernization in Poland. The applied algorithms work well both in densely and poorly built-up areas, typical for peripheral areas of cities, where uncontrolled development had recently been observed. Discussing the possibilities and limitations, the authors also provide some important information that could help local authorities decide on the use of remote sensing data in land administration.

Graphical Abstract

1. Introduction

Modern cadastral systems, being the part of land administration systems, constitute an indisputable tool for sustainable land management [1]. Over the past several decades, the cadastre, both as a concept and system, has significantly developed and changed its role from a simple land register to a technologically advanced multidimensional and multifunctional system, supporting effective and sustainable land management [2]. Moreover, the continuous evolution of land administration systems, as well as the cadastre as part of them, results from the increasing human pressure on the environment [3,4]. Particularly, changes are driven by and heavily dependent on processes such as economic and political reform, urbanization, agricultural intensification and deforestation, and on the other hand, concern for nature protection, human well-being and sustainable development [1,2,3,4].
For three decades, care for the environment has been one of the key global trends in land use and management. This has led to the emergence of many global initiatives related to environmental protection and care for the present and future human well-being in friendly natural and socio-economic environments. The most important of them are Agenda 21 [5] and Agenda 2030 [6], which aim to define care for the environment and sustainable development to a large extent and at an earlier stage of planning. Monitoring towards the 2030 Agenda Sustainable Development Goals (SDGs) involves the availability of high-quality, timely and disaggregated data, which are of great importance for evidence-based decision making and for ensuring accountability for the implementation of the 2030 Agenda. Many concerns about the state of the environment reflected in the SDGs are related to unprecedented urban growth. Urbanization, as a complex and continuous process worldwide, has been going on for hundreds of years, although it has significantly accelerated in the last few decades. As stated by UN Secretary General [7] “from 2000 to 2015, in all regions of the world, the expansion of urban land outpaced the growth of urban populations”. This results in uncontrolled urban growth and a decrease in city density. Remote sensing data are undoubtedly one of the most important data sources for monitoring urban sprawl and updating data in cadastral systems, as they provide not only information on the geographic location but also some characteristics of buildings and associated artificial infrastructure [8,9]. Since the 1990s, the implementation of remote sensing for land management and cadastre updating has evolved significantly due to technological advances, particularly, high-resolution and multispectral images, advances in aerial imaging technologies, image processing algorithms as well as internet and mobile technologies [9,10,11].
In Poland, the register of buildings along with the land and mortgage registers is a coherent part of the cadastre, which is ultimately to be kept in accordance with the assumptions of the INSPIRE (INfrastructure for SPatial InfoRmation in Europe) Directive [12] and Land Administration Domain Model [13]. These registers, being public registers, form part of the Polish land administration system and provide support to local authorities in their decision-making [12]. A significant incentive to the commencement of the Polish cadastre modernization, resulting in its transition from analogue to electronic form, was initiated in 2004 with Poland’s accession to the European Union [12]. Since that year, intensified works of the Head Office of Geodesy and Cartography, aimed at modernizing the existing cadastral system, have been observed [13,14,15]. The amendment to the Geodetic and Cartographic Law of 2010 and the Ministry Regulation on the land and building register (denoted as EGiB) [16] introduce comprehensive administrative procedures for updating, verifying and modernizing the cadastre to ensure data accuracy and reliability. The necessity to adapt the Polish cadastre to European requirements (including the INSPIRE directive and the Land and Parcel Identification System (LPIS)) was the driving force for launching the two nationwide projects aimed at converting analogue parcel boundaries and building outlines to digital form, namely the Integrated System of Real Estate Information [14] and the Polish LPIS [17].
In a few years, the modernized cadastre covered almost the entire country’s territory. As documented by the Head Office of Geodesy and Cartography at the end of 2017, building outlines were still recorded in an analogue (paper) form in 3% of urban and 14% rural areas, and respectively 1% and 6% in the raster (scanned analogue map) supplemented by buildings’ centroids [18]. Moreover, § 63.1. of the latest update of the land and buildings register regulation [19] allowed for the registration of building outlines in the form of a point representing the building center. The regulation also requires cadastral authorities to periodically verify the land and building register (§ 44), as well as to eliminate existing inconsistencies by updating or modernizing cadastral data. It should be noted, however, that the modernization of the cadastre has been defined by law [19] as a set of technical, organizational and administrative activities undertaken to adapt the existing cadastral data to the requirements of a modern, up-to-date and fit-for-purpose IT system. Hence, the motivation of this study is a thorough analysis of the possibilities and limitations of verification and modernization of the Polish cadastre by remotely extracted buildings from high-resolution aerial orthoimages and LiDAR data. We proposed a three-stage end-to-end methodology of building rooftop outlines extraction. An inseparable part of the method constituted the geo-processing of vectors of buildings’ rooftop surfaces, derived from deep learning orthoimage segmentation and LiDAR data processing. Therefore, the research makes both a scientific and a practical contribution. The main goal of this study is to automate the extraction of building rooftop outlines based on the deep learning algorithm enriched with the LiDAR segmentation and geoprocessing to map the rooftop outline of buildings. The deep learning algorithm is based on a modified U-Shape Network (U-Net) so it provides precise buildings segmentation with a relatively small number of training images. In the proposed U-Net architecture, the size of the feature map was empirically set-up as 416 × 416 × 1. The analysis is supported by publicly available data (orthoimagery and LiDAR densely classified data (DSM)) from the official geoportal of the Head Office of Geodesy and Cartography, the National Mapping Agency in Poland.
The remainder of the paper is structured as follows. Section 2 gives an overview of building extraction algorithms based on high-resolution images and LiDAR data. Study area, materials and methods descriptions are presented in Section 3. Section 4 provides a concise description of the experimental results, while a discussion with the results, and hitherto achievements in the field are given in Section 5. The paper ends with the concluding remarks, Section 6.

2. Deep Learning-Based Building Extraction-Related Works

Automatic building extraction from remotely sensed data has been a major research topic for decades due to the importance of building data in many areas of economy and science, inter alia land administration, topographic mapping, urban planning and sustainable development, natural hazards risk management and mitigation or humanitarian aid [20,21,22,23,24]. Moreover, building extraction algorithms enable cost- and time-effective approaches to 3D data acquisition, maintenance and analysis [25]. At the beginning of the 21st century, Baltsavias [26] observed some tendencies in the development of image analysis methods for building extraction. These included the increasing use of holistic and rule-based approaches to the problem, such as semantic and Bayesian networks or artificial neural networks (ANN) and fuzzy logic. Furthermore, increased use of a priori knowledge (e.g., from vector data) and multi-image and multi-sensor 3D methods have become standard in both image processing and object modelling. However, in those days, as stated by Baltsavias [26], “reliability and completeness of automated results together with their automatic evaluation remain the major problems”. The issue of reliability and accuracy of building models has improved significantly in recent years through multi-sensor fusion-based building detection methods [23,27,28,29,30] and the possibility of applying deep learning techniques. Ma et al. [31] provided a meta-analysis of deep learning methods in remote sensing applications and highlighted the pioneering achievement of Zhuo et al. [32] on increasing the OpenStreetMap (OSM) buildings’ location accuracy derived from deep learning-based semantic segmentation of oblique Unmanned Aerial Vehicle (UAV) images.
Convolutional neural networks (CNNs), being a typical deep learning method, are widely used in building extraction, especially for object detection and image semantic segmentation [24,33,34]. Wang et al., [21] found that the drawback of building extraction algorithms, due to the lack of global contextual information and careless up-sampling methods, may be overcome by a U-shaped network and an adjusted non-local block called the Asymmetric Pyramid Nonlocal Block (APNB). The test provided by authors [21] showed that the accuracy of the established Efficient Non-local Residual U-shape Network (ENRU-Net) gives a remarkable improvement against commonly used semantic segmentation models (e.g., U-Net, FCN-8s, SegNet, or Deeplab v3). Shao et al., [34] have introduced a new, two-module deep learning network named BRRNet for complete and accurate building extraction from high-resolution images. The prediction module, based on encoder–decoder structure, is aimed at building extraction, while the residual refinement module improved the accuracy of building extraction. The experiment of Shao et al. [34] in Massachusetts showed superiority over other state-of-the-art methods (e.g., USPP, EU-Net and MC-FCN) [35] in terms of building integrity (wholeness) and building footprint accuracy. USPP introduced by Liu Y. et al. [35] denotes a U-shaped encoder-decoder structure with spatial pyramid pooling. It contains four encoder blocks, one spatial pyramid pooling module and four decoder blocks. In the encoder phase, the VGG-11 architecture is used as the backbone. EU-Net is an effective fully convolutional network (FCN)-based neural network consisting of three parts: encoder, dense spatial pyramid pooling (DSPP) bloc and decoder. The network, developed by Kang et al. [36], is designated toward building extraction from aerial remote sensing images. MC-FCN (multi-constraint fully convolutional networks) consist of a bottom-up/top-down fully convolutional architecture and multi-constraints that are computed between the binary cross-entropy of prediction and the corresponding ground truth [37].
Since the ascension of deep learning methods, especially convolutional neural networks, the trend towards applying them to improve building extraction models is clearly observable [24,38,39]. Furthermore, the widespread availability of open remote sensing images, including high-resolution images, and aerial laser scanning data, have significantly contributed to the recent boost in automated building extraction algorithms. Bittner et al. [38] presented a method to fuse depth and spectral information based on a fully convolutional network (FCN) that can efficiently exploit mixed datasets of remote sensing imagery to extract building rooftops. The authors [38], however, pointed out that the FCN requirement for multiple training samples was a downside to this method and increased data processing costs and time. Maltezos et al. [24] introduced an efficient CNN-based deep learning model to extract buildings from orthoimages supported by height information obtained from point clouds from dense image matching. Results from Germany (the city of Vaihingen) and Greece (seaside resort of Perissa) showed promising potential in terms of robustness, flexibility and performance for automatic building detection. Huang et al. [33] noticed that “the commonly used feature fusion or skip-connection refine modules of FCNs often overlook the problem of feature selection and could reduce the learning efficiency of the networks”. This contributed to the development of a fully convolutional neural network, namely the end-to-end trainable gated residual refinement network (GRRNet) that fused high-resolution aerial images and LiDAR point clouds for building extraction. The test conducted in four US cities demonstrated that the GRRNet has competitive building extraction performance in comparison with other approaches, with an overall accuracy of 96.20% and a mean IoU (Intersection over Union) score of 88.05% among all methods that have the encoder–decoder network architectures. Moreover, the source code of the GRRNet was made publicly available for researchers (see references) [33]. The literature analysis presented above shows many types of FCN architecture modification as well as the possibility of using various scenarios and data augmentation during network training, which in turn leads to improved accuracy and reliability of building extraction from remotely sensed data.
Developing effective methods for automatic building detection based on multisource data remains a challenge due to many factors related to the remotely sensed data (point cloud sparsity or image spatial and spectral variability) as well as the complexity of urban objects or data misalignment [40,41]. To overcome these challenges, Nguyen et al. [40] introduced the Super-Resolution-based Snake Model (SRSM) that operates on high-resolution LiDAR data that involved a balloon force model to extract buildings. The SRSM model is insensitive to image noise and details, as well as simplifying the snake model parameterization, and could be applied on a large scale. Gilani et al. [41] noticed that often, small, shaded, or partially occluded buildings are misclassified. Therefore, based on point clouds and orthoimagery, the building delineation algorithm identified the building regions and segmented them into grids. The problem of nearby trees classified as buildings was solved by synthesizing the point cloud and image data. As reported by the authors, [41] “the correctness of above 95%, demonstrating the robustness of the approach”.
Recently, CNNs were integrated with regularized and structured building outline delineations. Girard et al. [42] introduced a deep learning method predicting vertices of polygons that outline the objects of interest. Zhao et al. [43] proposed the R-CNN Mask followed by regularization algorithm to create polygons from the building segmentation results. Girard et al. [44] employed a deep image segmentation model with a frame-field output which ultimately improved building extraction quality and provided structural information, facilitating more accurate polygonization. Among deep learning frameworks, PolyMapper deserves special attention, as it directly predicts a polygon representation describing geometric objects using a vector data structure [45,46]. The PolyMapper approach introduced by Li et al. [45]) performs building detection, instance segmentation and vectorization within a unified approach based on modern CNNs architectures and RNNs with convolutional long-short term memory modules. Zhao et al. [46], however, employed EffcientNet built on top of PolyMapper supported by a boundary refinement block (BRB) to “strengthen the boundary feature learning” and finally to improve the accuracy of the building’s corner prediction. The CNNs shown above, integrated with the regularized and structured building outlines, demonstrate end-to-end approaches capable of delineating building boundaries to be close to reference data structure.
A vital part of image classification and segmentation is accuracy assessment [47]. Literature provides a wide range of metrics to assess the accuracy of buildings extraction from remotely sensed data. The most common are precision, completeness, overall accuracy, F1 score, Jaccard similarity and kappa indexes [37,48]. Some of them are pixel-based and others object-based; however, a few can be used in both pixel-based and object-based evaluation [20,24,40,41,43]. Moreover, RMSE and normalized median absolute deviation (NMAD) are frequently used to measure the positional accuracy [37,42,43]. Aung et al. [20] documented that pixel-based evaluation is more objective as it is based on the status of each pixel; however, the object-based quality assessment is a good measure when object shape and texture are concerned. A similar opinion was shared by [42], who also noted that the pixel-based assessment to compare polygons often requires vector data rasterization, which influences the accuracy assessment. Hence, some authors, e.g., [40,41], used both per-object and pixel-based accuracy measures.
Considering the limitations of existing methods to assess the accuracy of building extraction, the authors of [42] developed a new metric for comparison of polygons and line segments, named PoLiS. PoLiS can be used to assess the quality of extracted building footprints, provided that reference data is available. The metric considers the shortest distance from a corner of one building’s boundary to any point on the other boundary, which constitutes simplicity in implementing. However, as found by Dey et al. [48], the PoLiS metric is significantly influenced by corresponding corners selection, especially for complex-shaped buildings, when the number of extracted corners differs substantially from reference data. Evaluation of buildings extracted from LiDAR data is even more complicated, as found by Dey et al. [48], due to a meandrous (zigzag) pattern without many details, hardly comparable with reference building outlines. The authors Dey et al. [48] overcame this problem by introducing a new, robust corner correspondence (RCC) metric that allowed to assess the extra- and under-lap areas of extracted and reference buildings. The RCC metric constitutes a combined measure of the positional accuracy and shape similarity and allows for a more realistic assessment of the extracted building boundaries from LiDAR data [48].

3. Study Area, Materials and Methods

3.1. Study Area

The experiment was carried out in Kobiałka, a peripheral part of the Polish capital, Warsaw (see Figure 1). Kobiałka is a housing estate in northern Warsaw, a typical residential area, dominated by detached buildings and green infrastructure. The area was selected for several reasons. Firstly, the Warsaw Municipality has been ordering high-resolution aerial orthophotos mainly for the development of the cadastre and the real estate market. Secondly, from the end of the 20th century, Kobiałka was characterized by unstoppable and in many cases uncontrolled growth of buildings due to many undeveloped areas with favorable housing conditions, e.g., proximity to a forest, good communication with the city center [49]. Thirdly, the reorganization of the cadastral department of the Warsaw municipality, which has been going on for several years, and the change of some important national regulations, including the geodetic and cartographic law and the construction law, have delayed the cadastre modernization, particularly the building register.
In particular, the study area covered approx. 800 ha, in the east from 21°02′52″.2 to 21°03′44″.7, and in the north from 52°03′44″.7 to 52°21′55″.6 (Figure 1, the red rectangle).

3.2. Data Used

Orthorectified RGB aerial images with a 0.1 m GSD (hereinafter referred to orthoimages), taken with the Leica DMC III camera during a photogrammetric campaign carried out in 2019 on 18 April (Figure 1), were used for buildings segmentation. iIDAR dense classified point clouds (12 points per 1 m2) stored in LAS binary format were employed for building vectors extraction. Buildings data from the Warsaw cadastre was used for training and final evaluation of building extraction. The data comprised the building geographical location, number of storeys, source of geometry and building type (e.g., residential, outbuilding, office).
All data were downloaded from the official, publicly available geoportal of the Head Office of Geodesy and Cartography, the National Mapping Agency [33] https://mapy.geoportal.gov.pl/imap/Imgp_2.html. Data processing deploying deep learning methods was performed in the ENVI software, developed by Harris Geospatial Solutions, Inc., while geo-processing and final evaluation of remotely extracted building were done with ArcGIS software, provided by ESRI.

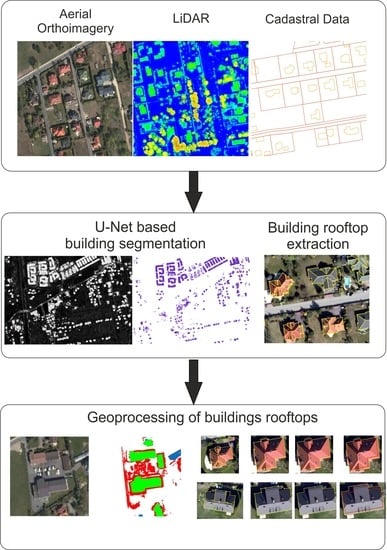
3.3. Workflow and Applied

The adopted methodology for automated building outlines extraction consisted of the three main stages and their subsequent processes. They are as follows: (1) building outlines extraction by the U-Net fully convolutional network from aerial orthoimages; (2) building vectors of rooftop surfaces, denoted as building roof outlines, extraction based on LiDAR data and (3) geoprocessing of building roof outlines and final evaluation of building outlines (see Figure 2).
The main assumption underlying this three-step methodology was as follows. FCN deep-learning algorithms for building extraction from remote sensing images, while universal in their nature, derive rough planar geometry of building outlines, which could not meet the requirements of the cadastral system in Poland. In a second step, the LiDAR densely classified data (DSM) improved the extraction of building outlines by creating vectors of the rooftop surface. Finally, the geo-processing stage transformed the roof vectors into geometrically corrected building outlines and assessed the accuracy of the buildings’ locations.

3.3.1. Building Extraction by U-Net

In remote sensing applications, convolutional networks are generally used for image classification, where the output to an image is a single class label. In this paper, we used U-Net architecture developed by Ronneberger et al. [50] and implemented in ENVI software as the ENVINet5 [51]. This U-Net architecture was modified and extended in such a way that it provides precise image segmentation with a small number of training images. ENVINet5 consists of the repeated applications of two paths, a contracting one and an expansive one. The contracting path involves the repeated application of two 3 × 3 convolutions, followed by a rectified linear unit (ReLU) and a 2 × 2 max pooling operation with stride 2 for down-sampling. The expansive path, in turn, comprises the upsampling of the feature map followed by a 2 × 2 up-convolution which reduces by half the number of feature channels, as well as a concatenation with a cropped feature map from the contracting path and a two 3 × 3 convolution followed by ReLU. Based on Ronneberger et al. [50], cropping is essential because of the loss of border pixels in every convolution. The adopted for this study ENVINet5 (see Figure 3) is characterised by 23 convolutional layers and a TensorFlow model added on the top of the network. The initialization model and the trained model in ENVI use data in HDF5 (.h5) format.
The model was trained based on building vector layers, derived from the cadastre, and 421 regions of interests (ROIs). The patch size for the training model was determined empirically based on the coincidence with label rasters (number of edge-length pixels). For our experiment, the patch size was 416 × 416 pixels. The following training parameters: number of epochs: 25; number of patches per image: 300; solid distance: 10.0; blur distance: 0. The class weight is used to highlight feature pixels at the start of training, class weights: min 1, max 2; and loss weight: 0.5.
The implemented U-net architecture loss function architecture was binary cross-entropy with the weighted map [50]:
E = x Ω ω x l o g p l ( x ) x
where p l x x is the softmax loss function l :   Ω 1 , , K as the true label of each pixel and ω : Ω is a weight map, in order to give a higher weight to a pixel near t to the boundary point in the image. The optimizer used in this experiment was the Stochastic Gradient Descent (SGD) with lr = 0.01 and momentum = 0.99.
Five commonly known evaluation matrices were employed to assess the performance of the building outline extraction model: namely, overall accuracy, precision (correctness), recall (completeness), F1 score for pixel-based quality assessment and mean intersect over union (IoU) for per-object evaluation. The Overall Accuracy (OA) was calculated by summing the percentages of pixels that were correctly classified by the model compared to the reference labelled image (Equation (2)) [52].
O A = i = 0 k p i i i = 0 k j = 0 k p i j
where pii means the number of pixels for categories i correctly classified by the model, while pij means the number of pixels for categories i incorrectly classified into category j by the model and k is the category of building.
Precision is the fraction of true positive examples among the examples that the model classified as positive: in other words, the number of true positives divided by the number of false positives plus true positives (Equation (3)), as defined by [53,54]:
recision = True   Positives True   Positives + False   Positives
Recall, also known as sensitivity, is the fraction of examples classified as positive, among the total number of positive examples: in other words, the number of true positives divided by the number of true positives plus false negatives (Equation (4)):
Recall = True   Positives True   Positives + False   Negatives
The F1 (Equation (5)) measures the fraction of the number of true target-pixels identified in the detected target-pixels. The F1 score is the harmonic mean of the precision and recall, ranging from 0 to 1; the larger the F1, the better the prediction (Equation (5)):
F 1 = 2 Precision Recall Precision + Recall
The Intersect over union (IoU) metric, also known as the Jaccard similarity index, is denoted as an overlap rate of detected buildings and labelled as buildings, as it is presented in Equation (6):
IoU = target detected target detected

3.3.2. Building Rooftop Extraction Using LiDAR Data

Algorithms that operate on dense LiDAR data (12 points per square meter) not only detect buildings and their approximate surface outlines but also extract flat roof surfaces, ultimately leading to the creation of building models that correctly resemble the roof structures [55]. In this study, ENVI LIDAR tools were used for building extraction and delineation of planar rooftop surfaces. The algorithm used identifies the correct position, aspect and slope of each roof plane in the work area, extracting consistent and geometrically correct 3D building models [56]. Buildings, trees and other objects (e.g., cars) were separated based on geometric criteria, such as size, height and shape characteristics. Overall, ENVI LiDAR procedures filter the data and classify each point of the cloud in a few steps (see Figure 2). Building rooftop patches were extracted, after extensive tests, by applying a threshold to the following parameter: minimum building area, Near Ground Filter Width, Buildings Points Range and Plane Surface Tolerance (PST). The values of these parameters were adopted after the analysis of the height and intensity map (Figure 4).
The minimum building area was set-up as 10 m2. The Near Ground Filter Width of 5 m allowed one to classify as buildings only features located 5 m above the ground. The Buildings Points Range denotes spatial variation of a building’s points and is used for a planar scan when the point density is not constant inside the analyzed area or when there are some holes in the point cloud dataset. The value of this parameter was set to 1.5 m. The Plane Surface Tolerance (PST) [51,55] recognizes curved roofs based on a series of successive planes. The algorithm used defines a new roof plane when the distance between the analyzed and previous points in the cloud reaches the declared value. Due to the importance of this parameter for distinguishing the building rooftop outlines, the classification was preceded by an analysis of the selection of the optimal value of the PST parameter. The test was performed for PSTs of 0.15 m, 0.30 and 0.5 m. As shown in Figure 5a, a low PST (i.e., 0.15 m) resulted in the incorrect classification of small construction facilities, like bowers or garden sheds. The best results were achieved for a PST value equal to 0.5 m (Figure 5b). Finally, the completeness of 95% was achieved in comparison with building cadastral data.

3.3.3. Geoprocessing of Building Roof Outlines and Final Evaluation of Building Extraction

The results of automatic building extraction based on very high-resolution orthoimagery and LiDAR data provide the polygons for building roof outlines and planar shapes of building rooftop vectors. As mentioned in the literature [57,58], building footprints and outlines of rooftop shapes differ both in shape and location. These differences, albeit slight, make it necessary to correct the geometric building outlines in order to locate the building accurately. The geometrical adjustment employed primary determination of the neighborhood relations of rooftop patches contained by a building’s outline (derived from orthoimage segmentation) and creation of a draft polygon vector layer of building outlines. For this purpose, the spatial join and dissolve functions were used. Then, the draft building rooftop outlines were simplified by identifying and removing redundant vertices, according to the Douglas–Peucker algorithm [59]. As a result, the vertices of the building outlines were reduced, and the building outline itself was simplified in accordance with the state-of-the-art of cartographic generalization [60]. The next task was to extract the edge points of buildings from the reference layer (cadastral building data), calculate the distance to the extracted building outlines and finally, assess the accuracy of remote extraction of building outlines. The following measures were used for the final accuracy assessment: the mean, standard deviation, relative standard deviation (RSD), variance-to-mean ratio (VMR). The measures were employed for the distance between the extracted buildings and buildings from cadaster, and also the differences in shape and area of the buildings.

4. Results

4.1. Buildings Segmentation

The adopted training parameters of U-Net (namely patch size: 416; number of epochs: 25; number of patches per image: 300; solid distance: 10.0; blur distance: 0; class weights: min 1, max 2; and loss weight: 0.5) resulted in a well-suited model for building extraction. As shown in Figure 6, the training validation accuracy has increased while the validation loss has decreased. Both the validation accuracy and validation loss trends indicate that the algorithm used was well optimized and can be applied for image segmentation.
Figure 7 depicts the results of consecutive processes of building extraction based on deep-learning U-Net from very high-resolution aerial imagery.
The overall accuracy is 89.5%, indicating that the U-Net model used was well suited to extracting buildings. The precision informed us that all features that were labelled as buildings in 76.5% of instances were actually buildings. Recall indicated that 80.7% of all buildings in the analyzed area were detected. For all accuracy measures, see Table 1, while Figure 7 shows some examples of correct and incorrect building extraction.
Factors which influenced the accuracy of automated building extraction in general are as follows:
  • variation in the spatial pattern of buildings and their surroundings, i.e., trees, paved roads, driveways, vehicles, porches, small garden houses or play-grounds;
  • multiple colors of roofs, i.e., reddish, grayish, whitish and greenish, as well as roof installations such as satellite TV antennas, solar panels, dormers;
  • building types, e.g., single-family detached or attached, semi-detached, multi-family buildings.
Figure 8a portrayals a group of multi-family houses. The building’s roofs were dark grey, clearly separated from the light grayish color of the interior roads and the greenish-brown grassy surroundings as well as a few whitish cars. However, the close location of the buildings inside the estate, in rows of three, led to their extraction as one elongated building. Figure 8b shows single-family attached buildings, characterized by hipped reddish and grayish roofs, partly shadowed by trees. The ENVINet5 algorithm correctly extracted all buildings; nevertheless, the touching buildings, i.e., buildings with adjacent roofs and walls, were identified as one feature. The next example (Figure 8c) demonstrates correctly extracted single-family buildings, despite some disturbance caused by vegetation and other objects located on the land parcel. The algorithm, however, had a problem with the correct building extraction in an area characterized by a less dynamic color scheme (dark greyish) between the roofs and the parking lot and nearby streets. It was indicated as false positive, over-classified (indicated in red—Figure 8d). Another error that was observed in this area was the identification of cars as buildings.

4.2. Building Rooftop Patches Extraction

Kobiałka, as a residential district on the outskirts of Warsaw, is characterized by a diverse building architecture, which affected the building extraction. Particularly, multi-slope roofs, the presence of dormers and the accompanying vegetation partially covering the roof edges (trees and tall shrubs) hindered the extraction algorithm (as it is seen in Figure 9) and required further geoprocessing, described in the Section 4.3.

4.3. Geoprocessing of Building Rooftop Outlines

The geoprocessing of building rooftop patches was intended to provide geometrically corrected building outlines. Figure 10 shows some examples of the geoprocessing results. Building rooftop outline extracted during segmentation with the deep-learning algorithm were used to spatially match these roof patches that pointed to one building (Figure 10a) and outlines of rooftops were created (Figure 10b). These roof outlines consisted of many vertex points, which led to a distortion of the shapes of the buildings. Therefore, generalization and simplification were of utmost importance (Figure 10c). The geometrically corrected building roof outlines still did not match the building footprints stored in cadastral data, as it is seen in Figure 10d. This was due to the fact that in our approach, based on remotely sensed data, the outline of the building was considered as a building’s roof footprint, while in the cadastre it is represented by the walls of the building, the outline on the ground.
The statistical analysis of the roof overhead showed an average shift of 1.18 m (with STD equal to 0.688) between the building outlines and the cadastral data. The dispersion index (VMR) of the shift value (near distance) amounted to 0.4, indicating a binomial distribution (under dispersion) (Figure 11a). Less than 5.6% of the edge points of the building outlines (190 out of 3406) were perceived as outliers because the near distances between corresponding edges in the compared datasets were greater than 2.44 m (see Figure 11b).
For the remaining 234 buildings, the mean difference between the cadastral area and the area calculated from the LiDAR outline was 57.37 m2, and the standard deviation was 2.59 m2. The highest values in the differences in building area were observed for attached single-family houses, which were distinguished as one building during LiDAR data processing (as shown in Figure 12b).
The Shape index (SHI) indicates the similarity between cadastral building outlines and LiDAR outline shapes irrespective of their areas. Statistical measures of dispersion (RSD and VMR) showed a weakly dispersed binomial distribution, assuming RSD 9.45% and 14.59% and VMR 0.01 and 0.02 for the outlines of cadastral and LiDAR buildings, respectively. Statistical measures of dispersion (RSD and VMR) showed a weakly dispersed binomial distribution, assuming RSD 9.45% and 14.59% and VMR 0.01 and 0.02 for the outlines of cadastral and LiDAR buildings, respectively.

5. Discussion

Buildings are among the most important and valuable objects in cadastral systems and, due to their economic and social roles, require frequent updating of cadastral data. Moreover, the data should be complete and of high positional and thematic accuracy. Although building cadastral data is generally obtained through field surveys, in the past few decades, remote sensing techniques have increasingly replaced field surveys as being cost-effective and time-efficient (see [2,10,11,25]). Building extraction aims for the correct amount of buildings, no commission and omission, e.g., each building should be represented and only by one object. However, in practice, errors in building extraction are inevitable, and the algorithms are optimized and trained to minimize inaccuracies during image segmentation. The results of building extraction are characterized by accuracy measures that in general, indicated the efficacy of the methods used. Nevertheless, as noticed by Avbelj et al. [47], results reported in literature should not be directly compared due to the different accuracy measures, the variety of building extraction approaches, study areas types, remotely sensed and reference data used.
Maltezos et al. [24] reported that the buildings extracted by CNN were “more complete and solid” for both the Vaihingen and Perissa research areas compared to the results of the SVM (Support Vector Machine) classifiers. The overall pixel-based CNN accuracy ranged from 81% to 86%, referring to an average quality rate about 83.0%, while the accuracy for the linear SVM reached 76.3% and base function RBF SVM just 72.9%. Huang et al. [33] stated that developed GRRNet gave the best result with an overall accuracy per pixel of 96.20%. The authors also found that the mean IoU per-pixel values varied significantly depending on the test area and variants of the GRRNet model. The best results (90.59%) were achieved for the Baseline + GFL-2 (gated feature labelling-2) modification in New York and the lowest results of 67.47% for the Baseline + FF (feature fusion) modification in Arlington. The FCM model exploited by Bittner et al. [38] extracted the building footprint successfully with the IoU metric of about ~68.1% (also on pixel level), which is comparable with the accuracy obtained in our study (IoU = 64.7%). The SRSM proposed by Nguyen et al. [40] yields an average area-based quality of 62.37% and an object-based quality of 63.21% for Quebec.
Huang et al. [33] stated that developed GRRNet gave the best result with an overall accuracy of 96.20%. The authors also found that the mean IoU values varied significantly depending on the test area and variants of the GRRNet model. The best results (90.59%) were achieved for the Baseline + GFL-2 (gated feature labelling-2) modification in New York and the lowest results of 67.47% for the Baseline + FF (feature fusion) modification in Arlington. The dependence of the accuracy of building extraction on the network structure and the loss function was also noted by Shao et al. [34], with the variability of IoU/F1 per-pixel measures of 0.0582/0.0402 for network structure and 0.0121/0.0080.
Rottensteiner et al. [28] detected buildings utilizing the Dempster–Shafer method for the fusion of LiDAR data and from aerial imagery with the precision of 85% and recall (completeness) of 89%. They also noticed that the values of both measures depend on the building size (area), reaching the lowest values for small buildings of less than 40–50 m2. Sohn and Dowman [29] received an overall accuracy of 80.5%, with a completeness of 88.3% and correctness equal to 90.1% using the Binary Space Partitioning (BSP) tree for processing fused IKONOS and LIiAR data. Kodorsa et al. [9] achieved 92% conformity of building recognition from LiDAR data using a saliency-based method. Wang et al. [21] reached a very high value of overall accuracy (94.12%) for building segmentation in the Massachusetts study region due to an innovative image processing method implementing the efficient Non-local Residual U-shape Network (ENRU-Net), composed of a U-shape encoder–decoder structure and an improved non-local block named the asymmetric pyramid non-local block (APNB). Reis et al. [39] investigated the availability of aerial orthophotos, for “cadastral works” and observed an object-based accuracy of 95% and pixel-based accuracy of 87% in comparison with cadastral data. However, the analyzed data sample included just a few buildings, so it is difficult to consider their results as representative. A profound and detailed accuracy analysis was presented in Khoshboresh-Masouleh et al. [61]. The authors evaluated building footprints’ results for different types of built-up areas, e.g., shadowed, vegetation-rich, complex roofs and high-density, obtaining a mean IoU value of 76%. Nevertheless, for building footprints characterized by complex roofs, the average IoU was 74.5%. The high efficiency of the ENVI deep learning algorithm is also reported in Lai et al. [30], who noticed that the accuracy of building segmentation ranged from 80 to 90%. The regularization technique using LiDAR data and orthoimages proposed by Gilani et al. [41] obtained completeness from 83% to 93% for the area with a correctness of above 95%, which undoubtedly proved the reliability of this approach. The overall accuracy of 89.5% obtained in our study is consistent with the results reported in literature and can be considered adequate for cadastral purposes.
The land administration system, and cadaster as a part of it, are always tailored to the national possibilities and requirements. The applications of remote sensing data and deep learning techniques to update cadastral data and maps remain limited. Firstly, deep learning methods of building footprints extraction based on satellite and aerial images and LiDAR data allow one mainly to delineate the rooftop of buildings’ outlines. Secondly, the obtained accuracy measures, mainly overall accuracy, completeness and RMSE, do not meet the requirements for cadastral data, and ultimately, the guarantee of the required high reliability of cadastral records is severely limited. Thirdly, it is challenging to precisely represent the shape of a building, especially for multi-walled buildings with multi-pitched roofs.
In Poland, the cadastre of land and buildings (denoted in Polish as EGiB) has a long tradition, and its transition from an analogue to a computer system, which began two decades ago, requires further improvement.
Practitioners and scientists still note many inconsistencies between cadastral data and field survey data, which means that the reliability of the building data is limited, and the position accuracy ranges from 0.7 to 1.5 m [17,62,63]. The latest regulation on technical standards for surveying measurements, in force from August 2020 [64], allow the use of modern photogrammetric techniques and remote sensing data to update cadastral data on buildings, provided that the accuracy of the location of the building footprint is not less than 0.1 m with reference to the nearest geodetic control point. As noted by Ostrowski et al. [65], such high accuracy can only be achieved when vectorizing the building contour manually on a stereomodel, what is labor-intensive, time-consuming and very expensive. Our three-step method is of great importance as it allows one to automate the building extraction and indicate areas where some discrepancies in building locations were noted, and ultimately to identify priority areas for possibility of the cadastre modernization. Particularly, the elaborated method could be applied for vector building data acquisition where it still does not operate in vector format, but as scanned analogue cadastral maps.
The entire territory of Poland is covered with high-resolution orthorectified aerial images, updated every five years, and dense LAS data with decimeter accuracy [64]. This undoubtedly creates great opportunities for the cadastre modernization based on remotely sensed data and advanced, automated feature extracting technologies, especially in areas where analogue or raster building cadastre operates. Our three-step method certainly belongs to such technologies. The applied algorithms could be used many times and on other areas, provided that for areas with a different building pattern and characteristics, the training area (ROIs) should be extended. Nevertheless, the large variation in types of built-up areas and building configurations in Poland leads to certain limitations in the fully automatic use of remote sensing data in cadastre modernization. Particularly, the problem of proper extraction of building footprints occurs for newly-built single-family houses, surrounded by greenery, with hipped roofs, dormers or solar panel installations (see Figure 9 as the example). In these areas, unfiltered noise points, as well as details on the roof surfaces, decreased the final accuracy of the roof shape reconstruction. Another challenge in many cell segmentation tasks is the separation of touching objects of the same class [21,22].

6. Conclusions

Recent developments in deep learning technology, as well as the availability of high-resolution aerial imagery and dense LAS data, offer fast and cost-effective ways of extracting buildings for cadastral purposes.
Although the automatically extracted building outlines cannot be directly uploaded the cadastral data due to differences in the outline (in the cadastre, it is the ground outline while the imagery data gives the roof outline), they could be successfully used when planning the cadastral modernization. Further research on reducing the roof outline to the outline of the building’s ground floor is of utmost importance.
The experimental result showed that the proposed methodology achieved good results and was robust after adjusting the model parameters to the specifics of the analyzed area. This partially limits the possibility of transferring our approach to areas with different building characteristics and the use of other aerial images. However, this limitation could be reduced by adding ROI in such places to best portrayal the investigated area.
Summing up the discussion on the possibility of cadastre updating by remotely sensed data, it should be noted that deep learning methods for buildings extraction are a promising technology; however, in many countries, it could only be used to indicate areas where the cadastre needs updating. Final registration in the cadastral system yet requires more accurate field measurements according to national cadastral standards.

Author Contributions

Conceptualization and methodology, D.W., E.B. and O.M.; validation, D.W., O.M.; formal analysis, D.W., O.M.; investigation, D.W., O.M.; resources, O.M.; writing—original draft preparation, E.B., D.W.; writing—review and editing, D.W.; visualization, D.W., O.M. and E.B.; supervision, E.B.; project administration, O.M.; funding acquisition, O.M. All authors have read and agreed to the published version of the manuscript.

Funding

This research was funded by Military University of Technology, Faculty of Civil Engineering and Geodesy, grant number DPH: 2/DPIH/2020.

Institutional Review Board Statement

Not applicable.

Informed Consent Statement

Not applicable.

Data Availability Statement

Data used in this study, i.e.,: buildings, aerial orthoimages and LAS data, were derived from the national geoportal of Poland https://mapy.geoportal.gov.pl/imap/Imgp_2.html.

Conflicts of Interest

The authors declare no conflict of interest.

References

  1. Enemark, S.; Williamson, I.; Wallace, J. Building Modern Land Administration Systems in Developed Economies. J. Spat. Sci. 2005, 50, 51–68. [Google Scholar] [CrossRef]
  2. Choi, H.O. An Evolutionary Approach to Technology Innovation of Cadastre for Smart Land Management Policy. Land 2020, 9, 50. [Google Scholar] [CrossRef] [Green Version]
  3. Williamson, L.P.; Ting, L. Land administration and cadastral trends—A framework for re-engineering. Comput. Environ. Urban Syst. 2001, 25, 339–366. [Google Scholar] [CrossRef] [Green Version]
  4. Bennett, R.; Wallace, J.; Williamson, I. Organising land information for sustainable land administration. Land Use Policy 2008, 25, 126–138. [Google Scholar] [CrossRef]
  5. Agenda 21. Action Programme—Agenda 21. 1992. Available online: https://sustainabledevelopment.un.org/content/documents/Agenda21.pdf (accessed on 25 September 2020).
  6. Agenda 2030. Transforming Our World: The 2030 Agenda for Sustainable Development. Available online: https://sdgs.un.org/2030agenda (accessed on 25 September 2020).
  7. UN Economic and Social Council. Progress towards the Sustainable Development Goals. Report of the Secretary-General. E/2017/66, 28 July 2016–27 July 2017. Available online: https://www.un.org/ga/search/view_doc.asp?symbol=E/2017/66&Lang=E (accessed on 25 September 2020).
  8. Estoque, R.C. A Review of the Sustainability Concept and the State of SDG Monitoring Using Remote Sensing. Remote Sens. 2020, 12, 1770. [Google Scholar] [CrossRef]
  9. Kodors, S.; Rausis, A.; Ratkevics, A.; Zvirgzds, J.; Teilans, A.; Ansone, J. Real Estate Monitoring System Based on Remote Sensing and Image Recognition Technologies. Procedia Comput. Sci. 2017, 104, 460–467. [Google Scholar] [CrossRef]
  10. Zahir, A. Assessing Usefulness of High-Resolution Satellite Imagery (HRSI) in GIS-based Cadastral Land Information System. J. Settl. Spat. Plan 2012, 3, 111–114. [Google Scholar]
  11. Janowski, A.; Renigier-Biłozor, M.; Walacik, M.; Chmielewska, A. Remote measurement of building usable floor area—Algorithms fusion. Land Use Policy 2021, 100, 104938. [Google Scholar] [CrossRef]
  12. Bielecka, E.; Dukaczewski, D.; Janczar, E. Spatial Data Infrastructure in Poland–lessons learnt from so far achievements. Geod. Cartogr. 2018, 67, 3–20. [Google Scholar] [CrossRef]
  13. Mika, M.; Kotlarz, P.; Jurkiewicz, M. Strategy for Cadastre development in Poland in 1989–2019. Surv. Rev. 2020, 52, 555–563. [Google Scholar] [CrossRef]
  14. Mika, M. An analysis of possibilities for the establishment of a multipurpose and multidimensional cadastre in Poland. Land Use Policy 2018, 77, 446–453. [Google Scholar] [CrossRef]
  15. Noszczyk, T.; Hernik, J. Understanding the cadastre in rural areas in Poland after the socio-political transformation. J. Spat. Sci. 2019, 64, 73–95. [Google Scholar] [CrossRef]
  16. Geodetic and Cartographic Law; (Official Journal 2010 No 193, Item 1287); Official Journal of Laws: Warsaw, Poland, 2010.
  17. Kocur-Bera, K.; Stachelek, M. Geo-Analysis of Compatibility Determinants for Data in the Land and Property Register (LPR). Geosciences 2019, 9, 303. [Google Scholar] [CrossRef] [Green Version]
  18. GUGiK. Budowa Zintegrowanego Systemu Informacji o Nieruchomościach –Faza II; Development of the Integrated System of Real Estate Information: Warsaw, Poland, 2018. Available online: http://www.gugik.gov.pl/__data/assets/pdf_file/0009/92664/ZSIN-II.pdf (accessed on 7 January 2021).
  19. EGiB Regulation. Regulation of the Minister of Regional Development and Construction of 28 February 2019 Amending the 2001 Regulation on the Register of Land and Buildings; Official Journal 2019, Item 397; Official Journal of Laws: Poland, Warsaw, 2019. [Google Scholar]
  20. Aung, H.T.; Pha, S.H.; Takeuchi, W. Building footprint extraction in Yangon city from monocular optical satellite image using deep learning. Geocarto Int. 2020. [Google Scholar] [CrossRef]
  21. Wang, S.; Hou, X.; Zhao, X. Automatic building extraction from high-resolution aerial imagery via fully convolutional encoder-decoder network with non-local block. IEEE Access 2020, 8, 7313–7322. [Google Scholar] [CrossRef]
  22. Liu, Y.; Zhou, J.; Qi, W.; Li, X.; Gross, L.; Shao, Q.; Zhao, Z.; Ni, L.; Fan, X.; Li, Z. ARC-Net: An Efficient Network for Building Extraction from High-Resolution Aerial Images. IEEE Access 2020, 8, 154997–155010. [Google Scholar] [CrossRef]
  23. Zhang, Z.; Vosselman, G.; Gerke, M.; Persello, C.; Tuia, D.; Yang, M.Y. Detecting Building Changes between Airborne Laser Scanning and Photogrammetric Data. Remote Sens. 2019, 11, 2417. [Google Scholar] [CrossRef] [Green Version]
  24. Maltezos, E.; Doulamis, N.; Doulamis, A.; Ioannidis, C. Deep convolutional neural networks for building extraction from orthoimages and dense image matching point clouds. J. Appl. Remote Sens. 2017, 11, 042620. [Google Scholar] [CrossRef]
  25. Bennett, R.; Oosterom, P.; Lemmen, C.; Koeva, M. Remote Sensing for Land Administration. Remote Sens. 2020, 12, 2497. [Google Scholar] [CrossRef]
  26. Baltsavias, E.P. Object extraction and revision by image analysis using existing geodata and knowledge: Current status and steps towards operational systems. ISPRS J. Photogramm. Remote Sens. 2004, 58, 129–151. [Google Scholar] [CrossRef]
  27. Lee, D.H.; Lee, K.M.; Lee, S.U. Fusion of Lidar and imagery for reliable building extraction. Photogramm. Eng. Remote Sens. 2008, 74, 215–225. [Google Scholar] [CrossRef] [Green Version]
  28. Rottensteiner, F.; Trinder, J.; Clode, S.; Kubik, K. Using the Dempster–Shafer method for the fusion of LIDAR data and multispectral images for building detection. Inf. Fusion 2005, 6, 283–300. [Google Scholar] [CrossRef]
  29. Sohn, G.; Dowman, I. Data fusion of high-resolution satellite imagery and LIDAR data for automatic building extraction. ISPRS J. Photogramm. Remote Sens. 2007, 62, 43–63. [Google Scholar] [CrossRef]
  30. Lai, X.; Yang, J.; Li, Y.; Wang, M. A Building Extraction Approach Based on the Fusion of LiDAR Point Cloud and Elevation Map Texture Features. Remote Sens. 2019, 11, 1636. [Google Scholar] [CrossRef] [Green Version]
  31. Ma, L.; Liu, Y.; Zhang, X.; Ye, Y.; Yin, G.; Johnson, B.A. Deep learning in remote sensing applications: A meta-analysis and review. ISPRS J. Photogramm. Remote Sens. 2019, 152, 166–177. [Google Scholar] [CrossRef]
  32. Zhuo, X.; Fraundorfer, F.; Kurz, F.; Reinartz, P. Optimization of OpenStreetMap Building Footprints Based on Semantic Information of Oblique UAV Images. Remote Sens. 2018, 10, 624. [Google Scholar] [CrossRef] [Green Version]
  33. Huang, J.F.; Zhang, X.C.; Xin, Q.C.; Sun, Y.; Zhang, P.C. Automatic building extraction from high-resolution aerial images and LiDAR data using gated residual refinement network. ISPRS J. Photogramm. Remote Sens. 2019, 151, 91–105. [Google Scholar] [CrossRef]
  34. Shao, Z.; Tang, P.; Wang, Z.; Saleem, N.; Yam, S.; Sommai, C. BRRNet: A Fully Convolutional Neural Network for Automatic Building Extraction from High-Resolution Remote Sensing Images. Remote Sens. 2020, 12, 1050. [Google Scholar] [CrossRef] [Green Version]
  35. Liu, Y.; Gross, L.; Li, Z.; Li, X.; Fan, X.; Qi, W. Automatic building extraction on high-resolution remote sensing imagery using deep convolutional encoder-decoder with spatial pyramid pooling. IEEE Access 2019, 7, 128774–128786. [Google Scholar] [CrossRef]
  36. Kang, W.; Xiang, Y.; Wang, F.; You, H. EU-Net: An Efficient Fully Convolutional Network for Building Extraction from Optical Remote Sensing Images. Remote Sens. 2019, 11, 2813. [Google Scholar] [CrossRef] [Green Version]
  37. Wu, G.; Shao, X.; Guo, Z.; Chen, Q.; Yuan, W.; Shi, X.; Xu, Y.; Shibasaki, R. Automatic Building Segmentation of Aerial Imagery Using Multi-Constraint Fully Convolutional Networks. Remote Sens. 2018, 10, 407. [Google Scholar] [CrossRef] [Green Version]
  38. Bittner, K.; Adam, F.; Cui, S.Y.; Korner, M.; Reinartz, P. Building footprint extraction from VHR remote sensing images combined with normalized DSMs using fused fully convolutional networks. IEEE J. Sel. Top. Appl. Earth Obs. Remote Sens. 2018, 11, 2615–2629. [Google Scholar] [CrossRef] [Green Version]
  39. Reis, S.; Torun, A.T.; Bilgilioğlu, B.B. Investigation of Availability of Remote Sensed Data in Cadastral Works. In Cadastre: Geo-Information Innovations in Land Administration; Yomralioglu, T., McLaughlin, J., Eds.; Springer: Cham, Switzerland, 2017. [Google Scholar] [CrossRef]
  40. Nguyen, T.H.; Daniel, S.; Guériot, D.; Sintès, C.; Le Caillec, J.-M. Super-Resolution-Based Snake Model—An Unsupervised Method for Large-Scale Building Extraction using Airborne LiDAR Data and Optical Image. Remote Sens. 2020, 12, 1702. [Google Scholar] [CrossRef]
  41. Gilani, S.A.N.; Awrangjeb, M.; Lu, G. An Automatic Building Extraction and Regularisation Technique Using LiDAR Point Cloud Data and Orthoimage. Remote Sens. 2016, 8, 258. [Google Scholar] [CrossRef] [Green Version]
  42. Girard, N.; Tarabalka, Y. End-to-end learning of polygons for remote sensing image classification. In Proceedings of the IGARSS 2018–2018 IEEE International Geoscience and Remote Sensing Symposium, Valencia, Spain, 22–27 July 2018; IEEE: Valencia, Spain, 2018; pp. 2083–2086. [Google Scholar]
  43. Zhao, K.; Kang, J.; Jung, J.; Sohn, G. Building Extraction from Satellite Images Using Mask R-CNN with Building Boundary Regularization. In Proceedings of the 2018 IEEE/CVF Conference on Computer Vision and Pattern Recognition Workshops (CVPRW), Salt Lake City, UT, USA, 18–22 June 2018; pp. 247–251. [Google Scholar] [CrossRef]
  44. Girard, N.; Smirnov, D.; Solomon, J.; Tarabalka, Y. Polygonal Building Segmentation by Frame Field Learning. arXiv 2020, arXiv:2004.14875. [Google Scholar]
  45. Li, Z.; Wegner, J.D.; Lucchi, A. Topological Map Extraction from Overhead Images. In Proceedings of the IEEE/CVF International Conference on Computer Vision (ICCV), Seoul, Korea, 27–28 October 2019; pp. 1715–1724. [Google Scholar] [CrossRef] [Green Version]
  46. Zhao, W.; Ivanov, I.; Persello, C.; Stein, A. Building Outline Delineation: From Very High Resolution Remote Sensing Imagery to Polygons with an Improved End-to-End Learning Framework. Int. Arch. Photogramm. Remote Sens. Spat. Inf. Sci. 2020, 43, 731–735. [Google Scholar] [CrossRef]
  47. Avbelj, J.; Muller, R.; Bamler, R. A Metric for Polygon Comparison and Building Extraction Evaluation. IEEE Geosci. Remote Sens. Lett. 2015, 12, 170–174. [Google Scholar] [CrossRef] [Green Version]
  48. Dey, E.K.; Awrangjeb, M. A Robust Performance Evaluation Metric for Extracted Building Boundaries from Remote Sensing Data. IEEE J. Sel. Top. Appl. Earth Obs. Remote Sens. 2020, 13, 4030–4043. [Google Scholar] [CrossRef]
  49. Degórska, B. Spatial growth of urbanised land within the Warsaw Metropolitan Area in the first decade of the 21st century. Geogr. Pol. 2012, 85, 77–95. [Google Scholar] [CrossRef] [Green Version]
  50. Ronneberger, O.; Fischer, P.; Brox, T. U-Net: Convolutional Networks for Biomedical Image Segmentation. In Medical Image Computing and Computer-Assisted Intervention—MICCAI 2015; Navab, N., Hornegger, J., Wells, W., Frangi, A., Eds.; MICCAI 2015, Lecture Notes in Computer Science; Springer: Cham, Switzerland, 2015; Volume 9351. [Google Scholar] [CrossRef] [Green Version]
  51. Harris. Harris Geospatial Solutions, 2020: Train Deep Learning Models. Available online: https://www.l3harrisgeospatial.com/docs/TrainDeepLearningModels.html (accessed on 2 November 2020).
  52. Pan, Z.; Xu, J.; Guo, Y.; Hu, Y.; Wang, G. Deep Learning Segmentation and Classification for Urban Village Using a Worldview Satellite Image Based on U-Net. Remote Sens. 2020, 12, 1574. [Google Scholar] [CrossRef]
  53. Liu, W.; Yang, M.; Xie, M.; Guo, Z.; Li, E.; Zhang, L.; Pei, T.; Wang, D. Accurate Building Extraction from Fused DSM and UAV Images Using a Chain Fully Convolutional Neural Network. Remote Sens. 2019, 11, 2912. [Google Scholar] [CrossRef] [Green Version]
  54. DeepAI. Available online: https://deepai.org/machine-learning-glossary-and-terms/machine-learning (accessed on 30 December 2020).
  55. Rottensteiner, F.; Briese, C. A New Method for Building Extraction in Urban Areas from High-Resolution LIDAR Data. Int. Arch. Photogramm. Remote Sens. Spat. Inf. Sci. 2002, 34 Pt 3A, 295–301. [Google Scholar]
  56. Africani, P.; Bitelli, G.; Lambertini, A.; Minghetti, A.; Paselli, E. Integration of LIDAR data into amunicipal GIS to study solar radiation. Int. Arch. Photogramm. Remote Sens. Spat. Inf. Sci. 2013, XL–1-W1-1, 1–6. [Google Scholar] [CrossRef] [Green Version]
  57. Baillard, C.; Schmid, C.; Zisserman, A.; Fitzgibbon, A. Automatic line matching and 3D reconstruction of buildings from multiple views. IAPRS 1999, 32, 69–80. [Google Scholar]
  58. Vosselman, G.; Dijkman, S. 3D building model reconstruction from point clouds and ground plans. In Proceedings of the ISPRS Workshop: Land Surface Mapping and Characterization Using Laser Altimetry, Annapolis, MD, USA, 22–24 October 2001; Hofton, M.A., Ed.; pp. 37–43. Available online: http://www.isprs.org/proceedings/XXXIV/3-W4/pdf/Vosselman.pdf (accessed on 29 January 2021).
  59. Douglas, D.; Peucker, T. Algorithms for the reduction of the number of points required to represent a digitized line or its caricature. Can. Cartogr. 1973, 10, 112–122. [Google Scholar] [CrossRef] [Green Version]
  60. Lupa, M.; Kozioł, K.; Leśniak, A. An Attempt to Automate the Simplification of Building Objects in Multiresolution Databases. In Beyond Databases, Architectures and Structures; Kozielski, S., Mrozek, D., Kasprowski, P., Małysiak-Mrozek, B., Kostrzewa, D., Eds.; BDAS 2015, Communications in Computer and Information Science; Springer: Cham, Switzerland, 2015; Volume 521. [Google Scholar] [CrossRef]
  61. Khoshboresh-Masouleh, M.; Alidoost, F.; Hossein, A. Multiscale building segmentation based on deep learning for remote sensing RGB images from different sensors. J. Appl. Remote Sens. 2020, 14, 034503. [Google Scholar] [CrossRef]
  62. Hanus, P.; Benduch, P.; Pęska-Siwik, A. Budynek na mapie ewidencyjnej, kontur budynku i bloki budynku. Przegląd Geod. 2017, 7, 15–20. (In Polish) [Google Scholar] [CrossRef]
  63. Buśko, M. Modernization of the Register of Land and Buildings with Reference to Entering Buildings into the Real Estate Cadastre in Poland. In Proceedings of the International Conference on Environmental Engineering. Vilnius Gediminas Technical University, Vilnius, Lithuania, 27–28 April 2017. [Google Scholar] [CrossRef]
  64. Ministry Regulation, 2020; Regulation of the Ministry of Development of 18 August 2020 r. On Technical Standards for the Performance of Situational and Height Measurements as Well as the Development and Transfer of the Results of These Measurements to the State Geodetic and Cartographic Resource. Official Journal 2020, item 1429. Available online: https://www.dziennikustaw.gov.pl/D2020000142901.pdf (accessed on 28 September 2020).
  65. Ostrowski, W.; Pilarska, M.; Charyton, J.; Bakuła, K. Analysis of 3D building models accuracy based on the airborne laser scanning point clouds. Int. Arch. Photogramm. Remote Sens. Spat. Inf. Sci. 2018, 42, 797–804. [Google Scholar] [CrossRef] [Green Version]
Figure 1. The study area: Warsaw and Kobiałka, the study region (marked by the red rectangle) and aerial orthoimage (selected part).
Remotesensing 13 00611 g001
Figure 2. Schematic flow chart of the building extraction approach.
Remotesensing 13 00611 g002
Figure 3. U-Shape Network (U-net) architecture used (based on [35]).
Remotesensing 13 00611 g003
Figure 4. LiDAR data density, the selected example.
Remotesensing 13 00611 g004
Figure 5. LiDAR rooftop polygons: (a) adjustment of the Plane Surface Tolerance values, (b) selected examples of building rooftop outlines (yellow lines) superimposed on aerial orthoimagery.
Remotesensing 13 00611 g005
Figure 6. U-Net training validation.
Remotesensing 13 00611 g006
Figure 7. Buildings segmentation results: (a) single-family detached buildings, (b) multi-family building-blocks.
Remotesensing 13 00611 g007
Figure 8. Results of RGB orthoimagery segmentation based on U-Net: (a) dense built-up area; (b) multiple colors of roofs; (c) complex roof shapes and vegetation vicinity; (d) complex pattern of buildings, parking lots, roads.
Remotesensing 13 00611 g008
Figure 9. Buildings’ rooftop polygons hampered by: (a) complex, multi-slope roof; (b) vegetation cover.
Remotesensing 13 00611 g009
Figure 10. Geoprocessing of buildings rooftop polygons: (a) building rooftop patches (yellow lines) within deep learning delineated building footprints (green line); (b) building the rooftop outline; (c) corrected and simplified rooftop outline; (d) shift in building outlines (yellow line) and building footprints from cadastral data.
Remotesensing 13 00611 g010
Figure 11. Differences between building outlines from remote sensing and cadastral data: (a) descriptive statistics, (b) analyzed cadastral buildings contained two outlines derived from LiDAR data processing (see an example in Figure 12a).
Remotesensing 13 00611 g011
Figure 12. Building outlines: yellow from LiDAR, red from the cadastre: (a) multi-family building extracted as two building outlines; (b) two connected single-family houses denoted by LiDAR as one building; (c) outlines of a kindergarten.
Remotesensing 13 00611 g012
Table 1. Building outlines’ accuracy.
Overall Accuracy (%)PrecisionRecallF1-ScorePer-Object IoU Mean
89.50.7650.8070.7850.748
Publisher’s Note: MDPI stays neutral with regard to jurisdictional claims in published maps and institutional affiliations.

