Article

On the Potential Optical Signature of Convective Turbulence over the West Florida Shelf

U.S. Naval Research Laboratory, Stennis Space Center, MS 39529, USA
*
Author to whom correspondence should be addressed.
Remote Sens. 2021, 13(4), 619; https://doi.org/10.3390/rs13040619
Submission received: 31 December 2020 / Revised: 29 January 2021 / Accepted: 5 February 2021 / Published: 9 February 2021
(This article belongs to the Section Ocean Remote Sensing)

Abstract

:
Atmospheric cold front propagation across the northern Gulf of Mexico is characterized by elevated surface wind velocities and a ~10–15 °C drop in surface air temperatures. These meteorological conditions result in significant heat energy losses from the surface ocean to the overlying atmosphere. These seasonally recurring cold-air outbreak events may penetrate the southern portion of the West Florida continental shelf and initiate turbulent and convective overturn of the water column. Examination of true color images derived from ocean-viewing, satellite-based radiometer data reveals coincident and substantial surface water discolorations that are optically similar to smaller-scale “whiting events,” despite the regional-scale extent of the observed phenomenon (>25,000 km2). Coupled air–sea numerical simulations suggest the surface water discoloration occurs and is sustained where the entire water column is dynamically unstable. The simulation results indicate significant density (σt) inversions between the surface and bottom waters. Thus, the combined numerical model and remote sensing analysis suggest that convective turbulence may be contributing to the sustained ventilation of bottom waters containing a high concentration of suspended particulates. High-temporal resolution true color images rendered from the GOES-R Advanced Baseline Imager (ABI) data appear to support the surface water discoloration’s turbulent-driven nature.

1. Introduction

Cold-air outbreak (CAO) events in the northern Gulf of Mexico (GOM) are known to result in substantial modulation of air–sea interactions and coastal ocean circulation as well as alteration of surface water masses [1,2,3,4]. CAO events are persistent in boreal autumn–winter but may occur during other seasons [5]. The southerly penetration of the continental, dry, and high-pressure air masses with accelerating winds out of the north has also been referred to as “northers” [6]. Each CAO event has varying degrees of southerly penetration into the GOM [7]. CAO events may only pervade the extreme northern GOM or they may penetrate as far south as Veracruz in southern Mexico [8].
The combination of elevated wind velocities and significantly reduced lower air temperatures during and following the initial passage of the atmospheric cold front drives substantial heat losses from the surface ocean [9]. The surface ocean buoyancy loss may then cause density-driven vertical mixing processes [10,11]. In a more general sense, such intense buoyancy losses result in turbulent fluid motions, that is, convective turbulence [12,13]. Turbulent convection in the ocean is often characterized by descending parcels of cold water that result from either diurnal cooling or seasonal cold-air outbreak events [12,13,14].
In regions of the continental shelf where this convective vertical ocean mixing penetrates down to the ocean bottom, the entire water column is then vertically well-mixed, i.e., homogenous with respect to density. Conceivably, significant and continuing heat losses at the surface under these well-mixed conditions may result in continuing density-driven instabilities and lead to sustained turbulent motions. Indeed, such a scenario for turbulent convection has been examined via numerical models intended to represent shallow waters off of the Florida coast during a CAO event [15].
Similar convective processes within shelf waters may resuspend fine-grained carbonates from the West Florida Shelf (WFS) seafloor during periods of intense buoyancy losses and vertical mixing. Accordingly, the term “whiting event” or “whitings” is often used to describe the elevated concentration of suspended calcium carbonate (CaCO3) particulates in discrete areas of the surface ocean. Whiting events are common on the Bahama platform [16,17], but the exact mechanism for their formation remains unknown. One common hypothesis is that some form of bottom sediment resuspension mechanism is involved and fish schools, tidal flows, small-scale turbulence, and even movement of water through subterranean networks have been proposed [16]. Convective turbulence is perhaps another mechanism that may resuspend carbonate particles, where such materials have accumulated on the seafloor.
This paper combines advanced numerical air–sea simulations and coincident satellite images to elucidate the mechanistic functioning and the potential optical signatures of these CAO-induced turbulent mixing events. In the particular case of CAO events across the WFS, there is an evident and coincident discoloration of surface waters when examined using true color (TC) images that appears qualitatively similar to smaller-scale whiting events. Construction of TC images from the underlying radiometer data is an efficient way to broadly discern changes in surface ocean optical conditions that may not be as apparent when examining other products. For example, the phenomenon examined herein is not nearly as distinctive when analyzing satellite radiometer data in the context of standard, level-3, inversion products, such as the surface chlorophyll-a concentration. Precise determination of true color requires the application of ocean colorimetry, which is the quantitative determination of the ocean’s apparent color based on the underlying spectral distribution of the emergent water-leaving radiance [18,19,20]. We employ colorimetry because it is a useful tool to rapidly delineate changes in surface ocean optics and potential delineations between water mass boundaries without any a priori assumption regarding the potential optical constituents and their respective impact on surface reflectance signals [18,21]. True color may also provide information that is lost in the standard inversion product fields but is nonetheless indicative of physical ocean processes and water mass boundaries [22]. Colorimetry also provides a useful framework for visible-band sensor fusion techniques, such as convolving GOES-R Advanced Baseline Imager (ABI) data with data from traditional ocean color sensors [23].

2. Materials and Methods

2.1. Satellite Data

Satellite datasets presented herein were obtained from three sensor types: (1) the Ocean and Land Colour Imager (OLCI) onboard the Sentinel-3A/B satellites; (2) the Visible Infrared Imaging Radiometer Suite (VIIRS) on the Suomi-National Polar-Orbiting Partnership (SNPP) and NOAA-20 satellites; and (3) the Advanced Baseline Imager (ABI) on the Geostationary Operational Environmental Satellite (GOES)—East. The OLCI and VIIRS level-1 sensor data were processed using the Naval Research Laboratory’s (NRLs) Automated Optical Processing System (AOPS) [24]. The Sentinel-3A and B satellites have a staggered orbital coverage. The platform selected for the OLCI sensor analysis was whichever one provided the optimal spatial coverage of the WFS on that date.
For the TC scenes depicted in this paper, an intermediate processing radiance, [“rho_s”; ρs], was used to generate the color information. This product was selected because the cloud cover in some scenes made the full atmospheric (aerosol) correction difficult, and it was necessary to show the entire sequence of color images during the CAO event described herein. Using the intermediate product provides more data to view the full series of daily surface ocean discoloration images, particularly in the CAO sequence’s initial phase when cloud cover is persistent. The ρs product is designated as quasi-surface reflectance in the NASA product documentation [25]. Standard level-3 remote sensing product data were rendered using the full atmospheric correction procedure in AOPS and are presented in Section 3.5.
TC fields shown in this paper were constructed following the colorimetric method [18,19,20]. Reflectance from the sensors at each visible band was interpolated to reconstruct the hyperspectral information (Δλ = 1 nm, 400–700 nm) for each pixel. The interpolated spectra were integrated with the CIE 1931 standard color matching functions [26] to produce the X, Y, and Z color primaries and then converted to the standard RGB color table for visual display as a three-channel jpeg image file. It is important to note that the conversion from X, Y, and Z primaries to standard RGB followed an established convention [27], and was not an arbitrary scaling of selected radiometer bands.
For the respective ocean color sensors (OLCI, VIIRS), TC fields were constructed from data obtained during each day corresponding to the time period of the numerical air–sea simulations (Section 2.2). Changes in the TC fields were detected first by visual inspection of the jpeg images. The mapped color gradients were then spatially compared to the physical simulation results. The initial analysis focused on heat flux terms and sea surface temperature (SST). A subsequent analysis then examined potential density and temperature inversions between the simulated surface and the bottom waters. Contour plots of the physical model results were overlaid upon mapped TC images. This procedure’s motivation is that color gradients in coastal TC images often correspond to gradients in the physical oceanographic variables and may indicate the underlying physical oceanographic processes [22].
In this paper, we also examine visible band data from the GOES-ABI sensor. The geostationary GOES data have a very high temporal resolution (every 5 min) and can provide supplemental information for scenes where the surface ocean is detected. However, ocean color (that is, ocean surface water-leaving radiance detection in the visible) is not an intended application for this sensor. In order to repurpose GOES-ABI data to provide some continuity with dedicated ocean sensors, a method was developed to convolve GOES-ABI data with dedicated ocean color sensor information, and this procedure is described in Jolliff et al. [23]. Preliminary GOES-ABI level 1B CONUS data (~500 m horizontal resolution) were obtained from the NOAA Comprehensive Large-Array Data Stewardship System (CLASS), and processing details are described elsewhere [28]. GOES-ABI has two broad bands in the visible, one centered at 470 nm and one at 640 nm. ABI scene color information for the green wavelengths (centered on 555 nm) was estimated based on examining the coincident VIIRS and OLCI data. Under some circumstances, this method allows for GOES-ABI data to be used as a very high temporal visualization of surface ocean color changes.

2.2. COAMPS and Buoy Data

The Coupled Ocean-Atmosphere Mesoscale Prediction System (COAMPS) is an integrated ocean-atmosphere numerical modeling system [29,30] that provides operational support for the U.S. Navy [31]. The nested atmospheric and ocean models exchange information on fluxes of thermal energy and other data via the Earth System Modeling Framework (ESMF). The ocean model component, the Navy Coastal Ocean Model (NCOM) [32], was configured at 3 km horizontal resolution for the northern Gulf of Mexico. The ocean grid consisted of 50 vertical levels, with 36 sigma layers between the surface and 190-m depth (which are bottom-following in water shallower than 190 m), and 14 fixed-depth layers between 190 m and the maximum depth of 5500 m. Bathymetric data were obtained from the Navy’s two-minute-resolution Digital Bathymetric Data Base (DBDB2). Initial and boundary conditions for NCOM were obtained from a global version of NCOM [30]. The atmospheric model inner nest was configured at 6 km horizontal resolution and 60 vertical levels. Atmospheric boundary conditions for each of the forecasts were provided by the Navy Operational Global Atmospheric Prediction System (NOGAPS) [33]. Additional details on model coupling, information exchange, and ocean-atmosphere data assimilation can be found elsewhere [34,35]. The COAMPS simulation was executed for December 2018 with an internal ocean model timestep of twenty seconds. Simulation results were output every simulated hour for the duration of the model execution.
Meteorological and oceanographic buoy data were obtained from NOAA’s National Data Buoy Center (https://www.ndbc.noaa.gov). The location of each buoy used is indicated herein. Some buoys were operated and maintained by the University of South Florida Coastal Ocean Monitoring and Prediction System (USF COMPS).

3. Results

3.1. Meteorological and Physical Oceanographic Setting

The CAO event on 21 December 2018 provides a prototypical example of a cold front penetration to the southern portion of the WFS. Observed wind velocities and simulated wind stress peak on 21 December, with observed 10-m winds approaching 20 m s−1 before maintaining a steady direction out of the north, were consistent with previous CAO events (Figure 1A). COAMPS simulates the propagation of the cold air mass and the ocean’s response. The results maintain fidelity to buoy observations (Figure 1B; Buoy 42023 [C13] is approximately ~95 km from shore and over the 50-m isobath). On 21 December, the air–sea temperature difference (defined as the 2-m air temperature minus sea surface temperature [SST]) approaches −8 °C in the buoy data. The simulated temperature differences do not become this large (−6 °C). However, both the COAMPS results and the buoy data show a rapid increase in the magnitude of air–sea temperature differences beginning on 21 December and corresponding to the penetration of cold air to the southern portion of the WFS.
The simulated heat losses from the surface ocean also peak on 21 December and exceed 800 W m−2. The latent heat flux losses calculated from the buoy 42023 data (not shown) also peak in excess of 600 W m−2 on 21 December and appear to be the dominant heat flux term during the CAO’s initial phase. After the initial peak in simulated heat flux, the following four days (22–25 December) still show simulated heat losses in the ~400 W m−2 range (Figure 1B). These heat losses are significant and comparable in magnitude to higher latitude sites of deep open ocean convection [36].
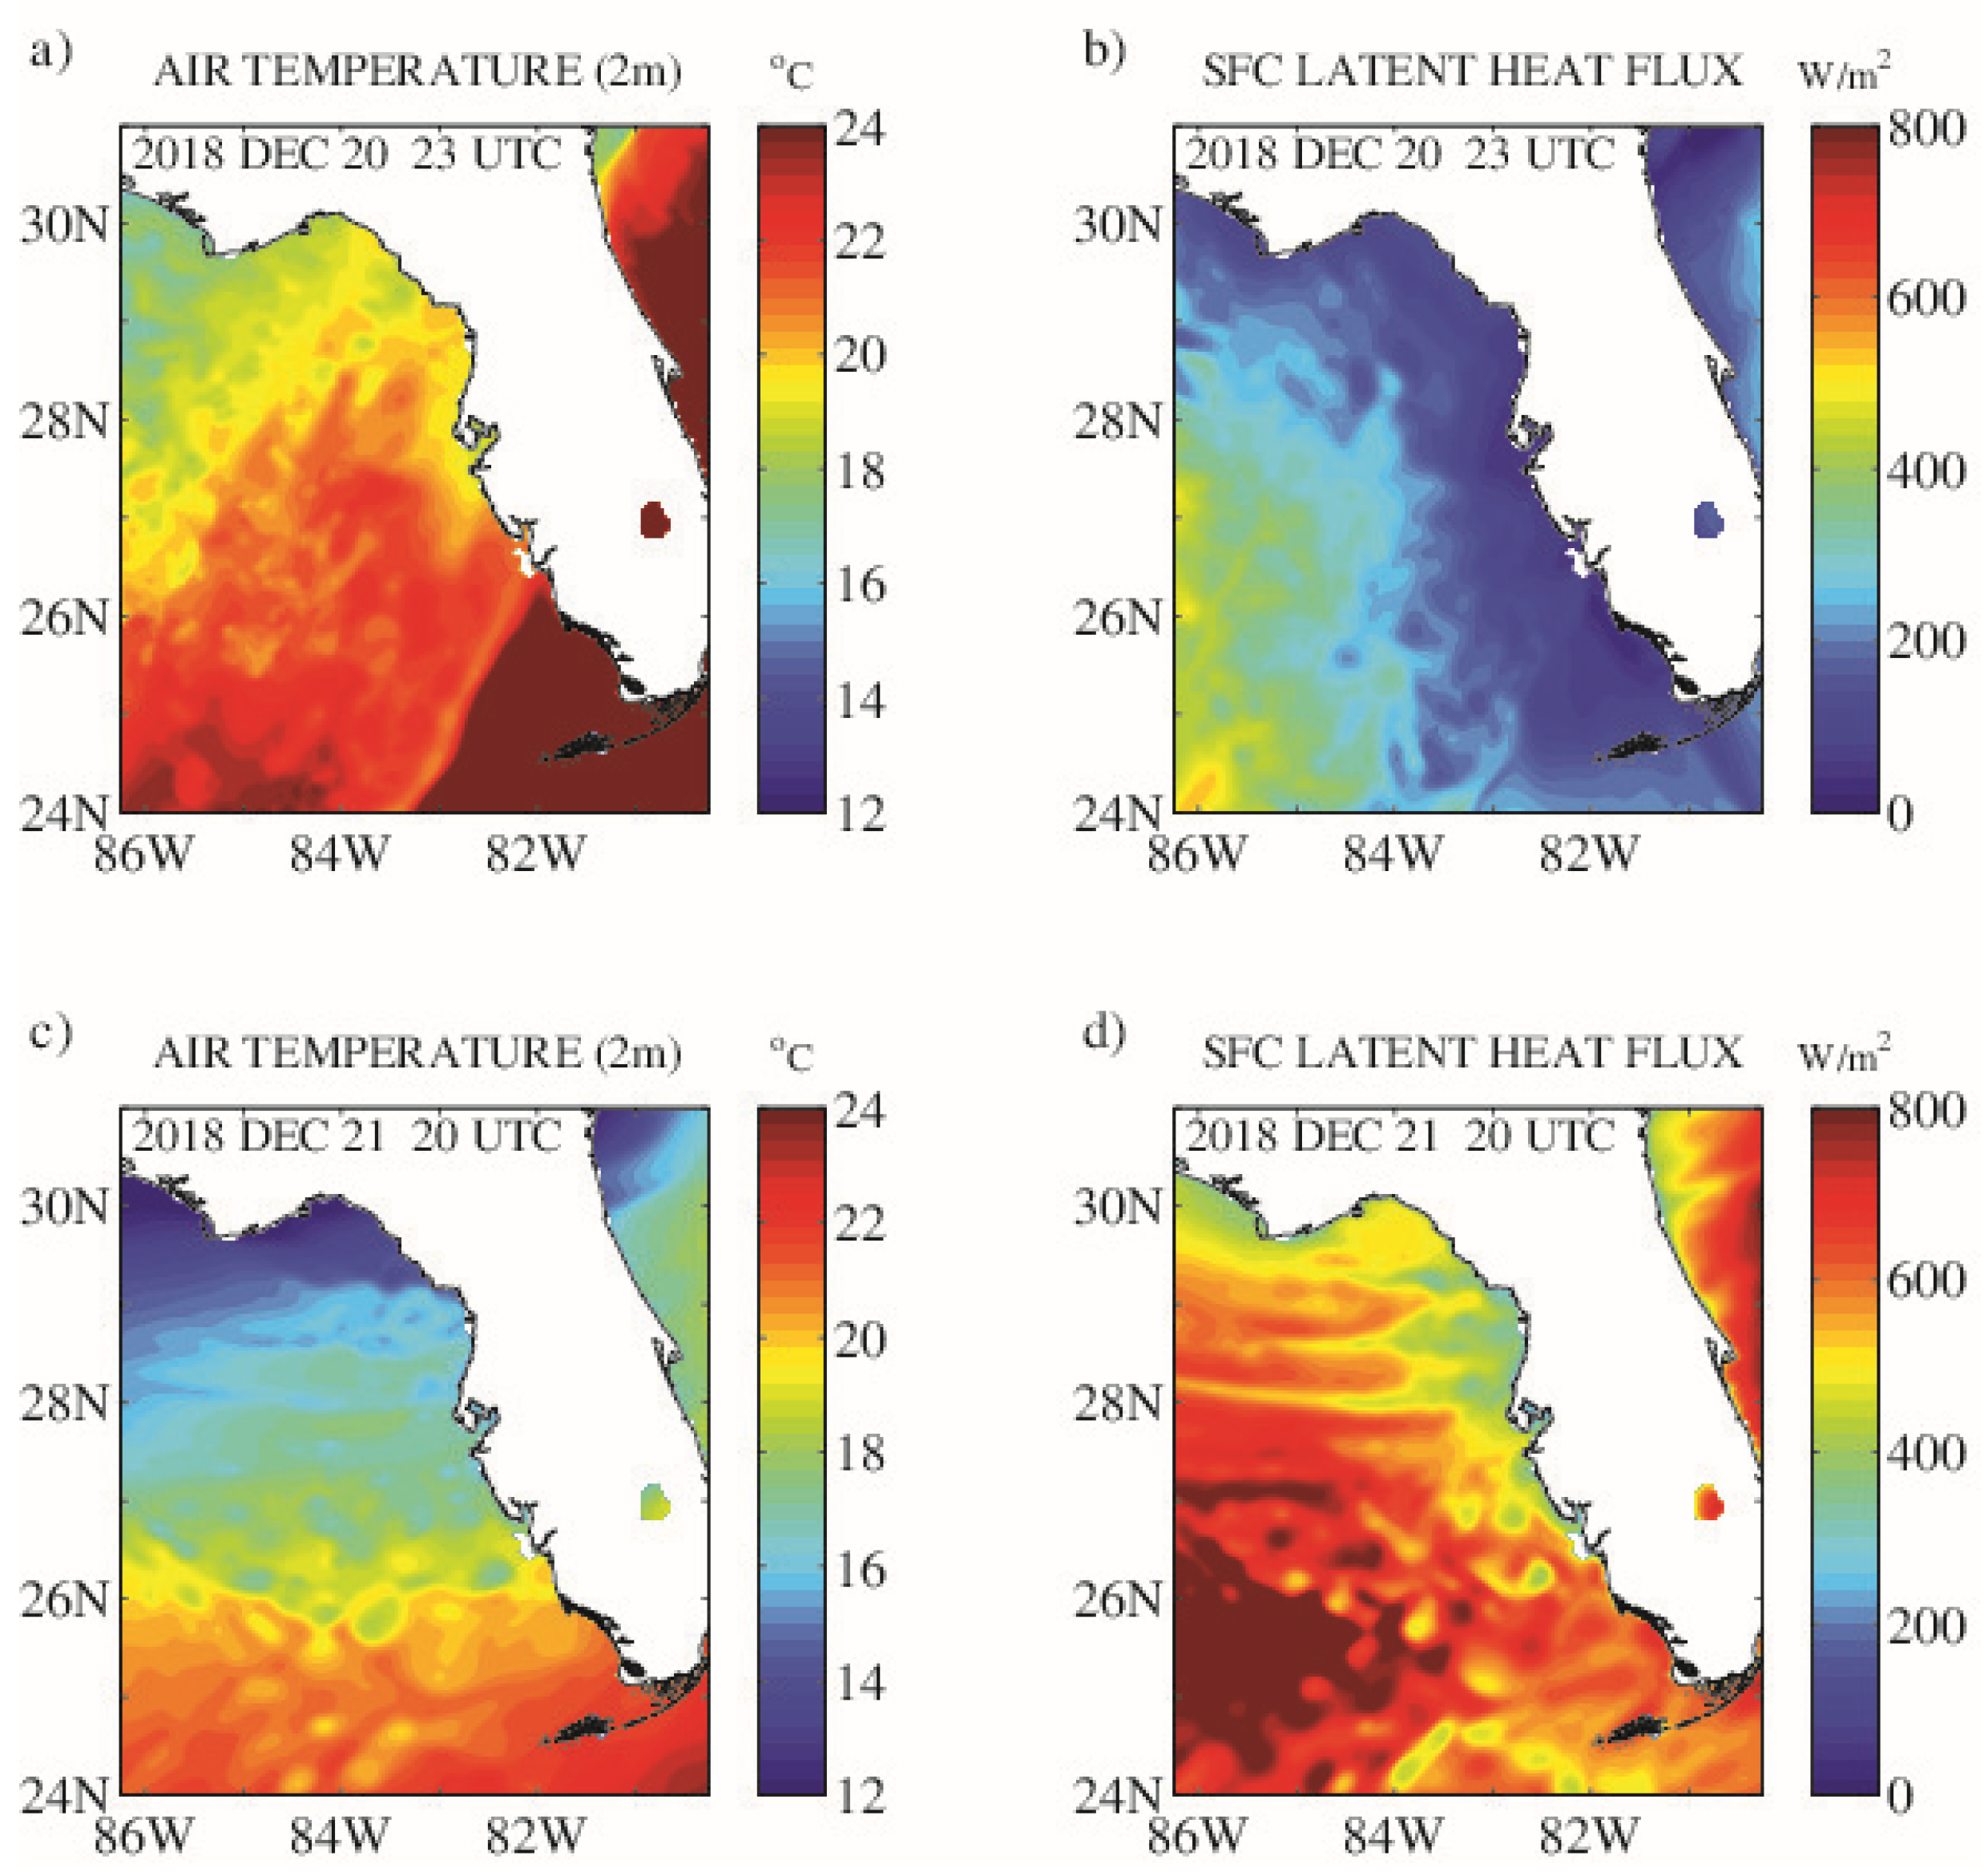
These buoy observations verify the COAMPS simulation results and confirm the characteristic features of a CAO event over the WFS. The COAMPS simulations then provide a more synoptic view of the regional event. On 20 December, the COAMPS simulated near-surface air temperatures (2-m) reveal the southwest to the northeast orientation of the progressing cold front (Figure 2a). Simulated latent heat flux values at that time range from nominal to ~200 W m−2 across the shelf (Figure 2b). The cold air mass pushes south rapidly, and this is shown in subsequent hourly results from the COAMPS simulation. By 21 simulated hours later, latent heat fluxes across the WFS are >400 W m−2, and lower air temperatures have broadly declined by ~10 °C (Figure 2c,d).

3.2. Coincident Satellite True Color

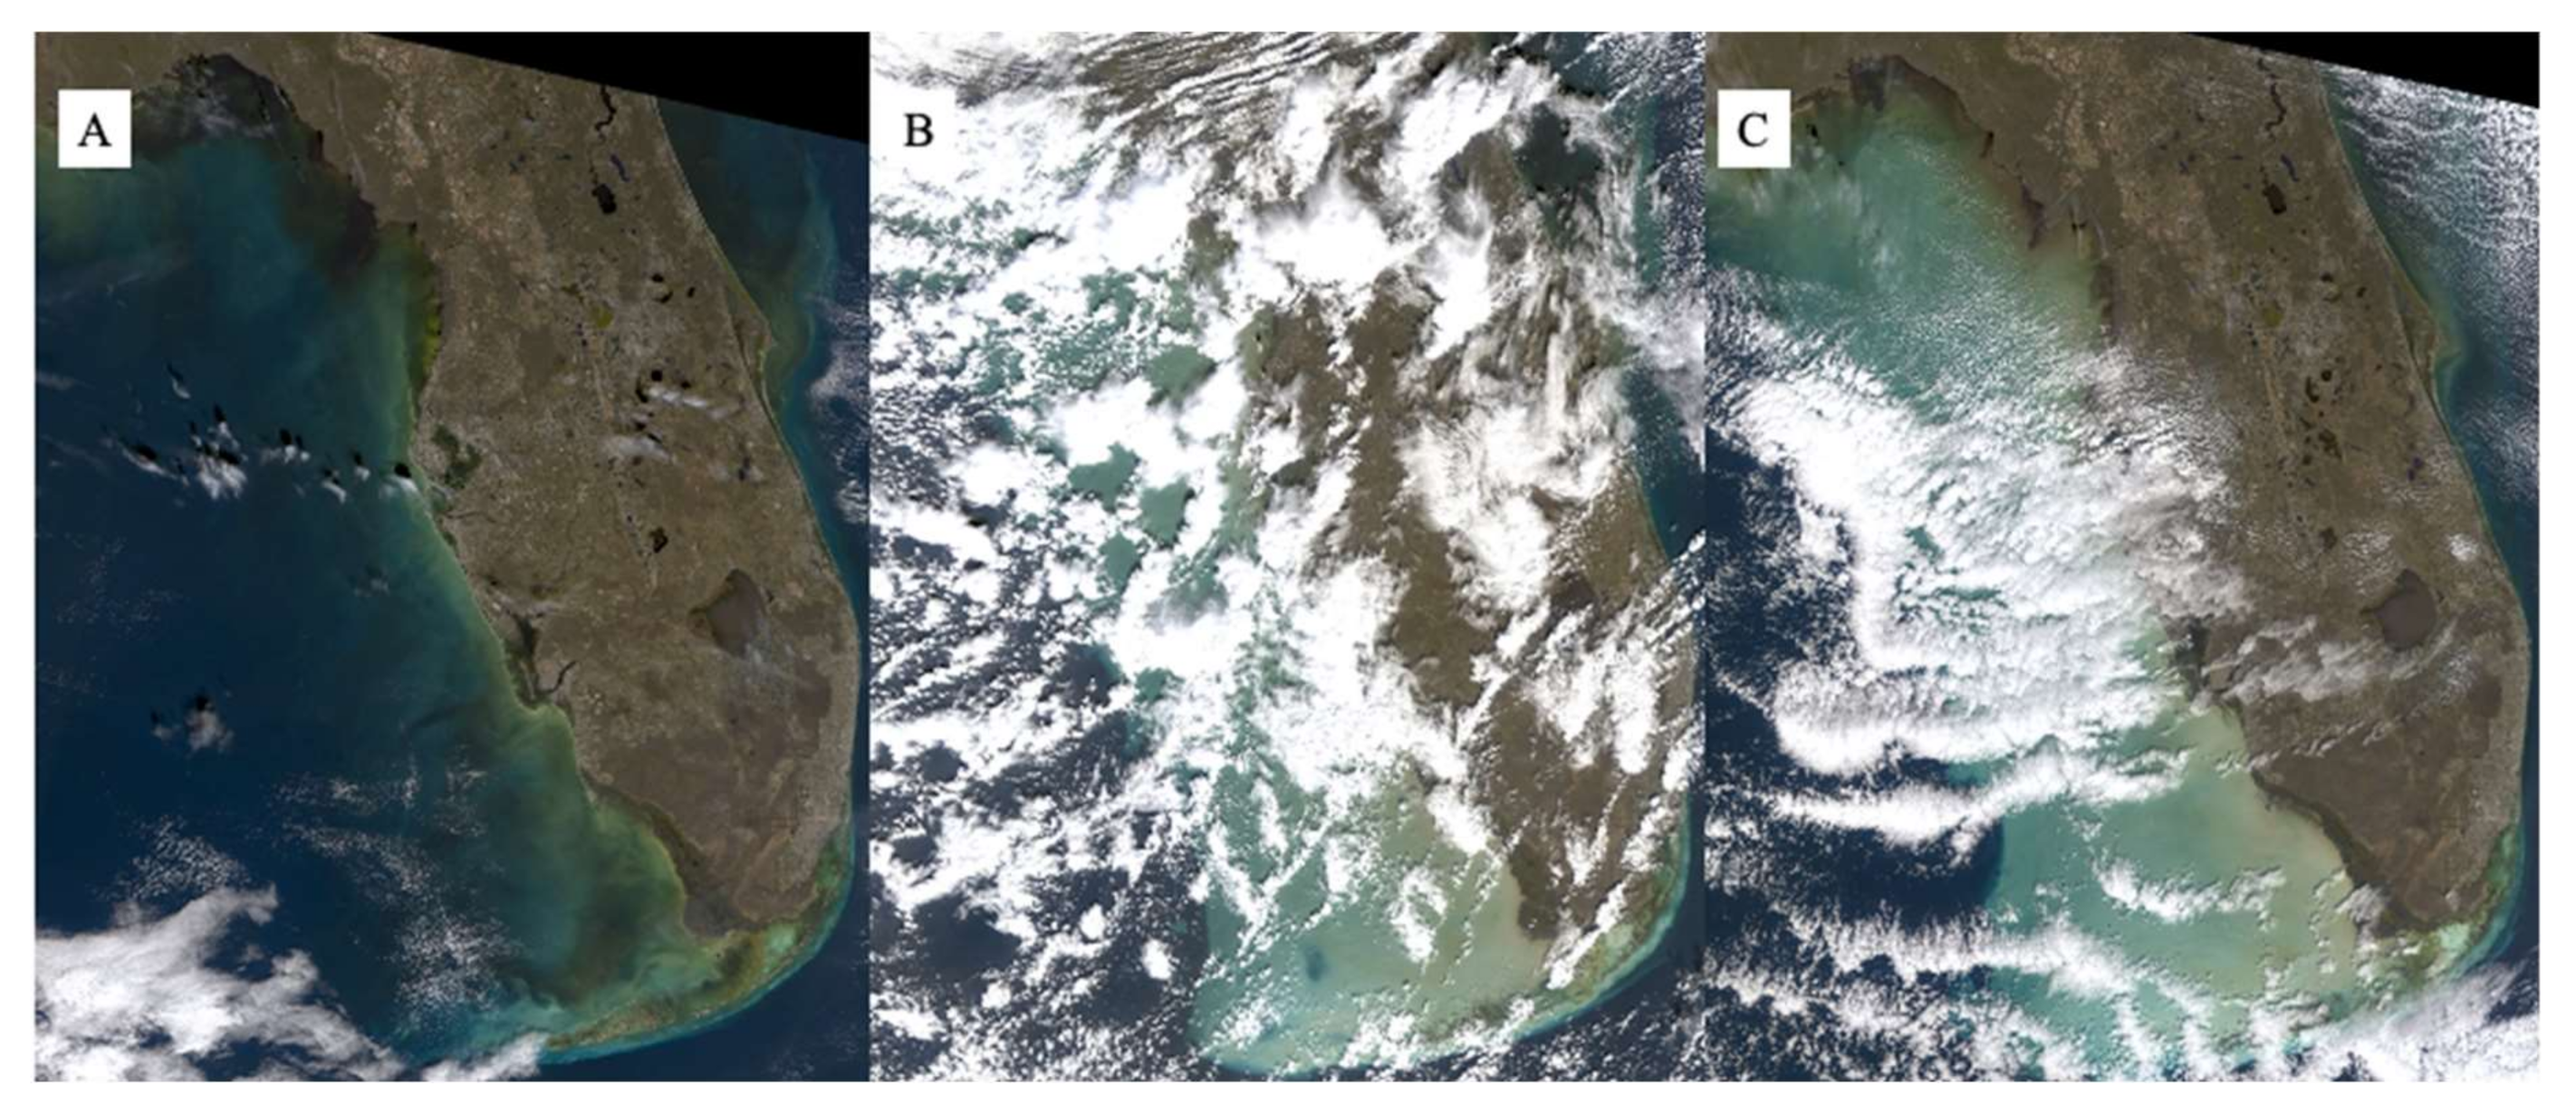
These air–sea interactions are simultaneous to observed synoptic changes in the TC fields across much of the WFS. Before the cold front arrives on 18 December, the OLCI sensor-derived TC image shows homogeneity of color between the shelf area and the open GOM, save for the locations very near the Florida coast (<25 km; Figure 3A). The following two days of OLCI-based TC imagery (21 and 22 December; Figure 3A,B) are more obscured by clouds but nonetheless reveal a sharp color discontinuity at mid-shelf, and much of the shelf appears turbid.
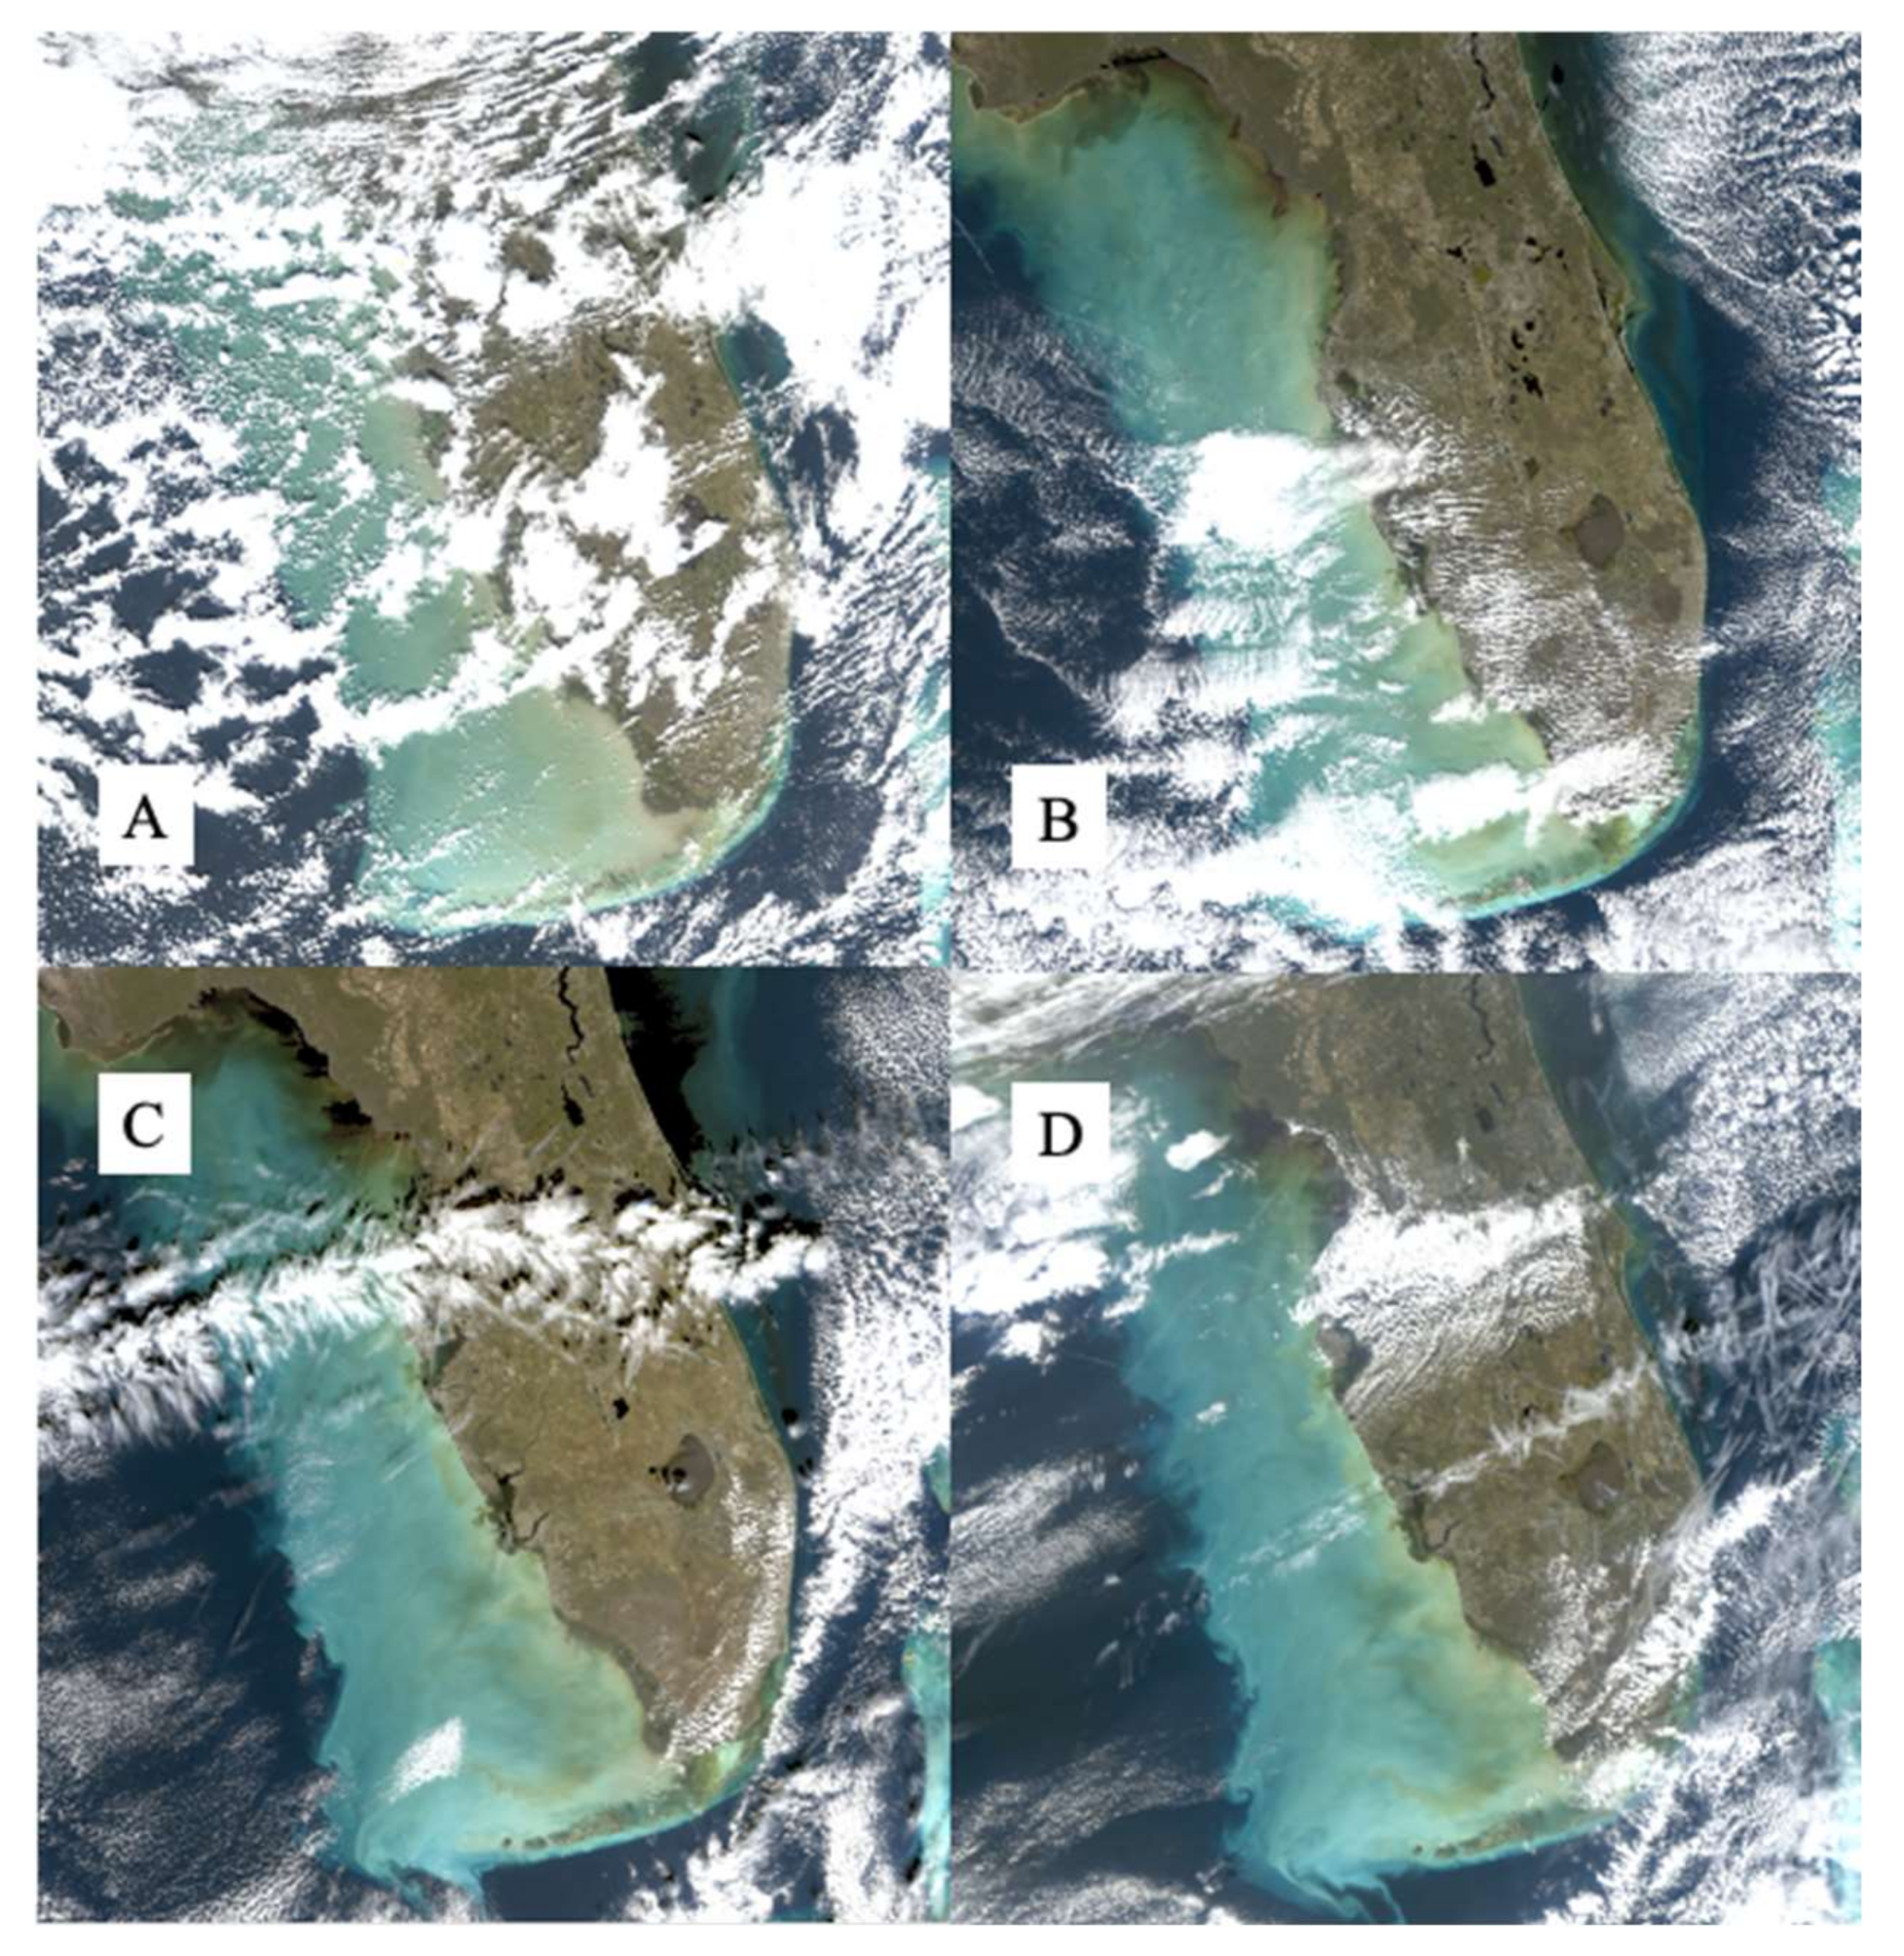
The following three days of OLCI images (Figure 4) are less impacted by clouds and show the persistent discoloration across much of the shelf area. The TC signal discontinuity then begins to dissipate on 26 December (image is not shown). However, the shelf discoloration’s persistence appears to be synchronous with the period during which the COAMPS simulations suggest large heat flux losses (~400 W m−2) and sustained negative air–sea temperature differences (Figure 1B).
The VIIRS sensors (NOAA-20 and SNPP satellites) also capture the TC gradients across the shelf and the shelf-wide discoloration 21–24 December (Figure 5). The VIIRS images emphasize both the temporal persistence and spatial homogeneity of the surface water discoloration. The VIIRS TC images on 24 and 25 December (Figure 4B,C depicts apparent parcels of turbid water exiting the WFS to the south and entering the Florida Straits. This apparent “streamer” of turbid water appears to be consistent with our hypothesis that the anomalous color images indicate surface turbidity, likely due to suspended particulates.
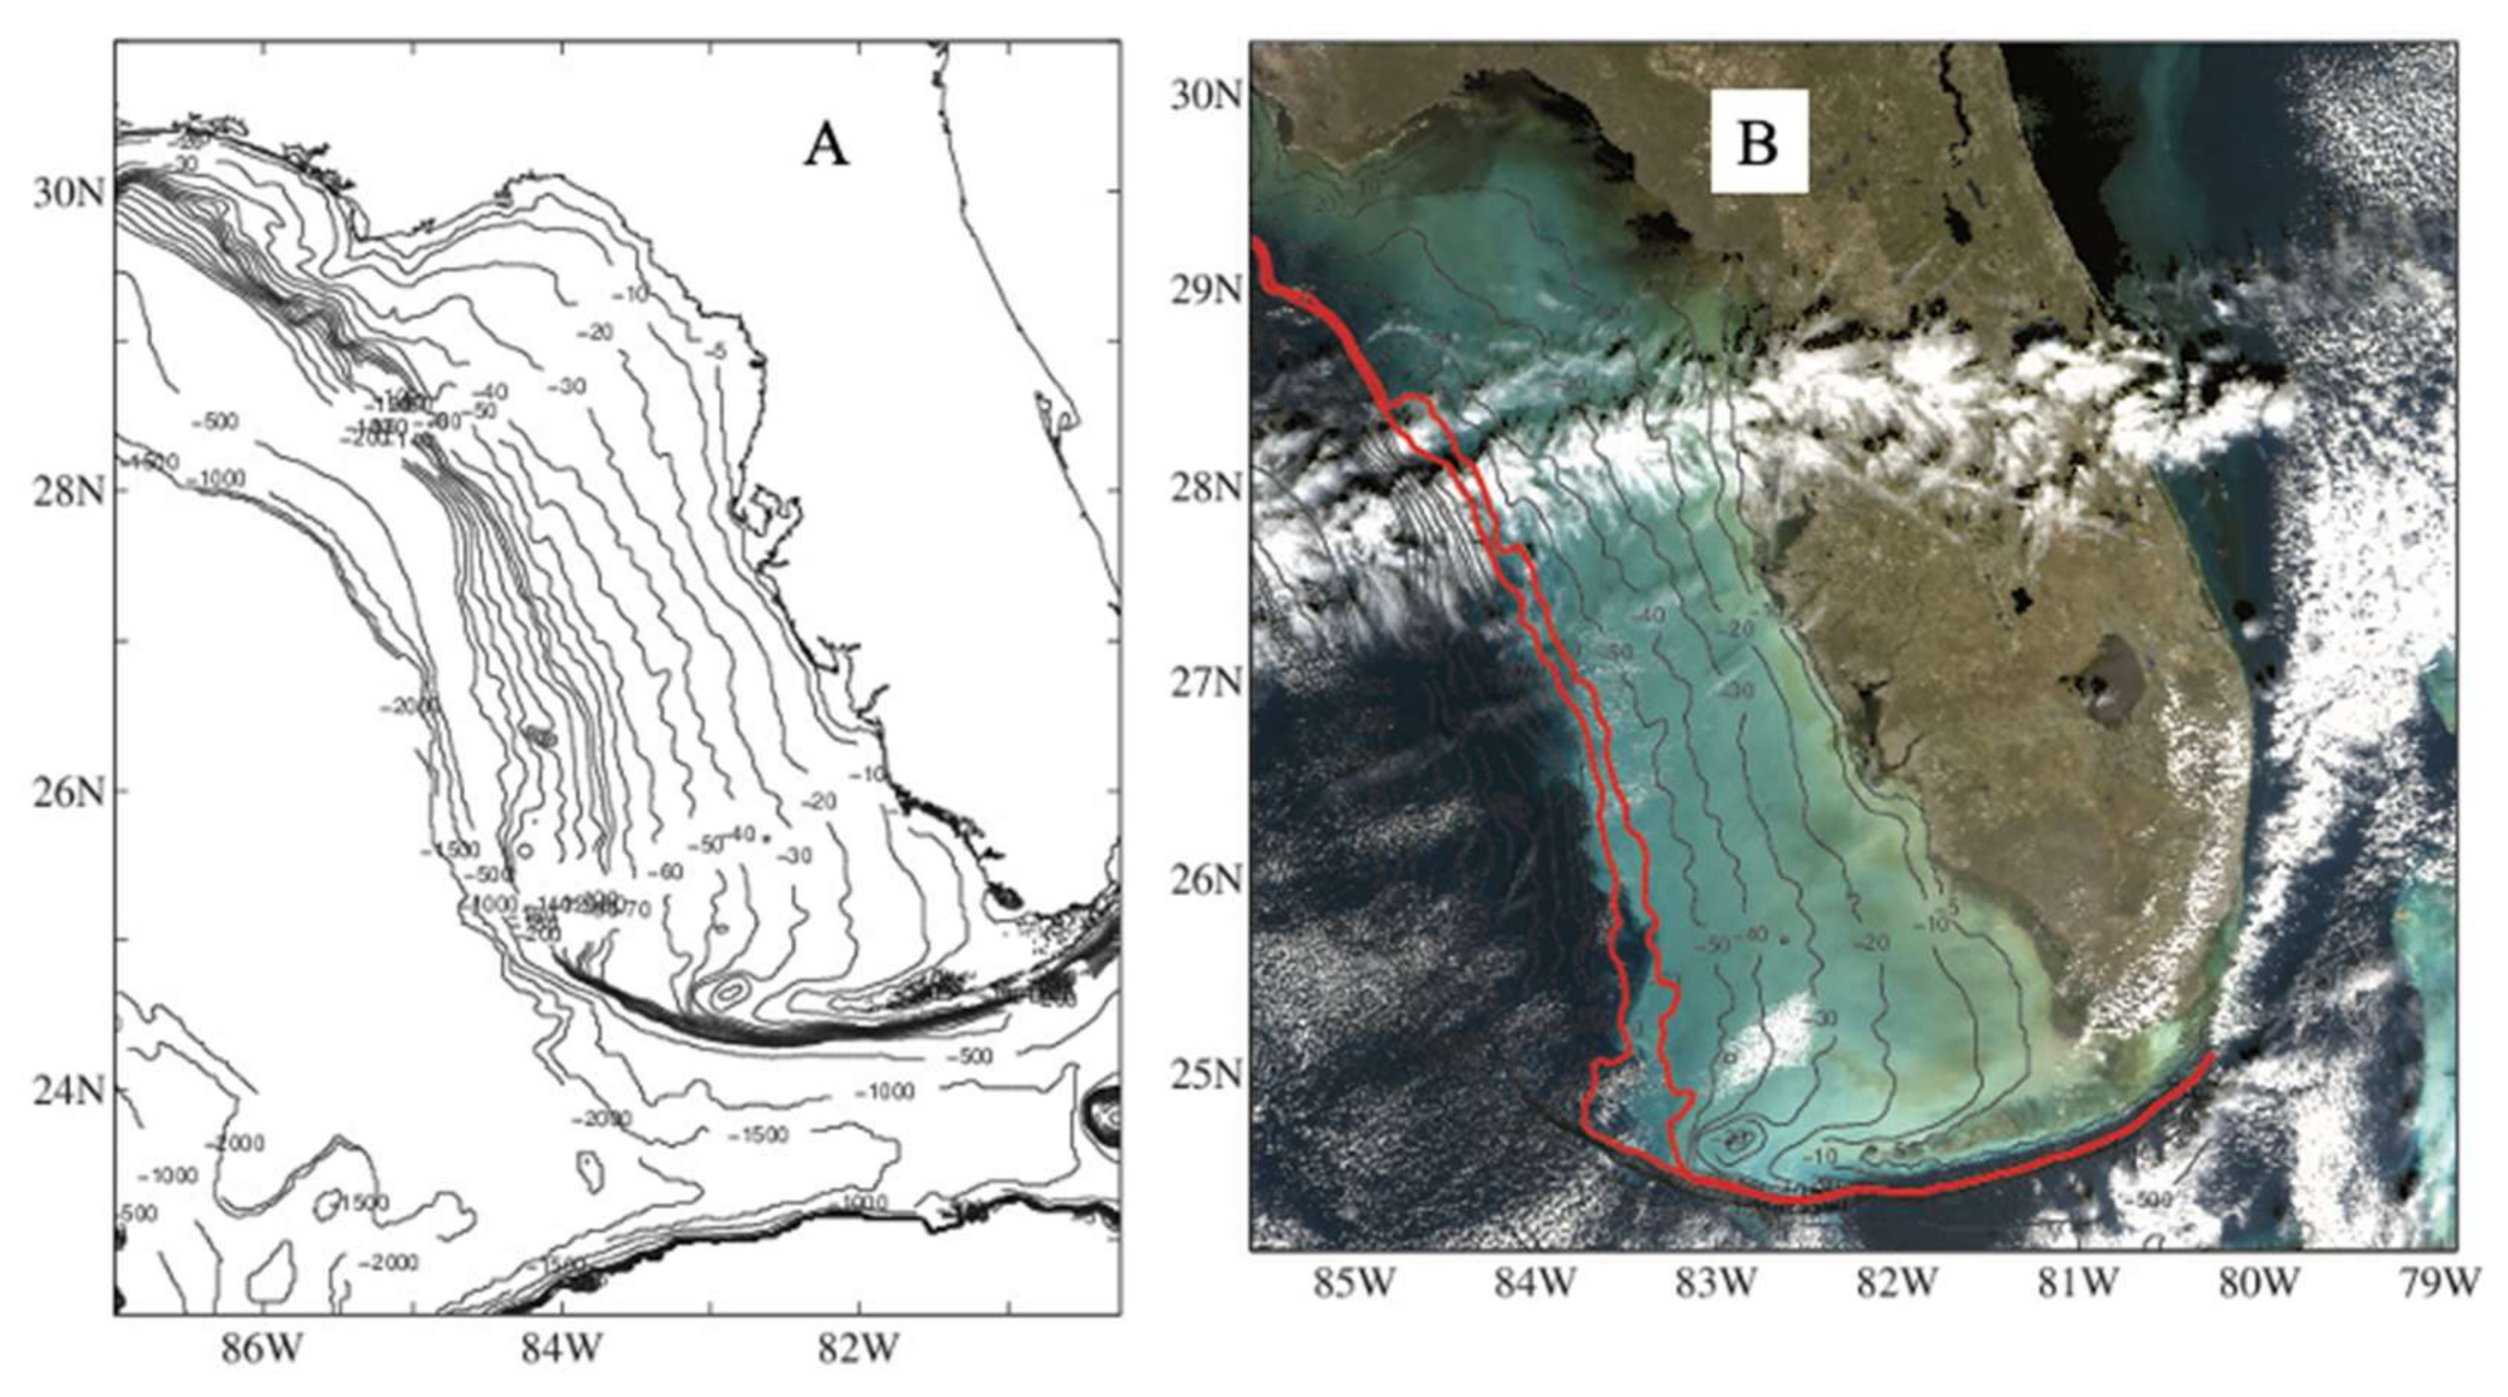
The TC image was overlaid upon the DBDB2 bathymetry (Figure 6). The anomalous water color appears to extend out to approximately the ~60–70 m isobathymetric contours and extend farther north over much of the WFS. The discontinuity in the color field corresponds to a sharp increase in the gradient of the bathymetry.

3.3. Merger of COAMPS Results with Satellite Images

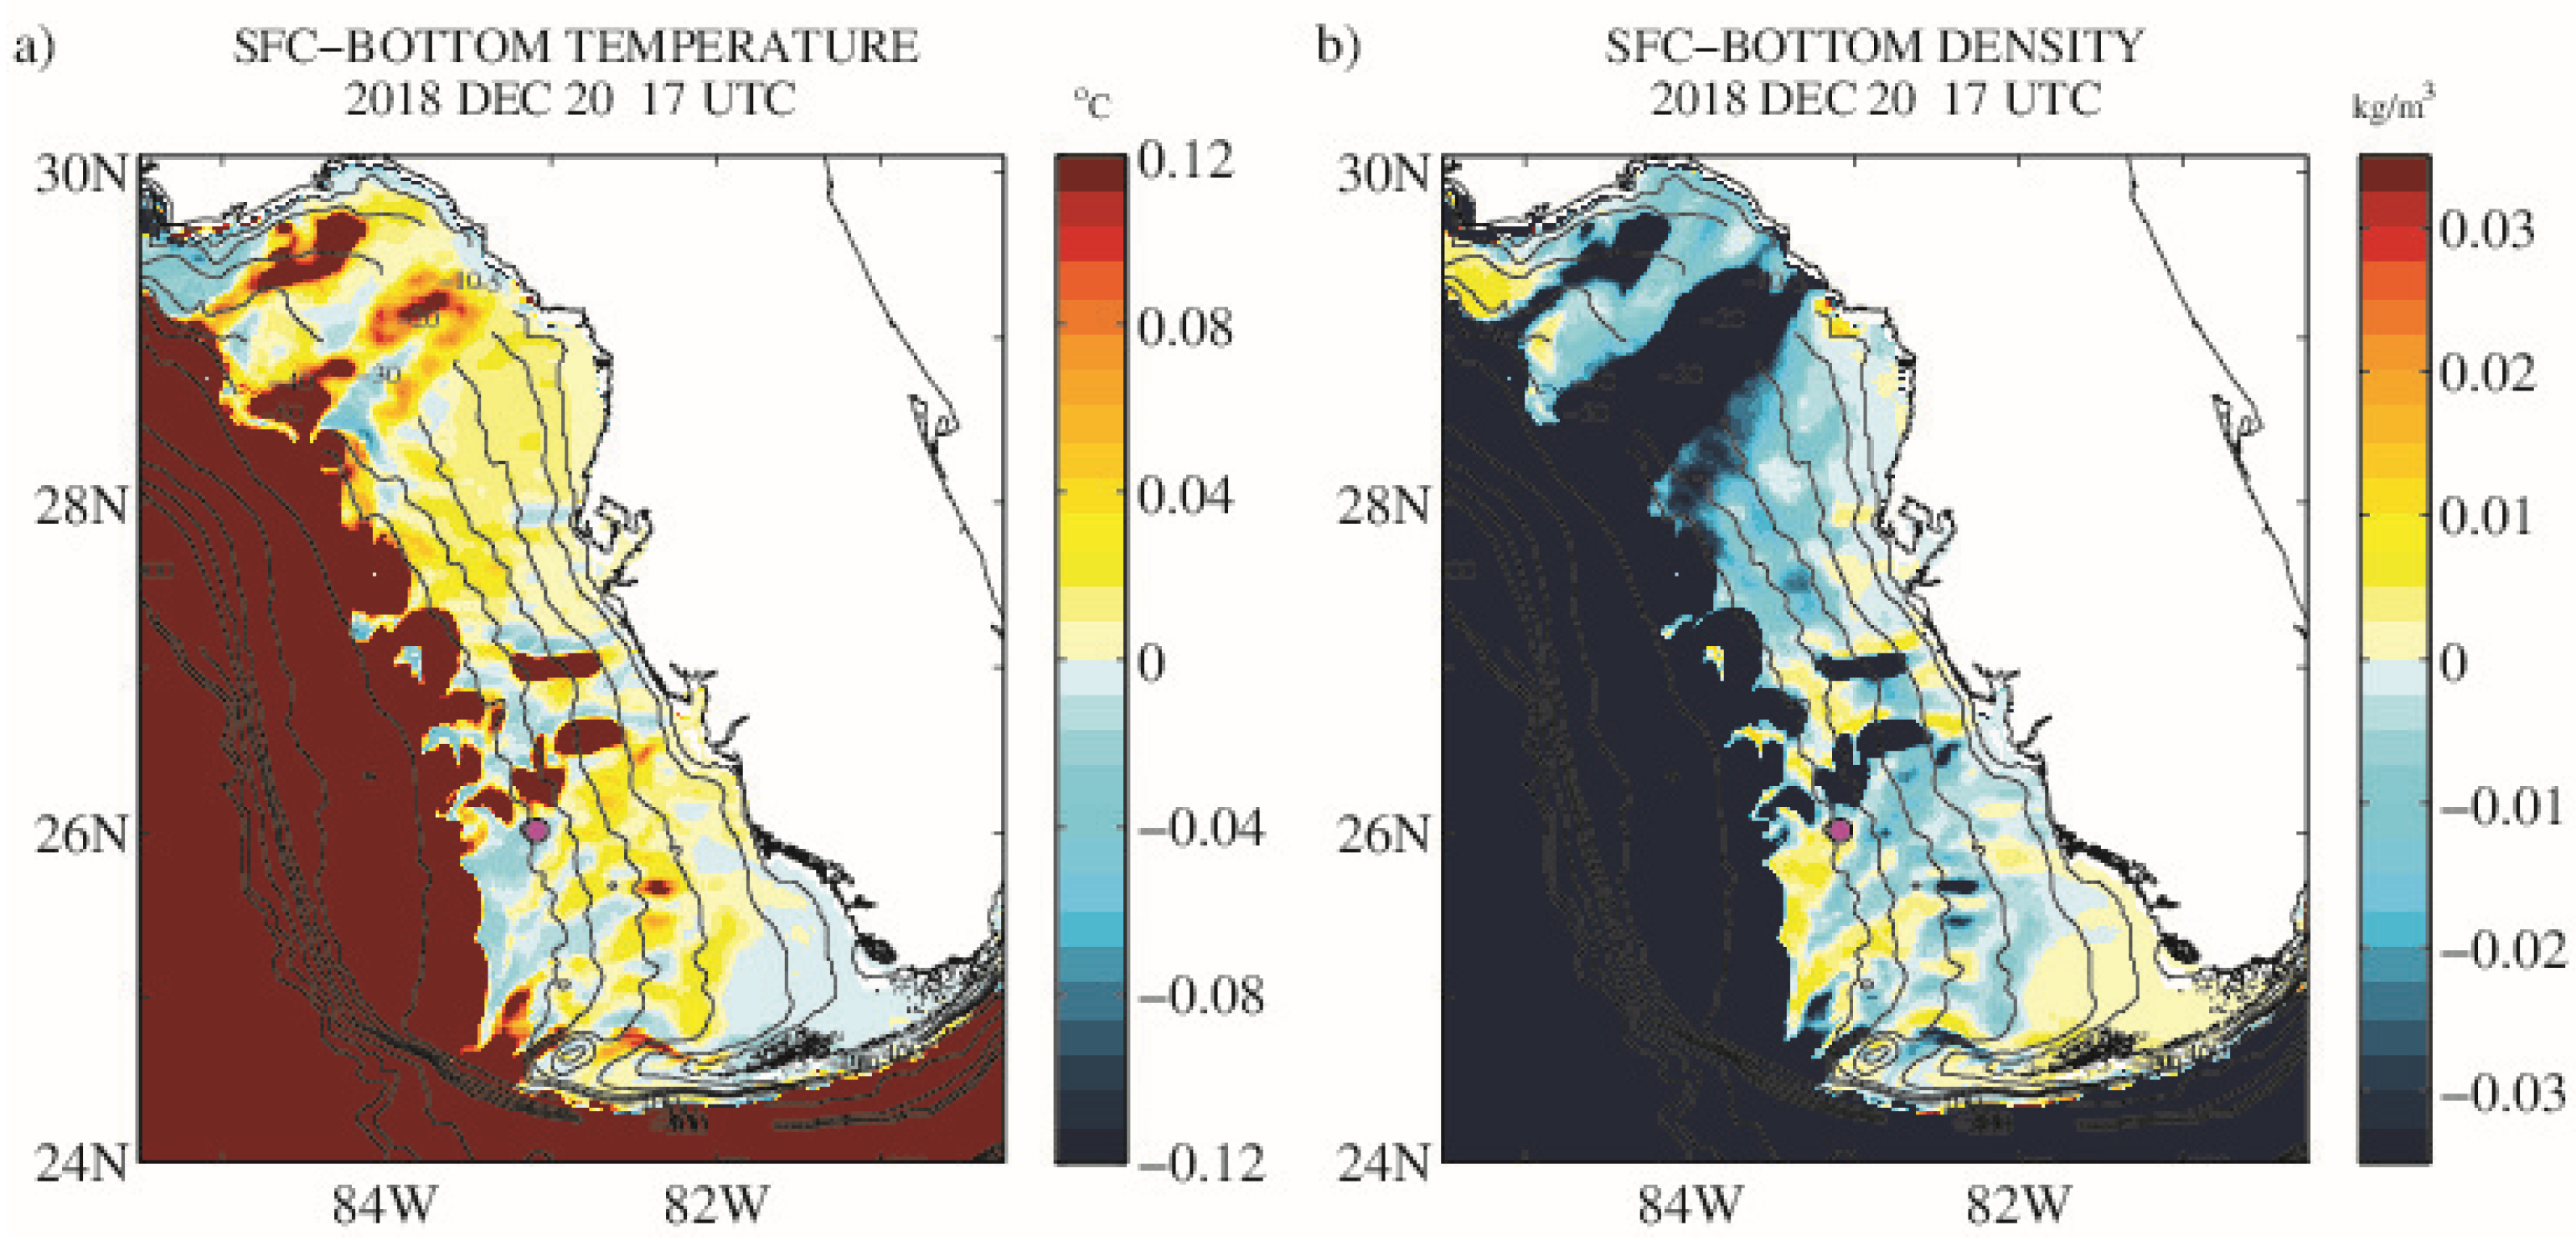
COAMPS simulations provide the physical context for the shelf water discoloration. As the cold front penetrates across the shelf, the intense heat loss at the air–sea interface sets up a dynamically unstable regime in the water column. For example, differences between the simulated surface and bottom temperatures and densities (σt) on 20 December 1700 UTC show some temperature inversions (where the surface water temperature is colder than the bottom temperature) on the WFS developing shoreward of the 100-m isobathymetric contour (Figure 7a). These areas are consistent with developing density inversions (Figure 7b).
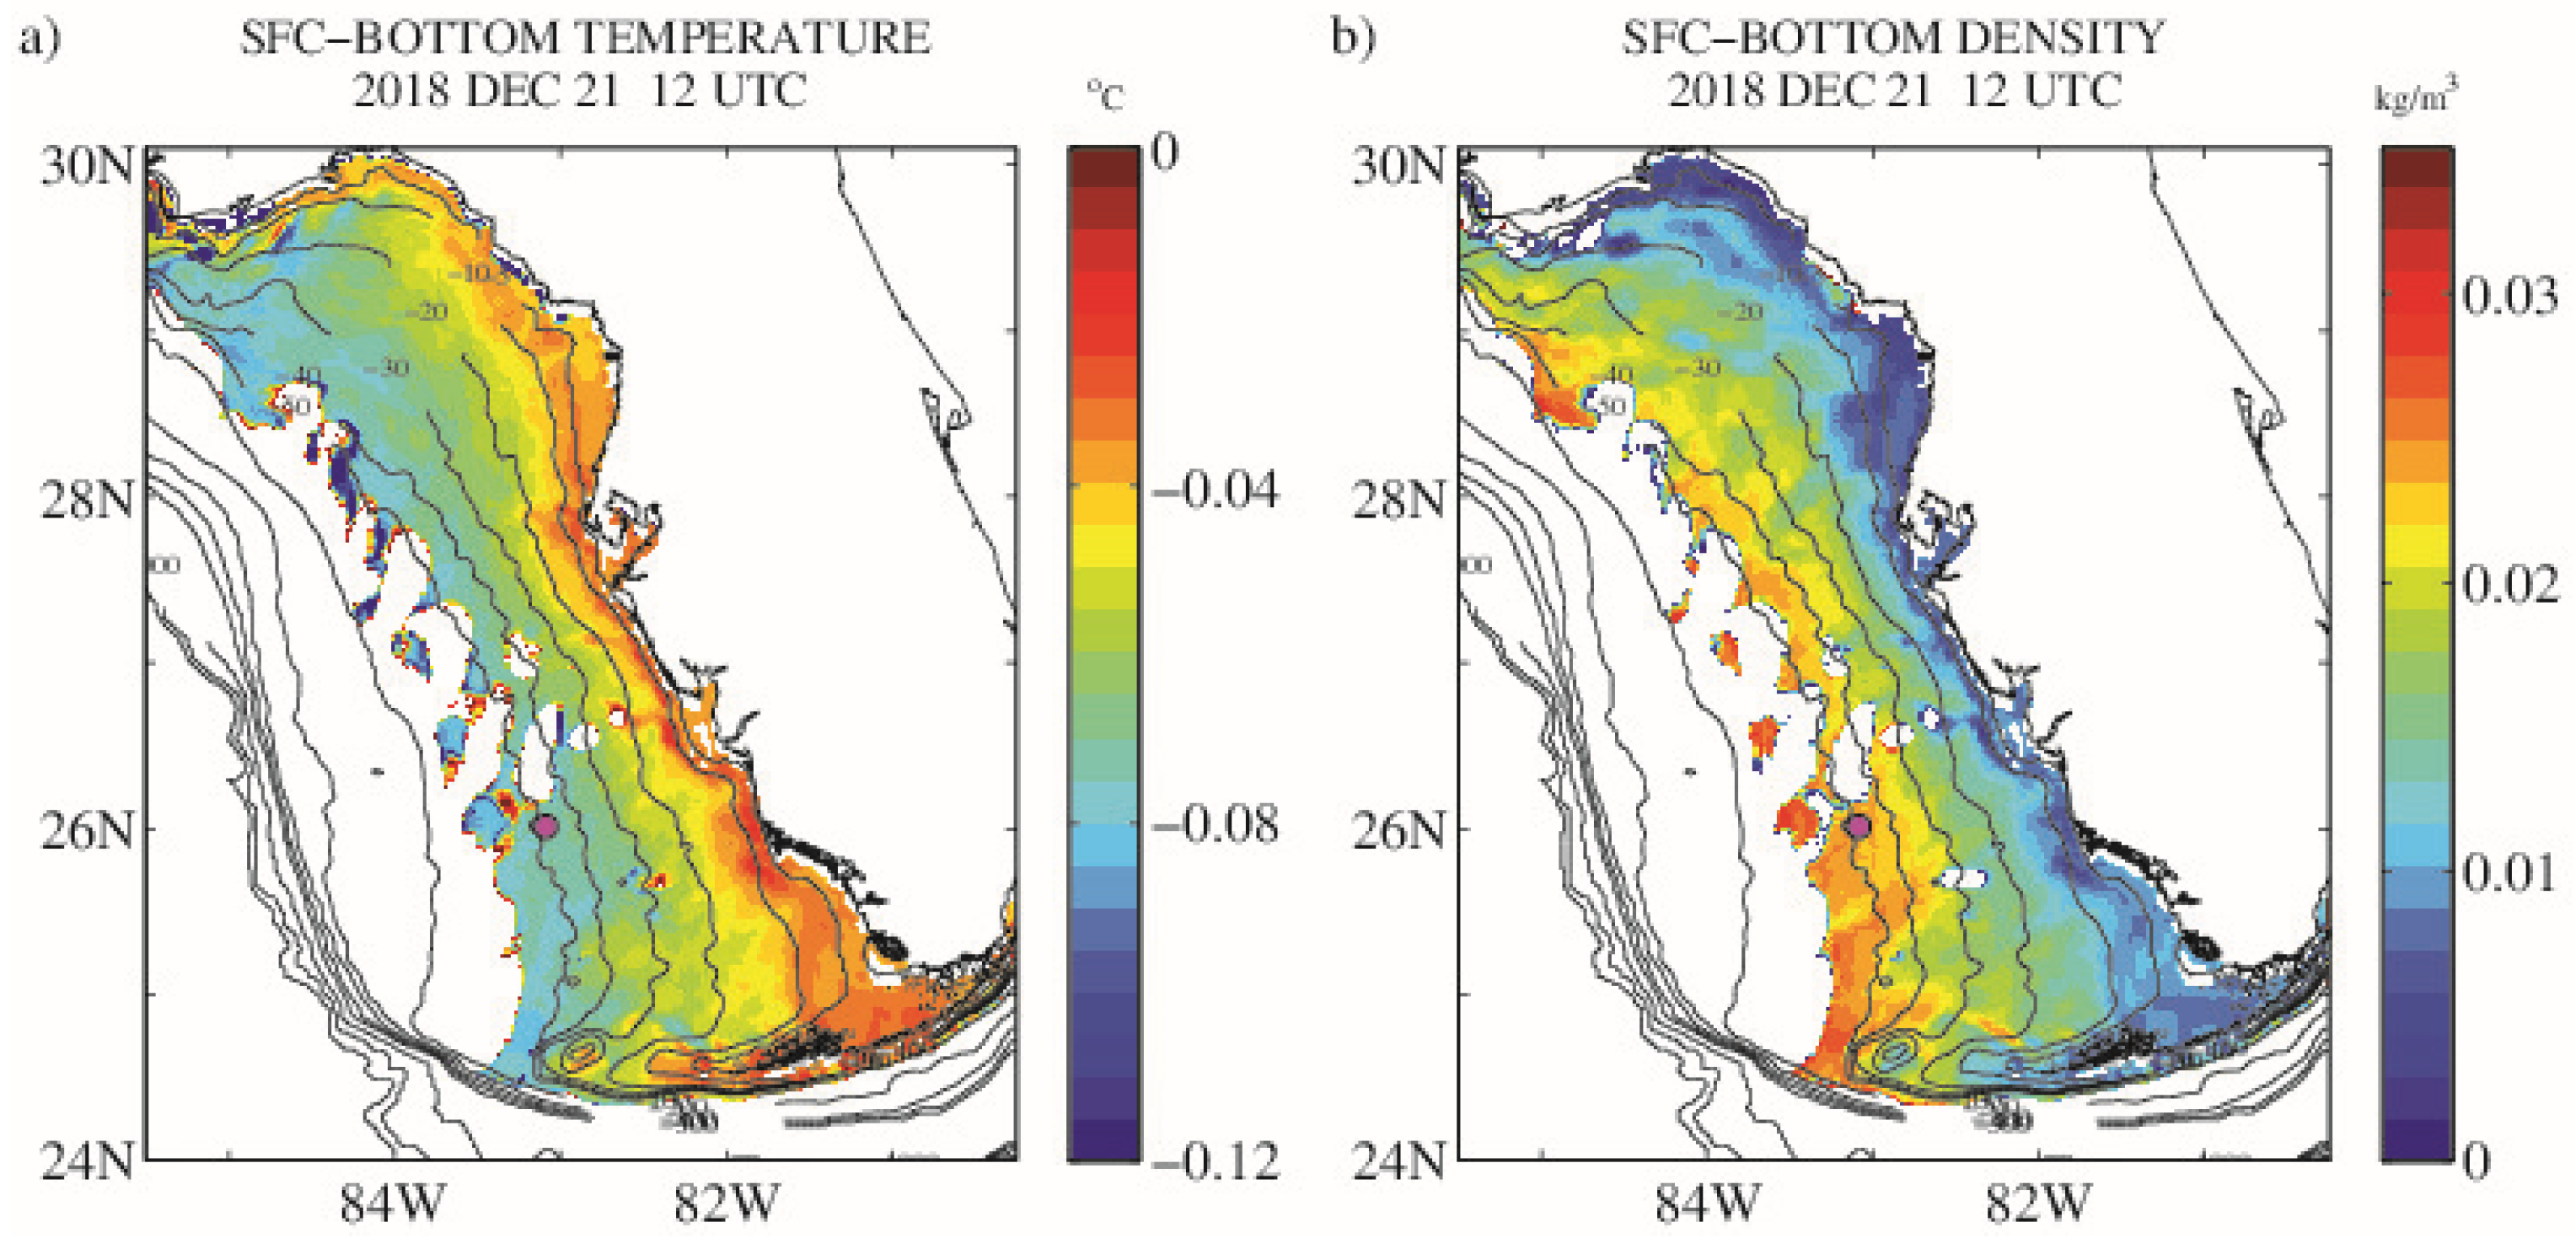
As the CAO event progresses, the development of temperature and density inversions across the shelf intensifies. By 21 December 1200 UTC, temperature inversions on the order of ~0.04 to 0.08 °C in magnitude are across much of the WFS (Figure 8a). The density inversions are much more severe and appear to approach maximum values (~0.035 kg m−3) approaching the westward terminus near the 60-m isobath (Figure 8b).
The temperature and density inversions shown in the COAMPS simulations were generally consistent with the patterns observed in the TC satellite images. Shown here, the COAMPS temperature inversions on 21 December (Figure 9a) were spatially consistent with the WFS water discoloration that was most clearly visible on 23 December in the VIIRS TC image (Figure 9b). The overlay of the temperature inversion contours upon the TC image shows that the discoloration was spatially consistent with the simulated instability (Figure 9c). This consistency suggests that the discoloration may result from convective turbulence occurring over the water column that results in either the direct resuspension of shelf particulates from the seafloor or the surface ventilation of bottom waters that contain a large concentration of resuspended particles.

3.4. High-Temporal Resolution GOES-R ABI Data

The discoloration of the WFS surface waters was not, in the initial stages, spatially homogenous. For example, an oblong region of the surface ocean, an approximately 147 km2 area, remained discordant from the surrounding waters (OLCI-1527 UTC; Figure 10A). This area of the surface ocean had a color signal of dark blue that more closely resembled the open GOM’s deeper waters, and it did not match the brightness color pattern seen in the surrounding surface waters. This area of the surface ocean was observed again by the VIIRS sensor a few hours later (VIIRS-1757 UTC; Figure 10B). In this subsequent TC image, there was no significant difference in the color pattern from the surrounding waters: the oblong color feature seen in the OLCI image a few hours previously was no longer discernable. This change suggests that the combined convective and wind-wave turbulence may result in some initial spatial inhomogeneity in the observed color pattern due to spatial differences in the resuspension of near-bottom particulate materials. As the turbulence persists, however, these inhomogeneities were removed over a short interval of time (~hours).
The color-enhanced ABI image sequence (GOES-East, [23]) clearly shows the temporal progress of the presumed vertical mixing (Supplementary Materials Video S1; Figure 11). The darker ocean area was discernable from 1400–1600 UTC (Figure 11A,B) and became less distinct through 1800 UTC (Figure 11C,D). The rapid hourly change in the surface water color properties over a large ocean area (~147 km2) suggests vertical mixing was the dominant physical process, as opposed to horizontal advection and diffusion. This change is consistent with the hypothesis that the discoloration is due primarily to the vertical resuspension of particulates.

3.5. Examination of Level-3 Inversion Products

The optical distinctiveness of this surface water discoloration is not as apparent in some of the standard inversion products. For example, the overall distribution of the satellite-estimated shelf surface chlorophyll-a concentration (CHL) on 16 Dec is not substantially different from 23 December (Figure 12). The shelf CHL values on both dates are in the ~0.4–2.0 mg m−3 range, with higher values closer to the Florida coast. On 16 December (Figure 12a), some coastal CHL values are modestly elevated compared to 23 December; however, there are more intermediate values (yellow color-scale contour) on 23 December (Figure 12b). The significantly different features seen in the TC images are not as obvious in the CHL product.
This nominal difference in surface CHL values did not apply to the remotely-sensed reflectance values (VIIRS) at multiple wavebands. For example, the 551 nm waveband (VIIRS) on 16 December values are in the ~0.003–0.015 Sr−1 (Figure 13a); on 23 December, the Rrs values have elevated beyond 0.03 Sr−1 (Figure 13b). Thus, some portions of the shelf have registered an order-of-magnitude increase in the reflectance signal (~0.003–0.03 Sr−1).
The standard CHL algorithm is based on remote sensing reflectance (Rrs) ratios [37]. The magnitude of Rrs in each waveband, neglecting wavelength and angular complexities, is proportional to the ratio of Inherent Optical Properties (IOPs) following:
R r s g b b t a t + b b t
where g is an empirical term to represent the wavelength and geometric complexities [38], bbt is the total backscattering coefficient, and at is the total absorption coefficient [39]. Under the hypothesis that the physical instability results in the turbulent resuspension of very fine-grained shelf carbonates, this would increase the backscattering coefficient [40]. Under the additional simplifying assumption that at >> bbt and Rrsbbt/(at), then the substantial and proportionate increase in bbt in the spectral bands used for the CHL algorithms may largely cancel out when the band ratios are examined. Thus, empirical band-ratio algorithms may register a modest change, although the optical conditions have changed significantly. This concept is consistent with the observation that resuspended particulates that act as very efficient backscattering agents of downwelling light also tend to increase the amplitude of the hyperspectral visible signal of the emerging, water-leaving radiance, as opposed to significantly changing the spectral shape [41].
Examination of the hyperspectral signals interpolated from the OLCI multispectral data appear consistent with the hypothesis that increased particle backscattering was amplifying the Rrs signal; however, there is some degree of change in the spectral shape as well. Extracted Rrs spectra reconstructed from OLCI visible bands were selected for 9 pixels around the location of buoy 42023 and spatially averaged for 18 December and 24 December (Figure 14). These spectra are compared to a representative turbid, coastal water spectrum obtained from the IOCCG reference spectra [42]. The 24 December spectrum is stronger than either of the other two spectra (Figure 14A). Increased reflectance values would result in a very high brightness value when the signal is converted to a true color reference frame. Differences in spectral shape are more apparent when the spectra are normalized by their respective maximum values (Figure 14B). The 18 December and 24 December spectra peak are near the 490 nm wavelength, however, the 24 December spectrum has more relative signal strength towards the green and red, whereas the 18 December has more relative blue (shorter wavelength) signal. Comparing the 24 December turbidity signal to the reference turbidity signal, the reference turbidity peak is shifted towards the red due to increased amounts of absorption from phytoplankton pigments and Chromophoric Dissolved Organic Matter (CDOM) in the shorter wavelengths, as is typical of coastal turbidity [43]. Consistent with the earlier examination of these different turbidity signatures [44], the 24 December turbidity peak is comparatively shifted towards the blue. This consistency suggests the 24 December “blue-shifted” turbidity signal is due to a large increase in particle backscattering that is not matched by a commensurate increase in blue light absorption, as would be expected of coastal turbidity plumes from rivers and estuaries that are rich in phytoplankton pigments and CDOM.
The band ratio chlorophyll algorithm [37,45] was applied to the spectra, and the resulting CHL values are indicated in Figure 14B. The CAO-induced turbidity results in a modest doubling of the chlorophyll product (chlorophyll tends to vary on a log-scale [46]), whereas the reference turbidity results in a satellite chlorophyll value of ~35 mg m−3. Thus, using the band-ratio chlorophyll product as a general indicator of turbidity or water clarity would be misleading in this particular case.
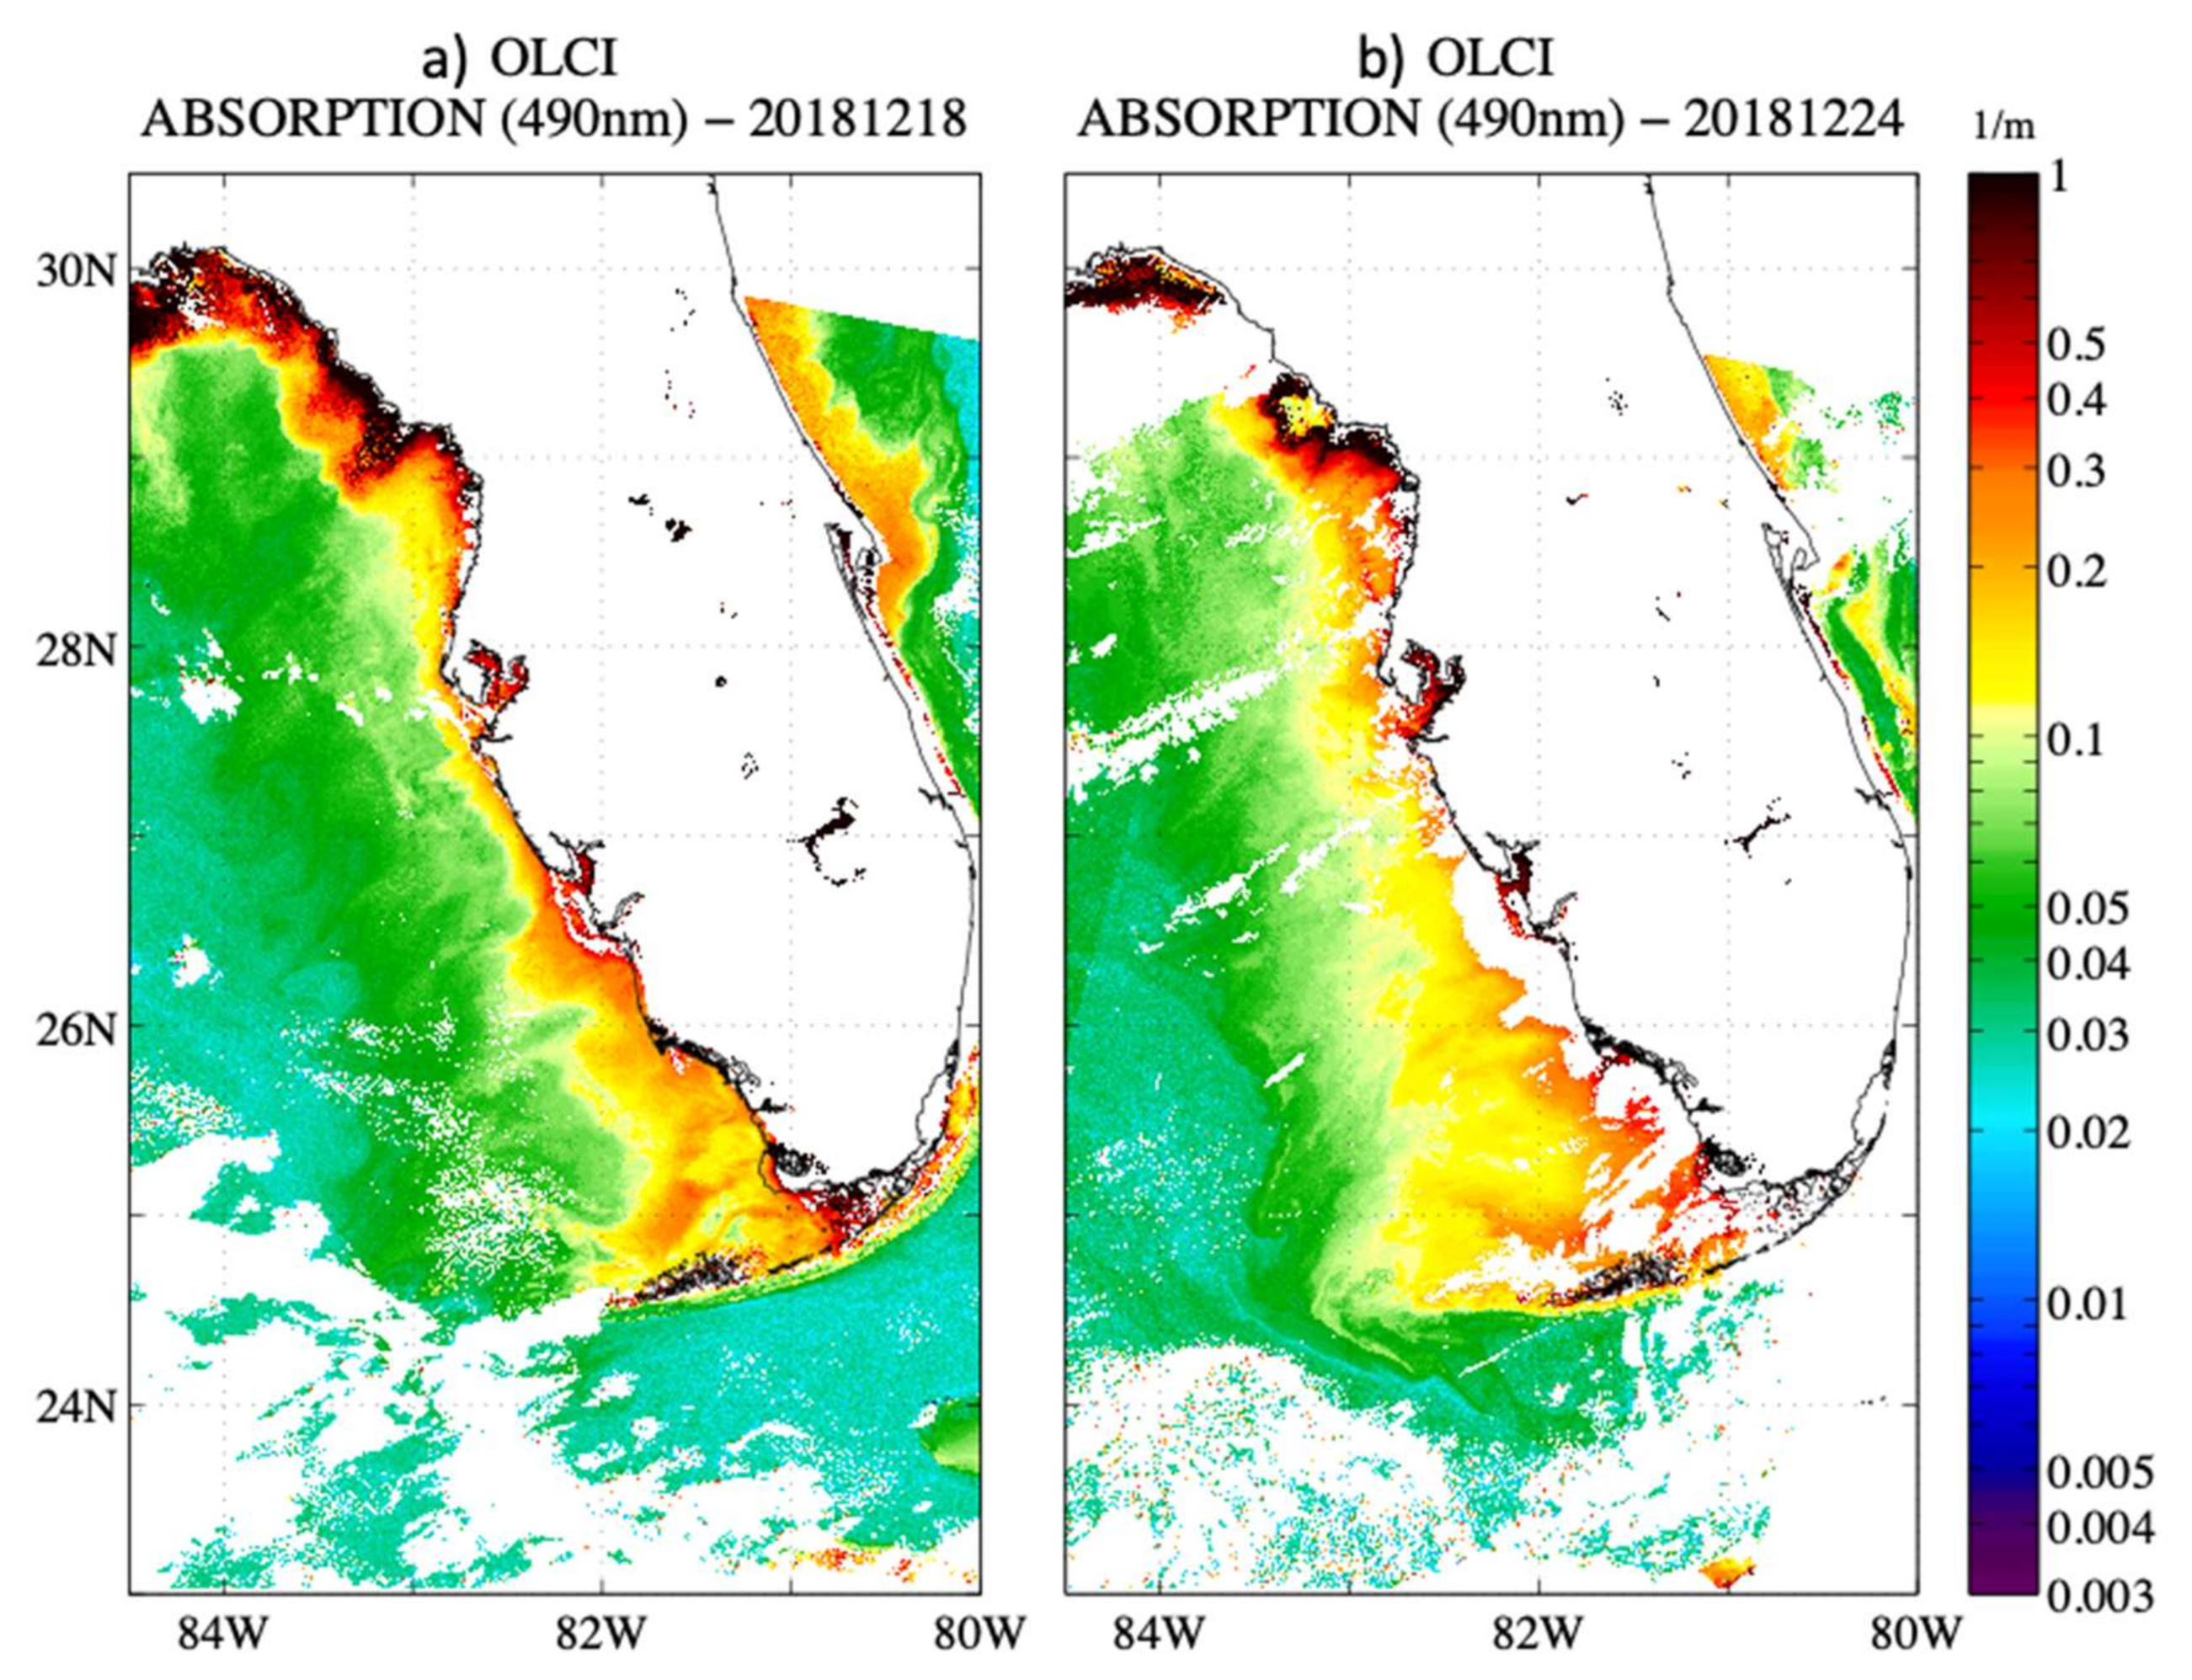
In contrast to CHL, the IOP inversion products are more informative and support the general inference of increased backscattering across the WFS. The Quasi-Analytic Algorithm (QAA) [47] was used to examine the total backscattering and absorption coefficients in the 490 nm band. To accommodate an increase in 490 nm Rrs from 0.005 to 0.038 Sr−1, one would require at least an order-of-magnitude increase in the backscattering coefficient if changes in absorption are marginal. Indeed, the QAA products support this inference (Figure 15). Backscattering coefficients, as estimated by the QAA product, increased from ~0.005 to ~0.05 m−1 in the area of buoy 42023.
The corresponding QAA total absorption coefficient products do not register nearly as dramatic of a change (Figure 16), although values are elevated on 24 December. The increase is not commensurate with the order-of-magnitude increase in the backscattering signal; thus, the reflectance values are accordingly elevated as well. This result also suggests the backscattering signal is primarily due to non-pigmented particles, that is, inorganic particulates. The likeliest source for such particles over such a vast area of the shelf is the underlying sediments.

4. Discussion

The surface ocean optical phenomenon examined in this paper is similar to the whiting events studied on the southern portion of the WFS [48]. The WFS whiting events examined by Long et al. [48] consist of <50 km2 patches of discolored surface water. Some characteristics of smaller-scale whitings reported by Long et al. are very similar to what is reported here. Specifically, there appears to be no large and substantial difference in surface CHL, as estimated by satellite, before or during the CAO event for large areas of the shelf. Long et al. also found no significant elevation of observed surface CHL within smaller whiting areas as compared to the surrounding surface seawater. Long et al. also found that remotely-sensed reflectance values (Rrs) were substantially increased within the discolored surface waters. This increase in Rrs was matched by a corresponding increase in particulate backscattering, while the overall shape of the Rrs spectra was largely unchanged.
Nonetheless, the space-time scales of the phenomenon reported herein and those of Long et al. are substantially different. The discoloration described here is orders of magnitude larger (~25,000 km2) and appears to be a regional shelf response to physical water column conditions. The discoloration case shown here lasts five days (21–25 December) and begins to dissipate thereafter; Long et al. report whiting patches on the WFS that last for weeks to months. The results shown here are more consistent with those of Conmy et al. [49]. These authors examined RGB (color) images constructed from MODIS data before and after a “winter storm event” in December 2004. They found that the post-storm event color brightness increased nearshore and attributed this color pattern to resuspended particulates resulting from elevated wind-driven turbulence.
Given these differences, it is less likely that the discoloration reported here is the result of either biologically mediated carbonate precipitation, as suggested by Long et al. for smaller patches of white water, or a synchronous and massive bloom of planktic cocclithophorids, which would also result in a similar surface water discoloration [50]. The regional-scale event described in this paper is more likely the result of a synoptic change in the water column’s physical stability. The WFS is overlaid by largely unconsolidated sediments consisting of biogenic carbonates and quartz [51]. Biogenic calcium carbonate constitutes >75% of the total sediment weight for large portions of the WFS [52], an area that corresponds to the surface water discoloration shown herein (Figure 4, Figure 5 and Figure 6). Biogenic carbonate particles, such as detached coccoliths from planktic coccolithophorids, have strong optical scattering properties [53]. The sediments also contain carbonate exoskeleton fragments that are eroded into progressively finer grains of carbonate [51]. Fine-scale carbonate particulates may remain suspended in the water column for an extended period of time and contribute to the persistent appearance of water column turbidity [48].
Thus, we hypothesize that the convective turbulence contributes to and sustains the persistent resuspension of fine-grained shelf carbonates, and this results in the water color discoloration seen in the satellite true color images as well as the increased backscattering coefficients and remotely-sensed reflectance. However, convective turbulence is not likely the sole mechanism of resuspension. Elevated winds and an excited surface wave field during the initial phase of the CAO event undoubtedly cause some resuspension in coastal areas through the combined effects of wind-driven currents, wave action, and Langmuir circulation [54]. Also, a downcoast or northerly wind stress will result in an upwelling mode of coastal circulation along the WFS [55]. The combination of upwelling-favorable wind stress and the breakdown of any shelf stratification may result in the elimination of discrete frictional boundary layers between the surface and bottom and then result in turbulent mixing.
Nevertheless, simple scaling arguments do lend support for the dominance of the convective turbulent mechanism over the extended duration of the CAO event. Ocean turbulence generated by surface winds decays away from the ocean surface as a function of depth [56]. Whereas this may be a sufficient source of bottom turbulence in nearshore areas (<~25 m depth) to resuspend sediments, it is a less satisfying explanation for sustained turbulence over deeper regions of the shelf (~60 m). The burst of intense wind stress corresponds to the initial propagation of the front (21 December). During the remaining period of the CAO (22–25 December), winds are less active (Figure 1A). In contrast, for areas where the water column density profile is unstable, turbulent energy is proportional to the surface buoyancy flux all across that unstable layer with little attenuation with depth [14].
Thus, we hypothesize that the surface water discoloration during the CAO event may be sustained by convective turbulence where such turbulence penetrates to the ocean bottom. This hypothesis would further suggest that the TC fields or the IOP backscattering coefficient products may indicate where this turbulence is occurring on the shelf during CAO events. As demonstrated herein, the process of combining TC images derived from ocean color sensors with numerical air–sea simulations can illuminate potential mechanisms that lead to observed surface ocean color patterns as well as identify phenomena that may be overlooked if one is solely examining standard level-3 ocean remote sensing products such as the chlorophyll-a concentration.
A more detailed spatiotemporal budgeting of turbulent energy is being analyzed from the COAMPS results during the CAO event for a follow-up paper; however, further testing of this hypothesis will require fieldwork and mooring deployments that occur during a CAO event. The focus within this paper has been the December 2018 CAO case study. However, CAO events are common and appear to be associated with similar episodes of shelf water discoloration. Under the presumption that the discoloration results from sediment resuspension, this suggests that CAO events may have critical biogeochemical consequences for shelf waters. In addition to particulates, resuspension events may release nutrients trapped in pore waters that may lead to subsequent biological productivity [57].

5. Conclusions

The correspondence between the simulated shelf-wide density inversions (σt) and the sustained surface ocean water discoloration strongly suggests that convective turbulence over the WFS areas shoreward of approximately the ~60-m isobathymetric contour contributes to the substantial water column turbidity through either the resuspension of bottom sediments or the ventilation of the bottom waters rich in suspended particulates. We hypothesize that where significant heat losses drive convective turbulence across the entirety of the water column, resuspended particulate materials consisting largely of carbonates create a distinct discoloration of the surface waters. Thus, areas of full-water column convective overturn and mixing may be detected with visible remote sensing methods during a CAO event, and true color images are particularly informative. Confirmation of this hypothesis will require in situ observations of surface water optical properties, above water radiometry, and analysis of the constituent particulate materials coincident with the satellite observations during an episodic CAO event. Further numerical modeling studies with sediment models integrated into the air–sea modeling system (COAMPS) would also elucidate the potential mechanisms leading to the observed phenomenon.

Supplementary Materials

The following are available online at https://www.mdpi.com/2072-4292/13/4/619/s1, Video S1: Color-Enhanced GOES-ABI Image Sequence, West Florida Shelf, 21 December 2018.

Author Contributions

conceptualization, J.K.J.; methodology, J.K.J., S.L., T.A.S., S.A., A.L., S.C.M. and M.D.L.; software, J.K.J., M.D.L., S.L., A.L. and S.A.; formal analysis, J.K.J., E.J., S.L., T.A.S. and R.L.C.; investigation, J.K.J., S.L., M.D.L., S.C.M., S.A., T.A.S., A.L. and E.J.; resources, J.K.J., S.C.M. and R.L.C.; data curation, J.K.J., T.A.S., S.L., A.L. and M.D.L.; writing—original draft preparation, J.K.J., S.L., E.J. and S.A.; writing—review and editing, J.K.J., S.L., T.A.S., S.A., M.D.L., S.C.M., R.L.C., E.J. and A.L.; visualization, J.K.J., S.A., A.L., M.D.L. and S.C.M.; supervision, R.L.C.; project administration, J.K.J. and R.L.C.; funding acquisition, J.K.J. and R.L.C. All authors have read and agreed to the published version of the manuscript.

Funding

This research was funded by the NRL 6.1 Program “Integrated Radiometric Indices of Surface Ocean Features”.

Institutional Review Board Statement

Not Applicable.

Informed Consent Statement

Not Applicable.

Data Availability Statement

Satellite ocean color area available from NASA (https://oceandata.sci.gsfc.nasa.gov); GOES-ABI data area available from NOAA (https://www.avl.class.noaa.gov/saa/products/welcome); Oceanographic and meteorological buoy data in the Gulf of Mexico are available from NOAA NDBC (https://www.ndbc.noaa.gov). COAMPS model results are archived at the U.S. Naval Research Laboratory, Stennis Space Center, MS, USA; additional requests are handled through the NRL Public Affairs Office: (https://www.nrl.navy.mil/News-Media/).

Acknowledgments

Authors thank two anonymous reviewers for providing insights that improved the manuscript.

Conflicts of Interest

The authors declare no conflict of interest.

References

  1. Nowlin, W.D.; Parker, C.A. Effects of a Cold-Air Outbreak on Shelf Waters of the Gulf of Mexico. J. Phys. Oceanogr. 1974, 4, 467–486. [Google Scholar] [CrossRef]
  2. Villanueva, E.E.; Mendoza, V.M.; Adem, J. Sea surface temperature and mixed layer depth changes due to cold-air outbreak in the Gulf of Mexico. Atmosfera 2010, 23, 325–346. [Google Scholar]
  3. Schroeder, W.W.; Huh, O.K.; Rouse, L.J.; Wiseman, W.J. Satellite Observations of the Circulation East of the Mississippi Delta: Cold-Air Outbreak Conditions. Remote Sens. Environ. 1985, 18, 49–58. [Google Scholar] [CrossRef]
  4. Dagg, M.J. Physical and biological responses to the passage of a winter storm in the coastal and inner shelf waters of the northern Gulf of Mexico. Cont. Shelf Res. 1988, 8, 167–178. [Google Scholar] [CrossRef]
  5. Zavala-Hidalgo, J.; Romero-Centeno, R.; Mateos-Jasso, A.; Morey, S.L.; Martinez-Lopez, B. The response of the Gulf of Mexico to wind and heat flux forcing: What has been learned in recent years? Atmosfera 2014, 27, 317–334. [Google Scholar] [CrossRef] [Green Version]
  6. Passalacqua, G.A.; Sheinbaum, J.; Martinez, J.A. Sea surface temperature influence on a winter cold front position and propagation: Air-sea interactions of the ‘Nortes’ winds in the Gulf of Mexico. Atmos. Sci. Lett. 2016, 17, 302–307. [Google Scholar] [CrossRef]
  7. DiMego, G.J.; Bosart, L.F.; Endersen, G.W. An examination of the frequency and mean conditions surrounding frontal incursions into the Gulf of Mexico and Caribbean Sea. Mon. Weather Rev. 1976, 104, 709–718. [Google Scholar] [CrossRef] [Green Version]
  8. Pérez, E.P.; Magaña, V.; Caetano, E.; Kusunoki, S. Cold surge activity over the Gulf of Mexico in a warmer climate. Front. Earth Sci. 2014, 2, 19. [Google Scholar] [CrossRef] [Green Version]
  9. Hunniford, R. The Impact of Marine Cold-Air Outbreaks on the Rate of Oceanic Heat Storage in the Gulf of Mexico. Master’s Thesis, Florida State University, Tallahassee, FL, USA, 2011. Available online: http://purl.flvc.org/fsu/fd/FSU_migr_etd-3400 (accessed on 15 October 2020).
  10. Huh, O.K.; Wiseman, W.J., Jr.; Rouse, L.J., Jr. Winter cycle of sea surface thermal patterns, northeastern Gulf of Mexico. J. Geophys. Res. 1978, 83, 4523–4529. [Google Scholar] [CrossRef]
  11. Walker, N.D.; Rouse, L.J.; Huh, O.K. Response of subtropical shallow-water environments to cold-air outbreak events: Satellite radiometry and heat flux modeling. Cont. Shelf Res. 1987, 7, 735–757. [Google Scholar] [CrossRef]
  12. Moum, J.; Smyth, W.D. Upper Ocean Mixing Processes. In Encyclopedia of Ocean Sciences; Steele, J.H., Ed.; Academic Press: Cambridge, MA, USA, 2001; pp. 3093–3100. [Google Scholar]
  13. Shay, T.J.; Gregg, M.C. Convectively driven turbulent mixing in the upper ocean. J. Phys. Oceanogr. 1986, 16, 1777–1798. [Google Scholar] [CrossRef]
  14. Lombardo, C.P.; Gregg, M.C. Similarity scaling of viscous and thermal dissipation in a convecting surface boundary layer. J. Geophys. Res. Ocean. 1989, 94, 6273–6284. [Google Scholar] [CrossRef]
  15. Zikanov, O.; Slinn, D.N.; Dhanak, M.R. Turbulent convection driven by surface cooling in shallow water. J. Fluid Mech. 2002, 464, 81–111. [Google Scholar] [CrossRef] [Green Version]
  16. Larson, E.B.; Mylroie, J.E. A review of whiting formation in the Bahamas and new models. Carbonates Evaporites 2014, 29, 337–347. [Google Scholar] [CrossRef]
  17. Morse, J.W.; Gledhill, D.K.; Millero, F.J. Caco3 precipitation kinetics in waters from the great Bahama bank: Implications for the relationship between bank hydrochemistry and whitings. Geochim. Cosmochim. Acta 2003, 67, 2819–2826. [Google Scholar] [CrossRef]
  18. Wernand, M.R.; Hommersom, A.; Van der Woerd, H.J. MERIS-based ocean colour classification with the discrete Forel-Ule scale. Ocean. Sci. 2013, 9, 477–487. [Google Scholar] [CrossRef] [Green Version]
  19. Mobley, C.D. Light and Water; Academic Press: San Diego, CA, USA, 1994; p. 595. [Google Scholar]
  20. Jerlov, N.G. Marine Optics, 2nd ed.; Elsevier Oceanography Series 14; Elsevier: New York, NY, USA, 1976; p. 231. [Google Scholar]
  21. Vandermeulen, R.A.; Mannino, A.; Craig, S.E.; Werdell, P.J. 150 shades of green: Using the full spectrum of remote sensing reflectance to elucidate color shifts in the ocean. Remote Sens. Environ. 2020, 247, 111900. [Google Scholar] [CrossRef]
  22. Jolliff, J.K.; Jarosz, E.; Ladner, S.; Smith, T.; Anderson, S.; Dykes, J. The Optical Signature of a Bottom Boundary Layer Ventilation Event in the Northern Gulf of Mexico’s Hypoxic Zone. Geophys. Res. Lett. 2018, 45, 8390–8398. [Google Scholar] [CrossRef] [Green Version]
  23. Jolliff, K.J.; Lewis, D.M.; Ladner, S.; Crout, L.R. Observing the Ocean Submesoscale with Enhanced-Color GOES-ABI Visible Band Data. Sensors 2019, 19, 3900. [Google Scholar] [CrossRef] [PubMed] [Green Version]
  24. Ladner, S.; Crout, R.; Lawson, A.; Martinolich, P.M.; Bowers, J.; Arnone, R.A. Validation Test Report for the Automated Optical Processing System (AOPS) Version 16. In U.S. Naval Research Laboratory Technical Memorandum; NRL/MR/7330-16-9697; United States Naval Research Laboratory: Washington, DC, USA, 2016; p. 78. [Google Scholar]
  25. Mobley, C.D.; Werdell, P.J.; Franz, B.A.; Ahmad, Z.; Bailey, S. Atmospheric Correction for Satellite Ocean Color Radiometry: A Tutorial and Documentation of the Algorithms Used by the NASA Ocean Biology Processing Group NASA/TM-2016-217551, GSFC-E-DAA-TN35509. Available online: https://oceancolor.gsfc.nasa.gov/docs/technical/NASA-TM-2016-217551.pdf (accessed on 22 December 2020).
  26. CIE. CIE 15, International Commisssioin on Illumination, Technical Report: Colorimetry, 3rd ed.; 10 CFR 430 Subpart B, App. R. 4.1.1; Carter, E.C., Ohno, Y., Pointer, M.R., Robertson, A.R., Seve, R., Schanda, J.D., Witt, K., Eds.; International Commission on Illumination: Vienna, Austria, 2004; p. 82. ISBN 3-901-906-33-9. [Google Scholar]
  27. Broadbent, A. Colorimetry, Methods. In Encyclopedia of Spectroscopy and Spectrometry, 3rd ed.; Lindon, J.C., Ed.; Academic Press: Cambridge, MA, USA, 2017. [Google Scholar] [CrossRef]
  28. Lewis, M.D.; Jolliff, J.K.; Ladner, S.; McCarthy, S.; Lawson, A.; Martinolich, P. Delineation of suspended solids in river outflow from Hurricane Florence using GOES-16 ABI data. In Ocean Sensing and Monitoring XI; International Society for Optics and Photonics: Baltimore, MD, USA, 2019; Volume 11014, p. 110140B. [Google Scholar] [CrossRef]
  29. Hodur, R.M. The Naval Research Laboratory’s Coupled Ocean/Atmosphere Mesoscale Prediction System (COAMPS). Mon. Weather Rev. 1997, 125, 1414–1430. [Google Scholar] [CrossRef]
  30. Barron, C.N.; Kara, A.B.; Hurlburt, H.E.; Rowley, C.; Smedstad, L.F. Sea surface height predictions from the Global Navy Coastal Ocean Model (NCOM) during 1998–2001. J. Atmos. Ocean. Technol. 2004, 21, 1876–1894. [Google Scholar] [CrossRef] [Green Version]
  31. Small, R.J.; Carniel, S.; Campbell, T.; Teixeira, J.; Allard, R. The response of the Ligurian and Tyrrhenian Seas to a summer Mistral event: A coupled atmosphere–ocean approach. Ocean. Model. 2012, 48, 30–44. [Google Scholar] [CrossRef] [Green Version]
  32. Martin, P.J. Description of the Navy Coastal Ocean. Model. 1.0; United States Naval Research Laboratory Memorandum Report 7322—00-9962; U.S. Naval Research Laboratory: Washginton, DC, USA, 2000; p. 45. [Google Scholar]
  33. Rosmond, T.E.; Teixeira, J.; Peng, M.; Hogan, T.F.; Pauley, R. Navy Operational Global Atmospheric Prediction System (NOGAPS): Forcing for Ocean Models. Oceanography 2002, 15. [Google Scholar] [CrossRef] [Green Version]
  34. Chen, S.; Campbell, T.J.; Jin, H.; Gabersek, A.; Hodur, R.M.; Martin, P.J. Effect of two-way air-sea coupling in high and low wind speed regimes. Mon. Weather Rev. 2010, 138, 3579–3602. [Google Scholar] [CrossRef]
  35. Allard, R.; Smith, T.A.; Jensen, T.G.; Chu, P.Y.; Roger, E.; Campbell, T.J. Validation Test. Report for the Coupled Ocean/Atmosphere Mesoscale Prediction System (COAMPS) Version 5.0: Ocean/Wave Component Validation; Naval Research Laboratory Memorandum Report 7320—12-9423; U.S. Naval Research Laboratory: Washington, DC, USA, 2012; p. 91. [Google Scholar]
  36. Marshall, J.; Schott, F. Open-ocean convection: Observations, theory, and models. Rev. Geophys. 1999, 37, 1–64. [Google Scholar] [CrossRef] [Green Version]
  37. O’Reilly, J.E.; Werdell, P.J. Chlorophyll algorithms for ocean color sensors-OC4, OC5 & OC6. Remote Sens. Environ. 2019, 229, 32–47. [Google Scholar] [CrossRef] [PubMed]
  38. Morel, A.; Gentili, B. Diffuse reflectance of oceanic waters III. Implication of bidirectionality for the remote sensing problem. Appl. Opt. 1996, 35, 4850–4862. [Google Scholar] [CrossRef] [PubMed]
  39. Gordon, H.R. Dependence of the diffuse reflectance of natural waters on the sun angle. Limnol. Oceanogr. 1989, 34, 1484–1489. [Google Scholar] [CrossRef]
  40. Balch, W.M.; Gordon, H.R.; Bowler, B.C.; Drapeau, D.T.; Booth, E.S. Calcium carbonate measurements in the surface global ocean based on Moderate-Resolution Imaging Spectroradiometer data. J. Geophys. Res. Ocean. 2005, 110. [Google Scholar] [CrossRef]
  41. Mélin, F.; Vantrepotte, V. How optically diverse is the coastal ocean? Remote Sens. Environ. 2015, 160, 235–251. [Google Scholar] [CrossRef]
  42. IOCCG. Remote Sensing of Inherent Optical Properties: Fundamentals, Tests of Algorithms, and Applications; Reports of the International Ocean-Colour Coordinating Group, No. 5; Lee, Z.-P., Ed.; IOCCG: Dartmouth, NS, Canada, 2006; p. 126. [Google Scholar]
  43. Spyrakos, E.; O’Donnell, R.; Hunter, P.D.; Miller, C.; Scott, M.; Simis, S.G.H.; Neil, C.; Barbosa, C.C.F.; Binding, C.E.; Bradt, S.; et al. Optical types of inland and coastal waters. Limnol. Oceanogr. 2018, 63, 846–870. [Google Scholar] [CrossRef] [Green Version]
  44. Jolliff, J.K.; Ladner, S.; Lewis, M.D.; Jarosz, E.; Lawson, T.A.; Smith, T.A.; Penko, A.; McCarthy, S. Hyperspectral determination of ocean color as an ocean monitoring tool: Example applications in the Gulf of Mexico. In Proceedings of the SPIE 10631, Ocean Sensing and Monitoring X, Orlando, FL, USA, 25 May 2018. [Google Scholar] [CrossRef]
  45. Werdell, P.J.; Bailey, S.W. An improved in-situ bio-optical data set for ocean color algorithm development and satellite data product validation. Remote Sens. Environ. 2005, 98, 122–140. [Google Scholar] [CrossRef]
  46. Campbell, J.W. The lognormal distribution as a model for bio-optical variability in the sea. J. Geophys. Res. 1995, 100, 13237–13254. [Google Scholar] [CrossRef]
  47. Lee, Z.P.; Carder, K.L.; Arnone, R.A. Deriving inherent optical properties from water color: A multiband quasi-analytical algorithm for optically deep waters. Appl. Opt. 2002, 41, 5755–5772. [Google Scholar] [CrossRef]
  48. Long, J.S.; Hu, C.; Robbins, L.L.; Byrne, R.H.; Paul, J.H.; Wolny, J.L. Optical and biochemical properties of a southwest Florida whiting event. Estuar. Coast. Shelf Sci. 2017, 196, 258–268. [Google Scholar] [CrossRef]
  49. Conmy, R.N.; Coble, P.G.; Cannizzaro, J.P.; Heil, C.A. Influence of extreme storm events on West Florida Shelf CDOM distributions. J. Geophys. Res. Biogeosci. 2009, 114. [Google Scholar] [CrossRef]
  50. D’Sa, E.J.; Joshi, I.D.; Liu, B.; Ko, D.S.; Osburn, C.L.; Bianchi, T.S. Biogeochemical Response of Apalachicola Bay and the Shelf Waters to Hurricane Michael Using Ocean Color Semi-Analytic/Inversion and Hydrodynamic Models. Front. Mar. Sci. 2019, 6, 523. [Google Scholar] [CrossRef]
  51. Hallock, P.; Robbins, L.L.; Larson, R.; Beck, T.; Schwing, P.; Martinez-Colon, M.; Gooch, B. West Florida Shelf: A Natural Laboratory for the Study of Ocean Acidification; U.S. Geological Survey Open-File Report 2010-1134; USGS: St. Petersburg, FL, USA, 2010; 95p. [Google Scholar]
  52. Davis, R.A. Sediments of the Gulf of Mexico. In Habitats and Biota of the Gulf of Mexico: Before the Deepwater Horizon Oil Spill: Volume 1: Water Quality, Sediments, Sediment Contaminants, Oil and Gas Seeps, Coastal Habitats, Offshore Plankton and Benthos, and Shellfish; Ward, C.H., Ed.; Springer: New York, NY, USA, 2017; pp. 165–215. [Google Scholar] [CrossRef] [Green Version]
  53. Balch, W.M.; Bowler, B.C.; Drapeau, D.T.; Lubelczyk, L.C.; Lyczkowski, E. Vertical Distributions of Coccolithophores, PIC, POC, Biogenic Silica, and Chlorophyll a Throughout the Global Ocean. Glob. Biogeochem. Cycles 2018, 32, 2–17. [Google Scholar] [CrossRef] [PubMed] [Green Version]
  54. Huguenard, K.D.; Bogucki, D.J.; Ortiz-Suslow, D.G.; MacMahan, J.H. Nearshore response to cold air outbreaks in the Gulf of Mexico. Estuar. Coast. Shelf Sci. 2020, 235, 106604. [Google Scholar] [CrossRef]
  55. He, R.; Weisberg, R.H. West Florida Shelf circulation and temperature budget for the 1999 spring transtition. Cont. Shelf Res. 2002, 22, 719–748. [Google Scholar] [CrossRef]
  56. Franks, P.J.S. Has Sverdrup’s critical depth hypothesis been tested? Mixed layers vs. turbulent layers. ICES J. Mar. Sci. 2015, 72, 1897–1907. [Google Scholar] [CrossRef] [Green Version]
  57. Kamykowski, D.; Pridgen, K.G.; Morrison, J.M.; McCulloch, A.A.; Nyadjro, E.S.; Thomas, C.A.; Sinclair, G.A. Cold front induced changes on the Florida panhandle shelf during October 2008. Cont. Shelf Res. 2013, 54, 52–66. [Google Scholar] [CrossRef]
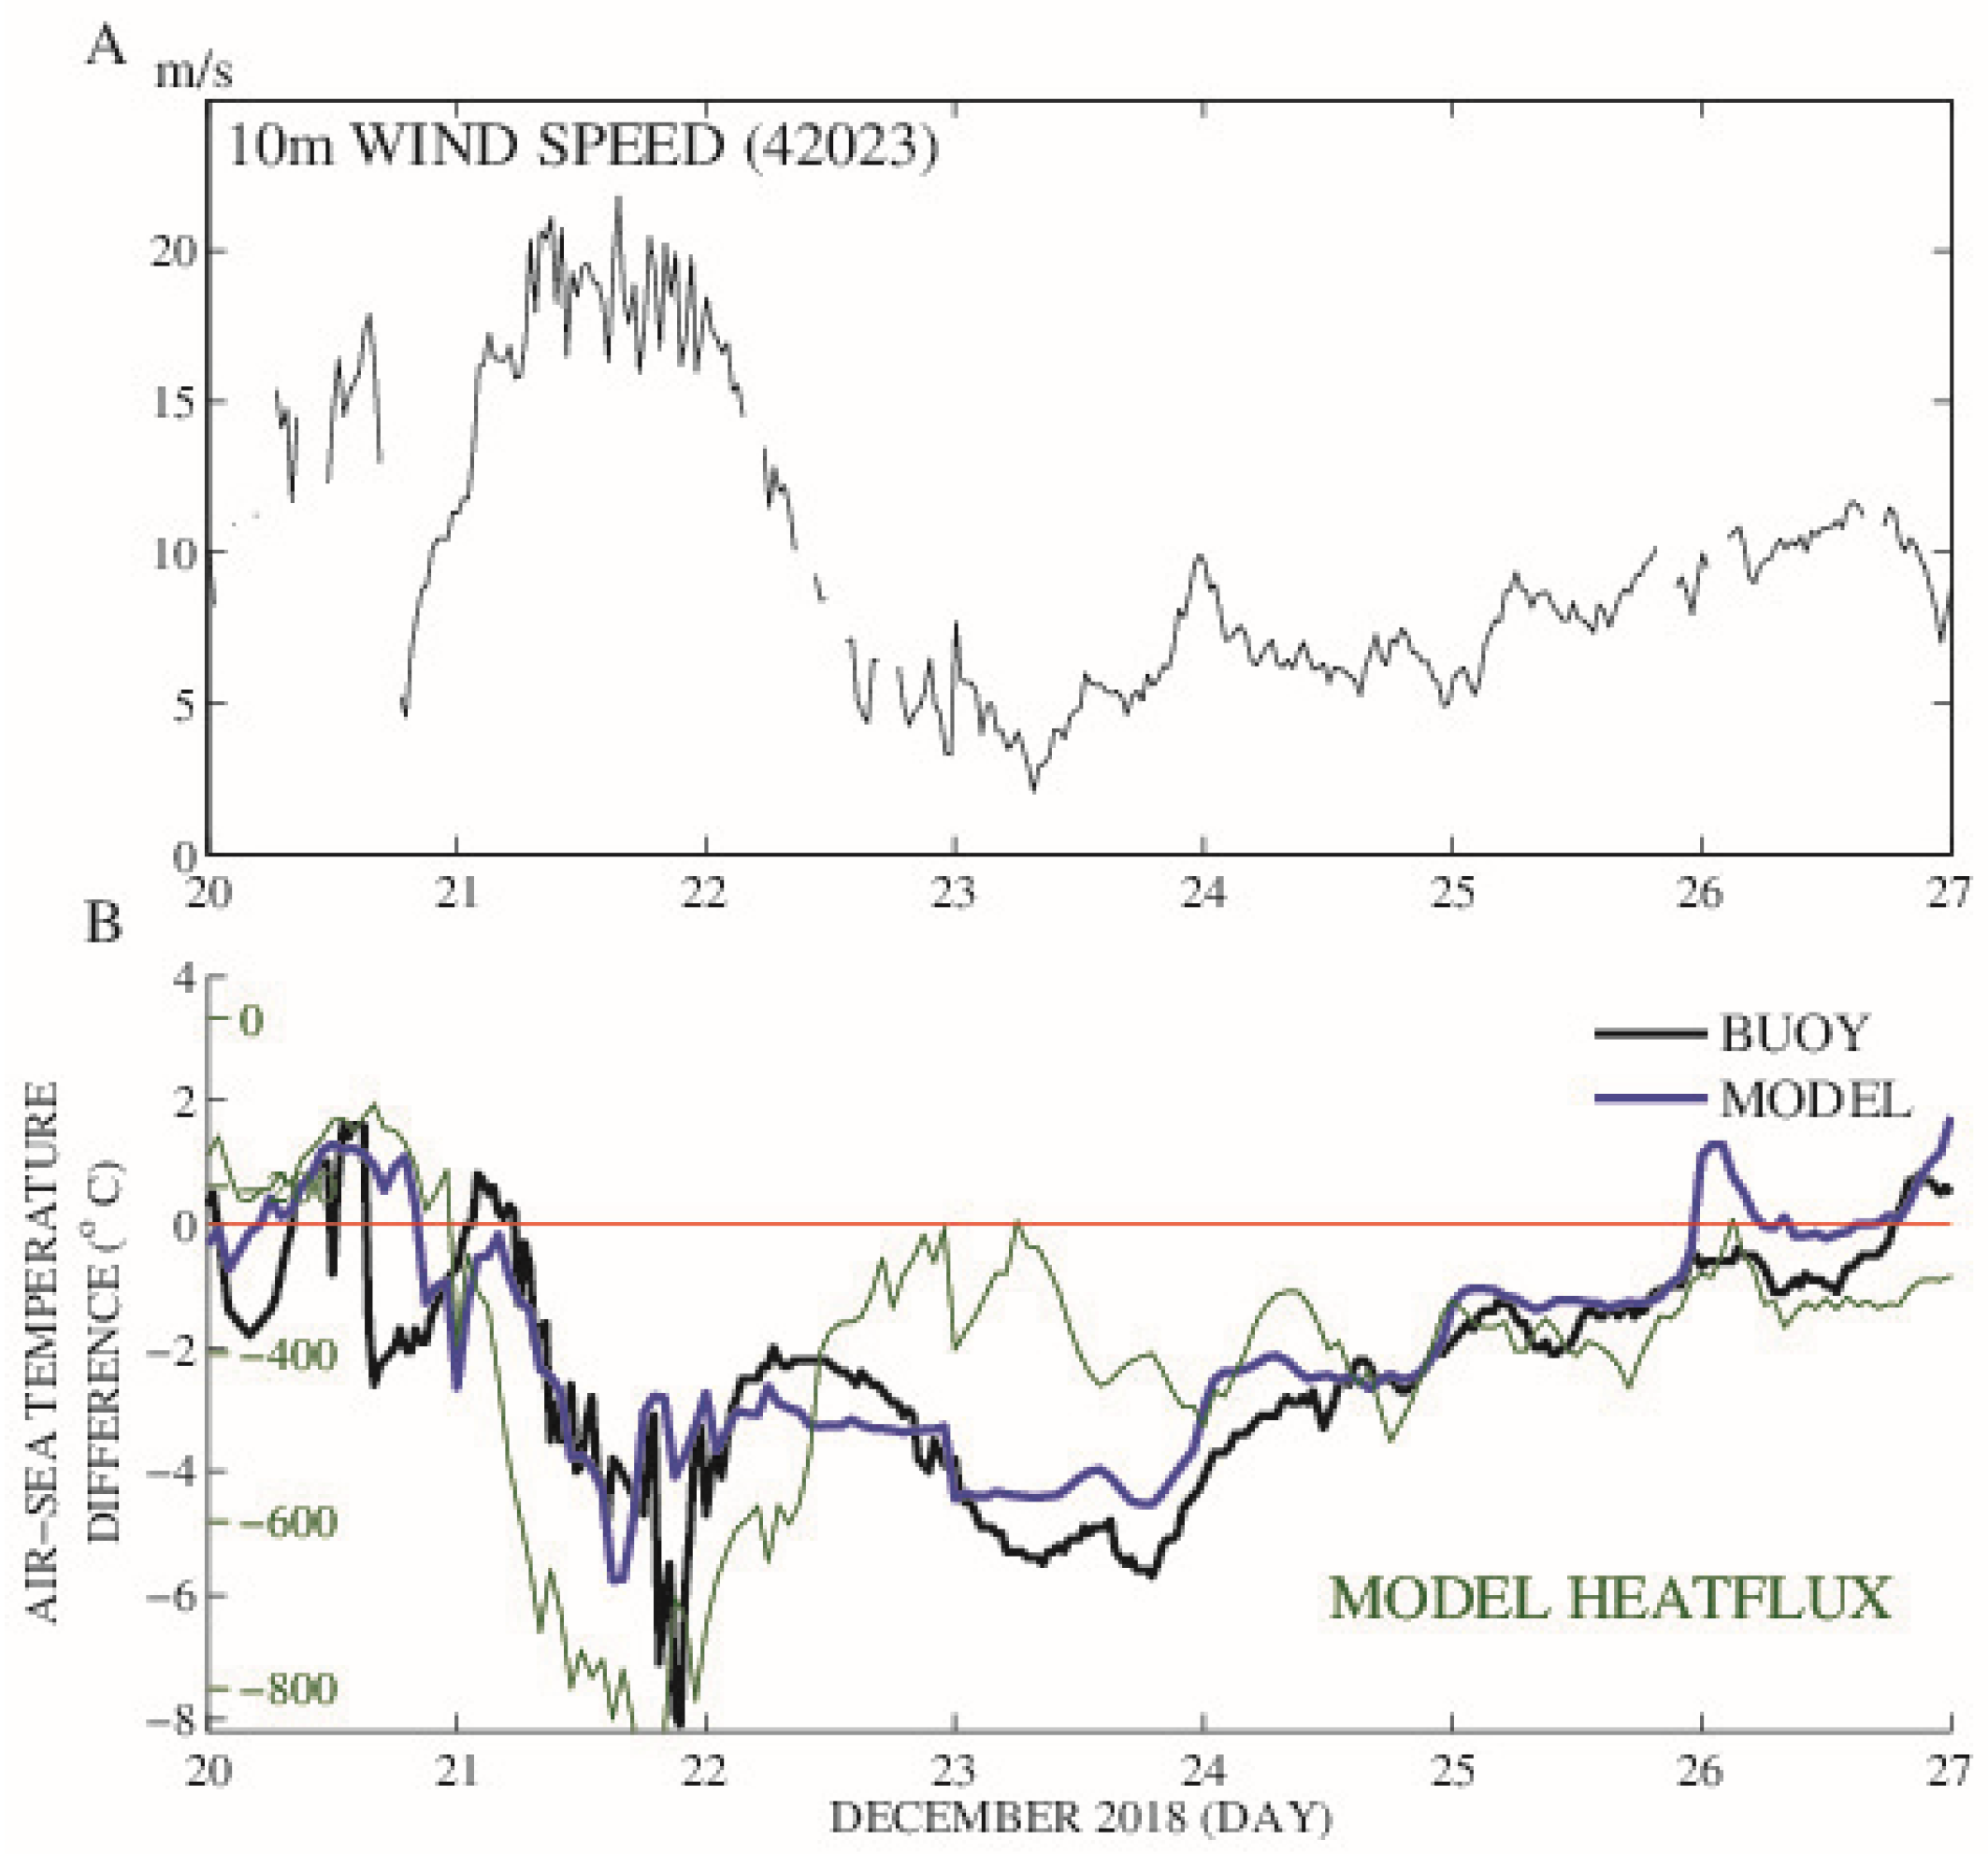
Figure 1. (A) Observed 10-m winds and buoy data and (B) air–sea temperature difference from buoy data (black) and Coupled Ocean-Atmosphere Mesoscale Prediction System (COAMPS) simulation (blue), and the COAMPS heat flux (- heat loss from the ocean) is shown (green, W m−2). University of South Florida (USF) COMPS Buoy 42023 (26.010 N 83.086 W).
Remotesensing 13 00619 g001
Figure 2. (a) COAMPS air temperature (2-m) 20 December 2300 UTC; (b) COAMPS Surface Latent Heat Flux 20 December 2300 UTC; (c) COAMPS air temperature (2-m) 21 December 2000 UTC; and (d) COAMPS Surface Latent Heat Flux 21 December 2000 UTC.
Remotesensing 13 00619 g002
Figure 3. TC fields for the West Florida Shelf (WFS) from the Ocean and Land Colour Imager (OLCI) sensor for (A) Sentinel 3A on 18 December, this date was selected as a reference for conditions before the cold-air outbreak (CAO) event; (B) Sentinel 3B on 21 December, this is the beginning of the CAO event; and (C) Sentinel 3A on 22 December, as the CAO event proceeds. The satellite platform (Sentinel A or B) was selected based on the best spatial coverage for the WFS on that date.
Remotesensing 13 00619 g003
Figure 4. TC fields for the WFS from the OLCI sensor for (A) Sentinel 3B on 23 December, where the cloud cover has dissipated, however, the CAO event is still underway; (B) Sentinel 3B on 24 December; and (C) Sentinel 3B on 25 December, where the CAO event persists through 25 December (as shown in Figure 1). The satellite platform (Sentinel A or B) was selected based on the best spatial coverage for the WFS on that date.
Remotesensing 13 00619 g004
Figure 5. True color (TC) fields for the WFS derived from the Visible Infrared Imaging Radiometer Suite (VIIRS) sensor for (A) NOAA 20 on 21 December during the initial phase of the CAO event; (B) NOAA 20 on 22 December; (C) Suomi-National Polar-Orbiting Partnership (SNPP) on 23 December; and (D) NOAA 20 on 24 December after the cloud cover from the initial CAO phase has dissipated. The satellite platform selection for VIIRS data analysis (NOAA 20 or SNPP) is shown based on the best spatial and cloud-free coverage of the WFS for that date.
Remotesensing 13 00619 g005
Figure 6. (A) Contour plot of WFS Digital Bathymetric Data Base (DBDB2) with 10-m contour intervals out to the 100-m contour and (B) the TC image for 23 December (VIIRS, SNPP) with bathymetry contours overlaid, where the 60 and 70-m contours are shown in red and appear to delimit the seaward extent of the apparent surface water discoloration.
Remotesensing 13 00619 g006
Figure 7. (a) COAMPS temperature results (surface–bottom) for 20 December 1700 UTC, where negative values (blue) indicate temperature inversions; and (b) the bottom density (σt) minus surface density.
Remotesensing 13 00619 g007
Figure 8. (a) COAMPS temperature results (surface–bottom) for 21 December 1200 UTC, where negative values (blue) indicate temperature inversions and (b) surface density (σt) minus bottom density, where only positive values (inversions) are shown on the scale.
Remotesensing 13 00619 g008
Figure 9. (a) COAMPS temperature inversion on 21 December 1300 UTC is the beginning of the solar period, and the temperature inversion remains consistent during the day; (b) TOA True Color VIIRS (NOAA-20) 23 December 2018; and (c) the direct overlay of (a) upon (b) showing the spatial match-up between the color discontinuity and the temperature inversion.
Remotesensing 13 00619 g009
Figure 10. (A) OLCI TC on 21 Dec 1527 UTC and (B) VIIRS on 21 Dec 1757 UTC.
Remotesensing 13 00619 g010
Figure 11. Color-enhanced GOES-R Advanced Baseline Imager (ABI) images on 21 December (A) 1542 (B) 1652 (C) 1732 and (D) 1802 UTC.
Remotesensing 13 00619 g011
Figure 12. (a) Surface CHL product (VIIRS) 16 December and (b) surface CHL product (VIIRS) 23 December.
Remotesensing 13 00619 g012
Figure 13. (a) Remotely-sensed reflectance at 551 nm (VIIRS) 16 December and (b) remotely-sensed reflectance at 551 nm (VIIRS) 23 December.
Remotesensing 13 00619 g013
Figure 14. (A) Extracted and interpolated hyperspectral Rrs spectra for 18 Dec (OLCI; Sent 3A; blue line), 24 Dec (OLCI; Sent 3B; black line), and IOCCG reference coastal turbidity spectrum (brown line) and (B) same as in (A) with the spectra normalized by their respective maximum values. The corresponding OCx chlorophyll algorithm value is shown on the panel.
Remotesensing 13 00619 g014
Figure 15. (a) QAA backscattering coefficient 490 nm band OLCI, Sentinel 3A, 18 December 2018 and (b) QAA backscattering coefficient 490 band OLCI, Sentinel 3B, 24 December 2018.
Remotesensing 13 00619 g015
Figure 16. (a) The QAA absorption coefficient 490 nm band OLCI, Sentinel 3A, 18 December 2018 and (b) the QAA absorption coefficient 490 band OLCI, Sentinel 3B, 24 December 2018.
Remotesensing 13 00619 g016
Publisher’s Note: MDPI stays neutral with regard to jurisdictional claims in published maps and institutional affiliations.