Article

Landslide-Induced Mass Transport of Radionuclides along Transboundary Mailuu-Suu River Networks in Central Asia

1
Department of Water, Environment, Construction and Safety, Magdeburg-Stendal University of Applied Sciences, Breitscheidstr. 2, 39114 Magdeburg, Germany
2
Scientific Engineering Centre “GEOPRIBOR” of the National Academy of Sciences of the Kyrgyz Republic, Mederova Str. 98, Bishkek 720052, Kyrgyzstan
3
The Ministry of Health of the Republic of Uzbekistan, 12 Navoi Street, Tashkent 100011, Uzbekistan
4
Department of Radiation and Nuclear Safety of the State Committee on Industrial Safety 27, A. Navoiy str., Tashkent 100011, Uzbekistan
5
C&E Consulting und Engineering GmbH, Jagdschänkenstr. 52, 09117 Chemnitz, Germany
6
IAF-Radioökologie GmbH, Wilhelm-Rönsch-Straße 9, 01454 Radeberg, Germany
*
Author to whom correspondence should be addressed.
The last two authors contributed equally to this work.
Remote Sens. 2021, 13(4), 698; https://doi.org/10.3390/rs13040698
Submission received: 5 December 2020 / Revised: 28 January 2021 / Accepted: 11 February 2021 / Published: 14 February 2021

Abstract

:
Seismically triggered landslides are a major hazard and have caused severe secondary losses. This problem is especially important in the seismic prone Mailuu-Suu catchment in Kyrgyzstan, as it hosts disproportionately sensitive active or legacy uranium sites with deposited radioactive extractive wastes. These sites show a quasi-continuous release of radioactive contamination into surface waters, and especially after natural hazards, a sudden and massive input of pollutants into the surface waters is expected. However, landslides of contaminated sediments into surface waters represent a substantial exposure pathway that has not been properly addressed in the existing river basin management to date. To fill this gap, satellite imagery was massively employed to extract topography and geometric information, and the seismic Scoops3D and the one-dimensional numerical model, Hydrologic Engineering Centre, River Analysis System (HEC-RAS), were chosen to simulate the landslide-induced mass transport of total suspended solids (TSS) and natural radionuclides (Pb-210 as a proxy for modeling purposes) within the Mailuu-Suu river networks under two earthquake and two hydrological scenarios. The results show that the seismically vulnerable areas dominated in the upstream areas, and the mass of landslides increased dramatically with the increase of earthquake levels. After the landslides, the concentrations of radionuclides increased suddenly and dramatically. The peak values decreased along the longitudinal gradient of river networks, with the concentration curves becoming flat and wide in the downstream sections, and the transport speed of radionuclides decreased along the river networks. The conclusions of this study are that landslides commonly release a significant amount of pollutants with a relatively fast transport along river networks. Improved quantitative understanding of waterborne pollution dispersion across national borders will contribute to better co-ordination between governments and regulatory authorities of riparian states and, consequently, to future prevention of transnational political conflicts that have flared up in the last two decades over alleged pollution of transboundary water bodies.

1. Introduction

The uranium production in Central Asian countries between 1944 and 1995 has left behind various active or legacy uranium mining sites with both radioactive mining and processing wastes (e.g., tailings ponds and dumps). After 1995, most of the conventional mines were closed [1]. However, due to the presence of radioactive wastes, this region has been exposed to a high risk of environmental contamination for decades, and even worse is that most tailings ponds and dumps were not properly rehabilitated and show a quasi-continuous release of dissolved and particulate radioactive contamination into local surface waters [2]. In case of the sudden destruction of these tailings impoundments in Kyrgyzstan, the propagation area of stored radioactive materials may be substantially expanded through the drainage networks, transported towards the denser populated parts of the Fergana valley, and further on across the Kyrgyz-Uzbek border, adding a politically sensitive cross-border aspect to the existing environmental problems [3].
In Central Asia, tailings ponds and dumps are mostly located in mountain areas, where they are prone to multiple types of natural hazards, for instance, earthquakes, heavy rainfall- and snowmelt-induced flooding, as well as landslides [4,5,6,7]. Among the most troublesome are landslides, which occur on mountain slopes and in narrow canyons [2,6,8]. In the Kyrgyz part of the Fergana basin, the first recorded massive activation of landslides occurred in 1954 and was followed by other events in 1958, 1969, 1979, 1988, 1993–1994, 1998, 2003–2005, and 2017 [2,9]. The typical landslide is a translational slide in this region. The translational landslide mass moves along a roughly planar surface with little rotation or backward tilting, and the seismically triggered translational landslides are likely to cause secondary losses associated with earthquakes, with effects sometimes exceeding those of direct shaking [10,11]. In case of a landslide that occurs in the areas of tailings ponds and dumps, the sudden release of radioactively contaminated sediments into the local surface waters encompasses both physical and chemical processes and may cause instantaneous hydraulic changes, redistribution of sediments, and an increase in suspended particulate matter (SPM) [12,13,14]. Due to the significant societal, economic, and environmental impacts related to landslide-induced mass movements, quantifying the mass underlying the subsequence of landslides has become key to prevent radioactive pollution through surface waters, particularly through river networks [13,15,16]. The methods for mass estimation can be basically classified into five types: field surveys, physically-based modeling, empirical modeling, multi-temporal digital elevation model (DEM) analysis, and geometrical estimation [17,18]. Among them, physically-based modeling has been recently widely used, and the estimation of mass depends upon the mechanism of slope stability [17]. Applications such as the script from Marchesini et al. [19], OpenLISEM [20], r.rotstab [21], and Scoops3D [22] were developed for this purpose. In this study, Scoops3D was selected, as this model could evaluate slope stability within a landscape represented by a remote sensing approach (i.e., DEM). It provides the least-stable potential landslide for each grid cell of DEM, as well the associated masses [18,22].
On the one hand, exposure to radioactive contaminants in surface waters might pose a threat to the health of humans and wildlife [23,24]. On the other hand, it has long been observed that there is unequal access to water resources between Central Asian countries as well as regulatory and institutional deficits [25,26]. The lack of quantitative environmental monitoring data in the field of radioactive pollution, which, importantly, are mutually accepted by neighboring states, is seen as a major issue in transnational relations of the region [27]. A reliable monitoring system for radioactive and other pollution of transboundary rivers would provide the data that is necessary for the trustful collaboration of riparian states [28]. In the specific context of transboundary pollution originating in Kyrgyzstan and transported into Uzbekistan, it has been noted that “Kyrgyzstani experts could work cooperatively with specialists from Western countries to identify the highest-risk uranium impoundments” [29]. Emphasizing a step-by-step approach would make the problem more manageable. Such a systematic multinational effort may demonstrate that this environmental problem can provide a focus for regional cooperation [30]. If, by contrast, sustained international efforts are not made to address this issue, another landslide in the vicinity of a uranium tailings site may trigger unpredictable international consequences [31]. The need for quickly available, reliable data on radioactive pollution has also been discussed recently in the context of terrorist attacks [32].
Numerical hydrological models are one of the tools for the impact assessment and the regulatory decision-making process, such as assisting in the simulation of the transport of landslide-induced contamination, quantification of the maximum contaminant concentration in the water, or evaluation of different feasible remediation strategies [33]. As stated by numerous studies, numerical simulation is a useful and advantageous tool in both the prediction and retrospective evaluation of mass transport of pollutants in surface waters [12,34,35,36]. Transport models provide the possibility to simulate the concentration changes along river networks and to evaluate the effects of different geological and hydrological scenarios on water quality problems [34]. Furthermore, knowledge of dispersion processes in flowing waters may also be useful for river modification, outlet design, or river confluence design to mitigate potential negative influences on aquatic biological communities [12].
Numerical hydrological models for fluvial flow evolved during the last decades. Among them, one-dimensional numerical models based on discrete time and distance steps have successfully been used for long river reaches. Such software includes HEC-RAS (Hydrologic Engineering Centre, River Analysis System, version 5.0.7) [37]. This model has been acknowledged as one of the most frequently utilized flood modeling approaches in hydrodynamic simulation, where the geometric profiles could be measured either in situ or extracted from satellite imageries [35]. As a spatially-resolved, mass balance, fate, and transport modeling framework, HEC-RAS can be used to perform one-dimensional steady flow and two-dimensional non-stationary flow simulations for a river flow analysis, as well as sediment transport and water quality modeling [34]. Furthermore, it is capable of carrying out one-dimensional hydraulic calculations for a full system of natural and fabricated channels. The model uses the ultimate-quickest explicit numerical scheme to solve the one-dimensional advection-dispersion equation (ADE) with a control volume approach [36]. The ADE for the modeling of transport and spatial distribution of suspended matter in rivers is a natural starting point. Traditionally, the ADE has been used to model the concentration in rivers and how it evolves in time and space due to a pollution release [38]. Within the river channel, the suspended matter is assumed to be fully mixed, and its concentration uniform over any cross section. Spatially, the concentration of suspended matter follows a normal distribution, which propagates downstream with the water velocity. Therefore, the concentration varies only along dendritic river networks [12,39].
In this study, two indicators were chosen to quantitatively describe the waterborne transport processes along river networks. Besides the commonly used total suspended solids (TSS), Pb-210 has been selected as a proxy of the radioactive load. Instead of U-238, the selection of Pb-210 lies in that U-238 has been depleted in tailings due to the very purpose of uranium mining and extraction, and that, consequently, the specific activities of other nuclides such as Ra-226, Pb-210, and Po-210 are one to two orders of magnitude higher than that of U-238 [40]. In the first approximation, the nuclides are in radioactive equilibrium, and the determination of either of them will therefore provide a reasonable estimate of the radioactive load caused by the release of tailings from uranium production. Furthermore, a simple and robust method has been developed to determine Pb-210 and Po-210 in suspended mineral solids [41], specifically adapted to the limited technical and financial resources of laboratories in Central Asia.
To date, only a few studies have reported on the mass transport of suspended radioactive matter after landslides. Central Asian countries, due to limited research budgets despite being burdened by radioactive legacy sites, are in particular need of research in this field. One contribution to this field was provided by Kalka et al. in 2017 [42]. They assumed that 30% of the tailings materials would be flushed into the river network and estimated the transport of U-238 and Ra-226 along the Mailuu-Suu river network. However, the assumed proportion should be tested using other seismic models, and as mentioned above, Pb-210 is radiologically more relevant than U-238 in the context of tailings from uranium ore processing. These new questions will be answered in the current study. The study area, the Mailuu-Suu catchment across Kyrgyzstan and Uzbekistan, is a landslide prone area (Figure 1) [2,6,9]. This area is frequently affected by seismic activities (e.g., earthquake), which is an important trigger of landslides [6]. Several strong earthquakes struck the Tien Shan and its surroundings during the last century, including the strongest ones, like the M (magnitude) = 8.2 Kemin earthquake in 1911, the M = 7.6 Chatkal earthquake in 1946, the M = 7.4 Khait earthquake in 1949, and the M = 7.3 Suusamyr earthquake in 1992 [43]. Sherman et al. showed that the return period of large earthquakes (magnitude ≥ 7.0) for the entire region of Central Asia under consideration is approximately 25 years [44]. Major landslides can affect, directly and indirectly, tailings deposited along the Mailuu-Suu valley and have already destroyed or affected some tailings ponds in several instances in the past decades. A landslide can push a tailings impoundment partially or fully into the river and, as a consequence, increase the risk of fluvial erosion. The transport of radioactive pollutants through the Mailuu-Suu river could be problematic in both countries, and particularly in the Fergana valley, which is just 24 km downstream from the town of Mailuu-Suu, where farmers use the river water for irrigation [45]. Overall, the purpose of this study is to simulate the mass transports of the suspended matters, namely TSS and Pb-210, along the Mailuu-Suu river after earthquake-induced landslides using the Scoops3D and HEC-RAS software. Our specific hypotheses were: (1) the areas vulnerable to seismic events were expected to be predominantly located in the upstream areas of the Mailuu-Suu catchment; (2) the mass of earthquake-induced landslides was expected to increase dramatically with the increase of earthquake levels; (3) the transport speed of the radionuclides would decrease along the river networks.

2. Materials and Methods

2.1. Study Area

The Mailuu-Suu river feeds the Syr Daria river, which is the major source of irrigation water in the Fergana valley, the food basket of Uzbekistan (Figure 1) [2]. The catchment is located in the Tien Shan Mountains at 600–4400 m altitude with a catchment area of 530 km2, and it is characterized by semi-arid climatic conditions [6].
The town of Mailuu-Suu is located in the north-eastern part of the Fergana valley. The altitude of the town is between 900 and 1000 m a.s.l. [3]. Mailuu-Suu is a former uranium mining area [9,45]. In and around the town, uranium mining and milling activities started in 1946 and lasted until 1968. Most of the waste dumps and tailings ponds from mining were deposited in the moderate mountainous terrain and gently sloping alluvial areas, often in close proximity to the Mailuu-Suu river and its tributaries [3,46]. The processing residues are stored in 17 ponds, covering an area of approximately 0.46 km2 and with a total volume of around 2 million m3 [3,6].
The Mailuu-Suu valley is located in the tectonically and seismically active Tien Shan Mountains [6]. The Tien Shan is a Cenozoic orogenic belt in Central Asia with a basin and range structure caused by the post-collisional convergence of India with Asia [6]. The Mailuu-Suu valley is therefore particularly prone to translational landslide hazards and was identified as the most landslide-prone and vulnerable of the entire territory of Kyrgyzstan. This area is located on a propagation zone of Meso-Neozoic sediments, which is strongly crushed in folds. Such sediments consist of lithologic (i.e., loess-like loams and clays) and stratigraphic soils (i.e., water-permeable and waterproof soils), which are predisposed to descending [2]. During the last 50 years, the valley has experienced severe landslide disasters in the vicinity of numerous radioactive waste tailings, and more than 200 landslide sources distinct by genesis, age and development stages have been fixed at present in the outskirts of the town of Mailuu-Suu within an area of 80 km2 only [6]. During the 1990s, three of the largest landslides in the Mailuu-Suu valley displaced more than 5 million m3 of material [4].
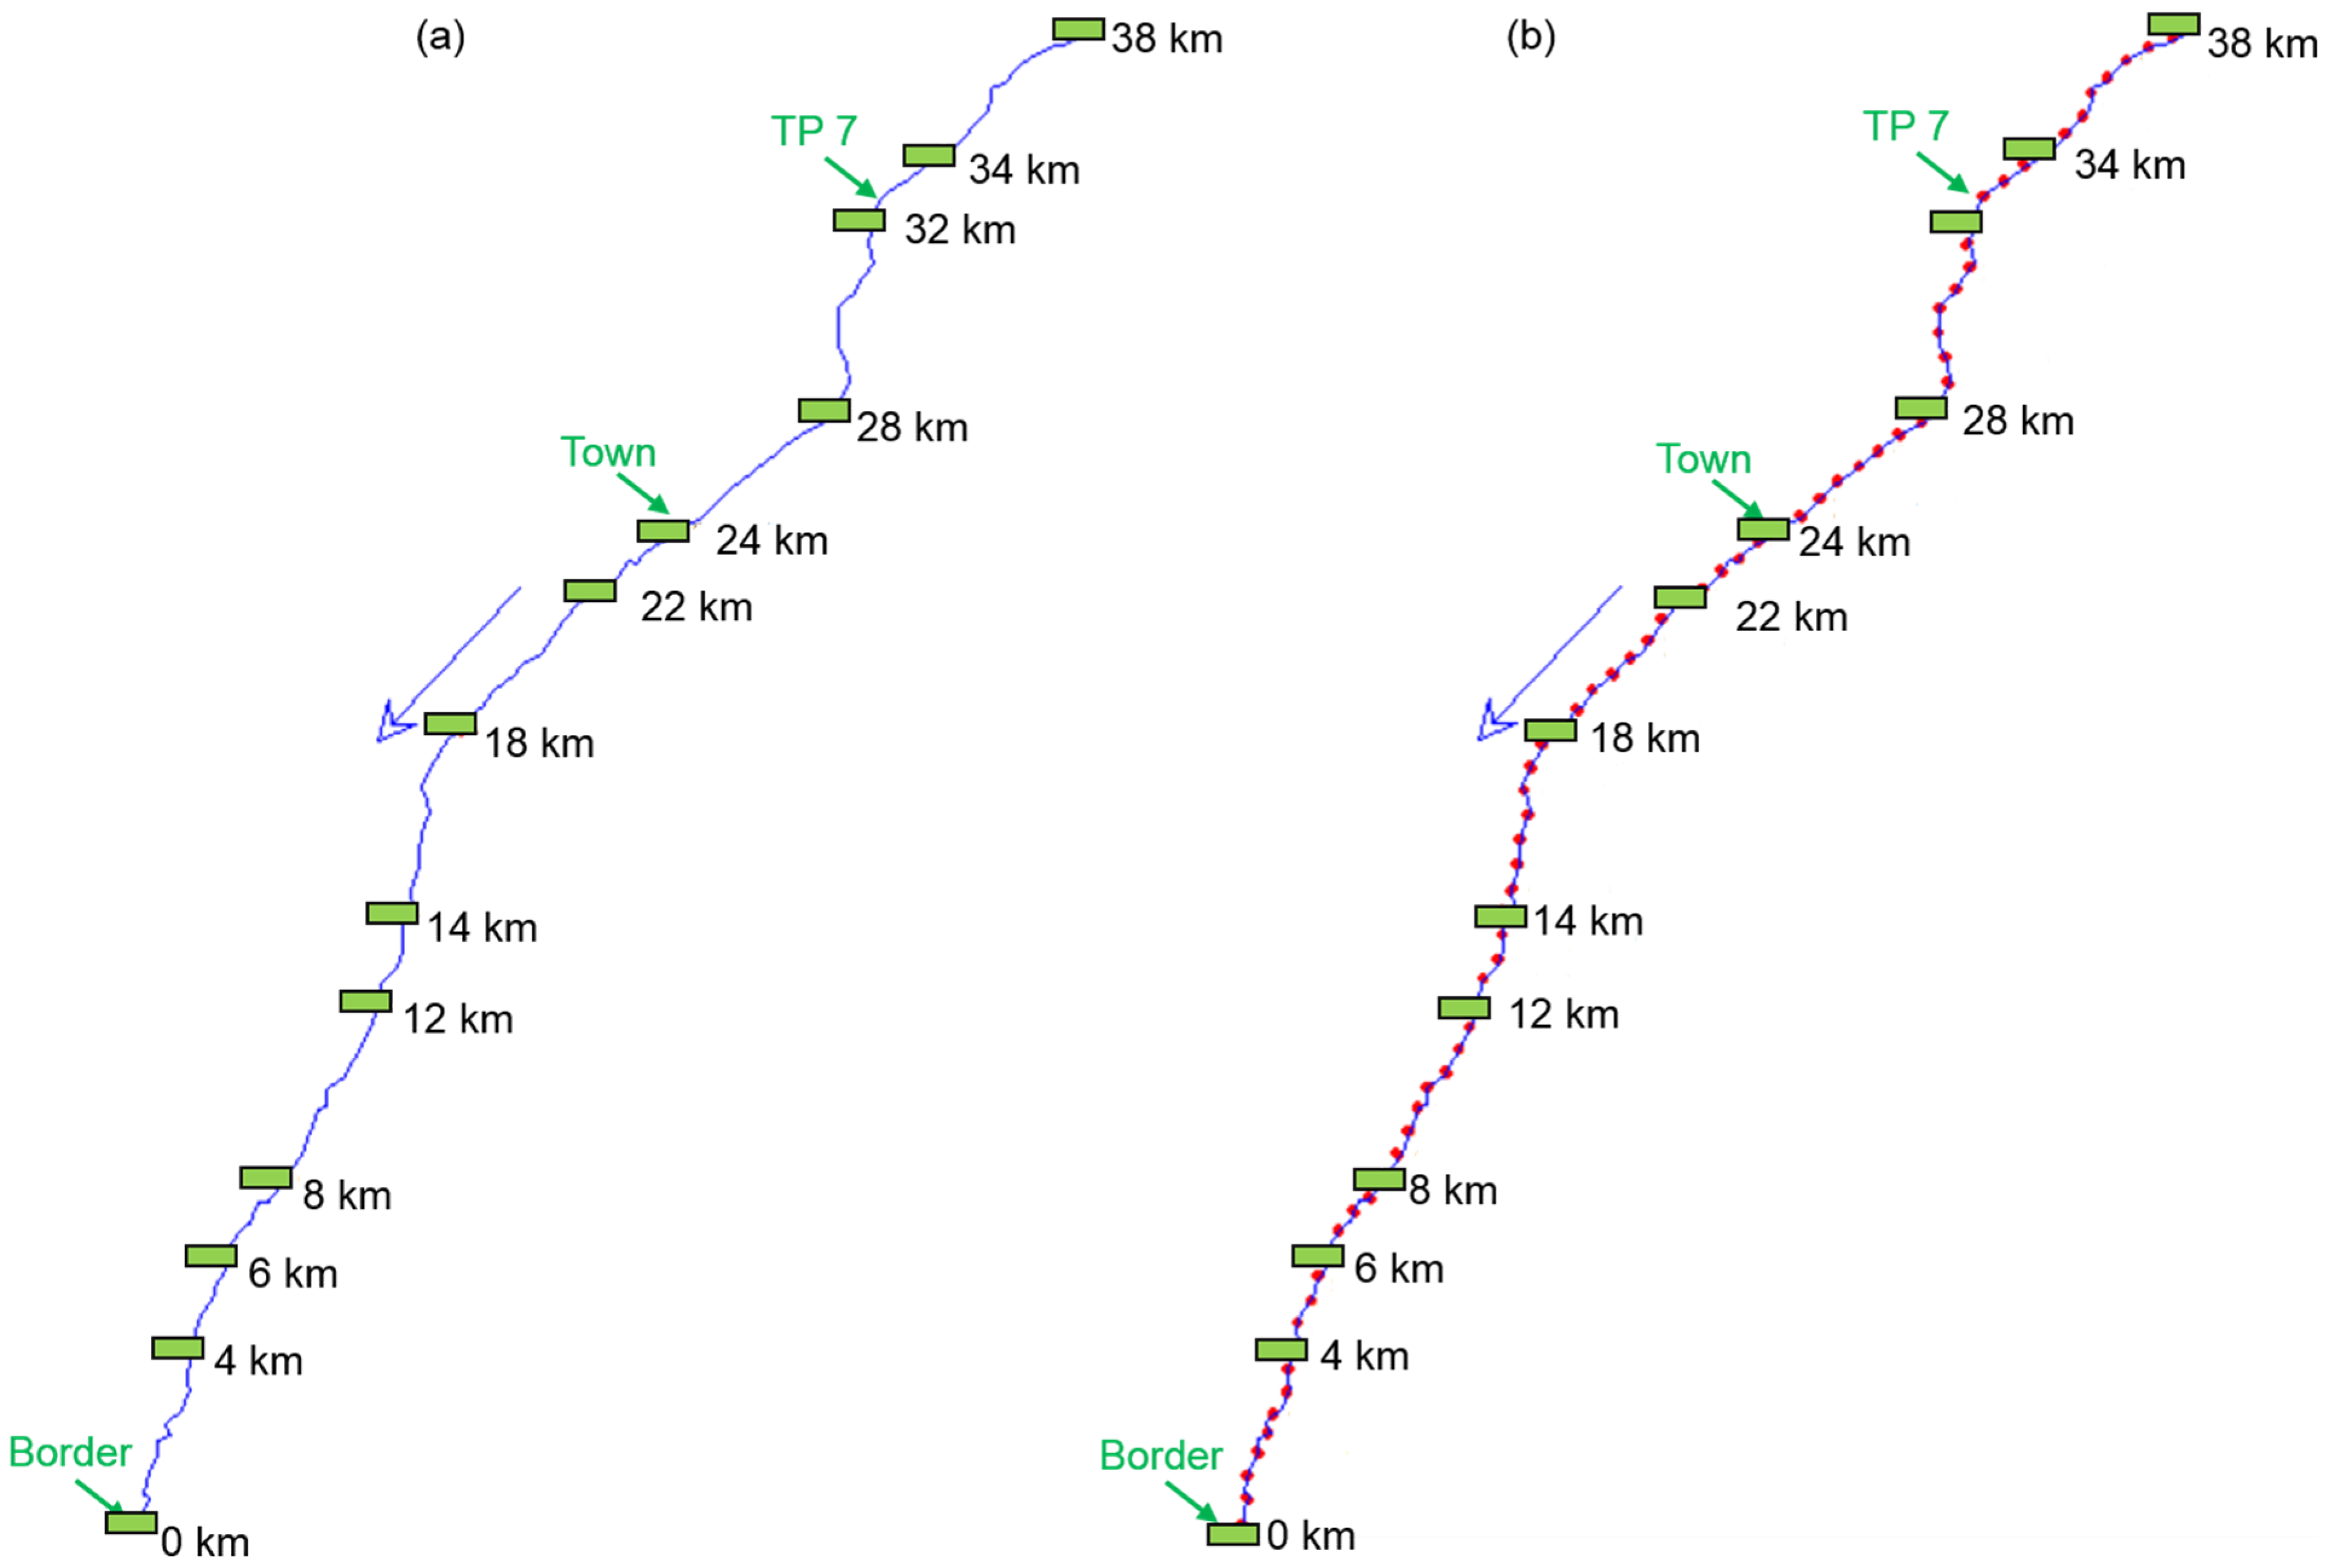
In this study, the focus was on the river sections at the largest tailings pond, namely tailings pond 7 (TP 7) with a volume of 600,000 m3. TP 7 is located on the bank of the Mailuu-Suu river. A river section with a distance of 38 km to the Kyrgyz-Uzbek border was chosen, where TP 7 and the town of Mailuu-Suu were located at the river sections of 32.5 km and 24 km, respectively (Figure 2).

2.2. Data Collection

The data collection was performed as a part of the TRANSPOND (Transboundary Monitoring and Information System for Radioactive Contamination in the Event of Natural Hazards) project. The collected data included input data for the Scoops3D (e.g., DEM and soil parameters) and HEC-RAS models (e.g., geometric profile of the Mailuu-Suu river network based on satellite imagery, discharge, and concentrations of TSS and Pb-210). The collected DEM and soil parameters were used to perform the simulation of Scoops3D under three simulation scenarios (i.e., baseline, destructive, and catastrophic). By means of Scoops3D models, the volume of landslide for each grid cell of DEM and the landslide susceptibility index was produced. The collected geometric profile and discharge data were used to develop the mass transport models under two hydrological and two earthquake scenarios. The scheme for the data process and modeling approaches are shown in Figure 3.
The DEM data was obtained from the SRTM (shuttle radar topography mission) dataset (resolution: 30 m; www.usgs.gov (accessed on 4 December 2020)) and further downscaled into a resolution of 10 m using the bilinear resampling approach in the GIS (geographic information system) software (ArcGIS version 10.4). The soil parameters were obtained from the Scientific Engineering Centre “GEOPRIBOR” (SECG) in Kyrgyzstan. In this dataset, six depth layers were determined in the Mailuu-Suu catchment. The measured parameters included layer depth, cohesion, angle of internal friction, and specific gravity (“unit weight” in the Scoops3D terminology). The averaged values were used to represent the overall conditions of soil properties in the Mailuu-Suu catchment, and they were 3.7 m, 17.7 kPa, 30.3°, and 19.7 kN/m3, respectively (Table 1). The detailed measurement methods of soil parameters are available in the paper by Torgoev et al. [47].
Besides soil parameters, the influence of groundwater on landslides was also incorporated in this study. The Ru coefficient refers to the excess pore water pressure ratio, ranging between 0 and 1, and it was used to analyze this effect because it could simplify the pore pressure as a fraction of the vertical earth pressure for each column in the sliding mass. The calculation of the Ru coefficient is based on Equation (1)
R u = u γ z
where u is the pore-water pressure, γ is the specific gravity of the soil, and z is the depth below ground.
For the specific gravity and depth, the above-mentioned soil parameters were used, and the pore-water pressure was defined as 10 kPa according to the suggestions from the SECG. Therefore, the values of Ru coefficient could be calculated for each depth layer with an average value of 0.15 (Table 1).
As the basic input parameters of HEC-RAS, the geometric profile of the Mailuu-Suu river was created. Within the entire length of the modeled river (i.e., 38 km), 13 cross sections were extracted using the satellite imageries of Google Earth (Figure 2a). The extracted parameters included the distance and slope between river sections, the elevation, catchment area, water width, channel width, and the compositions of the land cover of the river bed and left/right banks of each river section (Table 2). Water depth was estimated based on the field survey, and the compositions of the land cover of the river bed and banks were then converted into roughness according to the method provided by the State Authority for Environmental Protection of Baden-Württemberg, Germany [48].
For each cross section, several stations (i.e., measurement points across a given cross section) were measured at an interval of 0.5–2 m in order to determine the station-specific elevation, width, and depth, and ultimately to form a geometric profile for the given cross section. Cross sectional data was then entered into geometric tables to capture changes in area conveyance with respect to elevation. The 13 cross sections were then interpolated into 77 zones with a uniform distance of 500 m (Figure 2b) in order to increase the precision of the simulations.
Two hydrological scenarios were included in this study, namely MQ (i.e., mean discharge) and HQ scenarios (i.e., the discharge with a 50-year return period during 1965 and 2015). The MQ was calculated based on the average value of monthly discharge within 15 non-consecutive years over 1965 and 2015 (see Table 3), and it was determined to be 11.9 m3/s at the river gauge station in the town of Mailuu-Suu (Table 3). During the period of 1965 and 2015, the highest discharge of 108 m3/s was recorded in May 1969 [42,49].
Concerning the variations of the natural background concentration of TSS between MQ and HQ scenarios, two field sampling campaigns in the Mailuu-Suu river were carried out. Due to logistical reasons, the sampling campaigns were carried out in spring after snowmelt in the mountains (Kyrgyzstan) and during the dry season in summer with low flow rates (Uzbekistan). This way, the validity of the assumption of a homogeneous distribution of suspended solids across the river’s cross section could also be confirmed for two very different morphological situations of the riverbed, and different flow regimes. In total, eight and six samples were taken across the cross section in August and May, respectively. The water samples were filtered, dried, and finally weighed to determine the background concentration of TSS. One sampling campaign was carried out on 5 August 2019, which coincides with the typical month of MQ scenarios, which is August. The HQ refers to an extreme scenario, and it is impossible to perform the sampling campaign under an HQ scenario during the implementation period of the project. Alternatively, a flooding event was used as a substitute, which was on 15 May 2019. The sampling point of the August campaign was under the pedestrian bridge in Izboskan on the Uzbek side of the border with Kyrgyzstan, whereas sampling in May was carried out under the road bridge, which was near TP 7 and north of the town of Mailuu-Suu. The sampling at different sites provided first-hand information on the concentration of unpolluted suspended solids (natural background) at critical points in both neighboring countries: in Kyrgyzstan at the source of potential (hypothetical) release of radioactive material, and in Uzbekistan at the point where the river has just crossed the border.
The natural background of radionuclides of the Uranium-238 series, including Pb-210 (its activity concentration can be expressed in Bq per kg of tailings material or per kg of TSS), in solute and particulate form in the Mailuu-Suu river, was determined on sediment samples taken in 2017 [50], using gamma and alpha spectrometry. The specific activity of Pb-210 was in the range of 25 to 46 Bq/kg with an average of 35.5 Bq/kg, which coincides reasonably well with the result of 20 Bq/kg obtained earlier by Passell et al. [51].
The activity concentration of Pb-210 in the tailings of TP 7 was determined by Kyrgyz and Uzbek laboratories using the method developed by Kunze and Hummrich [41]. The total activity of Pb-210 that is injected into the river during a disruptive event is calculated by multiplying the specific activity of Pb-210 and the total mass of tailings released during that event. It consists of flux-melt sample digestion, spontaneous deposition of Bi-210 on stainless steel disks, and subsequent low-level beta counting. The method was validated by gamma spectrometry in an ISO 17025:2018 accredited laboratory. The specific activity of tailings material from TP 7 was 19,800 Bq/kg [50].

2.3. Scoops3D Model

In order to quantify the mass of a landslide that may be activated at TP 7, the Scoops3D model was used [22]. The Scoops3D stability calculation includes the effects of earthquake or seismic loading in a pseudo-static analysis by adding a specified pseudo-acceleration. The pseudo-acceleration coefficient (keq) is applied as a uniform horizontal force to represent the effects of ground acceleration from an earthquake [22]. In this study, simulations of three earthquake scenarios were performed, namely a baseline scenario (keq = 0.0, no earthquake), a destructive scenario (keq = 0.2, the earthquake magnitude ranges between 7.0 and 7.9), and a catastrophic scenario (keq = 0.5, the earthquake magnitude is 8.0 or greater), respectively (www.geo.mtu.edu/UPSeis/magnitude.html (accessed on 4 December 2020)). A stability analysis was carried out using Bishop’s simplified method, which can provide values of factor of safety (FOS) for each grid cell of DEM.
Two major outputs of this simulation were the landslide susceptibility index (LSI or minimum FOS) and the mass of landslide for each grid cell. By means of FOS, maps of LSI were developed for the entire Mailuu-Suu catchment. The total mass of landslides in the area of TP 7 was calculated based on the sum of masses in each grid cell. As a baseline scenario, the mass of its landslide was defined as zero. The difference in landslide mass between the other two scenarios and the baseline scenario could then be calculated for destructive and catastrophic scenarios.

2.4. HEC-RAS Model

In one-dimensional hydraulic modeling, all flows are assumed to move downstream along the longitudinal gradient of the river network. To simplify the computation, the HEC-RAS model assumed a horizontal water surface at each cross section [37]. As the mass transport within this small mountainous catchment was considerably fast, the flow discharge was thus relatively stable within the entire transport process. In this sense, a constant discharge was used to perform the flow simulation for each measured river section. To perform the flow simulation, the discharge value at each measured river section was required. However, it was only available in the town of Mailuu-Suu (river section at 24 km). By means of a conversion method, the discharge values for other river sections were estimated. Taking river section at 38 km as one example, the ratio of the catchment areas between 38 km (379.5 km2) and 24 km (624.7 km2) was 0.61; by multiplying this ratio with the discharge at 24 km (11.9 m3/s), the value of discharge at 38 km under MQ could be then obtained, and it was 7.2 m3/s. In order to smooth the spatial pattern of discharge along river networks, the function of uniform lateral inflow was employed. The upstream boundary condition (i.e., river section at 38 km) is a flow hydrograph of discharge over time (i.e., constant values: MQ = 7.2 m3/s and HQ = 65.6 m3/s), whereas the downstream boundary condition (i.e., river section at 0 km or at the Kyrgyz-Uzbek border) was the slope of the entire river section under consideration (i.e., 0.012 m/m). The time interval of the outputs was set to 3 min.
The transport simulation was based on the ADE model in HEC-RAS, which describes the mass conservation of substances transported in the direction of the flow [39]. The dispersion of suspended matter is mathematically described by Fick’s law, where the dispersion coefficient includes the combined effects of molecular diffusion, turbulent mixing, and mixing due to transverse and vertical shear associated with cross-stream velocity differences [12,52].
A number of riverine parameters have effects on the estimation of the dispersion coefficient along the longitudinal gradient of river networks. The essential ones included viscosity, density, water depth, channel width, shear velocity, mean velocity, bed slope, horizontal stream curvature, bed shape factor, and bed roughness [38,52]. The suggested equations (i.e., Equations (2) and (3)) for computing the dispersion coefficient from the HEC-RAS user manual was used in this study [37]
D = 0.011   m   u 2 w 2 d   u *
u * =   g d S
where D is the dispersion coefficient, m is a user assigned multiplier (m = 1.0 in our case), u is the face velocity (m/s), w is the average channel width (m), d is the average channel depth (m), u* is the shear velocity (m/s), g is a gravitational constant (g = 9.81 m/s2), and S is the friction slope (m/m). The values of u, w, d, and S were obtained from the outputs of flow simulations.
The investigation of TP 7 showed that the mean sediment diameter (d50) was about 0.2–0.3 mm with a bulk density of 1600 kg/m3, corresponding to silt and sand [42]. Such sediments could be considered the high potential of suspended ones once they were flushed into river networks [42]. Therefore, the ADE model can be used to simulate the transport of suspended matters along the Mailuu-Suu river.
In order to simplify the simulation, two basic assumptions were made: (1) all earthquake-induced landslide mass is assumed to flow into the Mailuu-Suu river and (2) the landslide mass falling in the river does not modify the flow-rate. In this study, TSS (i.e., the sum suspended solids and tailings) was used as a substitution for the mass of tailings landslides at the locality of TP 7, and it was estimated using Scoops3D as described in Section 2.3. The activity mass of Pb-210 in the tailings of TP 7 was calculated by multiplying the mass of TSS and the specific activity of Pb-210 in the tailings of TP 7. It should be noted that in case of a sudden release of tailings materials into the river, the overwhelming part of Pb-210 is bound to particulates, while only a small portion is present in solute form.
As outputs of transport models, the time interval of the concentrations of TSS and Pb-210 were also set to 3 min, i.e., the concentration was recorded every 3 min during the simulation of HEC-RAS. For each river section, the transport speed or the required time duration of the mass transport after landslides could be determined by checking the point in time where the concentration receded to the background level (the values of background concentration were described in Section 3.2).

3. Results

3.1. Maps of Landslide Susceptibility Index

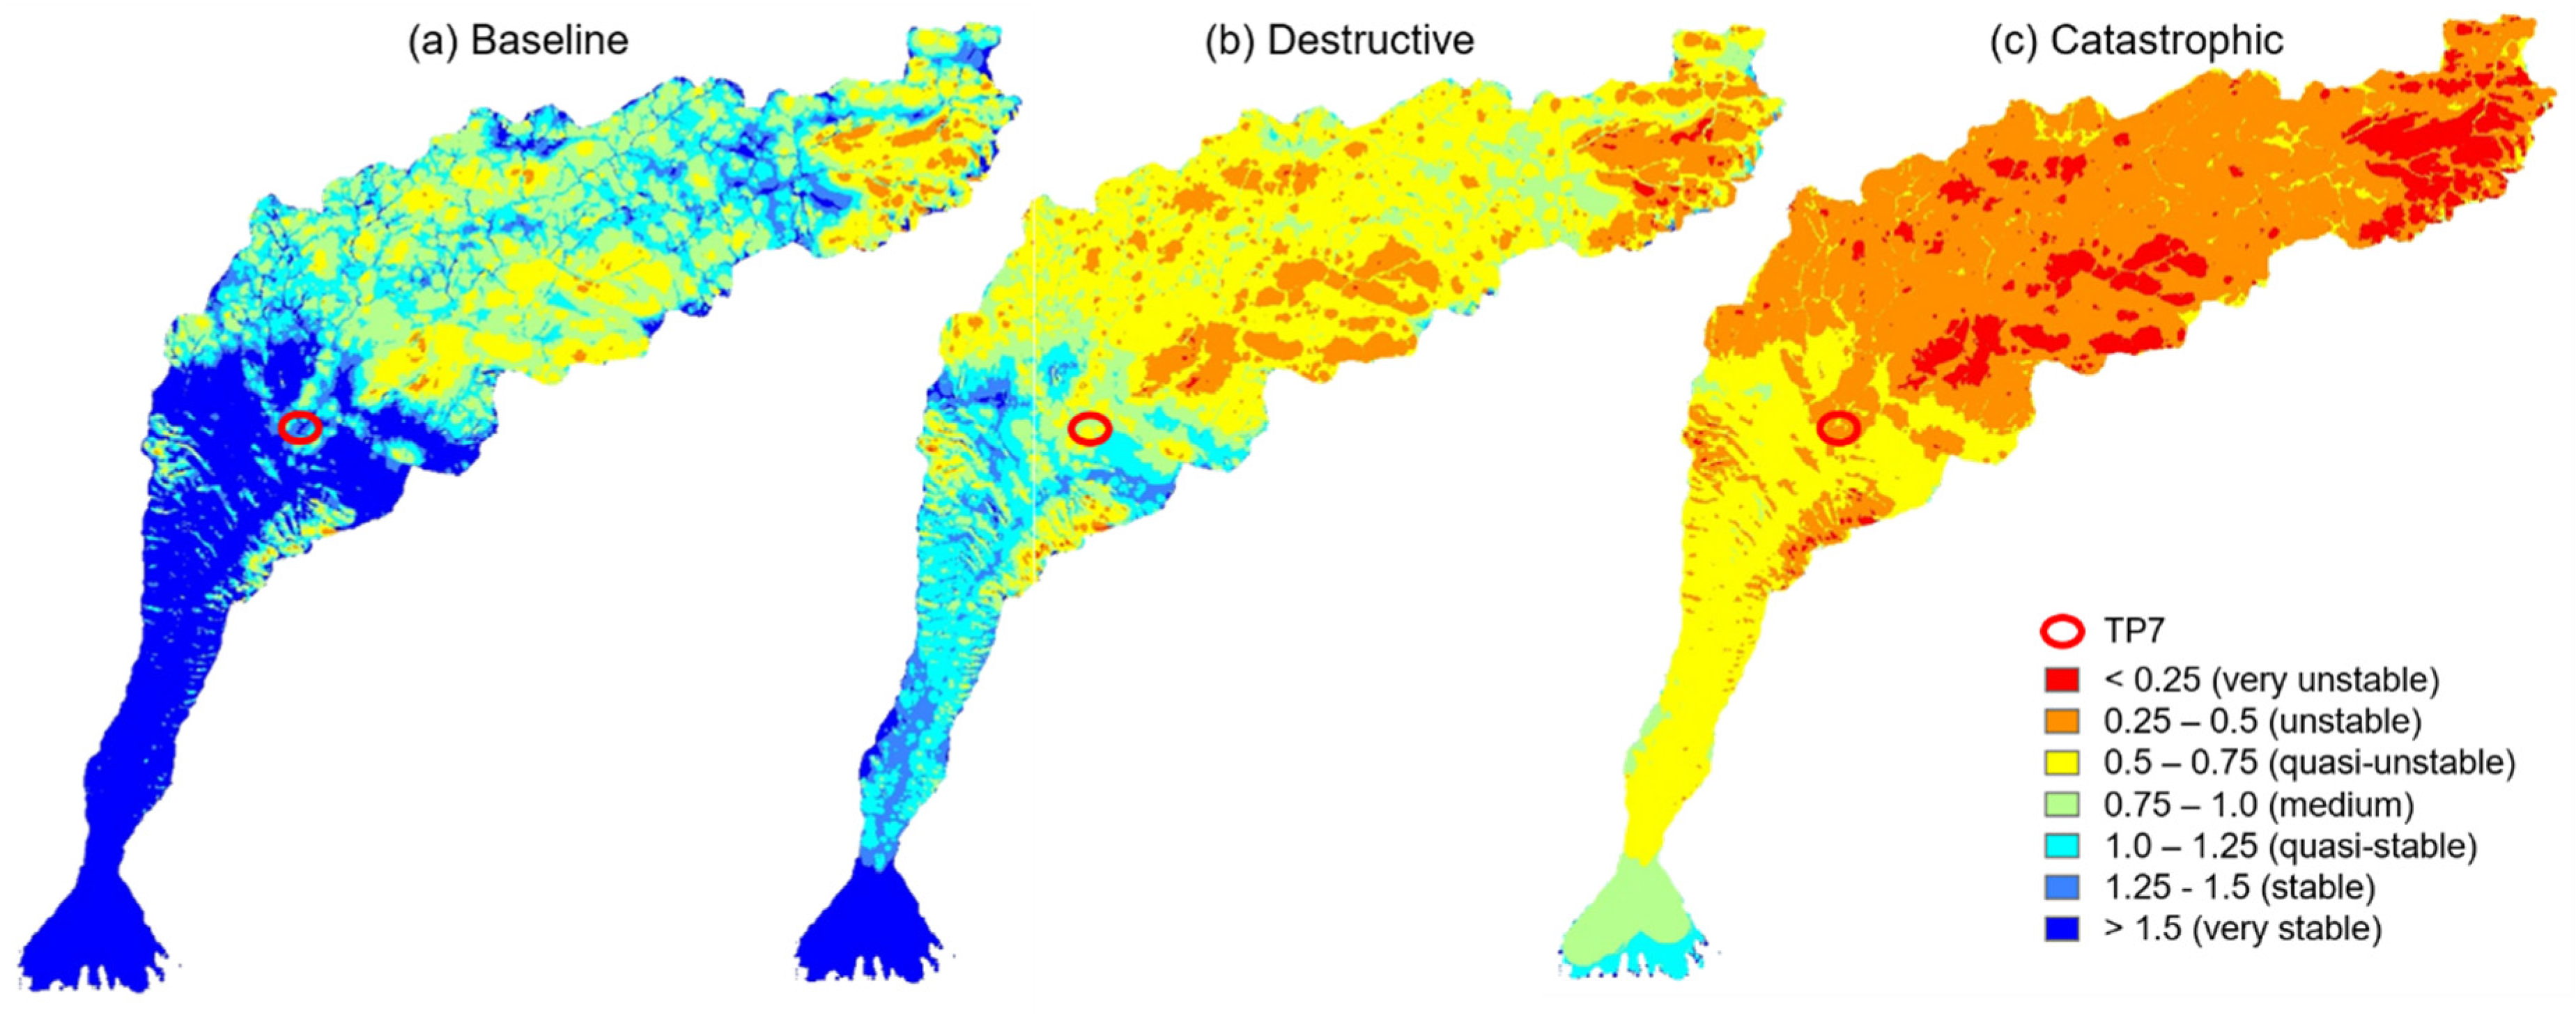
Overall, the upstream areas of the Mailuu-Suu catchment are more unstable than the downstream areas under all three earthquake scenarios (Figure 4). Under the baseline scenario, the entire downstream area (the location of tailings ponds) belonged to stable or very stable (Figure 4a). However, with increasing earthquake strength, the entire catchment became more unstable (Figure 4). Particularly under the catastrophic scenario, most upstream areas were classified as unstable or very unstable (LSI ≤ 0.5), whereas downstream areas were identified as quasi-unstable or medium (Figure 4). The average values of LSI were calculated to be 2.17 (very stable, range: 0.16–100), 0.81 (medium, range: 0.11–35.84), and 0.44 (unstable, range: 0.05–14.89) under baseline, destructive and catastrophic scenarios, respectively. Concerning the area of TP 7, the average values of LSI were 1.32 (stable, range: 1.20–1.79), 0.80 (medium, range: 0.74–1.03), and 0.45 (unstable, range: 0.42–0.57) under baseline, destructive and catastrophic scenarios, respectively.
The landslide masses of tailings materials in TP 7 were calculated for each scenario. Overall, it was expected that 0.00% (0 m3), 0.02% (131 m3), and 0.29% (1761 m3) of the tailings materials would flow into the river network under baseline, destructive, and catastrophic earthquake scenarios, respectively.

3.2. Background Concentrations of TSS and Pb-210

Based on the measured concentration of TSS under both hydrological scenarios (MQ and HQ), the averaged background concentrations of TSS were calculated, and they were 0.083 (ranged between 0.072 and 0.094 kg/m3) and 0.178 kg/m3 (ranged between 0.147 and 0.195 kg/m3) under MQ and HQ scenarios, respectively (Figure 5). The validity of the assumption of a uniform TSS concentration across the river cross section that is vital for the application of the HEC-RAS model has been confirmed by those sampling campaigns. Furthermore, the background activity concentration of Pb-210 was 35.5 Bq/kg on average under both hydrological scenarios [50].

3.3. Hydrological Outputs of HEC-RAS Models

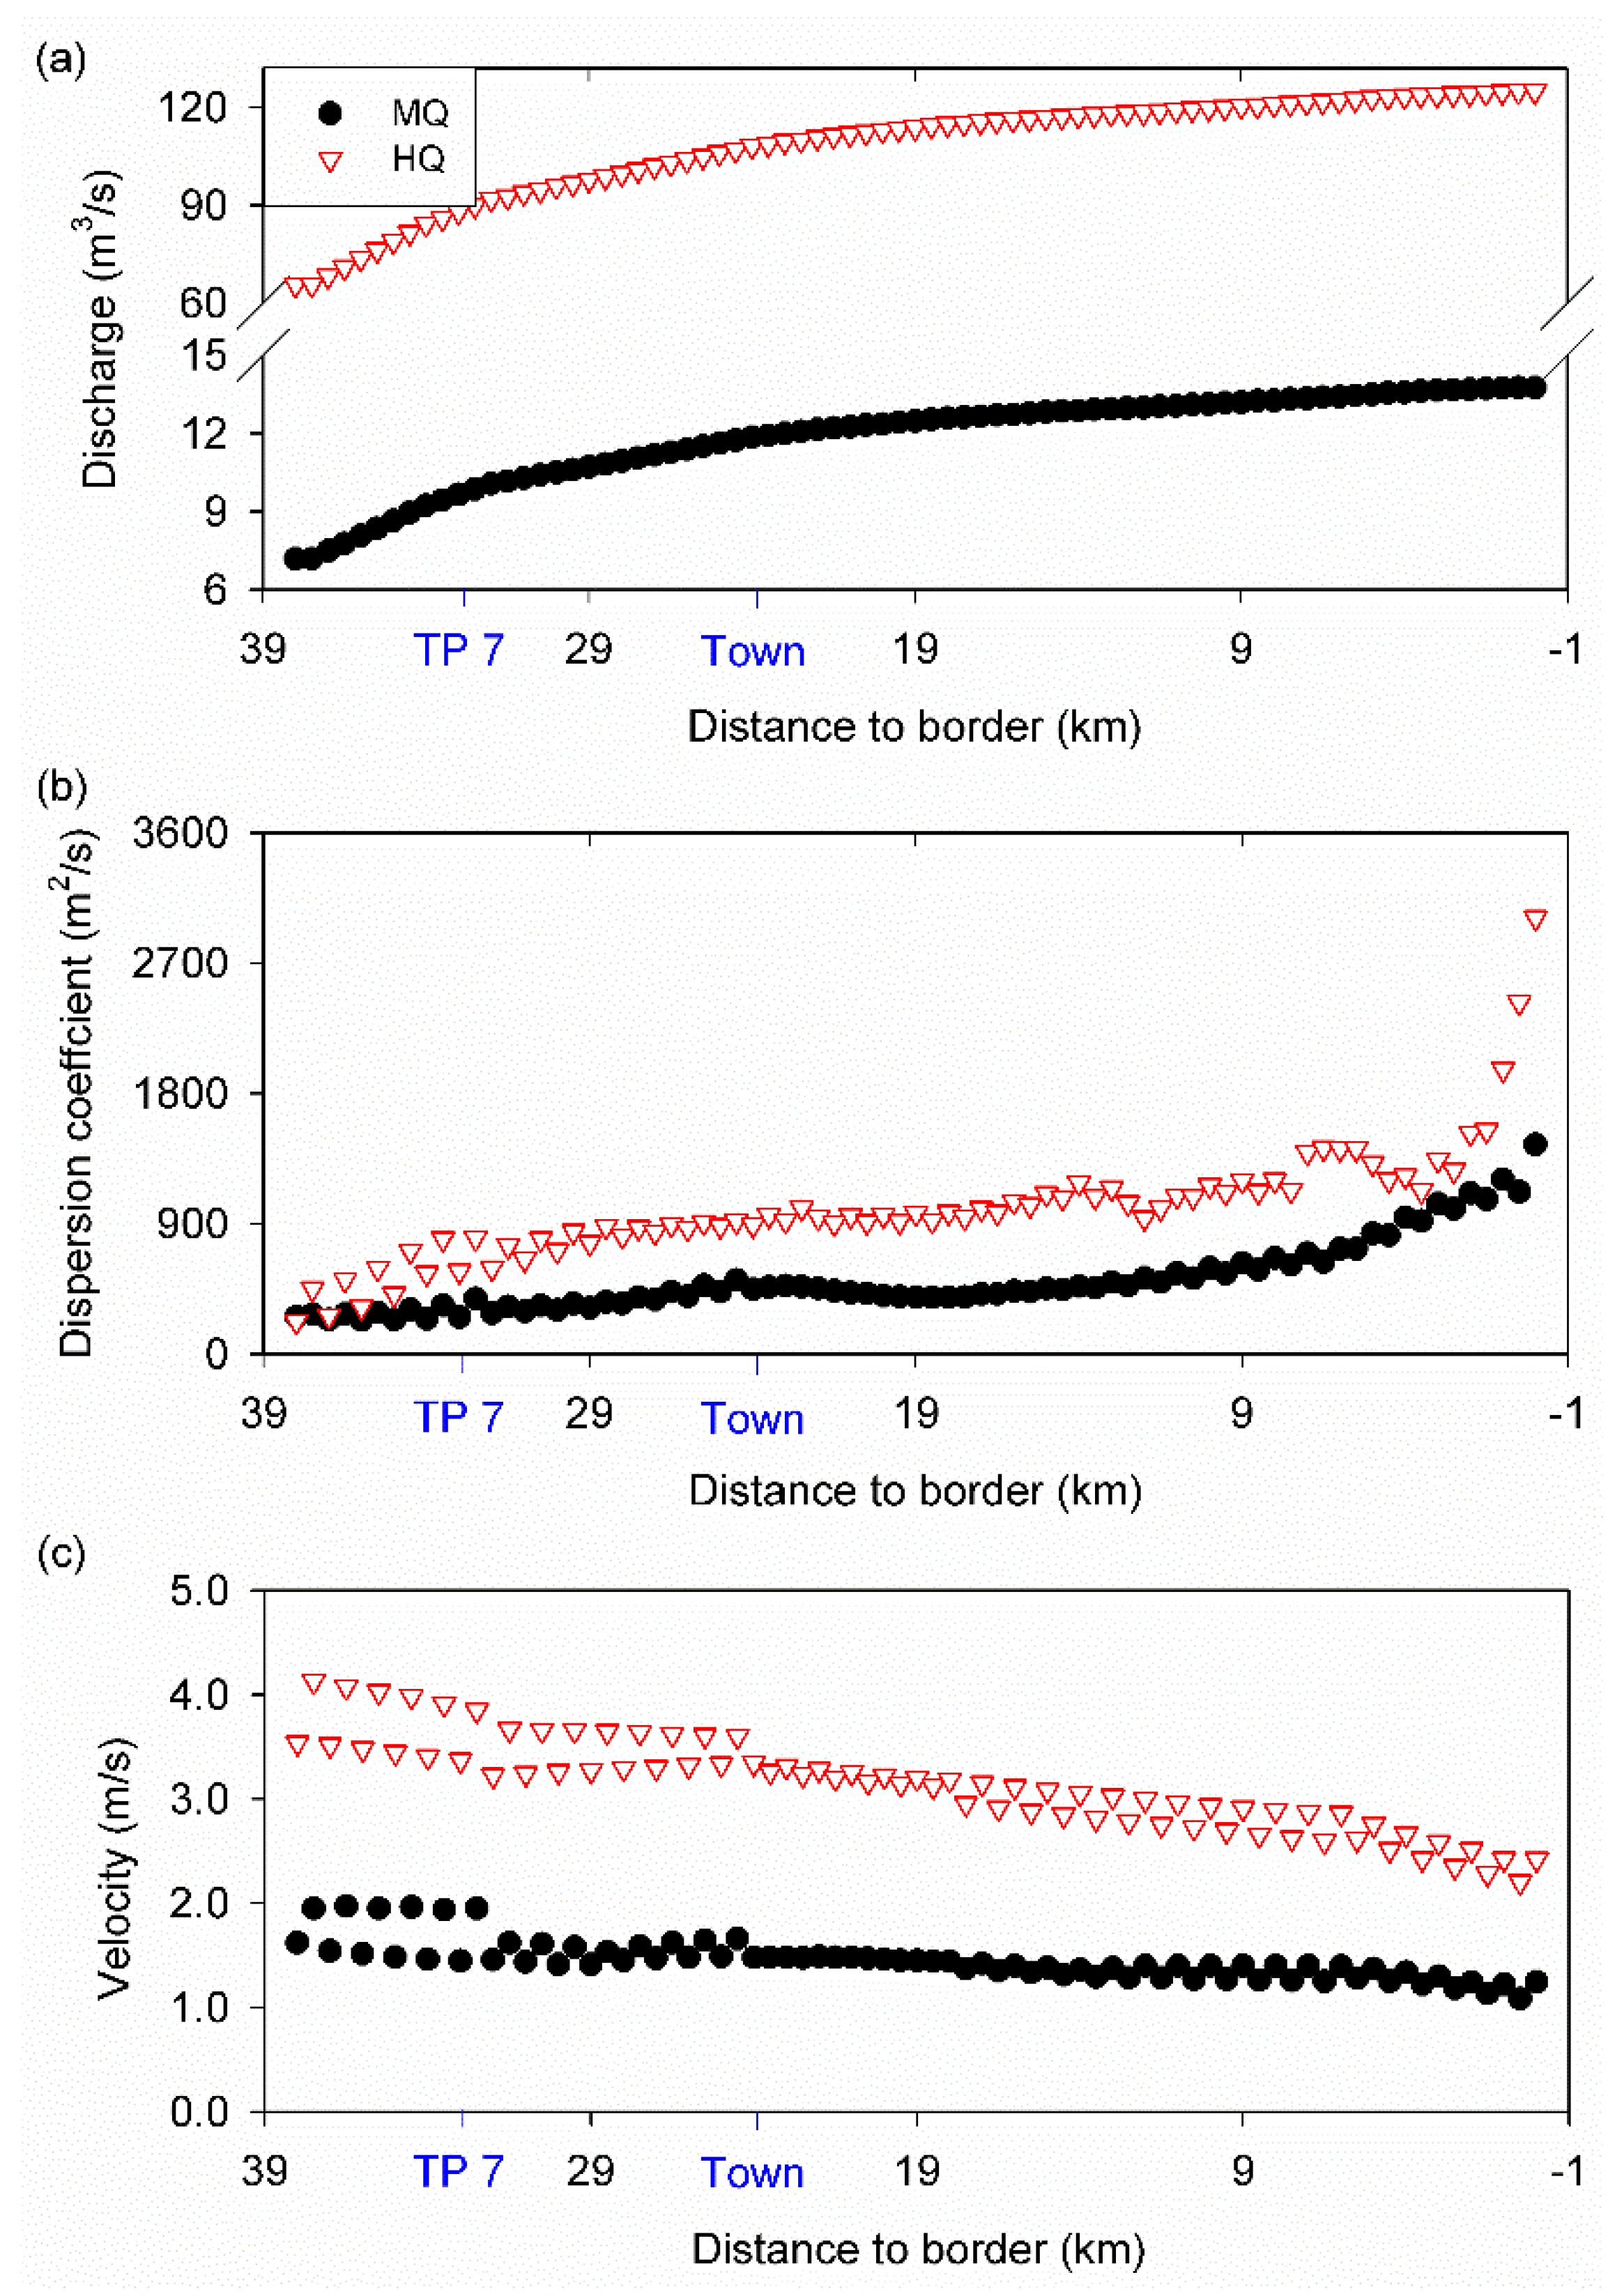
The pattern of discharge increased smoothly from upstream to downstream (Figure 6a). The calibration of the transport model could not be performed due to the missing of concentrations of TSS and Pb-210 measured on the spot after a landslide. Instead, the dispersion coefficient and flow velocity were used to check the quality of the developed hydrological model. Overall, both variables were higher under HQ than under MQ scenarios (Figure 6b). The dispersion coefficient increased along the longitudinal gradient of the Mailuu-Suu river under both hydrological scenarios. A strong increase in the downstream section was observed under both hydrological scenarios with a clearer increase pattern under the HQ scenario (Figure 6b). The flow velocity was generally higher in the upper river sections than the lower river sections, and the decreasing pattern was clearer under HQ than under MQ scenarios (Figure 6c). Such patterns are in line with the measured spatial pattern of slope (Table 2), indicating a good quality of hydrological simulations.

3.4. Spatial and Temporal Patterns of Mass Transport

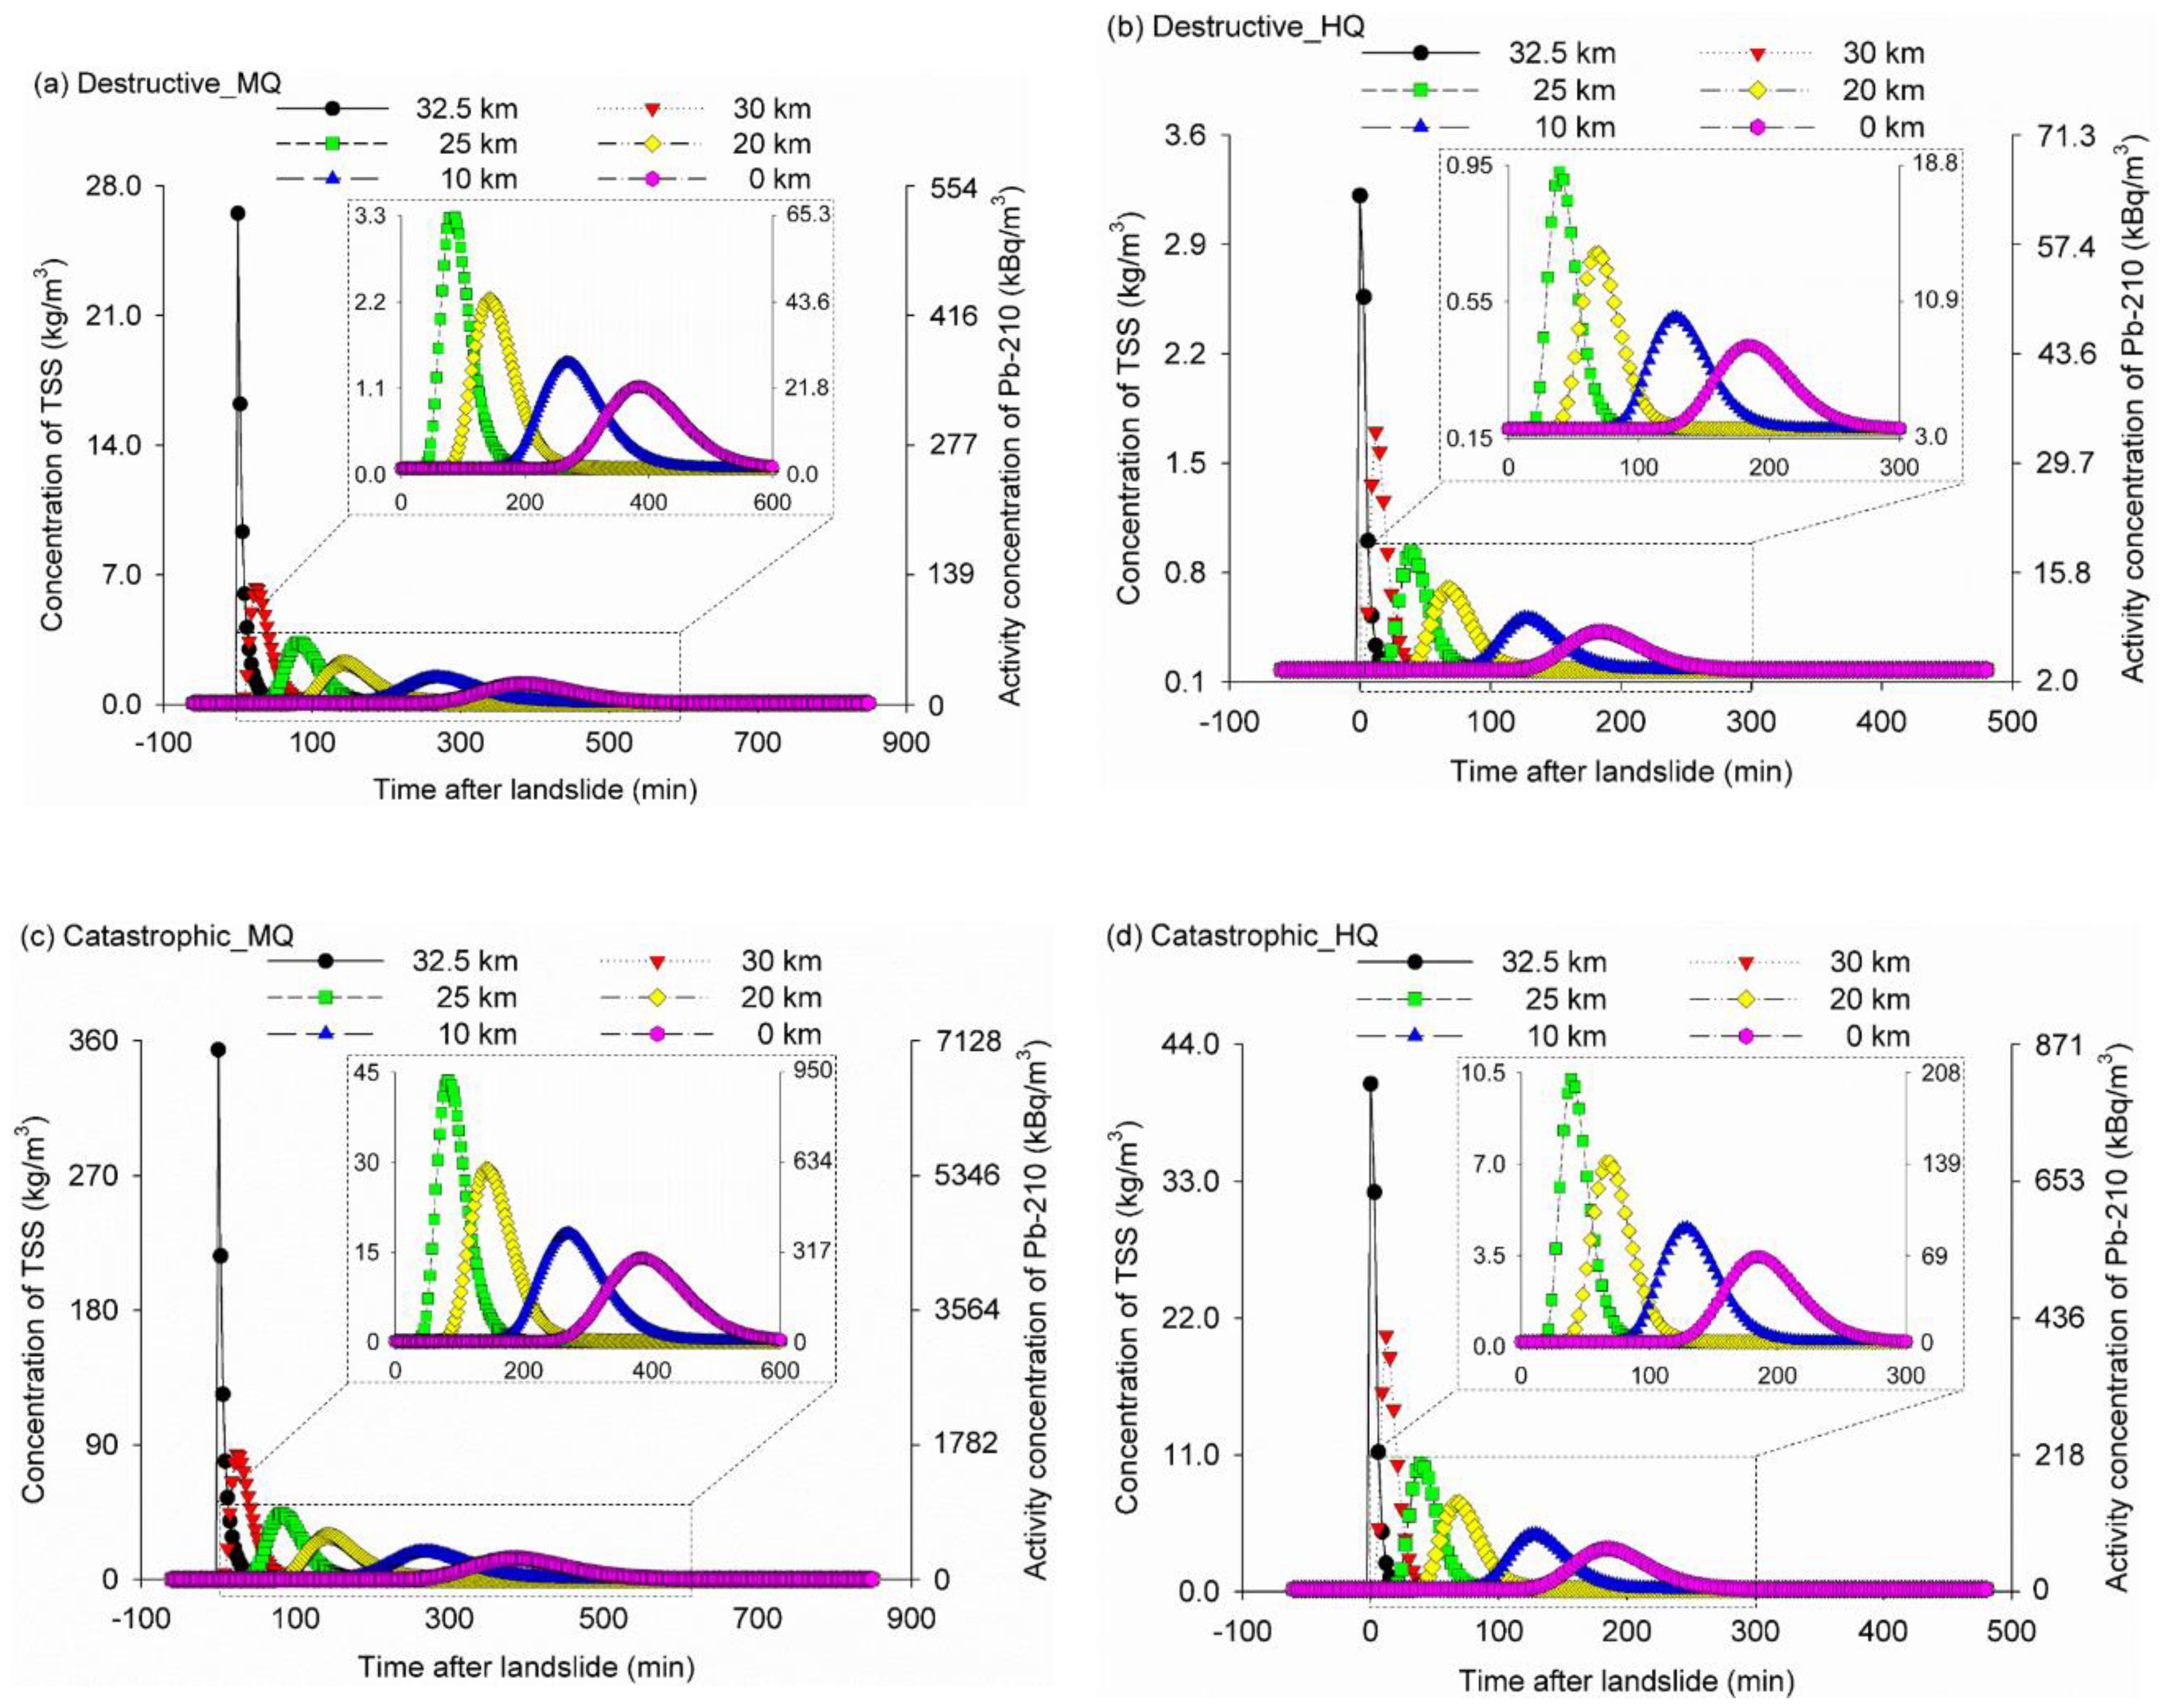
The general spatial-temporal patterns of radionuclides were similar but with different amplitudes (Figure 7 and Figure 8). The radionuclides move together along the longitudinal gradient of river networks, and both concentrations were higher under MQ than under HQ scenarios. The concentrations increased dramatically at the river section of 32.5 km (directly downstream the location of TP 7) and reached the highest concentration just after the destructive earthquake-induced landslides, but it took about 261 and 78 min until TSS passed through (i.e., the concentration of TSS receded to the background level) this river section under MQ and HQ scenarios, respectively (Figure 7a,b); whereas it took longer (about 291 and 90 min) until TSS passed through the section at 32.5 km under the catastrophic earthquake-induced landslides (Figure 7c,d). Furthermore, the peak value of the concentration decreased along the longitudinal gradient of river networks, with the concentration curves becoming flat and wide at the downstream sections (Figure 7).
As expected, the mass transport was faster under HQ than under MQ scenarios (Figure 8). After the destructive earthquake-induced landslides, the radioactive materials could arrive at the border within 165 min with the peak value after 384 min under the MQ scenario; all tailings materials could completely pass the border after 1044 min of the release of landslide mass; whereas under the HQ scenario, it took only 87 min to arrive at the border with the peak value after 183 min, and the complete pass took only 438 min (Table 4).
The variation of transport speed of the peak value along the longitudinal gradient of the Mailuu-Suu river was calculated. Under the MQ scenario, the transport speed of the peak value reduced from 83.3 m/min (between 0 and 30 min) to 79.2 m/min (between 240 and 360 min) under both earthquake scenarios (Figure 8a,c). A similar pattern was observed under the HQ scenario; namely, the transport speed reduced from 183.3 m/min (between 0 and 30 min) to 166.7 m/min (between 150 and 180 min) under both earthquake scenarios (Figure 8b,d).
The comparison between destructive and catastrophic scenarios showed that the tailings materials arrived at the border earlier under catastrophic than under destructive scenarios by 6 min (MQ) and 3 min (HQ), whereas it took longer under catastrophic than under destructive scenarios by 72 min (MQ) and 33 min (HQ) until all tailings materials completely passed the border (Table 4). However, the duration of the peak value remained the same, both were 384 min (MQ) and 183 min (HQ) (Table 4). The schematic movements of TSS and Pb-210 along dendritic river networks across a time series were shown in Figure 9.

4. Discussion

Based on the information extracted from satellite imagery, mass transports of radionuclides after potential earthquake-induced landslides were simulated using the seismic Scoops3D and the one-dimensional ADE models in the Mailuu-Suu catchment [37], where a large number of radioactive tailings ponds exists in the downstream areas, and which pose relatively lower landslide vulnerability than the upstream areas. The simulations made in this study can undoubtedly improve the understanding of the potential endangered areas and the transport speed of radionuclides after natural hazards. Nevertheless, there are also shortcomings of the present simulations, and measures to improve such simulations are discussed in Section 4.3. We are also aware that data obtained from in situ samplings were equally important for the preparation of such simulations.

4.1. Landslide Susceptibility

Owing to the specificity of geologic and natural conditions, the Mailuu-Suu catchment is a region with frequent high seismic and geodynamic activities. By means of the Scoops3D earthquake simulation model, we estimated the landslide susceptibility variability that refers to the spatial probability of landslide occurrence [53,54], under different seismic scenarios and found that the unstable slopes under effects of seismic shaking were mostly located in the upstream areas (Figure 4), and this confirmed our first hypothesis (i.e., the areas vulnerable to seismic events were expected to be predominantly located in the upstream areas of the Mailuu-Suu catchment). In contrast, Torgoev et al. [2] reported that landslide processes most frequently (at about 98%) occurred in a mid-stream of the Mailuu-Suu river. The possible reason for the different findings lies in the involved parameters. Besides the detailed soil parameter, the Scoops3D model considers also the topography of the entire catchment and the influence of groundwater on landslides [22]. Concerning the mass of landslides, we found that only 0.29% of tailings materials in TP 7 would be transported into the river networks after a catastrophic earthquake. In April 1958, however, due to heavy rainfall and a reported earthquake, about 50% of the entire volume of the TP 7 tailings dam flowed into the Mailuu-Suu river, and which included 8 tons of uranium and several tens of grams of radium. Such difference in volume could be explained by (1) the mining and processing plants were still operational in 1958; (2) the poor design of the tailings dam in 1958, and this design was improved afterward; and (3) the combined effects of natural hazards (i.e., heavy rainfall and earthquakes) [4,8]. The waste after the event in 1958 spread about 40 km downstream across the national border into Uzbekistan then into the heavily populated Fergana Valley. Unfortunately, such an event could not be prevented in this seismic area.
The entire area affected by landslides covered an estimated 6.4 km2 with the total mass of landslide up to 260 million m3 over 1950 and 2005 [2]. By means of Scoops3D earthquake simulation, it was expected that 131 m3 and 1761 m3 of the tailings from TP 7 would flow into the river network under the destructive and catastrophic earthquake scenarios, respectively (it supports the second hypothesis, namely, the mass of earthquake-induced landslides was expected to increase dramatically with the increase of earthquake levels). The question of considering inert (unpolluted, non-tailings) material also released into the river during a seismic or landslide event and the practical implication for a radioactivity monitoring program is discussed in Section 4.2 below. This amount of landslide may seem small, but one has to bear in mind that this amount could increase dramatically with the increase of the magnitude of an earthquake, and a single huge earthquake event can trigger unbelievable mass transports [14,55,56]. Although it is difficult to compare the results of a single tailings pond with the entire catchment, the simulated outcomes with the state-of-the-art model are valuable, as the landslide susceptibility maps indicate potential areas that pose a direct danger to the residents, infrastructure, as well as radioactive waste tailings [6]. We are aware that we could not validate the developed landslide susceptibility model due to the lack of site-specific surveys at TP 7. Furthermore, the study scale was constrained to a single region. Using these model input data may neglect local stability conditions at the study site. The applicability of the obtained results are therefore limited, and more site-specific survey and stability assessment at TP 7 should be considered in the follow-up studies.

4.2. Mass Transport of Radionuclides

More seriously, the landslides in the Mailuu-Suu catchment involve a former mining area with high specific activities of natural radionuclides. Besides radioactive contamination of the landslide itself, the run-out or generated impulse wave may further cause damage to nearby houses, infrastructure, or pasture land [24,57]. It was demonstrated that the landslide could cause considerable change in water quality with large increases in the concentration of suspended solids and toxic elements [33,39,58]. Therefore, the instantaneous release of Pb-210 that is associated with the release of the suspended sediment was studied in this paper.
The longitudinal dispersion of solute contamination is commonly difficult to determine because it depends on various variables and their nonlinear inter-relationships [52]. Based on the measured geometric values, we found a negative correlation between the dispersion coefficient and stream velocity. This is opposite to the correlation reported by Khaled et al. [59]. However, besides the flow regime, other important variables such as roughness (i.e., the composition of vegetation and substrate), lateral inflow from the tributaries, and geography (e.g., slope, depth, and width) are also considerably important [38,39,60]. Furthermore, the special geography of Mailuu-Suu, namely, on the one hand, a narrow downstream with limited lateral inflow but broad channel width can significantly reduce the stream velocity, on the other hand, the downstream is relatively more flat in comparison to the upstream, causing a decreased slope and shear velocity, and the shear velocity is negatively related to the dispersion coefficient.
However, as it was pointed out above, the activity load that is transported in the river following a sudden release of tailings material is dominated by radionuclides attached to particulates. In fact, during seismic events and landslide activation, the overall concentration of suspended solids is likely to increase significantly. The total load of particulates transported by the river is then a combination of unpolluted solids and a fraction of radioactive tailings. For the sake of conceptual simplicity of the model presented in this paper, only the contribution of tailings released in a disruptive event is considered. If other sources of suspended solids were taken into account, the resulting TSS would, in first approximation, be a superposition of the model results obtained here, and an additional contribution of unpolluted materials also mobilized. This consideration is important to bear in mind when applying the model results to the planning and interpretation of radiation monitoring campaigns after a suspected release of tailings material (which was actually the primary reason for the model development). A monitoring program intending to determine the degree of radioactive pollution transported downstream from a uranium mining or legacy site upstream must be able to detect and quantify an increase of the specific activity of suspended solids. It has been shown in Kunze and Hummrich [41] that the release of radioactive tailings from a legacy site can be detected using the radiochemical methods developed within the TRANSPOND project. The contrast between the specific activity of the natural background TSS and the additional specific activity of radionuclides such as Pb-210 resulting from the release of tailings is significant, as can be seen from Figure 7 and Figure 8. However, if the peak caused by radioactive tailings is “diluted” by more unpolluted material that is also transported in the river, it may become increasingly difficult to determine the additional load of radioactivity. Their transport behavior was considered for different seismic and hydraulic scenarios in Section 3.4 above. Therefore, in order to describe the landslide-induced transport of radionuclides in the river, the concentration of TSS is multiplied by the specific activity of tailings material for the nuclide in question.
From a practical environmental monitoring perspective, an important conclusion from this study is the fact that the delay between a disruptive event when tailings material is released, and the moment the peak concentration of contaminated material reaches the Kyrgyz-Uzbek border, is long enough to mobilize teams to take water samples. The suspended solids in the water samples can then be rapidly analyzed to determine the specific activity. If uranium processing tailings have been released in significant quantities, the specific activity of the suspended solids reaches a peak height that is well measurable against the natural background. Peak delay and peak height do depend on the flow conditions of the river but are in the same order of magnitude under MQ and HQ conditions. This allows the neighboring countries to base their decisions on mitigation or clean-up measures on reliable and mutually accepted data, thus meeting one of the overarching objectives of the research project [41].
It is apparent that the fine particles from the tailings can travel long distances in this mountainous river [12,33,35]. However, the reduced stream velocity along the longitudinal river networks could slow down the transport speed of the tailings materials, and this was supported by our simulations and could prove the third hypothesis (i.e., the transport speed of the radionuclides would decrease along the river networks). However, the finding of the present study is not in line with Paul and Hall [61], as they found that the transport speed of fine particles increased with stream size along the Hubbard Brook in North America. Nevertheless, Paul and Hall [61] also agreed that the particle transport distance primarily depends upon the stream velocity.
As the required time duration to arrive at the border differed among scenarios, the simulated results could only be compared with scenarios in the literature in which similar tailings mass was mobilized under similar hydrological conditions. Kalka et al. [42] simulated the transport of radionuclides of TP 7 under the MQ scenario (13.3 m3/s during 2009 and 2015) and found the required time duration to arrive at the border ranged between 148 and 167 min. This range is in line with our findings, namely 159 min under catastrophic earthquake and MQ scenarios, respectively. Similarly, Kirsch [62] simulated the transport speed of the water at the river section nearby TP 7 along the Mailuu-Suu river network and reported the required time duration to arrive at the border was about 213 min. This simulated time of arrival is somehow longer than our simulation (165 min) under destructive earthquake and MQ scenarios. The difference can be explained by different modeling approaches and different geological and hydrological settings. In detail, (1) the study of Kirsch focused on the simulation of flooding in the Mailuu-Suu catchment and modeled the transport speed of water after a normal rainfall event and (2) instead of satellite imageries, the study of Kirsch used the DEM to create the geometric profile for the entire catchment, and this can reduce the precision of the developed geometric patterns.
Interestingly, the difference in time durations between the leading edge (or the time of arrival, of 87 min under destructive earthquake and HQ scenarios) and peak value (183 min) was shorter than that between the trailing edge (or the time point of the complete pass, 438 min) and peak value (183 min), indicating that the concentration recedes much slower than it rises. Instead of a normal distribution, such patterns cause a long tail of decreasing concentration. A similar finding has been reported in the high mountain region of the Central Nepalese Himalaya by Ries [63], where the concentration of the suspended sediment increased just after the landslides, but it took about three days for the sediment pulse to pass one of their gauging stations. During this period, the suspended sediment increased by three orders of magnitude in this Central Nepalese Himalaya region, and was in the range of our simulations, namely the peak values were 320 (destructive earthquake) and 4274 times (catastrophic earthquake) higher than the background concentration under the MQ scenario.

4.3. Shortcomings of the Simulations

Similar to most studies related to the simulation of mass transport, some limitations are inherent to the present approach. First, the total content of the contaminants in the tailings ponds, and the release rate were calculated either based on only several representative samples or remained unknown and could not be precisely quantified.
Second, the sediment transport can be carried through the water channel without deposition, and this depends not only upon sediment concentration but also upon the grain size distribution and the prevailing bed slope [6]. To simplify the simulation, it was assumed a uniform grain size and all sediments could be transported through the river network. However, this question should be further studied to obtain a grain size distribution and establish a functional dependency between transport capacity and grain size [64].
Third, a landslide can push a tailing partially or fully into the Mailuu-Suu river. As TP 7 is located along the Mailuu-Suu river, it was assumed that the entire landslide-induced mass (i.e., 0.02% and 0.29% under destructive and catastrophic earthquake scenarios) would be transported along the river network. Nevertheless, the estimated release of the entire landslide-induced mass (i.e., 0.02% and 0.29% under destructive and catastrophic earthquake scenarios, respectively) might be overestimated because a part of landslide-induced mass might not fall into the river channel. Instead, it might distribute along the river banks. Consequently, this potential overestimation might influence the applicability of the simulated results, e.g., it might increase the transport speed of the tailings materials along the river network, as it was shown in the different transport speed between the destructive (with a small landslide-induced mass) and catastrophic (with a large landslide-induced mass) earthquake scenarios. Therefore, further studies should be carried out in the context of landslide activation processes and quantification of the exact mass of landslide which can finally reach the river channel.
Fourth, as the amount of tailings materials that are proposed to be flushed into the river network is large, it may lead to ponding. The combined release of tailings and additional landslide material from the hinterland in case of a seismic event may result in a long period of material accumulation, and depending on the scenario, this may take up to several days [17].
Fifth, two special flow assumptions were used in this study, namely (1) the discharge value in the flooding month was used to substitute the HQ scenario and (2) the landslide mass falling in the river is assumed to not modify the flow-rate; this could lead to an underestimation of the amount of flow in the river network. Therefore, in the follow-up studies, one sampling campaign under the actual HQ scenario can undoubtedly improve the precision of the simulation, and in the meanwhile, the modified flow-rate should be considered after the landslide mass falling in the river.
Last but not least, a calibration between the simulated and measured concentration of TSS could not be performed due to the lack of monitoring data after a landslide in this remote area. However, the installation of a turbidity monitoring system is currently being investigated [65], which would allow calibration in the follow-up studies.

5. Conclusions

Central Asia is one of the most challenging places in the world where various natural hazards can heavily impact people and infrastructure. More seriously, a large number of radioactive and toxic mining waste sites in Mailuu-Suu and other areas of Central Asia are located in the zone that may be affected by hazardous geological processes such as earthquakes, landslides, avalanches, and mudflows. It is clear that an understanding of pollutant transport coupled with earthquake and advection-dispersion equation modeling is essential in dealing with such pollution events. These simulation models could be used to systematically produce water quality predictions under different geological and hydrological scenarios within a short period of time. The simulation results can be further used to assist decision makers to prepare adequate mitigation and clean-up measures. Furthermore, the use of satellite imagery can save human resources for the in situ measurement of the landscape and geometric profiles intensively, and this approach shall be therefore recommended for the simulations in remote areas, particularly in countries that are less endowed with financial resources.
This study concluded that landslides associated with radioactive tailings in Central Asia might release a significant amount of pollutants with a relatively fast transport along river networks. In comparison to the catastrophic earthquake, the release of radioactive tailings is found to be less under the destructive earthquake. Nevertheless, even the transport of small tailings masses may significantly affect the overall water quality, both in terms of chemical and physical properties. Further studies are therefore needed to calibrate the developed models and increase the precision of the simulations. This also indicates that landslides are a possible source of water pollution in seismic areas and shall be considered in the follow-up risk analysis for landslide hazard, possible environmental consequences in the near and far field, in a short- and long-term perspective, as well as for contaminated land and water quality management along transboundary rivers. Last but not least, the presented methodology represents an approach that might be applicable in other areas where (a) it is difficult to reach due to the terrain or the lacking of traffic infrastructure or (b) there is poor scientific-technical equipment regarding the measurement technology in the study areas.

Author Contributions

Conceptualization, F.L., C.K., and P.S.; methodology, F.L.; software, F.L.; validation, F.L.; formal analysis, F.L.; investigation, F.L., C.K., and P.S.; resources, F.L., C.K., P.S., I.T., D.Z., M.L., B.T. and A.B.; data curation, F.L., C.K., and P.S.; writing—original draft preparation, F.L.; writing—review and editing, C.K., P.S., I.T., D.Z., M.L., B.T. and A.B.; visualization, F.L.; supervision, C.K. and P.S.; project administration, C.K. and P.S.; funding acquisition, C.K. and P.S. All authors have read and agreed to the published version of the manuscript.

Funding

This research was funded by the Federal Ministry of Education and Research of Germany (BMBF), grant numbers 03G0879A and 03G0879C.

Data Availability Statement

Not applicable.

Acknowledgments

We sincerely thank all the contributors to the data collections. We kindly recognize the valuable comments of the anonymous reviewers that have helped to improve the quality of this work.

Conflicts of Interest

The authors declare no conflict of interest.

References

  1. Salbu, B. Assessment of the radiological impact of gamma and radon dose rates at former U mining sites in Central Asia. J. Environ. Radioact. 2013, 123, 3–13. [Google Scholar]
  2. Torgoev, I.A.; Aleshin, Y.G.; Ashirov, G.E. Environmental Effects of Possible Landslide Catastrophes in the Areas of Radioactive Waste Warehousing in Kyrgyzstan (Central Asia). 2008, pp. 320–323. Available online: http://www.un-spider.org/sites/default/files/2-Landslide_Impacts_%28Institute%20of%20Physics%20of%20Kyrgyzstan%29.pdf (accessed on 24 November 2019).
  3. Kunze, C.; Walter, U.; Wagner, F.; Schmidt, P.; Barnekow, U.; Gruber, A. Environmental impact and remediation of uranium tailings and waste rock dumps at Mailuu Suu (Kyrgyzstan). In Proceedings of the International Conference on Mine Closure and Environmental Remediation, Gera, Germany, 10–12 September 2007; pp. 10–12. [Google Scholar]
  4. Torgoev, I.A.; Aleshin, Y.G.; Meleshko, A.V.; Havenith, H.B. Hazard mitigation for landslide dams in Mailuu-Suu valley (Kyrgyzstan). Ital. J. Eng. Geol. Environ. 2006, 99–102. [Google Scholar]
  5. Saponaro, A.; Pilz, M.; Bindi, D.; Parolai, S. The contribution of EMCA to landslide susceptibility mapping in Central Asia. Ann. Geophys. 2015, 58, S0113. [Google Scholar]
  6. Havenith, H.B.; Torgoev, I.; Meleshko, A.; Alioshin, Y.; Torgoev, A.; Danneels, G. Landslides in the Mailuu-Suu Valley, Kyrgyzstan-hazards and impacts. Landslides 2006, 3, 137–147. [Google Scholar] [CrossRef]
  7. Havenith, H.-B.; Umaraliev, R.; Schlögel, R.; Torgoev, I. Past and Potential Future Socioeconomic Impacts of Environmental Hazards in Kyrgyzstan. In Kyrgyzstan: Political, Economic and Social Issues Edition: Central Asia: Economic and Political Issues; Perry, O.A., Ed.; NOVA Science Publishers: New York, NY, USA, 2017; pp. 63–113. [Google Scholar]
  8. Saponaro, A.; Pilz, M.; Wieland, M.; Bindi, D.; Moldobekov, B.; Parolai, S. Landslide susceptibility analysis in data-scarce regions: The case of Kyrgyzstan. Bull. Eng. Geol. Environ. 2014, 74, 1117–1136. [Google Scholar] [CrossRef] [Green Version]
  9. Piroton, V.; Schlögel, R.; Barbier, C.; Havenith, H.-B. Monitoring the recent activity of landslides in the Mailuu-Suu Valley (Kyrgyzstan) using radar and optical remote sensing techniques. Geoscience 2020, 10, 164. [Google Scholar] [CrossRef]
  10. Marc, O.; Hovius, N.; Meunier, P.; Gorum, T.; Uchida, T. A seismologically consistent expression for the total area and volume of earthquake-triggered landsliding. J. Geophys. Res. Earth Surf. 2016, 121, 640–663. [Google Scholar] [CrossRef] [Green Version]
  11. Xiong, P.; Long, C.; Zhou, H.; Battiston, R.; Zhang, X.; Shen, X. Identification of electromagnetic pre-earthquake perturbations from the DEMETER data by machine learning. Remote Sens. 2020, 12, 3643. [Google Scholar] [CrossRef]
  12. Göransson, G.; Larson, M.; Bendz, D.; Åkesson, M. Mass transport of contaminated soil released into surface water by landslides (Göta River, SW Sweden). Hydrol. Earth Syst. Sci. 2012, 16, 1879–1893. [Google Scholar] [CrossRef] [Green Version]
  13. Chowdhuri, I.; Pal, S.C.; Arabameri, A.; Saha, A.; Chakrabortty, R.; Blaschke, T.; Pradhan, B.; Band, S.S. Implementation of artificial intelligence based ensemble models for gully erosion susceptibility assessment. Remote Sens. 2020, 12, 3620. [Google Scholar] [CrossRef]
  14. Hakim, W.L.; Achmad, A.R.; Lee, C.-W. Land subsidence susceptibility mapping in jakarta using functional and meta-ensemble machine learning algorithm based on time-series InSAR data. Remote Sens. 2020, 12, 3627. [Google Scholar] [CrossRef]
  15. Guerriero, L.; Di Martire, D.; Calcaterra, D.; Francioni, M. Digital image correlation of google earth images for earth’s surface displacement estimation. Remote Sens. 2020, 12, 3518. [Google Scholar] [CrossRef]
  16. Kalantar, B.; Ueda, N.; Al-Najjar, H.A.H.; Halin, A.A. Assessment of convolutional neural network architectures for earthquake-induced building damage detection based on pre- and post-event orthophoto images. Remote Sens. 2020, 12, 3529. [Google Scholar] [CrossRef]
  17. Tang, C.; Tanyas, H.; van Westen, C.J.; Tang, C.; Fan, X.; Jetten, V.G. Analysing post-earthquake mass movement volume dynamics with multi-source DEMs. Eng. Geol. 2019, 248, 89–101. [Google Scholar] [CrossRef]
  18. Ma, C. Comparing and evaluating two physically-based models: OpenLISEM and Scoops3d, for landslide volume prediction. Doctoral Thesis, University of Twente, Enschede, The Netherlands, 2018. [Google Scholar]
  19. Marchesini, I.; Cencetti, C.; De Rosa, P. A preliminary method for the evaluation of the landslides volume at a regional scale. Geoinformatica 2009, 13, 277–289. [Google Scholar] [CrossRef]
  20. Van den Bout, B.; van Asch, T.W.J.; Hu, W.; Tang, C.; Mavrouli, O.; Jetten, V.G.; van Westen, C.J. Towards a model for structured mass movements: The OpenLISEM Hazard model 2.0a. Geosci. Model. Dev. Discuss. 2020, 2020, 1–31. [Google Scholar]
  21. Mergili, M.; Marchesini, I.; Rossi, M.; Guzzetti, F.; Fellin, W. Spatially distributed three-dimensional slope stability modelling in a raster GIS. Geomorphology 2014, 206, 178–195. [Google Scholar] [CrossRef]
  22. Reid, M.E.; Christian, S.B.; Brien, D.L.; Henderson, S.T. Scoops3D—Software to Analyze 3D Slope Stability throughout A Digital Landscape; U.S. Geological Survey: Reston, VA, USA, 2015.
  23. Martin, P.G.; Connor, D.T.; Estrada, N.; El-Turke, A.; Megson-Smith, D.; Jones, C.P.; Kreamer, D.K.; Scott, T.B. Radiological identification of near-surface mineralogical deposits using low-altitude unmanned aerial vehicle. Remote Sens. 2020, 12, 3562. [Google Scholar] [CrossRef]
  24. Hyatt, N.C.; Ojovan, M.I. Special issue: Materials for nuclear waste immobilization. Materials 2019, 12, 3611. [Google Scholar] [CrossRef] [Green Version]
  25. UNECE. UNECE Committee on Environmental Policy: Second Environmental Performance Review of Kyrgyzstan; United Nations Economic Commission for Europe: Geneva, Switzerland, 2009. [Google Scholar]
  26. UNECE. UNECE Committee on Environmental Policy: Second Environmental Performance Review of Uzbekistan; United Nations Economic Commission for Europe: Geneva, Switzerland, 2010. [Google Scholar]
  27. Humphrey, P.; Sevcik, M. Uranium tailings in Central Asia: The case of the Kyrgyz Republic. 2009. Available online: https://www.nti.org/analysis/articles/uranium-tailings-kyrgyz-republic/ (accessed on 18 January 2021).
  28. Zhunussova, T.; Sneve, M.; Liland, A. Radioactive waste management in Central Asia-12034. In Proceedings of the Waste Management 2012 Conference, Phoenix, AZ, USA, 26 February–1 March 2012. [Google Scholar]
  29. Waggitt, P.W. Safe Management of Residues from Former Uranium Mining and Milling Activities in Central Asian IAEA Regional Technical Cooperation Project. In Nuclear Risks in Central Asia; Salbu, B., Skipperud, L., Eds.; Springer: Dordrecht, The Netherlands, 2008; pp. 61–68. [Google Scholar]
  30. UNECE. UNECE Water-Food-Energy-Ecosystem Nexus, Reconciling Different Uses of Water-Work on the Nexus in Transboundary Basins; United Nations Economic Commission for Europe: Geneva, Switzerland, 2014. [Google Scholar]
  31. Sevcik, M. Uranium Tailings in Kyrgyzstan: Catalyst for cooperation and confidence building? Nonprolif. Rev. 2003, 10, 147–154. [Google Scholar] [CrossRef]
  32. Veenema, T.G. Disaster Nursing and Emergency Preparedness for Chemical, Biological, and Radiological Terrorism and Other Hazards; Springer Publishing Company: Berlin, Germany, 2018. [Google Scholar]
  33. Knightes, C.D.; Ambrose, R.B., Jr.; Avant, B.; Han, Y.; Acrey, B.; Bouchard, D.C.; Zepp, R.; Wool, T. Modeling framework for simulating concentrations of solute chemicals, nanoparticles, and solids in surface waters and sediments: WASP8 advanced toxicant module. Environ. Model. Softw. 2019, 111, 444–458. [Google Scholar] [CrossRef]
  34. Halaj, P.; Velísková, Y.; Sokáč, M.; Bárek, V.; Fuska, J. Modeling of contaminant dispersion in streams-1d versus 2d model use comparison: Case study on the Ondava river. J. Int. Sci. Publ. Ecol. Saf. 2014, 8, 393–399. [Google Scholar]
  35. Nistoran, D.G.; Ionescu, C.; Pătru, G.; Armaş, I.; Omrani, Ş.G. One dimensional sediment transport model to assess channel changes along Olteniţa-Călăraşi reach of Danube River, Romania. Energy Procedia 2017, 112, 67–74. [Google Scholar] [CrossRef]
  36. Dasallas, L.; Kim, Y.; An, H. Case study of HEC-RAS 1D–2D coupling simulation: 2002 Baeksan flood event in Korea. Water 2019, 11, 2048. [Google Scholar] [CrossRef] [Green Version]
  37. Brunner, G.W. HEC-RAS River Analysis System (Version 5.0.7); US Army Corps of Engineers, Institute of Water Resources, Hydrologic Engineering Center: Davis, CA, USA, 2016. [Google Scholar]
  38. Mirauda, D.; Vincenzo, A.D.; Pannone, M. Simplified entropic model for the evaluation of suspended load concentration. Water 2018, 10, 378. [Google Scholar] [CrossRef] [Green Version]
  39. Rinas, M.; Fricke, A.; Tränckner, J.; Frischmuth, K.; Koegst, T. Sediment transport in sewage pressure pipes, part ii: 1 D numerical simulation. Water 2020, 12, 282. [Google Scholar] [CrossRef] [Green Version]
  40. Vandenhove, H.; Quarch, H.; Clerc, J.J.; Lejeune, J.M.; Sweeck, L.; Sillen, X.; Mallants, D.; Zeevaert, T. Remediation of Uranium Mining and Milling Tailing in Mailuu-Suu District of Kyrgyzstan. In Final Report in Frame of EC-TACIS Project N° SCRE1/N°38; Belgian Nuclear Research Centre, SCK-CEN: Mol, Belgium, 2003; pp. 1–25. [Google Scholar]
  41. Kunze, C.; Hummrich, H. Final Report of Project No. 03G0879A; Leibniz Information Centre for Science and Technology and University Library: Hanover, Germany, 2020. [Google Scholar]
  42. Kalka, H.; Krause, J.; Richter, C. Radionuclide Transport in Mailuu-Suu River (Kyrgyzstan); UIT GmbH: Dresden, Germany, 2017. [Google Scholar]
  43. Torgoev, A.; Havenith, H.-B. 2D dynamic studies combined with the surface curvature analysis to predict Arias Intensity amplification. J. Seism. 2016, 20, 711–731. [Google Scholar] [CrossRef] [Green Version]
  44. Sherman, S.I.; Jin, M.; Gorbunova, E.A. Recent strong earthquakes and seismotectonics in Central Asia. Geodyn. Tectonophys. 2015, 6, 409–436. [Google Scholar] [CrossRef] [Green Version]
  45. Vandenhove, H.; Sweeck, L.; Mallants, D.; Vanmarcke, H.; Aitkulov, A.; Sadyrov, O.; Savosin, M.; Tolongutov, B.; Mirzachev, M.; Clerc, J.J.; et al. Assessment of radiation exposure in the uranium mining and milling area of Mailuu Suu, Kyrgyzstan. J. Environ. Radioact. 2006, 88, 118–139. [Google Scholar] [CrossRef]
  46. Aleshin, Y.; Torgoev, I. Slope Dynamic Geomorphology of the Mailuu-Suu Area, Aspects of Long-Term Prediction. In Landslide Science for a Safer Geo-Environment; Sassa, K., Ed.; Springer International Publishing: Cham, Switzerland, 2014; pp. 339–343. [Google Scholar]
  47. Torgoev, A. Assessment of landslide hazard in the environmental hotspot areas of the Kyrgyz Tien-Shan: Spatial analysis and Numeric modelling. Ph.D. Thesis, University of Liège, Liège, Belgium, 2016. [Google Scholar]
  48. SAEPBW. Hydraulics of Near-Natural Flowing Waters; Part 1-Fundamentals and empirical hydraulic calculation methods; State Authority for Environmental Protection of Baden-Württemberg, Germany: Karlsruhe, Germany, 2002. [Google Scholar]
  49. Vandenhove, H.; Quarch, H.; Clerc, J.J.; Lejeune, J.M.; Sweeck, L.; Sillen, X.; Mallants, D.; Zeevaert, T. Final Report in Frame of EC-TACIS Project No. SCRE1/No. 38 Remediation of Uranium Mining and Milling Tailing in Mailuu Suu District Kyrgyzstan, R-3721; SCK CEN: Mol, Belgium, 2004. [Google Scholar]
  50. Kunze, C.; Hummrich, H. Mission Report EVT1903640 Agency Mission to Conduct Joint Environmental Sampling Campaigns near Izboskan Uranium Legacy Site in Uzbekistan and Lab Analyses in Tashkent; International Atomic Engery Agency (IAEA): Vienna, Austria, 2020. [Google Scholar]
  51. Passell, H.; Barber, D.; Betsill, D.; Littlefield, A.; Matthews, R.; Mohagheghi, A.; Shanks, S.; Yuldashev, B.; Salikhbaev, U.; Radyuk, R.; et al. The Navruz Project: Transboundary Monitoring for Radionuclides and Metals in Central Asian Rivers Data Report. Available online: https://www.osti.gov/biblio/1342771 (accessed on 13 February 2021).
  52. Velísková, Y.; Halaj, P.; Sokáč, M.; Bárek, V. Pollution spread analysis in the Malá Nitra river by using of 1-D model. Acta Hortic. Reg. 2014, 17, 38–42. [Google Scholar] [CrossRef] [Green Version]
  53. Guzzetti, F.; Reichenbach, P.; Ardizzone, F.; Cardinali, M.; Galli, M. Estimating the quality of landslide susceptibility models. Geomorphology 2006, 81, 166–184. [Google Scholar] [CrossRef]
  54. Reichenbach, P.; Rossi, M.; Malamud, B.D.; Mihir, M.; Guzzetti, F. A review of statistically-based landslide susceptibility models. Earth-Sci. Rev. 2018, 180, 60–91. [Google Scholar] [CrossRef]
  55. Schwab, M.; Rieke-Zapp, D.; Schneider, H.; Liniger, M.; Schlunegger, F. Landsliding and sediment flux in the Central Swiss Alps: A photogrammetric study of the Schimbrig landslide, Entlebuch. Geomorphology 2008, 97, 392–406. [Google Scholar] [CrossRef]
  56. Aristizábal, E.; Martínez-Carvajal, H.; García-Aristizábal, E. Modelling Shallow Landslides Triggered by Rainfall in Tropical and Mountainous Basins. In Advancing Culture of Living with Landslides; Mikoš, M., Casagli, N., Yin, Y., Sassa, K., Eds.; Springer International Publishing: New York, NY, USA, 2017; pp. 207–212. [Google Scholar]
  57. Gariano, S.L.; Guzzetti, F. Landslides in a changing climate. Earth-Sci. Rev. 2016, 162, 227–252. [Google Scholar] [CrossRef] [Green Version]
  58. Conesa-García, C.; Puig-Mengual, C.; Riquelme, A.; Tomás, R.; Martínez-Capel, F.; García-Lorenzo, R.; Pastor, J.L.; Pérez-Cutillas, P.; Cano Gonzalez, M. Combining SfM photogrammetry and terrestrial laser scanning to assess event-scale sediment budgets along a gravel-bed ephemeral stream. Remote Sens. 2020, 12, 3624. [Google Scholar] [CrossRef]
  59. Khaled, G.; Bourouina-Bacha, S.; Sabiri, N.-E.; Tighzert, H.; Kechroud, N.; Bourouina, M. Simplified correlations of axial dispersion coefficient and porosity in a solid-liquid fluidized bed adsorber. Exp. Therm. Fluid Sci. 2017, 88, 317–325. [Google Scholar] [CrossRef]
  60. Peng, H.; Fok, H.S.; Gong, J.; Wang, L. Improving stage–discharge relation in the Mekong River Estuary by remotely sensed long-period ocean tides. Remote Sens. 2020, 12, 3648. [Google Scholar] [CrossRef]
  61. Paul, M.J.; Hall, R.O. Particle transport and transient storage along a stream-size gradient in the Hubbard Brook Experimental Forest. J. N. Am. Benthol. Soc. 2002, 21, 195–205. [Google Scholar] [CrossRef]
  62. Kirsch, C.K.S. Quantitative Hydraulic Dam Failure Analysis and Flood Risk Maps in Mailuu-Suu Catchment Area. Master’s Thesis, Magdeburg-Stendal University of Applied Sciences, Magdeburg, Germany, 2020. [Google Scholar]
  63. Ries, J.B. The landslide in the Surma Khola Valley, high mountain region of the Central Himalaya in Nepal. Phys. Chem. Earth Part B 2000, 25, 51–57. [Google Scholar] [CrossRef]
  64. Ochiere, H.O.; Onyando, J.O.; Kamau, D.N. Simulation of sediment transport in the canal using the Hec-Ras (Hydrologic Engineering Centre-River Analysis System) in an underground canal in Southwest Kano irrigation scheme-Kenya. Int. J. Eng. Sci. Invent. 2015, 4, 15–31. [Google Scholar]
  65. Rosenbaum, L. An Autonomous Wireless Turbidity Sensor Network with On-Site Data Transmission Developed for Distributed Measurements along Rivers. Master’s Thesis, Chemnitz University of Technology, Chemnitz, Germany, 2021. [Google Scholar]
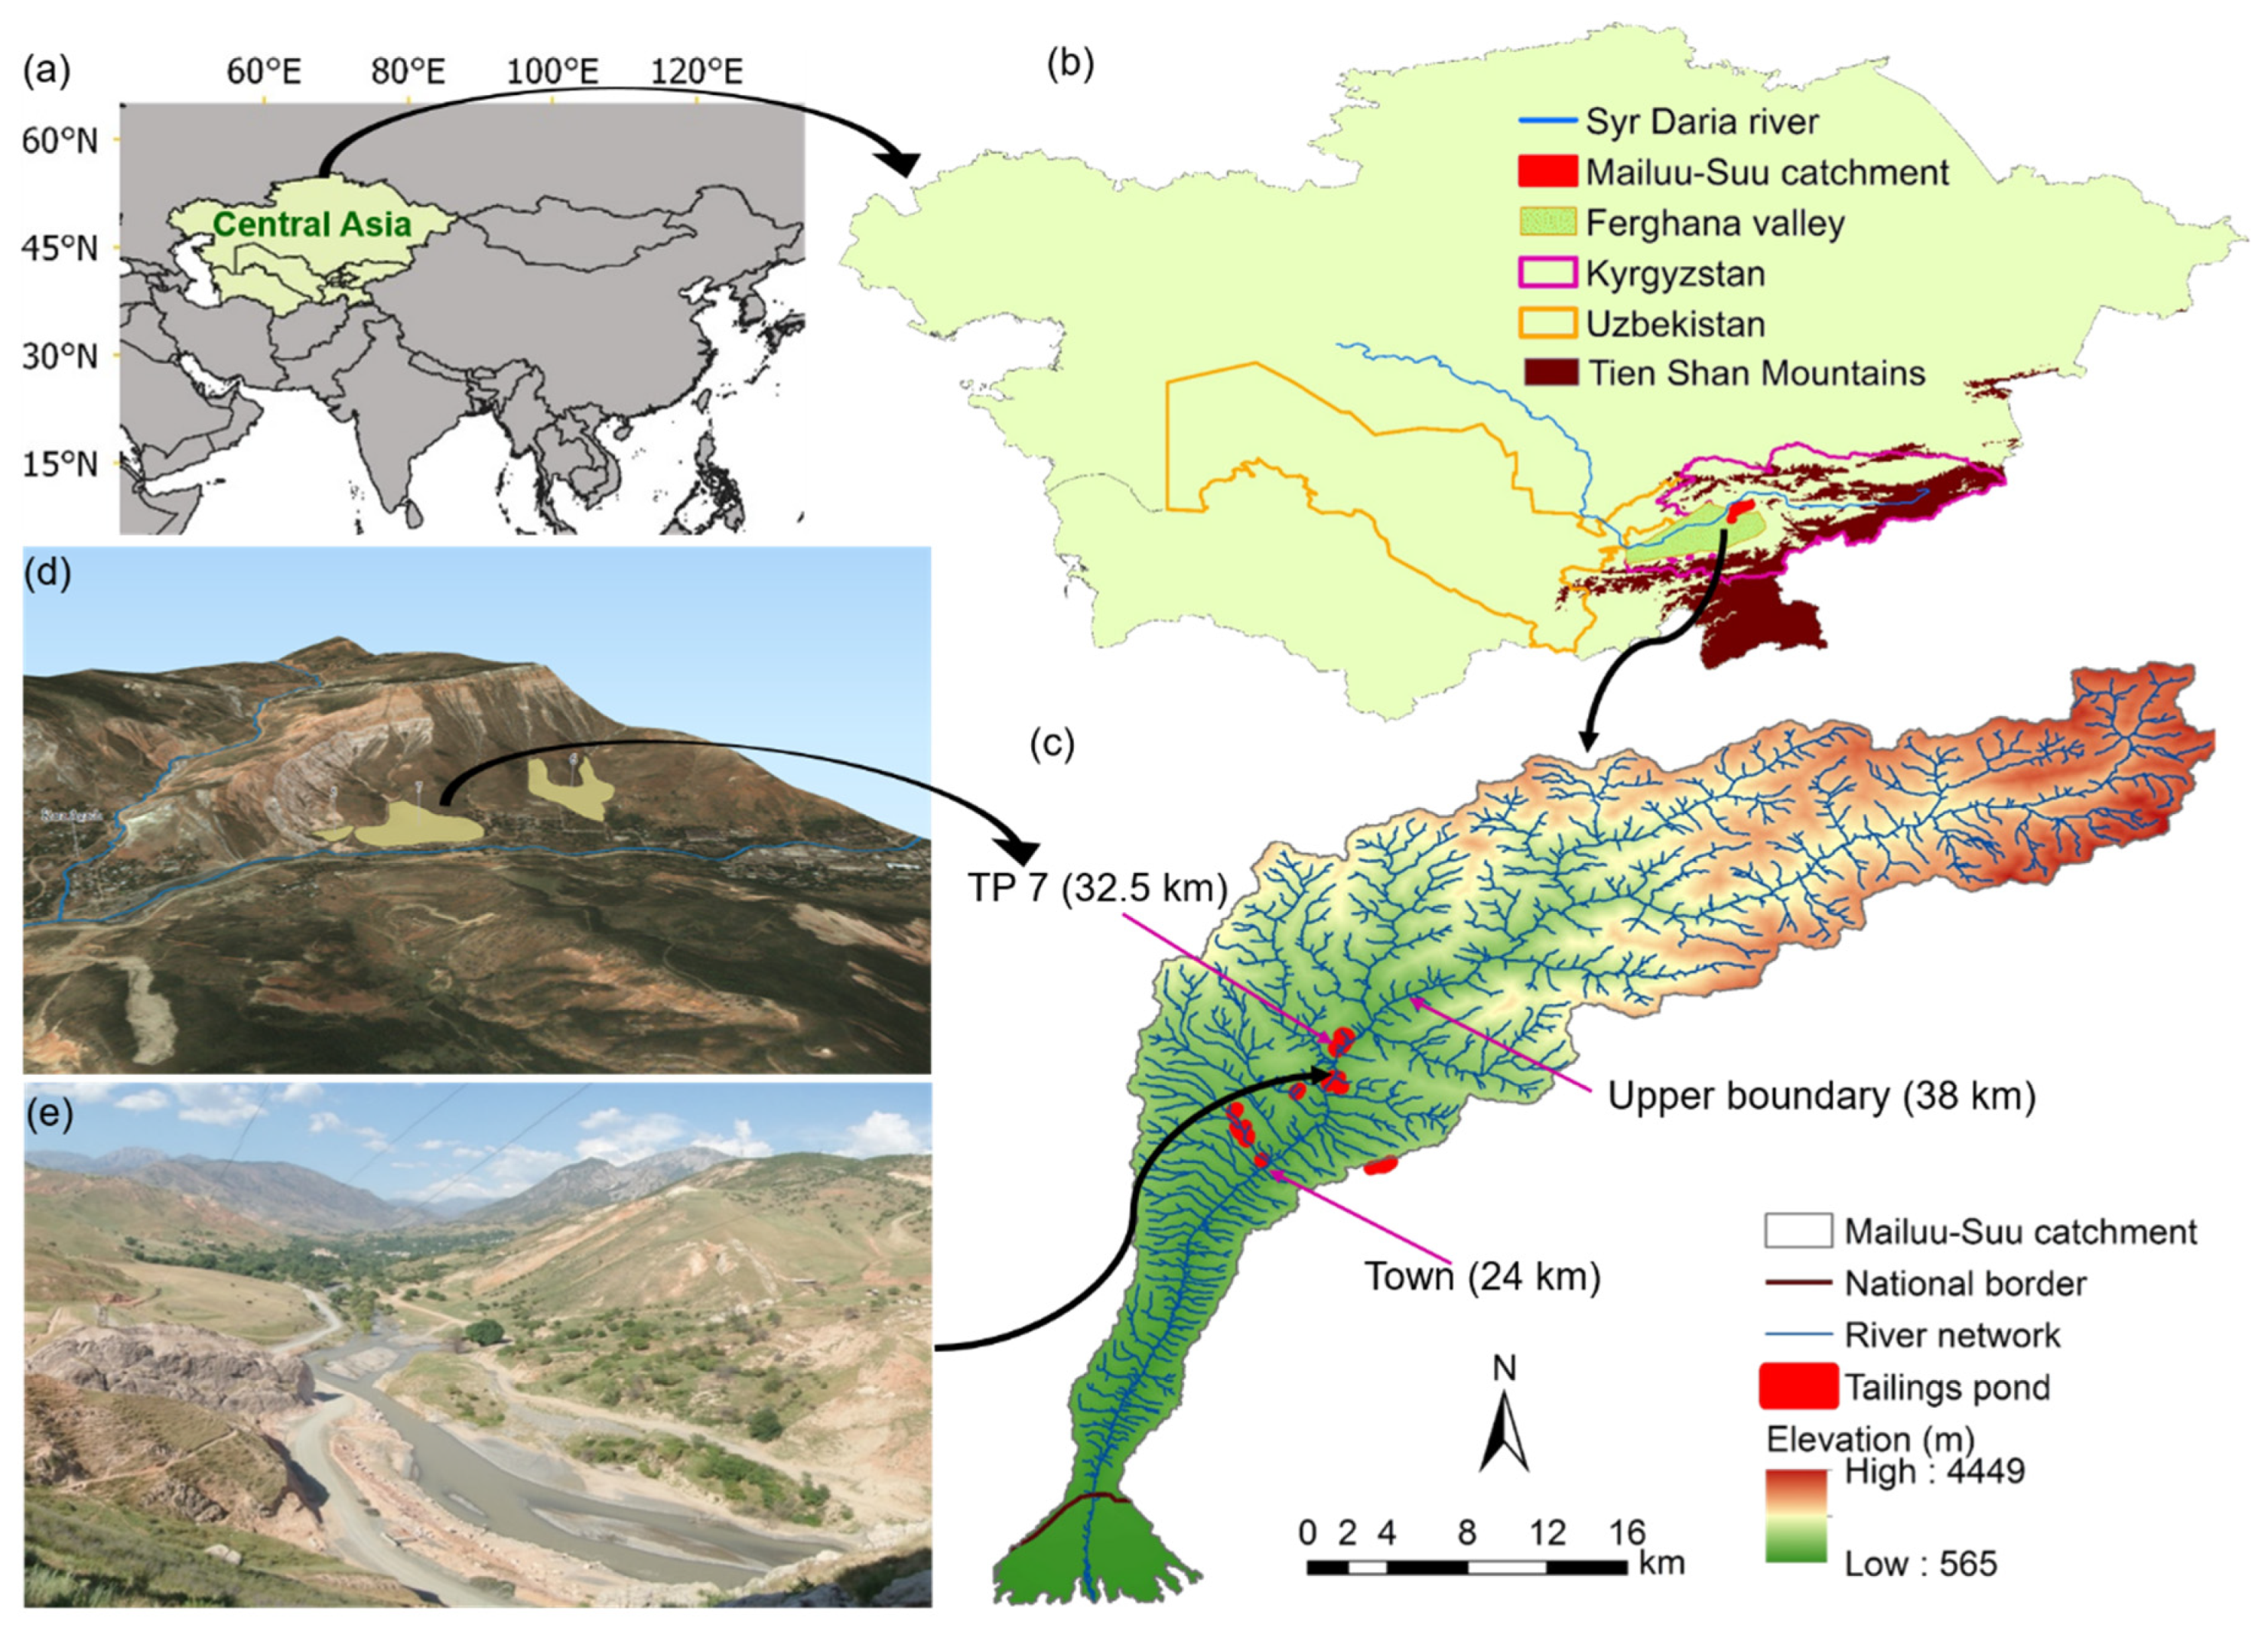
Figure 1. Maps of (a) the locality of Central Asia, (b) the important toponyms in the study area, (c) the distributions of tailings ponds and the town of Mailuu-Suu, (d) topographical view of TP 7 (tailings pond 7) and surrounding slopes, and (e) the typical landscape in the Mailuu-Suu catchment (nearby the river section at 30 km).
Remotesensing 13 00698 g001
Figure 2. Geometric profile of the studied sections of the Mailuu-Suu river based on (a) the measured and (b) the interpolated data. TP 7 refers to the tailings pond 7 in the Mailuu-Suu catchment. The green box indicates the locations of the selected river cross sections within the Mailuu-Suu catchment.
Remotesensing 13 00698 g002
Figure 3. The scheme for the data process and modelling approaches. DEM refers to digital elevation model, MQ refers to mean discharge, HQ refers to the discharge with a 50-year return period, TSS refers to total suspended solids, ADE refers to advection-dispersion equation, TP 7 refers to the tailings pond 7 in the Mailuu-Suu catchment, and HEC-RAS refers to the Hydrologic Engineering Centre, River Analysis System.
Remotesensing 13 00698 g003
Figure 4. Maps of landslide susceptibility index under (a) baseline, (b) destructive, and (c) catastrophic earthquake scenarios in the Mailuu-Suu catchment. TP 7 refers to the tailings pond 7 in the Mailuu-Suu catchment.
Remotesensing 13 00698 g004
Figure 5. Background concentrations of total suspended solids (TSS) in the Mailuu-Suu river under MQ (mean discharge) and HQ scenarios (the discharge with a 50-year return period). The blue dashed lines indicate the averaged background concentrations for the hydrological scenarios.
Remotesensing 13 00698 g005
Figure 6. Distribution patterns of (a) discharge, (b) dispersion coefficient, and (c) flow velocity along the longitudinal gradient of the Mailuu-Suu river under MQ (mean discharge) and HQ scenarios (the discharge with a 50-year return period). TP 7 refers to the tailings pond 7 in the Mailuu-Suu catchment.
Remotesensing 13 00698 g006
Figure 7. Mass transports of total suspended solids (TSS) and activity transport of Pb-210 along six river sections after (a,b) destructive and (c,d) catastrophic earthquake-induced landslides. MQ refers to mean discharge; HQ refers to the discharge with a 50-year return period.
Remotesensing 13 00698 g007
Figure 8. Mass transports of total suspended solids (TSS) and activity transport of Pb-210 at six representative time periods after (a,b) destructive and (c,d) catastrophic earthquake-induced landslides. MQ refers to mean discharge; HQ refers to the discharge with a 50-year return period.
Remotesensing 13 00698 g008
Figure 9. Mass transports of total suspended solids (TSS) and Pb-210 along the Mailuu-Suu river after (a,b) destructive and (c,d) catastrophic earthquake-induced landslides over space and time. MQ refers to mean discharge; HQ refers to the discharge with a 50-year return period.
Remotesensing 13 00698 g009
Table 1. Input parameters of Scoops3D in the Mailuu-Suu catchment.
LayerDepth (m)Cohesion (kPa)Angle of Internal Friction (°)Specific Gravity (kN/m3)Ru Coefficient
L014.011.636.019.20.13
L025.211.332.319.20.10
L034.08.831.020.00.12
L042.040.023.019.10.26
L052.5--21.00.19
L064.316.729.019.60.12
Average3.717.730.319.70.15
Table 2. Input parameters of HEC-RAS in the Mailuu-Suu catchment.
River
Section
Distance (m)Catchment Area (km2)Elevation (m)Slope
(m/m)
Water
Depth (m)
Water
Width (m)
Channel
Width (m)
Roughness (s/m1/3)
Left
Bank
River
Bed
Right
Bank
38 km4000379.51108.40.0170.323.852.30.1000.0330.050
34 km2000486.91039.40.0170.327.560.50.0630.0330.062
32 km4000530.01005.20.0130.429.063.80.0450.0330.068
28 km4000576.6951.50.0120.432.571.50.0480.0330.071
24 km2000624.7903.50.0120.434.375.40.0640.0330.071
22 km4000640.2879.10.0100.437.582.50.0710.0330.071
18 km4000663.3839.30.0100.442.091.00.0670.0330.071
14 km2000678.7798.80.0100.445.0105.00.0630.0330.071
12 km4000684.3779.20.0100.545.0112.00.0610.0330.071
8 km2000697.9738.30.0100.547.0126.00.0560.0330.071
6 km2000705.7719.20.0110.548.0133.00.0540.0330.071
4 km4000713.5697.20.0100.550.0140.00.0520.0330.071
0 km0721.9656.90.0000.551.0156.40.0710.0330.071
Table 3. Monthly flow discharge (m3/s) of the Mailuu-Suu river between 1965 and 2015. The gauge is in the town of Mailuu-Suu.
YearJanFebMarAprMayJunJulAugSepOctNovDec
19652.52.53.58.410.86.44.23.33.25.010.95.5
19692.72.717.334.860.147.523.911.26.48.98.44.3
19802.52.54.824.724.716.78.04.53.63.23.33.4
19852.93.87.031.131.521.310.75.14.14.03.83.7
19862.52.52.89.214.211.78.04.93.64.63.64.3
19873.94.712.234.242.032.122.513.87.58.29.65.9
19886.25.08.124.747.237.517.57.45.34.84.53.5
19893.32.25.111.518.914.39.24.93.23.43.03.0
2009----37.630.016.59.26.44.84.94.0
20103.74.716.038.837.243.722.011.77.24.94.33.9
20113.43.56.017.021.912.56.44.43.84.58.68.0
20124.24.810.037.535.541.515.58.34.84.44.34.3
20134.65.418.525.029.726.08.03.86.25.34.54.4
20143.23.912.531.533.216.08.53.22.93.64.55.1
20155.08.016.538.544.123.011.25.65.07.29.37.7
Average3.64.010.026.232.625.312.86.84.95.15.84.7
Table 4. The required time duration of the mass transport after landslides at three important time points. MQ refers to mean discharge; HQ refers to the discharge with a 50-year return period; difference refers to the difference in required time duration between the destructive and catastrophic earthquake scenarios.
Earthquake
Scenario
Hydrological
Scenario
Arriving at
the Border (min)
Peak
Value (min)
Complete
Pass (min)
DestructiveMQ1653841044
HQ87183438
CatastrophicMQ1593841116
HQ84183471
DifferenceMQ6072
HQ3033
Publisher’s Note: MDPI stays neutral with regard to jurisdictional claims in published maps and institutional affiliations.